 Tianqi Qiu
 Huagui He
- Guangzhou Urban Planning & Design Survey Research Institute, Guangzhou, China
Urban land-use scene classification from high-resolution remote-sensing imagery at high quality and accuracy is of paramount interest for urban planning, government policy-making and urban change detection. In recent years, urban land-use classification has become an ongoing task in areas addressable primarily by remote sensing, and numerous deep learning algorithms have achieved high performance on this task. However, both dataset and methodology problems still exist in the current approaches. Previous studies have relied on limited data sources, resulting in saturated classification results, and they have difficulty achieving comprehensive classification results. The previous methods based on convolutional neural networks (CNNs) focused primarily on model architecture rather than on the hyperparameters. Therefore, to achieve more accurate classification results, in this study, we constructed a new large dataset for urban land-use scene classification. More than thirty thousand remote sensing scene images were collected to create a dataset with balanced class samples that includes both higher intra-class variations and smaller inter-class dissimilarities than do the previously available public datasets. Then, we analysed two possible strategies for exploiting the capabilities of three existing popular CNNs on our datasets: full training and fine tuning. For each strategy, three types of learning rate decay were applied: fixed, exponential and polynomial. The experimental results indicate that fine tuning tends to be the best-performing strategy, and using ResNet-V1-50 and polynomial learning rate decay achieves the best results for the urban land-use scene classification task.
1 Introduction
Urban land-use classification provides information important in urban planning, government policy-making and monitoring of urbanization. Recent developments in computers and remote sensing technology have made substantial progress, resulting in readily available high-quality and high-resolution remote sensing image data that can function as critical sources for land-use classification (Zhang and Zhu, 2011; Qi et al., 2015; Song et al., 2017; Tong et al., 2018). Generally, land-use classification can be divided into single land-cover, category-based, or single object-based classification schemes (Palsson et al., 2012; Ursani et al., 2012; Santos et al., 2013) as well as land-use scene-based classification (Yang and Newsam, 2010). Although scene classification is a more complicated task than classification schemes based on individual categories or objects, it has the advantages of being able to differentiate given land-use scene images into predefined semantically meaningful categories and providing advanced interpretations of remote sensing images. To realize the above advantages, scholars have focused on land-use scene based classification, which is of primary interest in remote-sensing applications such as land resource management, urban development and planning, Earth observation and nature conservation (Yang and Newsam, 2010; Othman et al., 2016; Marmanis et al., 2016; Zhao W. et al., 2017). However, land-use scene categories are, to a large extent, affected by human and social activities. A given land-use scene often covers multiple land-cover classes or ground objects (Zhao L. J. et al., 2017) that carry much potentially useful information. Furthermore, manual classification is not practical and applicable in most cases because people have difficulties in describing the detailed features and providing effective and efficient classifications. Land-use scene classification, especially automated classification, is still a challenge in high-resolution remote sensing images (Weng et al., 2017).
Extensive efforts have been made to develop automated land-use classification methods. Initially, most research works developed visual feature descriptors based on pixels or objects to extract low-level local image features such as colour histograms (Swain and Ballard, 1991), texture descriptors (Haralick et al., 1973; Jain et al., 1997; Ojala et al., 2000), the GIST descriptor (Oliva and Torralba, 2001), scale-invariant feature transform (SIFT) (Lowe, 2004) and the histogram of oriented gradients (HOG) (Dalal, 2005). Although the above low-level visual feature descriptors have achieved good scene classification performance to some degree, they capture only a single type of feature, such as colour, texture, shape, spatial or spectral information, and no single feature can represent the complete content of an entire scene containing multiple features.
To effectively represent the semantic information of complex high-resolution remote sensing scenes (HRSS), many researchers have developed high-order statistical patterns by coding low-level local feature descriptors to capture scene semantics; these are called mid-level features (Shao et al., 2013; Zhao et al., 2013; Negrel et al., 2014; Zhao et al., 2014; Weng et al., 2018). For example, the Bag of Visual Words (BoVW) was the state-of-the-art for many years in computer vision (Yang and Newsam, 2010). More recently, a number of improved feature descriptors have also been proposed, including Fisher vector coding (Perronnin et al., 2010), spatial pyramid matching (SPM) (Lazebnik et al., 2006), probabilistic latent semantic analysis (pLSA) (Bosch and Zisserman, 2006), which are typical feature descriptors. Undeniably, mid-level feature descriptors have improved land-use classification performance because they consider multiple features. Nevertheless, scene classification generally considers multiple features of multiple objects. Meanwhile, the resolution improvements in HRSS also capture factors such as noise, light and clouds, which interfere with the image quality and result in a large number of abnormal spectral values. For situations such as “the same thing with different spectra” and “foreign matter sharing the same spectrum”, mid-level feature descriptors still have some deficiencies when used to classify complex land-use scenes.
Recently, deep learning methods have surpassed the abovementioned methods and gained a powerful ability to learn feature representations from images automatically. Deep learning methods provide computational models composed of multiple processing layers that learn data representations at multiple levels of abstraction (Lecun et al., 2015). Thus, deep learning methods can extract both more abstract and more discriminative features, and they are highly suitable for land-use scene classification problems because one scene class may cover multiple land-cover classes or ground objects. Because deep learning methods can extract high-level features, they can solve the problems of “the same thing with different spectra” and “the foreign matter sharing the same spectrum”. Therefore, this article adopts deep learning technology to classify land use. The convolutional neural networks (CNNs) are a type popular deep learning model that can learn robust and more discriminative features (LeCun et al., 2010). A CNN is an effective new artificial neural network method that integrates deep learning technology. The weights in convolutional neural networks are trained by a backpropagation (BP) algorithm. Recently, CNNs have been applied to remote sensing image classification and achieved good results (Scott et al., 2017; Cheng et al., 2018a; Cheng et al., 2018b; Weng et al., 2018; Zhou et al., 2019).
Deep learning methods usually require a large number of annotated training samples. To overcome the lack of massive labelled remote sensing image datasets, researchers use two techniques in conjunction with CNNs: data augmentation and transfer learning with fine tuning. Data augmentation is conducted to generate additional and more diversified data samples by performing certain transformations on the original data (Yu et al., 2017). Researchers have introduced many data augmentation methods to expand the limited amount of raw data and achieve improved performance on scene classification tasks (Perez and Wang, 2017; Scott et al., 2017; Yu et al., 2017). Transfer learning is conducted to extract the knowledge from one or more source tasks and then apply the learned knowledge to a target task (Pan and Yang, 2010). For remote sensing land-use classification, researchers train the networks on a natural image dataset (usually the ImageNet challenge dataset) and then fine-tune the pre-trained networks on a remote sensing image dataset. This approach can avoid overfitting problems, reduce model convergence time and achieve better performances (Penatti et al., 2015; Hu et al., 2016; Marmanis et al., 2016). However, most studies have focused on existing public datasets, and their results are already saturated, making further research using the same source material useless. In addition, the existing studies typically use older convolutional neural networks. Newer convolutional neural networks have been greatly improved regarding efficiency and accuracy but have not yet been utilized for urban land-use scene classification tasks. Moreover, the choices of convolutional neural network parameter values have considerable effects on the results, but have rarely been considered.
Given the above, the objectives of this research are ternary. First, methodologically, in this study, we construct a new large-scale remote sensing scene image dataset by collecting sample images from WorldView. This dataset is, to our knowledge, the largest available of its type. Moreover, the images have balanced class samples, providing the research community with a more useful resource for evaluating and advancing the state-of-the-art algorithms for aerial image analysis. Second, empirically, we evaluate a set of representative remote sensing scene image classification approaches under various experimental protocols on our new dataset. The results can serve as baselines for future works. Finally—and practically—this article has identified the CNN models that achieve state-of-the-art performances and are applicable to engineering applications.
The remainder of this article is organized as follows: Section 2 describes the construction of the original and training datasets. Section 3 describes the proposed framework and method. Section 4 presents the experiments and an analysis of the results. We conclude this research and propose future work directions in Section 5.
2 Datasets and data augmentation
To deliver highly accurate classification results, CNNs require sufficiently large datasets annotated with appropriate labels (Yu et al., 2017). Some publicly available high-resolution remote sensing image datasets exist, such as the UCMerced Land Use dataset (UCM), the WHU-RS19 dataset, the RSSCN7 dataset and the Aerial Image Dataset (AID). UCM, which is available from the United States Geological Survey (USGS) National Map, is a popular dataset (Yang and Newsam, 2010) that is widely used in academia. (Penatti et al., 2015; Nogueira et al., 2016; Scott et al., 2017; Cheng et al., 2018c). The WHU-RS19 dataset (Xia et al., 2010) is also popular and was collected from Google Earth. Compared with the UCM, WHU-RS is more complicated; it contains greater variations in illumination, scale, resolution, viewpoint and viewpoint-dependent appearance in some categories. The RSSCN7 dataset is also collected from Google Earth; it contains 2,800 aerial scene images labelled into 7 typical scene categories. The last dataset is AID (Xia et al., 2016), which is a large-scale dataset for aerial scene classification. It contains 10,000 annotated aerial images with a fixed resolution of 600 × 600 pixels arranged in 30 classes. The number of samples per class varies considerably, from 220 to 420. Because the samples are multisource and contain various pixel resolutions, this dataset is challenging for scene classification. These datasets have been widely used for remote sensing image scene classification tasks (Marmanis et al., 2016; Nogueira et al., 2016; Scott et al., 2017; Weng et al., 2018). Detailed information for the datasets is listed in Table 1.
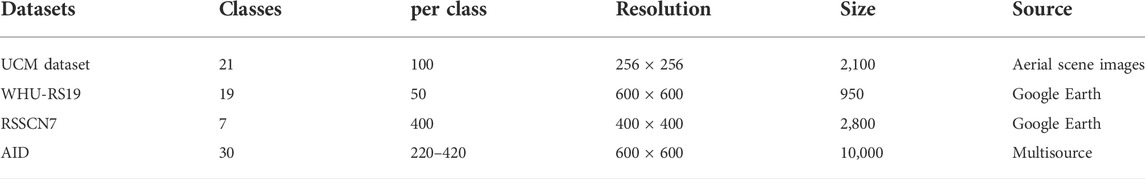
TABLE 1. The mainstream public remote sensing image datasets.
Despite the many publicly available remote sensing datasets, each dataset has its particular advantages and some drawbacks still exist, including low intra-class variations and large inter-class dissimilarities. With the exception of AID, all the datasets have single data sources. However, due to different imaging conditions during acquisition, such as the altitude and direction of the sensor, different weather conditions or illumination, scenes may appear in different orientations, directions, sizes and so on. Single data sources tend to cause smaller changes within classes. In actual remote sensing image classification situations, the differences between different scenes are generally small, and the existing datasets do not reflect the differences between classes, which is not in line with the actual image classification situation. In addition to the data source, there are two more problems with existing datasets. The first problem is imbalanced samples. The AID dataset has relatively high intra-class variations and small inter-class dissimilarities; however, it contains imbalanced class samples, which potentially have severe negative impacts on the overall scene classification performances by CNNs (Hensman and Masko, 2015). The second problem is that the existing datasets have small scales. The total number of images and the number of images per class are relatively small; these datasets are not comparable to the much larger traditional image datasets such as CIFAR-10 (Torralba et al., 2008), MNIST (Lecun, 1998) and ImageNet (Krizhevsky et al., 2012), as shown in Table 2.
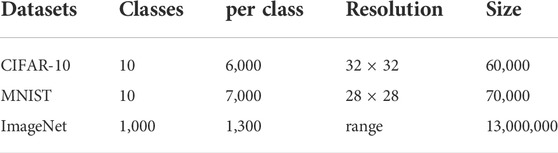
TABLE 2. Traditional image datasets.
In view of the above disadvantages, in this study, we constructed a new remote sensing scene image dataset for land-use classification. The samples are collected from remote sensing images acquired in different years. The dataset includes scene classes with small inter-class dissimilarities, such as farm land and green land; thus, it has higher intra-class variations and smaller inter-class dissimilarities than do the previously existing datasets. To address imbalance and small-sample problems, data augmentation was applied to increase both the number of classes among underrepresented images and the total number of samples, as illustrated by the flowchart in Figure 1.
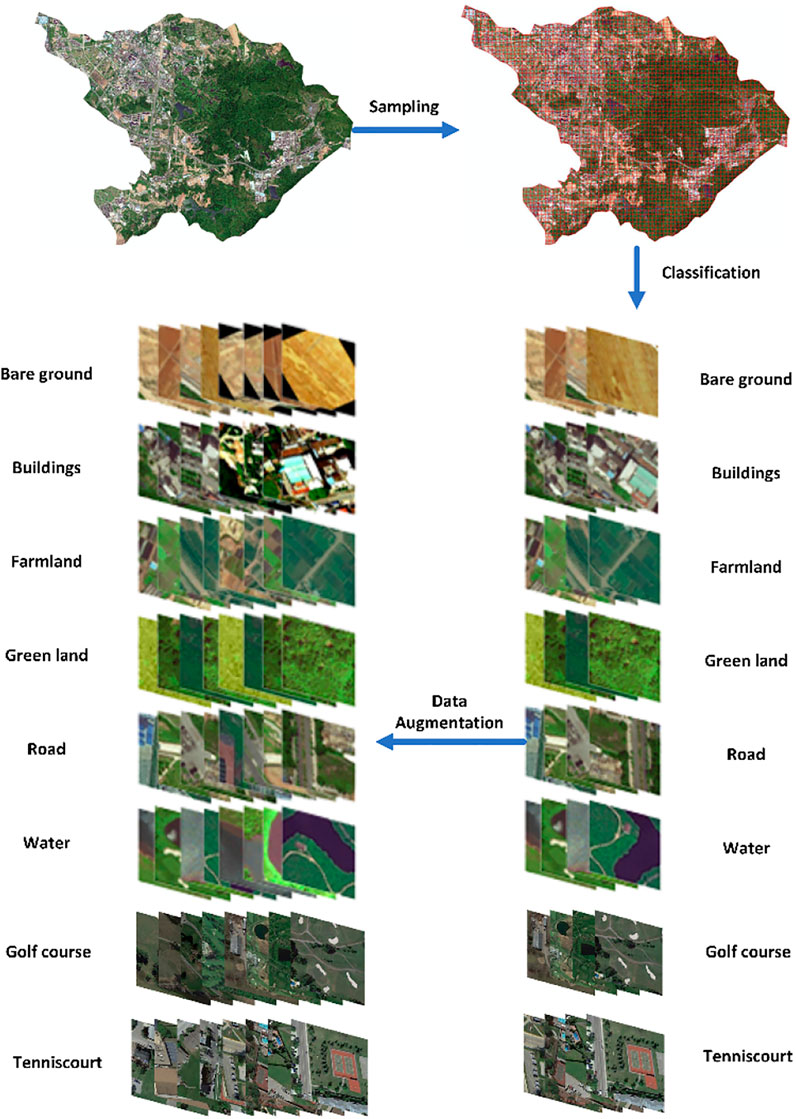
FIGURE 1. The dataset construction process.
The study area is the Guangming New District, Shenzhen, Guangdong Province China, as shown in Figure 2. Shenzhen is located in the southern coastal area of Guangdong province, and it is an important special economic zone in China. Due to its geographical advantages and level of support by relevant national policies and departments, Shenzhen has become an influential international metropolis in China. The New District is located in the northwest of Shenzhen and was founded in August 2007. Its development zones and administrative system are different than those of the third development zone because they were more recently instituted. Additionally, the New District’s surface area includes more diverse land cover types, including water, agricultural land, urban buildings, vegetation, bare land and new city street communities. During the urban development process, the land cover types of new areas in Guangming are prone to frequent changes.
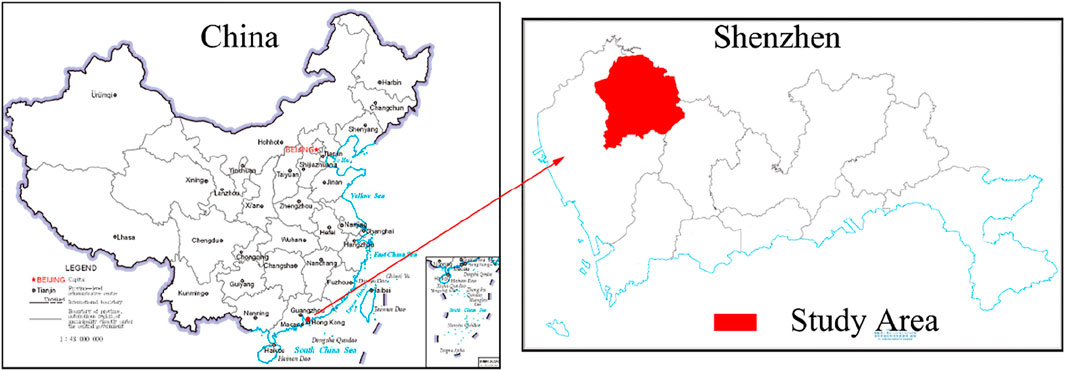
FIGURE 2. The study area map.
The original image dataset contains a large set of satellite images collected for land law enforcement and supervision (Li et al., 2011; Zhao J. et al., 2017). Land law enforcement and supervision is an approach for which the government uses satellite remote sensing technology to monitor land use over a certain period of time to determine the legality of land use (Wang and Wang, 2010). The image database used in this article contains satellite remote sensing image data of various batches since the law enforcement work began in 2008. All the images have high spatial resolution, and since 2010, all the images have a spatial resolution of 0.5 m. After researching all batches of images, WorldView three-band image data were selected with a resolution of 0.5 m acquired between the years of 2013 and 2016, as shown in Table 3.
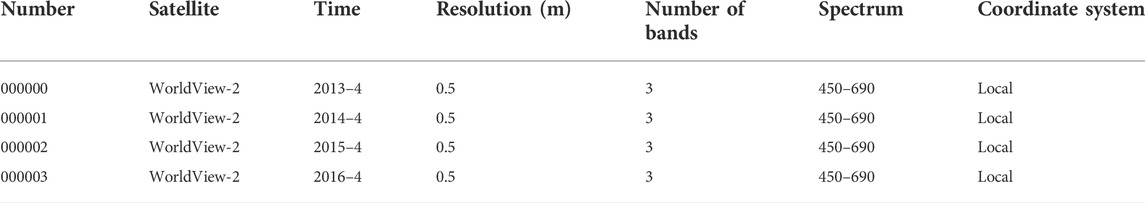
TABLE 3. Experimental image sample metadata.
Each CNN input image has specific resolution requirements; most models use inputs of 224 × 224 pixels. Therefore, 224 × 224 images were cropped from the original images to use as training samples. For surface cover classification, the 2005 Chinese CH/T 1012–2005 land cover map of digital products was referenced based on geographic information; this is a standard surface-coverage level classification for cultivated land, forest land, garden land, grassland, water area, built up area, unused land and wetland. Due to the integration of the bright new district in the city and countryside, consisting of city land, garden land, grassland and wetland, we combined the classes woodland, garden, grassland and wetland into a single green land class and divided the built up area class into two classes: buildings and roads. Golf course and tennis court classes were also added to match the ground features in the images. Consequently, our training samples are divided into eight categories: bare ground, buildings, farmland, green land, roads, water, golf course and tennis court, as shown in Figure 3.
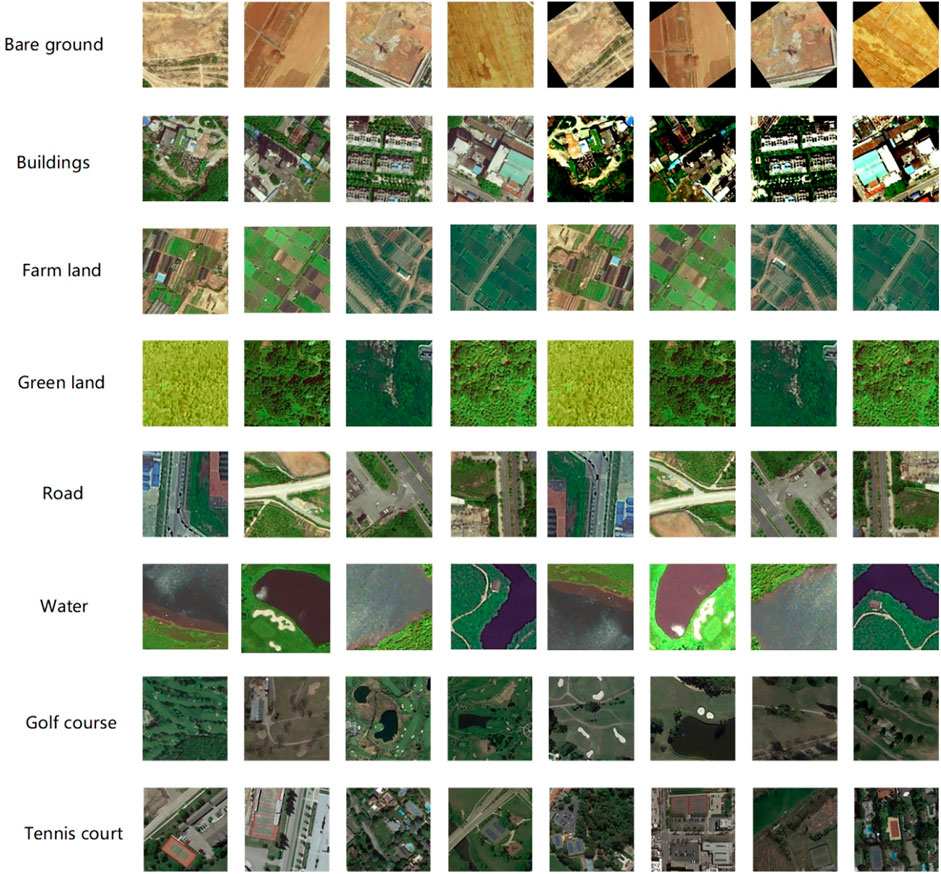
FIGURE 3. Example images for each class.
According to Hensman and Masko ( 2015), imbalanced training samples will directly affect the final training effect of the model. When samples are selected, the areas covered by different features are not necessarily identical. Therefore, after extracting samples from the image, the data should be enhanced to ensure that the features of types with small sample sizes are well represented. The sample set can be augmented using processes such as rotation, translation and cropping. As shown in the figure, random data enhancement was performed on the sample data using nine enhancement methods: rotations by 30°, 90°, 180° and 270°, mirroring, brightness, contrast, scaling and mirrored 90° rotation. After the enhancements, the number of samples reached 4,000 for each class. We used 70% of samples (i.e., 22,400 samples) as the training dataset and the remaining 30% (i.e., 9,600 samples) as the verification dataset. It is worth noting that the data augmentation operations, including flips, translations and rotations, do not change the essential features of remote sensing imagery, such as the scene topologies and spectral characteristics, that are essential for consistent scene classification (Yu et al., 2017).
Notably, because the images were acquired by the same remote sensing satellite at different times, the samples were collected in multiple phases. Thus, after data augmentation, not only was the sample size of the dataset increased but also the samples’ holistic spatial layouts and orientations were diversified subject to topological preservation, the intra-class variations were enhanced and overfitting was avoided. Compared with open datasets, our dataset is larger and includes higher intra-class variations, smaller inter-class dissimilarities and balanced class samples.
3 Framework of the proposed method
The flowchart of the model proposed in this study is illustrated in Figure 4. The purpose of our study was to determine the architecture with the best performance for the Guangming New District imagery. This study used three steps to obtain the model. 1) Via data sampling and data augmentation, a large dataset was constructed with higher intra-class variations and smaller inter-class dissimilarities and separated it into training and validation sub-datasets; 2) Three convolutional neural networks were trained (Inception-V3, ResNet and Inception-ResNet) using the constructed datasets via two strategies and compared three different learning rates under iterative backpropagation based on the loss calculated in a softmax layer. 3) The results were analysed and compared to obtain the optimal deep learning model.
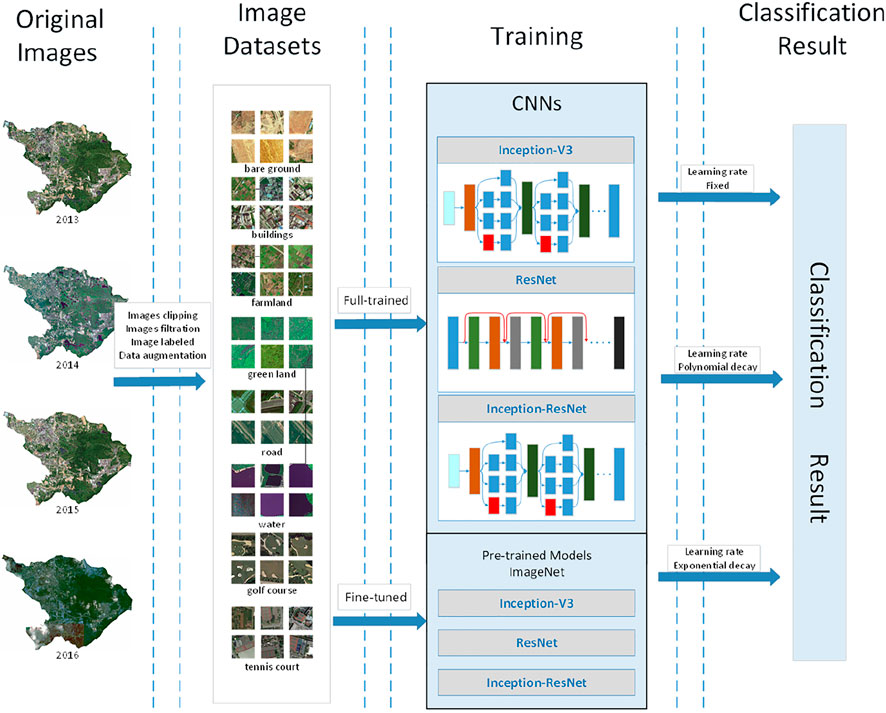
FIGURE 4. Flowchart of the model.
3.1 Strategies for exploiting ConvNets
3.1.1 Fully trained networks
The strategy to train the networks from scratch (the initial network parameters were random) is the first to be thought. We were able to use this approach because the constructed dataset is sufficiently large to allow the CNNs to converge. There are two main advantages to using a fully trained network: 1) the extractors can be tuned specifically for the dataset, which results in generating more accurate features, and 2) we gain full control of the network (Nogueira et al., 2016). However, fully training a network can easily lead to overfitting, and convergence cannot be confirmed. Therefore, the networks must be fine-tuned to improve the outcome.
3.1.2 Fine-tuned network
When a new dataset is reasonably large—but not large enough to fully train a new network—overfitting and a lack of convergence can occur, as presented above. Fine-tuning is a good option for extracting maximum effectiveness from pre-trained CNNs (trained on large image datasets such as ImageNet), and the workflow of the fine-tuned network is illustrated in Figure 5. There are two options for fine-tuning networks that fit our conditions. The first involves replacing only the last layer of the pretrained network with a softmax layer related to our problem. Because the final softmax layer of a network pretrained on ImageNet includes 1,000 classes, we changed it to eight classes to reflect our classification task. Then, the entire network was trained on our constructed datasets using cross-validation to improve network training. Cross-validation is a recommended method when the training dataset is similar to the dataset on which the network was pretrained and has a lack of samples. Then, after replacing the last layer, fine-tuning was conducted with only some high-level layers of the network and the weights of the first few layers were fixed. Because the first few layers contain low-level features such as shapes, colours, textures, etc., we want to preserve them. This approach is recommended when the training dataset is dissimilar to the pretrained dataset and lacks samples. After this test, for the remainder of this paper, we adopted the first approach because our dataset is similar to ImageNet.
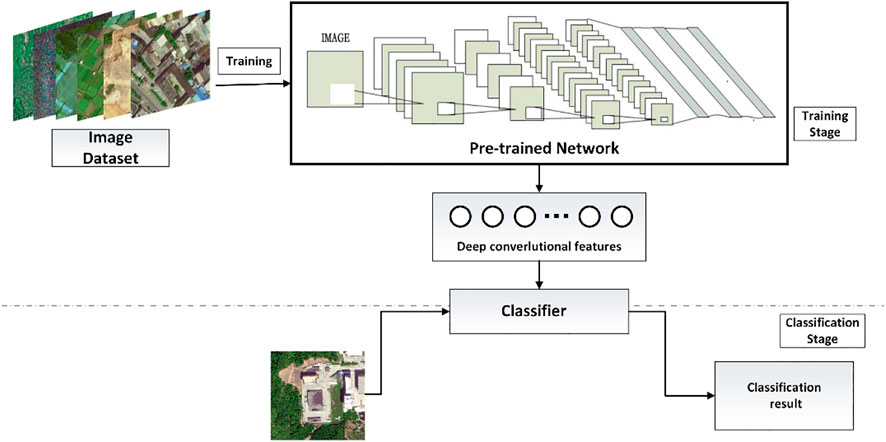
FIGURE 5. Workflow diagram of the fine-tuned network.
3.2 CNNs
CNNs consist of a number of convolutional and pooling layers and a fully connected layer (FCL) that functions as the classifier. AlexNet (Krizhevsky et al., 2012), VGG (Simonyan and Zisserman, 2014), GoogleNet (Inception-V1) (Szegedy et al., 2015), Inception-V3 (Szegedy et al., 2016), ResNet (He et al., 2016) and Inception-ResNet (Szegedy et al., 2017) are famous CNN architectures that have recently established themselves as the best-performing methods for computer vision tasks.
3.2.1 Inception-V3
Inception-V3 is a modified version of Inception-V1 (GoogLeNet). In researching and developing convolutional neural networks, scholars hope that increasing the depth (or width) of the network will obtain higher precision; however, this approach can encounter problems: 1) when there are too many parameters and insufficient training data, an overfitting situation will appear; 2) when the network is too complicated, the number of calculations becomes too large, making it difficult to apply; and 3) when the gradient gradually disappears in deeper networks, increasing the difficulty of further optimizing the network. Based on these problems, the Google brain team designed the Inception model, which attempts to introduce sparsity and replace fully connected layers with sparse ones, even within the convolutions (Szegedy et al., 2015). The Inception model draws on the idea of a “network in network” (Lin et al., 2014) and uses different convolution kernel sizes to obtain receptive fields of different sizes and finally extract multi-scale features. Inception-V1 reduced the number of network parameters, allowing the network to be deeper and wider, and this architecture won the ILSVRC-2014 competition (Russakovsky et al., 2015).
Inception-V3 introduced the idea of factorization into smaller convolutions (Szegedy et al., 2016) by splitting large two-dimensional convolutions into two smaller one-dimensional convolutions. On one hand, this approach saves many parameters, accelerates the calculation and reduces overfitting. On the other hand, it adds an extended nonlinear layer that improves model expressivity, thereby further enhancing its classification effect.
3.2.2 ResNet
The residual neural network (ResNet) (He et al., 2016) won the championship at the 2015 ILSVRC classification competition. This network reached 152 layers. As the network deepens, a gradient degradation problem will occur; that is, the accuracy first rises, then it reaches saturation. Finally, as the depth continues to increase, a decrease in accuracy occurs. This is not an overfitting problem because the error increases on both the training and test sets. He designed the ResNet structure to solve this problem by using a “shortcut connection” connection. Assuming that the input of a certain neural network is x, the expected output is h(x). If we directly pass x to the output as the initial result, then the goal we need to learn at this moment is f(x) = h(x)-x, This concept forms the residual units of ResNet, as shown in Figure 6—that is, the learning goal of ResNet becomes the difference between the output and the input h(x)-x: in other words, the residual. ResNet solves the gradient degradation problem caused by deepening a network, achieves extremely high precision and has a wide range of applications in classification, segmentation and recognition tasks.
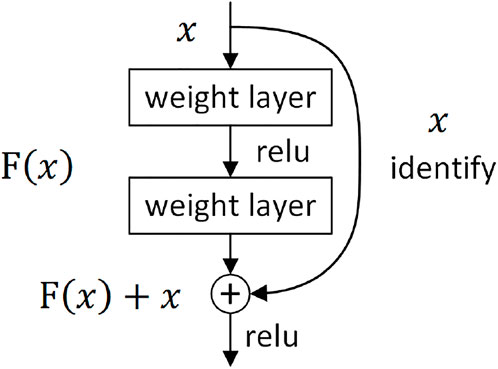
FIGURE 6. ResNet structure.
3.2.3 Inception-ResNet-V2
Inception-ResNet-V2 combined the network structures of ResNet and Inception to further enhance the accuracy of image classification.
3.3 Learning rate
Gradient descent is a parameter optimization algorithm widely used to minimize the error of deep convolutional neural network models. The gradient is reduced over multiple iterations by minimizing a cost function at each step to estimate the model parameters. The cost function is
where
To improve the performance of the gradient descent method, it is necessary to set an appropriate learning rate. When the learning rate is too small, the network loss will be very slow, and when the learning rate is too large, the parameter updates will be very large. These problems cause the network to either converge to a local minimum or the loss directly begins to increase, as shown in Figure 7.

FIGURE 7. The influence of learning rate decay type on loss value.
The learning rate selection strategy changes constantly during the network training process. Initially, the parameters are relatively random; therefore, a relatively large learning rate is appropriate to cause the loss to fall faster. However, after training for a while, the parameter updates should have smaller amplitudes; therefore, the learning rate is generally attenuated. The attenuation method is generally fixed, exponential, or polynomial. The corresponding formula is as follows, where base_lr is the initial learning rate, R is a real constant, iter is the current number of iterations and max_iter is the maximum number of iterations.
(1)
(2)
(3)
4 Experiments and analysis
In this study, we utilized TensorFlow (Abadi, 2016) as our deep learning framework. TensorFlow is a fully open-source framework that supports clear and easy deep architecture implementations. TensorFlow was originally developed by researchers and engineers at the Google Brain Group (part of the Google Machine Intelligence Research Institute) for machine learning and deep neural network research, but the system’s versatility makes it highly suitable for other calculation fields.
Three famous deep convolutional neural network models were selected that have the best performances on traditional image classification tasks (Inception-V3, ResNet-V1-50 and Inception-ResNet-V2) and two strategies were applied to better exploit these existing CNNs: 1) fully training a network from scratch and 2) fine-tuned CNNs.
4.1 Experimental protocol
In our experiment, the datasets are divided randomly into two non-overlapping sets: 70% of the samples with 2,800 images per class were adopted as training sets, and 30% of the samples with 1,200 images per class were used as validation sets. The original image sizes were 224 × 224; thus, before using them as training input for the classification stage, all the images were resized to 299 × 299 for the Inception-V3 and Inception-ResNet-V2 models to comply with the standardized input dimensions of these CNN models, which were initially determined by their authors. When fine-tuning, we use the CNN models pre-trained on the ILSVRC 2012 dataset (Russakovsky et al., 2015). When fine-tuning or fully training a network, we preserve the original authors’ parameters: the initial learning rate is set to 0.01 and is then varied between fixed, exponential decay and polynomial decay. In the experiments, the batch size (the number of images processed by CNN simultaneously) is set to 32, and the number of iterations is 105,000 (200 epochs).
To compare the classification quantitatively, we compute commonly used measures including the loss function, overall accuracy (OA) and confusion matrix. The loss function reflects the proximity of the predicted images to the real images. Cross entropy is a loss function widely used in classification problems that describes the distance between two probability distributions. The smaller the cross entropy is, the closer the two images are. OA is defined as the number of correctly predicted images divided by the total number of predicted images. The confusion matrix summarizes the machine learning classification model predicted results and the ground truth of a dataset in the form of a matrix in accordance with the category classification model. In the confusion matrix, each column represents a predicted class, and each row represents the ground truth. The value in each column indicates the real data forecasts for the number of classes. Thus, each item xij in the matrix computes the proportion of images that were predicted to be the ith type but truly belong to the jth type. The confusion matrix has the following purposes: 1) it can be used to observe the performance of the model in each category and to observe the accuracy and recall rate of the model corresponding to each category; 2) it can be used to observe which categories are difficult to distinguish (for example, how many of category A are classified into category B), to provide targeted design features and to make the categories more distinguishable. All the experiments were performed on computer equipped with a 64-bit Intel i7-6700K CPU @ 4.0 GHz, 32 GB of RAM, and a GeForce GTX1070 GPU with 4 GB of memory, running under CUDA version 8.0. The operating system was Ubuntu 16.04 LTS.
4.2 Experimental Results
In this section, we compare the performances of the two different strategies to exploit the existing ConvNets: full training and fine tuning.
Figure 8 shows a comparison of the strategies in terms of loss value. These line charts show that the loss values vary with the epoch. Each chart refers to a training strategy, and the different lines indicate different learning rate decay types.
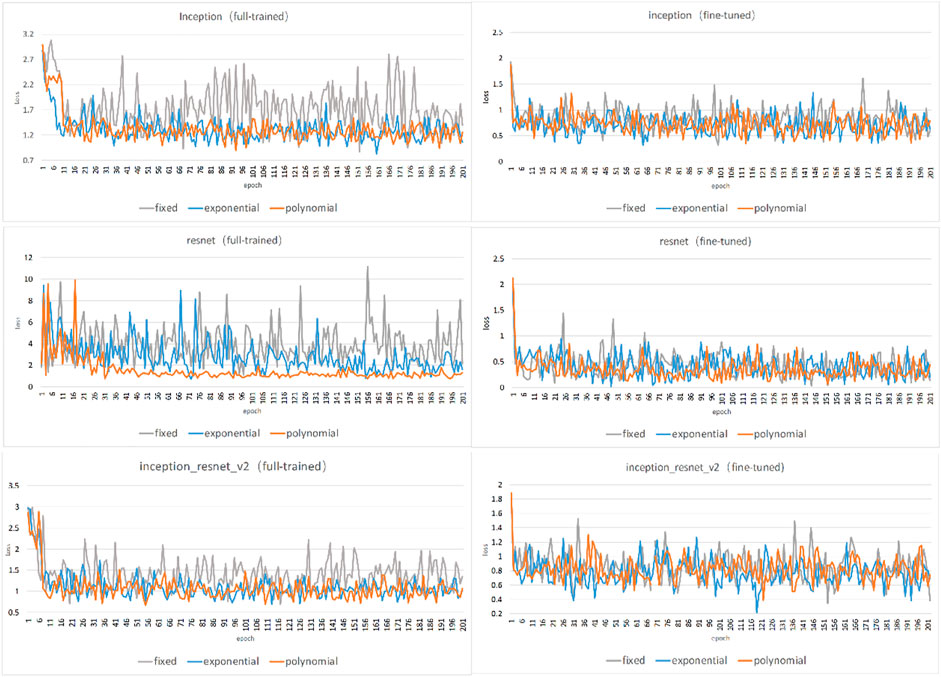
FIGURE 8. Loss values of different training strategies and CNNs.
From the figure, we can see the convergence in this experiment. Most of the training is convergent. The following conclusions were reached. 1) Fine-tuning is faster than full training. In full training, the loss reaches a low value at approximately the 16th epoch and starts to level off at the 30th epoch. The fine-tuning approach reached a low value in the sixth epoch. 2) Fine tuning achieves a smaller loss value than does full training. In full training, the loss generally exceeds 1, while in fine-tuning, it generally remains below 1. Moreover, it usually oscillates slightly (by approximately 0.5). This result shows that the fine-tuning error is smaller. 3) Comparing the different CNNs, the fine-tuned ResNet model is optimal, with a loss below 0.5. 4) Comparing the different learning rates, the expentional and polynomial decay types are easier to converge.
The effect of the training set reflects only the training data. In this study, 30% of the samples were used as verification data to verify the accuracy of the model. Accuracy is the ratio of the correctly classified samples to the total number of samples for a given validation dataset. The accuracy of the three models is shown in Figure 9.
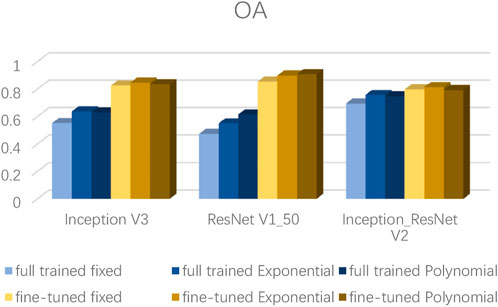
FIGURE 9. Overall accuracy of different methods.
The verification results show that for remote sensing image data, the initial precision of the trained models is very low; the accuracy rates of the three types of networks reach only approximately 50%, indicating that the network convergence is insufficient. After applying the ImageNet pre-trained model, the three models reach a good classification accuracy and recall rate, and the accuracy generally exceeds 70%. Among the models, ResNet-V1-50 has the best training and verification effect for this image data: when the learning rate was set to 0.01 and used polynomial decay, its accuracy exceeded 90%.
In addition to OA, confusion matrices were calculated. Figure 10 shows the confusion matrix when using the best model on the dataset. The confusion matrix shows that the classification accuracies can exceed 90% for most scene types. In particular, the buildings, farmland, water, golf course and tennis court classes reached classification accuracy rates above 0.94%. The most difficult scene type in our new dataset was roads, which are easily confused with buildings.
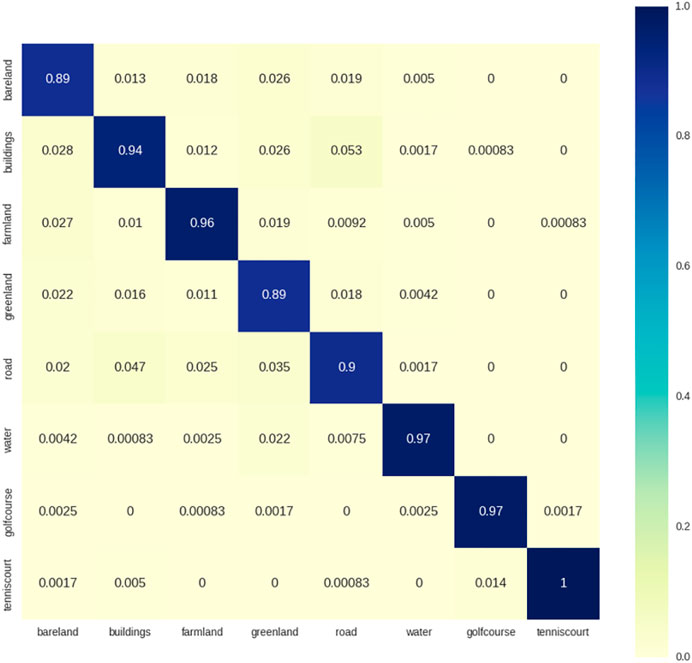
FIGURE 10. Confusion matrix obtained by fine-tuning ResNet-V1-50 with a polynomially decayed learning rate.
5 Discussion and Conclusion
Improving the accuracy of automatic urban land-use classification has been an important issue in recent high-resolution remote sensing literature. Larger, more challenging datasets are needed, more efficient and more accurate convolutional neural network frameworks are imperative, and the relations between a CNNs’ parameters and the classification results should be determined. In this study, we constructed a new large-scale dataset. To our knowledge, this is the largest dataset currently available for the scene classification of remote sensing images, and it has higher intra-class variations and smaller inter-class dissimilarities than previously available datasets. In addition, we evaluated two strategies to exploit existing CNNs using different learning rates on the constructed dataset. The objective was to understand the best approach that can obtain the greatest benefits from these state-of-the-art deep learning approaches in situations and problems that are unsuitable for designing and creating new CNNs from scratch. We performed experiments to evaluate the following strategies for exploiting the ConvNets: full training and fine tuning. The experiments considered three popular and advanced CNNs: Inception-V3, ResNet-V1-50 and Inception-ResNet-V2. We used three different learning rate decay modes: fixed, exponential and polynomial. The results indicate that fine tuning tends to be the best strategy across a variety of different situations. Specifically, we achieved state-of-the-art results with the ResNet-V1-50 model with a polynomial learning rate decay mode (OA = 90.8%). The model we proposed is good at classifying bare land, buildings, farmland, green land and water areas, all of which are useful in urban remote sensing applications such as urban change detection and environmental monitoring.
We also believe that our datasets can provide the research community with a benchmark resource to advance the state-of-the-art algorithms in urban land-use scene analysis. Moreover, the model can also be applied to other domains. However, this study still has some limitations, including the size and class diversity of the datasets and the comparison of our dataset to the public datasets. In addition, more evaluations of the factors affecting the classification effects of CNNs are needed. At the same time, the method in this paper did not consider the application scenarios of image classification of large scale remote sensing images, so it is necessary to study the remote sensing image classification methods that take multi-scale features into account. In the future, we will elaborate and delve into the relevant areas. First, we plan to publicly release the samples and classes in our dataset, providing a larger and more challenging urban remote sensing dataset for researchers. Second, we plan to compare the existing CNNs using both our dataset and another public remote sensing dataset. Third, we plan to evaluate the impact of additional factors on the two strategies (full training and fine tuning), such as the number of classes in the dataset, other initialized parameters and the depth of the CNNs.
Data availability statement
The datasets presented in this article are not readily available. The data involves sensitive information and therefore cannot be made public. Requests to access the datasets should be directed to qtq@whu.edu.cn.
Author contributions
Conceptualization, TQ, HH, and XL; Data curation, FC; Investigation, ZC and HH; Methodology, TQ, HH, and FC; Resources, YL; Software, TQ; Supervision, YL; Validation, XL; Visualization, HH; Writing—original draft, TQ; Writing—review and editing, HH and YL.
Funding
The completion of this work was supported by Key-Area Research and Development Program of Guangdong Province (No. 2020B0101130009) and Guangdong Enterprise Key Laboratory for Urban Sensing, Monitoring and Early Warning (No. 2020B121202019).
Conflict of interest
The authors declare that the research was conducted in the absence of any commercial or financial relationships that could be construed as a potential conflict of interest.
Publisher’s note
All claims expressed in this article are solely those of the authors and do not necessarily represent those of their affiliated organizations, or those of the publisher, the editors and the reviewers. Any product that may be evaluated in this article, or claim that may be made by its manufacturer, is not guaranteed or endorsed by the publisher.
References
Abadi, M. (2016). TensorFlow: Learning functions at scale. ACM SIGPLAN Not. 51 (9), 1. doi:10.1145/3022670.2976746
Bosch, A., and Zisserman, A. (2006). “Scene classification via pLSA,” in European conference on computer vision, May 2006 (Berlin: Springer), 517–530.
Cheng, G., Han, J., Zhou, P., and Xu, D. (2018a). Learning rotation-invariant and Fisher discriminative convolutional neural networks for object detection. IEEE Trans. Image Process. 28 (1), 265–278. doi:10.1109/tip.2018.2867198
Cheng, G., Li, B., Sun, X., Cao, Z., Zhang, G., Zhao, Z., et al. (2018c). When deep learning meets metric learning: Remote sensing image scene classification via learning discriminative CNNs. IEEE Trans. Geoscience Remote Sens. 56, 2811–2821. doi:10.1109/TGRS.2017.2783902
Cheng, G., Li, Z., Han, J., Yao, X., and Guo, L. (2018b). Exploring hierarchical convolutional features for hyperspectral image classification. IEEE Trans. Geosci. Remote Sens. 56 (11), 6712–6722. doi:10.1109/tgrs.2018.2841823
Dalal, N. (2005). Histograms of orientated gradients for human detection. IEEE Comput. Soc. Conf. Comput. Vis. Pattern Recognit. 1 (12), 886–893. doi:10.1109/CVPR.2005.177
Haralick, R. M., Shanmugam, K., and Dinstein, I. H. (1973). Textural features for image classification. IEEE Trans. Syst. Man. Cybern. 3 (6), 610–621. doi:10.1109/tsmc.1973.4309314
He, K., Zhang, X., Ren, S., and Sun, J. (2016). “Deep residual learning for image recognition,” in IEEE Conference on Computer Vision and Pattern Recognition, 770–778.
Hensman, P., and Masko, D. (2015). The impact of imbalanced training data for convolutional neural networks.
Hu, F., Xia, G. S., Hu, J., and Zhang, L. (2016). Transferring deep convolutional neural networks for the scene classification of high-resolution remote sensing imagery. Remote Sens. 7 (11), 14680–14707. doi:10.3390/rs71114680
Jain, A. K., Ratha, N. K., and Lakshmanan, S. (1997). Object detection using gabor filters. Pattern Recognit. 30 (2), 295–309. doi:10.1016/s0031-3203(96)00068-4
Krizhevsky, A., Sutskever, I., and Hinton, G. E. (2012). “ImageNet classification with deep convolutional neural networks,” in Advances in neural information processing systems, 25.
Lazebnik, S., Schmid, C., and Ponce, J. (2006). “Beyond bags of features: Spatial pyramid matching for recognizing natural scene categories,” in 2006 IEEE computer society conference on computer vision and pattern recognition (CVPR'06) (IEEE), Vol. 2, 2169–2178.
Lecun, Y., Bengio, Y., and Hinton, G. (2015). Deep learning. Nature 521 (7553), 436–444. doi:10.1038/nature14539
Lecun, Y. (1998). The MNIST database of handwritten digits. Available at: http://yann. lecun. com/exdb/mnist/.
LeCun, Y., Kavukcuoglu, K., and Farabet, C. (2010). “Convolutional networks and applications in vision,” in Proceedings of 2010 IEEE international symposium on circuits and systems (IEEE).
Li, F., Bi, R., and Li, F. (2011). “Design and realization of the dynamic supervision system for land enforcement” in 2011 International Conference on E-Business and E-Government (ICEE) (IEEE), 1–4.
Lin, M., Chen, Q., and Yan, S. (2013). Network in network. arXiv [Preprint]. Available at: https://arxiv.org/abs/1312.4400.
Lowe, D. G. (2004). Distinctive image features from scale-invariant keypoints. Int. J. Comput. Vis. 60 (2), 91–110. doi:10.1023/b:visi.0000029664.99615.94
Marmanis, D., Datcu, M., Esch, T., and Stilla, U. (2016). Deep learning earth observation classification using ImageNet pretrained networks. IEEE Geosci. Remote Sens. Lett. 13 (1), 105–109. doi:10.1109/lgrs.2015.2499239
Negrel, R., Picard, D., and Gosselin, P. H. (2014). “Evaluation of second-order visual features for land-use classification,” in 2014 12th International Workshop on Content-Based Multimedia Indexing (CBMI) (IEEE), 1–5.
Nogueira, K., Penatti, O. A. B., and Santos, J. A. D. (2016). Towards better exploiting convolutional neural networks for remote sensing scene classification. Pattern Recognit. 61, 539–556. doi:10.1016/j.patcog.2016.07.001
Ojala, T., Pietikäinen, M., and Mäenpää, T. (2000). Gray scale and rotation invariant texture classification with local binary patterns. Berlin, Heidelberg: Springer, 404–420.
Oliva, A., and Torralba, A. (2001). Modeling the shape of the scene: A holistic representation of the spatial envelope. Int. J. Comput. Vis. 42 (3), 145–175. doi:10.1023/A:1011139631724
Othman, E., Bazi, Y., Alajlan, N. A., Alhichri, H. S., and Melgani, F. (2016). Using convolutional features and a sparse autoencoder for land-use scene classification. Int. J. Remote Sens. 37 (10), 2149–2167. doi:10.1080/01431161.2016.1171928
Palsson, F., Sveinsson, J. R., Benediktsson, J. A., and Aanaes, H. (2012). Classification of pansharpened urban satellite images. IEEE J. Sel. Top. Appl. Earth Obs. Remote Sens. 5 (1), 281–297. doi:10.1109/jstars.2011.2176467
Pan, S. J., and Yang, Q. (2010). A Survey on transfer learning. IEEE Trans. Knowl. Data Eng. 22 (10), 1345–1359. doi:10.1109/tkde.2009.191
Penatti, O. A. B., Nogueira, K., and Dos Santos, J. A. (2015). “Do deep features generalize from everyday objects to remote sensing and aerial scenes domains?,” in Proceedings of the IEEE conference on computer vision and pattern recognition workshops, 44–51.
Perez, L., and Wang, J. (2017). The effectiveness of data augmentation in image classification using deep learning. arXiv [Preprint]. Available at: https://arxiv.org/abs/1712.04621.
Perronnin, F., Sánchez, J., and Mensink, T. (2010). Improving the Fisher kernel for large-scale image classification. Berlin, Heidelberg: Springer, 143–156.
Qi, K., Wu, H., Shen, C., and Gong, J. (2015). Land-use scene classification in high-resolution remote sensing images using improved correlatons. IEEE Geosci. Remote Sens. Lett. 12 (12), 2403–2407. doi:10.1109/lgrs.2015.2478966
Russakovsky, O., Deng, J., Su, H., Krause, J., Satheesh, S., Ma, S., et al. (2015). ImageNet large scale visual recognition challenge. Int. J. Comput. Vis. 115 (3), 211–252. doi:10.1007/s11263-015-0816-y
Santos, J. A. D., Gosselin, P.-H., Philipp-Foliguet, S., Torres, R. D. S., and Falcão, A. X. (2013). Interactive multiscale classification of high-resolution remote sensing images. IEEE J. Sel. Top. Appl. Earth Obs. Remote Sens. 6 (4), 2020–2034. doi:10.1109/jstars.2012.2237013
Scott, G. J., England, M. R., Starms, W. A., Marcum, R. A., and Davis, C. H. (2017). Training deep convolutional neural networks for land-cover classification of high-resolution imagery. IEEE Geoscience Remote Sens. Lett. 14 (4), 549–553. doi:10.1109/LGRS.2017.2657778
Shao, W., Yang, W., Xia, G. S., and Liu, G. (2013). “A hierarchical scheme of multiple feature fusion for high-resolution satellite scene categorization,” in International conference on computer vision systems (Berlin, Heidelberg: Springer).
Simonyan, K., and Zisserman, A. (2014). Very deep convolutional networks for large-scale image recognition. arXiv [Preprint]. Available at: https://arxiv.org/abs/1409.1556.
Song, Y. Q., Pan, Z. -K., Liu, Y. -L., Zhou, W., Hu, Y. -M., and Cui, X. -S. (2017). “Monitoring of inefficient land use with high resolution remote sensing image in a Chinese mega-city,” in 2017 IEEE International Conference on Computational Science and Engineering (CSE) and IEEE International Conference on Embedded and Ubiquitous Computing (EUC) (IEEE), Vol. 2, 242–249.
Swain, M. J., and Ballard, D. H. (1991). Color indexing. Int. J. Comput. Vis. 7 (1), 11–32. doi:10.1007/bf00130487
Szegedy, C., Ioffe, S., Vanhoucke, V., and Alemi, A. A. (2017). “Inception-v4, inception-ResNet and the impact of residual connections on learning” in Thirty-first AAAI conference on artificial intelligence.
Szegedy, C., Liu, W., Jia, Y., Sermanet, P., Reed, S., Anguelov, D., et al. (2015). “Going deeper with convolutions,” in Proceedings of the IEEE conference on computer vision and pattern recognition, 1–9. doi:10.1109/CVPR.2015.7298594
Szegedy, C., Vanhoucke, V., Ioffe, S., Shlens, J., and Wojna, Z. (2016). “Rethinking the inception architecture for computer vision,” in Proceedings of the IEEE conference on computer vision and pattern recognition, 2818–2826.
Tong, X. Y., Xia, G., Lu, Q., Shen, H., Li, S., You, S., et al. (2018). Learning transferable deep models for land-use classification with high-resolution remote sensing images. arXiv [Preprint]. Available at: https://arxiv.org/abs/1807.05713.
Torralba, A., Fergus, R., and Freeman, W. T. (2008). 80 million tiny images: A large data set for nonparametric object and scene recognition. IEEE Trans. Pattern Anal. Mach. Intell. 30 (11), 1958–1970. doi:10.1109/tpami.2008.128
Ursani, A. A., Kpalma, K., Lelong, C. C. D., and Ronsin, J. (2012). Fusion of textural and spectral information for tree crop and other agricultural cover mapping with very-high resolution satellite images. IEEE J. Sel. Top. Appl. Earth Obs. Remote Sens. 5 (1), 225–235. doi:10.1109/jstars.2011.2170289
Weng, Q., Mao, Z., Lin, J., and Guo, W. (2017). Land-use classification via extreme learning classifier based on deep convolutional features. IEEE Geosci. Remote Sens. Lett. 14 (5), 704–708. doi:10.1109/lgrs.2017.2672643
Weng, Q., Mao, Z., Lin, J., and Liao, X. (2018). Land-use scene classification based on a CNN using a constrained extreme learning machine. Int. J. Remote Sens. 39, 6281–6299. doi:10.1080/01431161.2018.1458346
Xia, G. S., Hu, J., Hu, F., Shi, B., Bai, X., Zhong, Y., et al. (2016). AID: A benchmark data set for performance evaluation of aerial scene classification. IEEE Trans. Geoscience Remote Sens. 55 (7), 1–17. doi:10.1109/TGRS.2017.2685945
Xia, G. S., Yang, W., Delon, J., Gousseau, Y., Sun, H., and Maître, H. (2010). “Structural high-resolution satellite image indexing,” in ISPRS TC VII Symposium-100 Years ISPRS, Vol. 38, 298–303.
Yang, Y., and Newsam, S. (2010). “Bag-of-visual-words and spatial extensions for land-use classification,” in Proceedings of the 18th SIGSPATIAL international conference on advances in geographic information systems, 270–279.
Yu, X., Wu, X., Luo, C., and Ren, P. (2017). Deep learning in remote sensing scene classification: A data augmentation enhanced convolutional neural network framework. Giscience Remote Sens. 54 (2605), 741–758. doi:10.1080/15481603.2017.1323377
Zhang, R., and Zhu, D. (2011). Study of land cover classification based on knowledge rules using high-resolution remote sensing images. Expert Syst. Appl. 38 (4), 3647–3652. doi:10.1016/j.eswa.2010.09.019
Zhao, B., Zhong, Y., and Zhang, L. (2013). “Hybrid generative/discriminative scene classification strategy based on latent dirichlet allocation for high spatial resolution remote sensing imagery” in 2013 IEEE International Geoscience and Remote Sensing Symposium-IGARSS, July 2013 (IEEE), 196–199.
Zhao, J., Zhang, M., and Lin, Y. (2017). “Methodology and implementation of the monitoring and supervision system for land resources based on the integration of 3S and mobile Internet technology,” in 2017 25th International Conference on Geoinformatics(IEEE), 1–6.
Zhao, L. J., Tang, P., and Huo, L. Z. (2017). Land-use scene classification using a concentric circle-structured multiscale bag-of-visual-words model. IEEE J. Sel. Top. Appl. Earth Obs. Remote Sens. 7 (12), 4620–4631. doi:10.1109/jstars.2014.2339842
Zhao, L., Ping, T., and Huo, L. (2014). A 2-D wavelet decomposition-based bag-of-visual-words model for land-use scene classification. Int. J. Remote Sens. 35 (6), 2296–2310. doi:10.1080/01431161.2014.890762
Zhao, W., Du, S., and Emery, W. J. (2017). Object-based convolutional neural network for high-resolution imagery classification. IEEE J. Sel. Top. Appl. Earth Obs. Remote Sens. 10 (7), 3386–3396. doi:10.1109/jstars.2017.2680324
Keywords: land-use scene classification, high-resolution remote sensing imagery, deep learning, CNNs, transfer learning
Citation: Qiu T, He H, Liang X, Chen F, Chen Z and Liu Y (2022) Using different training strategies for urban land-use classification based on convolutional neural networks. Front. Environ. Sci. 10:981486. doi: 10.3389/fenvs.2022.981486
Received: 29 June 2022; Accepted: 18 July 2022;
Published: 22 August 2022.
Edited by:
Qingsong He, Huazhong University of Science and Technology, ChinaReviewed by:
Chao Wu, Nanjing University of Posts and Telecommunications, ChinaSheng Li, Shenzhen Municipal Planning and Land Real Estate Information Centre, China
Copyright © 2022 Qiu, He, Liang, Chen, Chen and Liu. This is an open-access article distributed under the terms of the Creative Commons Attribution License (CC BY). The use, distribution or reproduction in other forums is permitted, provided the original author(s) and the copyright owner(s) are credited and that the original publication in this journal is cited, in accordance with accepted academic practice. No use, distribution or reproduction is permitted which does not comply with these terms.
*Correspondence: Xiaojin Liang, bGlhbmd4akB3aHUuZWR1LmNu; Yang Liu, bGl1eWFuZ0BnenBpLmNvbS5jbg==