- 1Key Laboratory of Water and Sediment Sciences of MOE, School of Environment, Beijing Normal University, Beijing, China
- 2School of Water Resources and Hydropower Engineering, North China Electric Power University, Beijing, China
- 3Environmental Planning Research Center, Yunnan Research Academy of Eco-Environmental Sciences, Kunming, China
- 4Power China ZhongNan Engineering Corporation Limited, Chang Sha, China
The ocean system provides abundant food resources and suitable habitats for numerous animal and plant species. However, the ecological health of the ocean system has deteriorated due to intensified human activities over the past decades. To mitigate negative effects, more research efforts are being directed toward marine ecological restoration programs at national and regional scales. As an effective method, artificial reefs are found to have an important role in restoring the ecological system by producing complex flow patterns and attracting more species to settle down. This study aims to select the offshore ground of Juehua Island in the Bohai Sea as an artificial reef–driven ecological restoration site, to tentatively estimate effects of square and M-shaped artificial reefs on localized flow fields, biomass production, and offshore carbon sink capacity. Meanwhile, a relatively complete carbon sink measurement system is accordingly proposed. Our results indicate that both temporal and spatial distribution of nutrients and habitat environments are dependent on flow characteristics modified by artificial reefs of different sizes, shapes, and configurations. Future ecological restoration measures in offshore waters should take carbon sink and relevant influencing factors into consideration.
1 Introduction
Intensive human disturbances to marine ecosystems have caused significant habitat loss, resulting in a decline in biodiversity and ecological services. Meanwhile, as the largest biomes in the biosphere, the ocean is also experiencing aquatic habitat degradation in many places across the globe. It has been documented that marine fisheries released at least 730 million metric tons of carbon dioxide into the atmosphere since 1950, this means an increase in fish populations to reactivate natural carbon pumps could effectively increase the ocean’s carbon sink (Mariani et al., 2020). There is an urgent need to improve the impaired ocean ecosystem. For instance, artificial reefs (ARs) appear to be able to attract and breed diverse marine organisms in a similar way as natural reefs (NRs) along coastal regions, so as to protect fishery resources and contribute to diverse marine environments. Also, many factors such as form, structure, size, and configuration of artificial reefs (ARs) have been found to influence hydrodynamic characteristics of local flow fields, especially for water bodies adjacent to deployed artificial reefs, thereby enhancing aggregation and reproduction of living marine organisms (Galdo et al., 2022). Zalmon et al. (2014) evaluated the impact of artificial reefs on an animal community structure and related it to hydrodynamic characteristics of the surrounding environments, finding that the changes in flow fields were conducive to a more rapid accumulation of organic matter. These changes in hydrodynamic characteristics within localized flow fields enable a fast carbon capture from organic matter and incorporation into the global carbon cycle due to tidal as well as oceanic currents.
Climate change is a long-standing challenge that human society must address in the coming decades. One of the well-known reasons for global warming is an increase in the amount of carbon dioxide and other greenhouse gas emissions into the atmosphere following industrial expansion and strong human activities. Therefore, effective measures for controlling and reducing carbon emissions are urgently needed. Also, the fact that total carbon emission reduction within the Earth’s original ecosystem is underlined in recent years. The ocean, which operates as the largest carbon pool on the Earth, is an important carbon source and sink, and its role in mitigating climate warming and reducing carbon emissions is increasingly recognized. The marine ecosystem absorbs and stores carbon dioxide in the atmosphere through physical and chemical reactions of non-biological components in the ocean and biological activities of marine organisms, these processes and mechanisms of carbon storage relying on the coastal vegetation ecosystem are called blue carbon, which was first coined in the 2009 UN report. The roles of mangroves, salt marshes, and seagrass beds within coastal ecosystems in carbon storage have been well documented (e.g., Bertram et al., 2021). For example, the mangrove community can be used for breaking waves, protecting coastlines, and assimilating carbon dioxide into biomass through photosynthesis, meanwhile, mangrove roots can capture suspended nutrients, particulate carbon in terrestrial ecosystems, and enhance carbon sequestration as well (Zhu and Yan, 2022). Jennerjahn (2020) estimated that the global carbon storage in mangrove sediments based on carbon accumulation rate could be 32 Tg per year. In addition to plant photosynthesis, wetland sediment is also a main carbon storage sink in the salt marsh ecosystem. Studies have shown that reed straw and biochar can effectively restore degraded salt marshes and enhance blue carbon sinks (Chen et al., 2022). The carbon sequestration in the seagrass bed ecosystem includes a high productivity of seagrass bed plants, clastic carbon capture ability in seawater, and lower decomposition of sediments (Lee et al., 2021). Mangroves, salt marshes, and seagrasses can capture nearly 50 percent of the carbon in marine sediments, but their total coverage is less than 2 percent of the world’s ocean surface. It is also shown that large algal beds in habitats associated with high water exchange rates can generate large carbon sinks around them and export large amounts of dissolved organic carbon to offshore areas (Watanabe et al., 2020). Some studies focused on ocean carbon from zooplankton and plant debris particles (i.e., carbon and water and gas exchange of dissolved CO2). Articulate carbon in water tends to change during different seasons, predictions for southern particulate organic carbon (POC) concentrations in the Baltic Sea suggest a two-to three-fold increase in late spring, as a result, the oxidation of the water below the halocline will decrease and the food supply for organisms with higher nutrient levels will increase (Dzierzbicka-Glowacka et al., 2011). The coastal upwelling currents also affect the transport of particulate carbon. Fischer et al. (2020) found a similar result, despite significant differences observed in different regions, the particulate carbon flux usually increased in springs since 2005. Phytoplankton under seawater was also found to have carbon sequestration potential, and estimates of the subscale rates of ascidians, ctenophores, ascidians, and pteropods show that their carbon sequestration capacity cannot be ignored and should be included in the carbon sink quantification model (Lebrato et al., 2013). Assessment of fluxes in the Northeast Asian Tropical Atlantic (Canary Islands) also suggests that microplankton is a major component of deep-sea carbon exportation (Ariza et al., 2015).
Nowadays, the blue carbon ecosystem has also been gradually concerned. At the same time, human activities have undoubtedly a great impact on the exchange of carbon and other substances between the land and ocean systems at the coastal interface. This is intuitively reflected in a gradual shrinkage of coastal mangroves wetland areas due to high-order expansion of human activities and massive destruction of seaweed beds and phytoplankton (e.g., algae) in water caused by pollution. Studies of coastal lagoons in Portugal have shown that hydrodynamic characteristics of dredged navigable channels affect the stability of coastal ecosystems (e.g., Harris et al., 2021; Martins et al., 2021; Gu et al., 2022). A monitoring program of seagrass ecosystems in Australia implied that human activities increased the content of CO2 sequestration but at the expense of damaging the threshold of the ecosystem (Macreadie et al., 2011). Therefore, quantitative assessments of the impact of human activities on blue carbon ecosystems become increasingly important when balancing different concerns from sociology, economics, and other fields. Nevertheless, human activities can be modified and restricted accordingly, which will produce a positive reflection. For instance, Canu et al. (2015) depicted a picture of net CO2 flux at the air–sea interface by estimating 1) carbon sink ecosystem services in the Mediterranean region by using ecological economic methods and 2) social cost of carbon emissions by combining biogeochemical models. Macroalgae (e.g., algae and kelp) may facilitate an effective use of land and water resources. However, due to the complexity involved in the calculation methods of carbon capture flow of aquatic plants, biological, physical, and social technological factors in the region are all taken into account in the measurement system. Life cycle assessment (LCA) was adopted in relevant studies along with the geographic information system (Muenzel and Martino, 2018). The net global warming potential of greenhouse gas emissions (positive) and absorption (negative), as well as the return on energy investment (EROI), were used as main indicators to assess the environmental impact of carbon capture capacity from aquatic plants at multiple phases during their life cycle. As an offshore ecosystem, salt marshes can also provide carbon sink benefits. However, a range of negative impacts of human activities (such as grazing) are inevitable, In Scotland, carbon sink benefits were evaluated by using the ecosystem service payment scheme (PES) with the necessity of human activities to be considered (Muenzel and Martino, 2018). The carbon sequestration benefit of salt marsh includes carbon reductions due to grazing of salt-marsh vegetation and carbon increases due to methane emission of livestock. By using the social cost of carbon (SCC) approach, British academics have estimated that damages to marine ecosystems, including sediment, come at a cost of $1.7 billion. A complete comparison of maintaining costs for preventing damages to salt marshes with total recovery benefits (intended to compensate for the loss of salt marshes) suggests that salt-marsh conservation works would be more economical and effective than restoration (Luisetti et al., 2019).
The blue carbon ecosystem along coastal shorelines in China varies between 1,623 and 3,850 km2 in size, and the total carbon sequestration of mangrove, salt marsh, and seagrass in China is estimated to be 162 TgC, 67 TgC, and 75 TgC, respectively (Gao et al., 2016). Mangrove forest covers an area of 32,834 hm2 in China, the carbon sequestration density of mangrove vegetation was 8,461 g C m2, and soil carbon sequestration density (1 m underground) was as high as 27,039 g C m2 (Liu et al., 2014). The seagrass bed is diverse and covers 8,765.1 km2 in China, which can be divided into the South China Sea, the Yellow sea, and the Bohai Sea. In addition, 22 species of seagrass have been identified in China, accounting for about 30% of the total number of seagrass species across the world. The total carbon storage capacity of seagrass beds in China is about 0.035 billion tons of CO2 (Huang et al., 2015). The carbon storage efficiency of seagrass beds in China is estimated to be 32,000 to 57,000 tons of CO2 based on the carbon storage rate of seagrass beds in the world. A salt marsh is one of the main types of coastal vegetation community in China, distributed in all coastal provinces. The total carbon storage capacity of salt marsh carbon sinks in China ranges between 11,200 and 31,800 tons of CO2. According to the published estimation of the carbon burial rate of salt marsh in the world, the existing salt marsh in China can capture 9,652–2,748,800 tons of CO2 per year (Jiao et al., 2018). According to the data of the Food and Agriculture Organization of the United Nations, seaweed farming can effectively capture carbon dioxide as a potential carbon sink. Some studies (Meng and Feagin, 2019) showed the ecological benefits of seaweed farming in China by obtaining the carbon concentration within seaweed tissues and production and implied that different types of seaweed have varying carbon sequestration capacity.
At present, despite numerous studies that have documented the effects of artificial reefs (ARs) in modifying hydrodynamic characteristics in offshore water bodies, there are limited information on the effect of multi-reef combination on hydrodynamics and insufficient data on turbulent flow characteristics. In this regard, the current study mainly concentrates on detailing complex flow characteristics by accounting for different reef configurations. Existing studies on marine carbon sequestration focus on the law of particulate carbon and organic carbon from a geochemical consideration, a systematic description of carbon sink measurement methods are still scarce. In addition, the current mathematical models often ignore the impact of marine fisheries on carbon sequestration, and little work has been done on comprehensive assessments of ecological restoration measures from a carbon-sequestration perspective. Again, there is also a lack of systematic consideration of carbon sink when studying the effect of hydrodynamic characteristics on marine fisheries. In this study, hydrodynamic characteristics around artificial reefs are studied through an ecological restoration project launched near the Juehua Island in the Bohai Sea of China. The response of carbon sink to varying hydrodynamic conditions is also analyzed. Based on the results of carbon sink, we further evaluate flow characteristics and ecological restoration effectiveness following artificial reef deployment and intend to develop a promising ecological restoration scheme by increasing marine carbon sink along with diverse hydrodynamic flow conditions.
2 Materials and methods
2.1 Study site
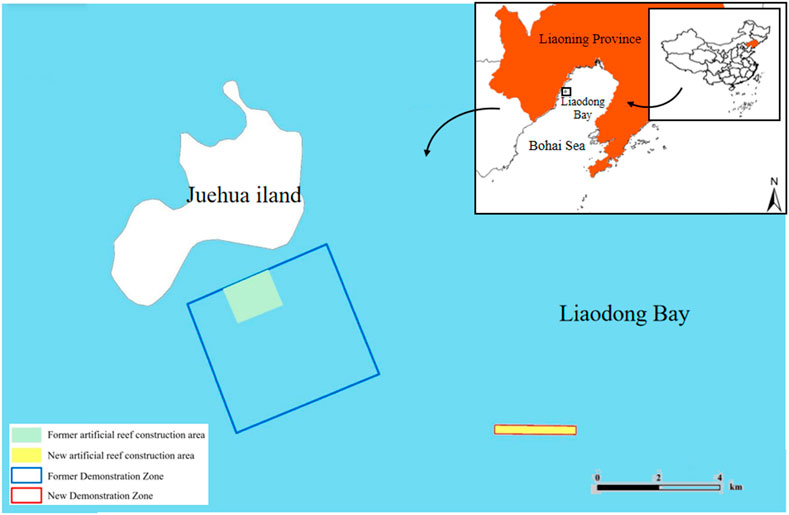
The Juehua Island National Marine Ranch, as our study site, is located on the southern coast of the Juehua Island, Huludao City, Liaoning Province (120°45′E∼ 120°52′41.17″9.63″E and 40°N ∼ 40°26′9.82″33′10.46″N, Figure 1). The tide is semidiurnal with a mean tidal range of about 2.06 m (Zhang et al., 2022), and the strength of tidal currents is ∼40 cm/s (Huang et al., 1999). Our study site has a typical medium monsoon climate, and the mean annual wind speed is about 7.1 m/s. This ranch is located 12 km from the terrestrial realm with an area of 1,377 ha. The study site is characterized by 10–20 m isobath and suitable for proliferating marine biological resources. Although artificial reefs only cover a total area of 65,987 m2, the working area of these artificial reefs within this ranch is up to 37, 170, 000 m3. Two types of artificial reefs were considered, that is, square and M-shaped reefs. A pilot site (about 39 ha) situated in the southeast of this ranch is used to evaluate the performance of artificial reefs in square and M shapes (Zhang et al., 2022). The purposes of this study are twofold: 1) to study in situ hydrodynamic changes or characteristics after deploying a series of square and M-shaped reefs; 2) to optimize physical configuration of artificial reefs (e.g., spacings) to enhance biological production.
During spring tides, the flood peak currents move north-eastward between 4° and 69° (the maximum tide of each layer measured at each station spans between 36° and 60°), and the flow direction of the average ebb currents is oppositely south-westward, between 144° and 239° (the maximum ebb tide of each layer stays within the range between 212° and 246°). During neap tides, the rising tides move also toward northeast and vary from 8° to 49° (the maximum flood tide is between 10° and 82°), whereas the average ebb currents propagate toward southwest and stand between 36° and 228° (maximum ebb tide straddles over the range of 206°–236°). The maximum surge tide and the maximum ebb tide transport in directions consistent with their counterparts of the average surge tide and the average ebb tide (i.e., the flow direction of the maximum surge tide is oriented from southwest to northeast, and the flow direction of the maximum ebb tides is reversed from northeast to southwest). In the spring tide period, the residual flow velocity falls within the range of 2.1–8.9 cm/s. During neap tides, the residual flow velocity varied from 4.4 to 21.7 cm/s. The variation of ocean current in the study area has a marginal influence on the placement of artificial reefs, this means the study area is suitable for marine pasture development.
2.2 Artificial reef (AR) arrangement
Figure 2 shows typical square and M-shaped artificial reefs considered in the present study. The square artificial reef (prototype) size is 3.5 m long, 3.5 m wide, and 1.5 m high, and the M-shaped reef (prototype) size is 3.0 m long, 3.0 m wide, and 2.2 m high. An optimization technology for artificial reefs was tested at a smaller scale (i.e., 8.46 ha) in relative to the size of the pilot site (i.e., 39 ha). Field observations suggested that the optimum spacing is 23.57 and 22.43 m for single M-shaped and square reef configuration, respectively, when all these artificial reefs were deployed along wave direction (Shu et al., 2021a).
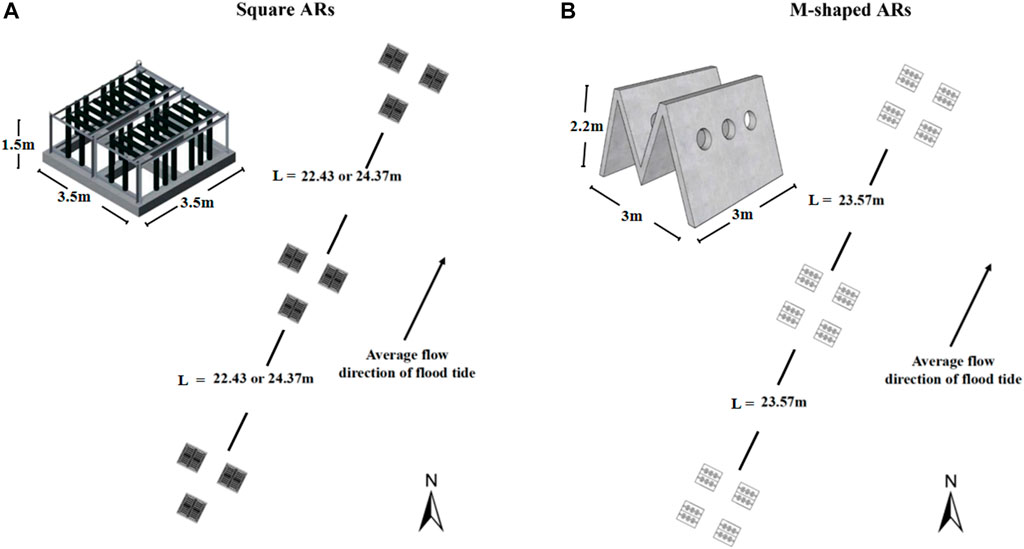
FIGURE 2. Square (A) and M-shaped (B) artificial reefs placed in the pilot site with three and four reefs making up the respective unit group, black arrow highlights flow direction.
A total of 1,650 M-shaped reefs, 675 square reefs, and 1,232 cubic fish attraction and conservation reefs were placed in the extended pilot site, their configurations are shown in Figure 2. In addition, there are 136 M-shaped breeding reefs and 168 square ecological reefs were installed in the optimized zone according to the optimum spacing as described earlier.
2.3 Experimental setup
The experiment was conducted in a long tilting flume (Length: 25.00 m, width: 0.80 m, height: 0.80 m) at Beijing Normal University. An acoustic Doppler current velocimetry (ADV) was installed 1–2 m in front of the artificial reefs to measure the inflow velocity. The size of the artificial reef model in the experimental flume is scaled to be 1:50 from a prototype. The hydrodynamic characteristics of the artificial reef at four different spacing were investigated. The physical model of different layout spacing of reefs are tested under different flow velocity (i.e., 0.085 m/s, 0.130 m/s, 0.170 m/s, 0.214 m/s, and 0.257 m/s), meanwhile, the particle image velocimetry (PIV) technology was applied to quantify the flow fields generated around artificial reefs. Detailed information about the experimental protocol and physical model of artificial reefs can be found in Shu et al. (2021b; 2021c).
Basic parameters including the length, height, and area were used to describe the variability of flow fields due to the presence of artificial reefs, particularly for upwelling and vortex flow produced around artificial reefs. The maximum upwelling velocity umax-up and the average upwelling velocity uup were measured to describe the intensity of the upwelling, and the maximum upwelling height Hmax-up, the maximum upwelling length Lmax-up, and the total upwelling area Aup were used to characterize the spatial scale of the upwelling. The height of the upwelling was calculated with the bottom of the reef as the zero point. At present, there is no unified standard definition for the upwelling phenomenon. Based on previous research results identified in the literature (e.g., Yu et al., 2004), this study defines an upwelling flow field as a region where the ratio between the vertical velocity and the incoming velocity is greater than or equal to 10 percent. Similarly, the parameters including maximum height Hmax-bs, the maximum length Lmax-bs and the total area Abs were used to characterize the scale and magnitude of the back vortex.
2.4 Entropy weight method
Suppose there are n objects in an evaluation index system (n1, n2, … , nn) with m indicators (m1, m2, … , mm). Let Xij denote the j-th index (j = 1, 2, 3, …, m) of the i-th evaluation object (i = 1, 2, 3, …, n), the original data related matrix X is then obtained as
The original data were made dimensionless to eliminate the dimensional influence, and the relative contribution of the i-th evaluation object under the j-th indicator is thus calculated as follows
Here, the entropy of the j-th index (ej) can be determined using the following relation.
where
Finally, a comprehensive score of each index of the i-th evaluation object (Yi) can be achieved as
2.5 Estimation of net carbon sink
In addition to the carbon sink contribution from offshore wetlands in the original blue carbon system, offshore regions in other kinds of land uses also mean significant carbon sinks. In the existing studies, the main contributor of carbon sink around the offshore region is the phytoplankton. Sometimes, the increase of carbon sink in the coastal waters can also be partially attributed to aquatic animals, particularly in coastal regions of China with rich fishery resources, which can become an effective carbon sink by means of biological fixation (harvesting and forming shells from seawater) and seawater absorption, therefore, diverse aquatic species will have both economic and ecological implications. In this study, artificial reefs were placed in the study site near Juehua Island, offshore of the Bohai Sea, which increased the number of fish and other aquatic animals and demonstrated an impact on carbon sink. The carbon sink was estimated according to its main sources and processes, and the carbon sink effect caused by human disturbance is also evaluated.
After identifying the main sources of ocean carbon emissions and absorption, the following equation for calculating offshore carbon sinks can be obtained.
where
2.5.1 Biological carbon sinks
Marine biological resources are rich, including macroalgae, shellfish, zooplankton, and macrobenthos. Indeed, existing studies have shown controversial views on the carbon sequestration function of marine animals. Both organic and inorganic carbon in the water can be consumed during the growth process of sea creatures, for example, shellfish can filter organic detritus in the water, and algae can fix and deposit inorganic carbon through photosynthesis. Human activities, such as massive sea fishing, lead to the removal of many creatures into a more complex ecosystem, that is ., carbon circulation through human ingestion, decomposition, and discharge. Thus, the increase in the carbon sink of marine life is represented by the carbon fixed by algae growth (
The effect of human intervention on carbon sequestrations by native phytoplankton in the ocean is only considered in terms of the changes in carbon sinks caused by cultured algae. The estimation method of algae carbon sink is given below following related studies on the varieties of marine algae in China (i.e., kelp, Ulva, wakame, and Gracilaria are major contributors to the amount of carbon sink).
in which

TABLE 1. Algal carbon content according to Zhang et al. (2005).
Shellfish, on the one hand, can reduce inorganic carbon in sea water by absorbing HCO3− to form calcium carbonate shells, on the other hand, it can absorb organic carbon in water through filter feeding (Fodrie et al., 2017). It is estimated that the amount of carbon removed from China’s offshore waters by harvesting and breeding shellfish is approximately 700,000–990,000 tons per year. Based on previous research, the main shellfish breeding varieties in China’s offshore waters are shown in Table 2, the carbon sink of shellfish is estimated as follows:
where

TABLE 2. Mass and carbon content within mollusk tissue and shellfish following Yue and Wang (2012).
As a benthic creature, crab is considered as a carbon sink because the hard shell is generated during its growth process. The shell contains a large amount of carbon and can exist in nature for a long time. The carbon sink of crab is calculated as follows:
where
2.5.2 Carbon emissions
Since it is difficult to measure the amount of carbon dioxide produced by biological respiration in the ocean, the ratio of carbon dioxide produced by biological respiration to biological oxygen consumption then is used to estimate the amount of carbon dioxide production:
where

TABLE 3. Oxygen consumption rate of marine organisms invoked from recent studies (e.g., Xu, 2014; Yu et al., 2017; Hu et al., 2021).
2.5.3 Carbon storage
Marine carbon storage mainly consists of dissolved carbon dioxide in seawater and carbon deposited in sediment.
where
3 Results
3.1 Ecological evaluation of artificial reefs
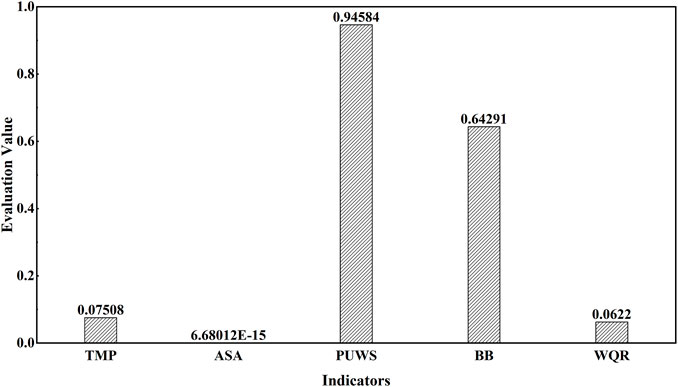
In order to estimate the status of marine resources and ecological environment in the Bohai Sea and make a comprehensive evaluation of artificial reef (AR) performance, the entropy weight method (EWM) was used to evaluate the environmental carrying capacity in the study site near Juehua Island. According to previous studies, it has been found that the pressure on the marine environment mainly comes from the disturbance of human activities, and the diversity of aquatic animals in the ocean and the water quality can be used as indicators to reflect changes in the marine ecological environment. A pressure-state-response model was constructed, where the total amount of pollutants in the sea and the area of the study site were selected as pressure indicators, the proportion of unclean water surface and benthic biodiversity was applied as status indicators, and the water quality of rivers into the sea was response indicator. The original data were compiled from China Marine Ecological Environment Bulletin. According to the procedure of the entropy weight method, the weight for each indicator can be obtained and given in Table 4.

TABLE 4. Relative importance (i.e., weight) of indicators in the pressure-state-response model determined through the entropy weight method (EWM) for the study site.
According to the weight analysis of each indicator, Figure 3 shows that the proportions of unclean water surface and benthic biodiversity are the most significant indicators in reflecting pressure on the eco-environmental system within our pilot site (i.e., their weights are 0.49 and 0.43, respectively, Table 4). Indeed, the influence of ocean water quality on the marine ecosystem has been confirmed in previous studies, a pond–wetland complex with constructed root channel technology is used for water quality restoration at the land–water boundary (Wang et al., 2021). Because the control and implementation methods are diverse and relatively simple, the restoration effect is less obvious. As an important indicator, the diversity of aquatic organisms primarily affects the health of the marine ecosystem. By improving aquatic biodiversity, ecosystems impaired due to human-activity disturbances can be well rehabilitated. Also, increased fish sink caused an increased marine sink, which has affected the aquatic biodiversity in the Bohai Sea. To change the biological distribution in the Bohai Sea and restore ecological services, the measures for fish attraction and enhancement through artificial reefs were found to be able to change the biodiversity of the offshore to some extent, thereby changing the status of the offshore carbon sink and affecting the coastal ecosystem.
3.2 Hydrodynamic characteristics of artificial reef–induced flows
Hydrodynamic characteristics of flow fields near artificial reefs at a given spacing and flow rate within a series of flume-based experiments are quantified by analyzing basic parameters associated with upwelling, backswirl, vortex, and turbulent flows (more details for flume experiments can be found in our earlier works, e.g., Shu et al., 2021b; 2021c), the results for hydrodynamic characteristics due to the presence of both M-shaped and square artificial reefs in a laboratory flume were proportionally scaled up to prototype magnitude and detailed in Tables 1, 2. One can observe that the M-shaped reef is superior to the square reef in terms of developing more complex flows. As flow velocity increased, a set of characteristic parameters used to describe upwelling and back vortex, including length and height and total area, are generally shown to increase as well. For a given flow rate, the characteristic parameters for upwelling and back vortex in the square reef case increase first and then followed by a decrease with the reef spacing increasing from 0.75 to 1.50 L (note: L is the spacing between the artificial reef monocases group in the study site, Figure 2). In contrast, the characteristic parameters of upwelling flow and back vortex in the M-shaped reef case attained their maximum values at the 1.25 L spacing. It is interesting to find that characteristic parameters for upwelling and vortex induced by M-shaped artificial reefs were usually larger than those of square-reef counterparts, meaning complex flows produced by M-shaped artificial reefs were of a larger spatial scale. In this regard, M-shaped reefs are more useful in developing marine pasture around coastal regions. More details are given in the following section.
3.2.1 Upwelling flows
In this study, the spatial extent to which the ratio of vertical flow velocity (UV) to incoming flow velocity u0 being higher than or equal to 0.1 was defined as the upwelling flow region. For square and M-shaped reefs, the distribution of upwelling flows exhibits the similar feature, namely, local upwelling flow usually developed above the surface of the first reef in each group and is followed by a fan distribution of vortex around the reef center, the largest reef upwelling flow region usually was found on the stoss side of the first monomer, the spatial scale of upwelling flows produced by artificial reefs gradually decreased with streamwise distance.
As shown in Figure 4 (also Tables 5, 6), a remarkable difference concerning the upwelling flow area and maximum velocity can be easily identified between M-shaped and square artificial reefs. For example, the maximum upwelling area formed by the M-shaped artificial reef (i.e., 35.2735 m2) is almost one order-of-magnitude higher than that of the square artificial reef (3.29 m2). Such a difference can be explained by the artificial reef structure (Gui et al., 2015), that is, the M-shape artificial reefs are designed to have a solid structure with three smaller openings on each side and thus act as barriers for flow entering and exiting ( Figure 2); the square artificial reefs are built to have a hollow structure, which permits a quick flow pass with less resistance (Figure 2). Moreover, the M-shaped reef was set as about 1.5 times the height of the square reef, this results in flow blockage across a larger spatial scale Qin (2021).
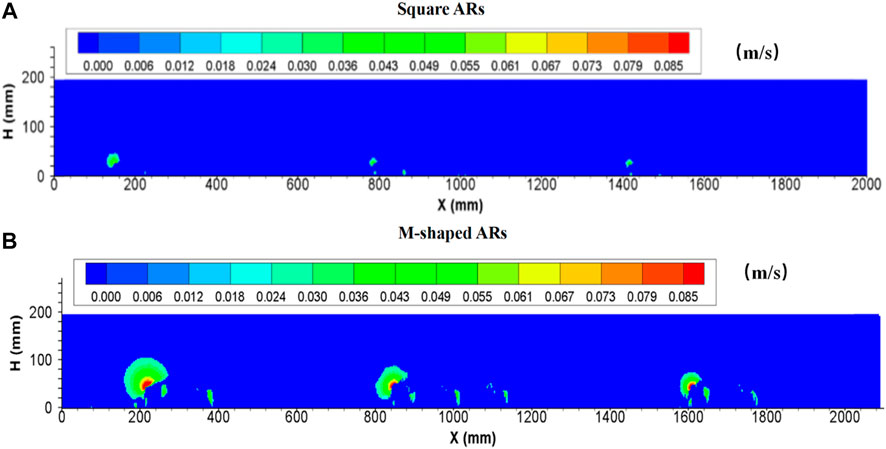
FIGURE 4. Side view of upwelling flows produced by (A) square ARs and (B) M-shaped ARs (Shu et al., 2021b) under the same experimental condition.
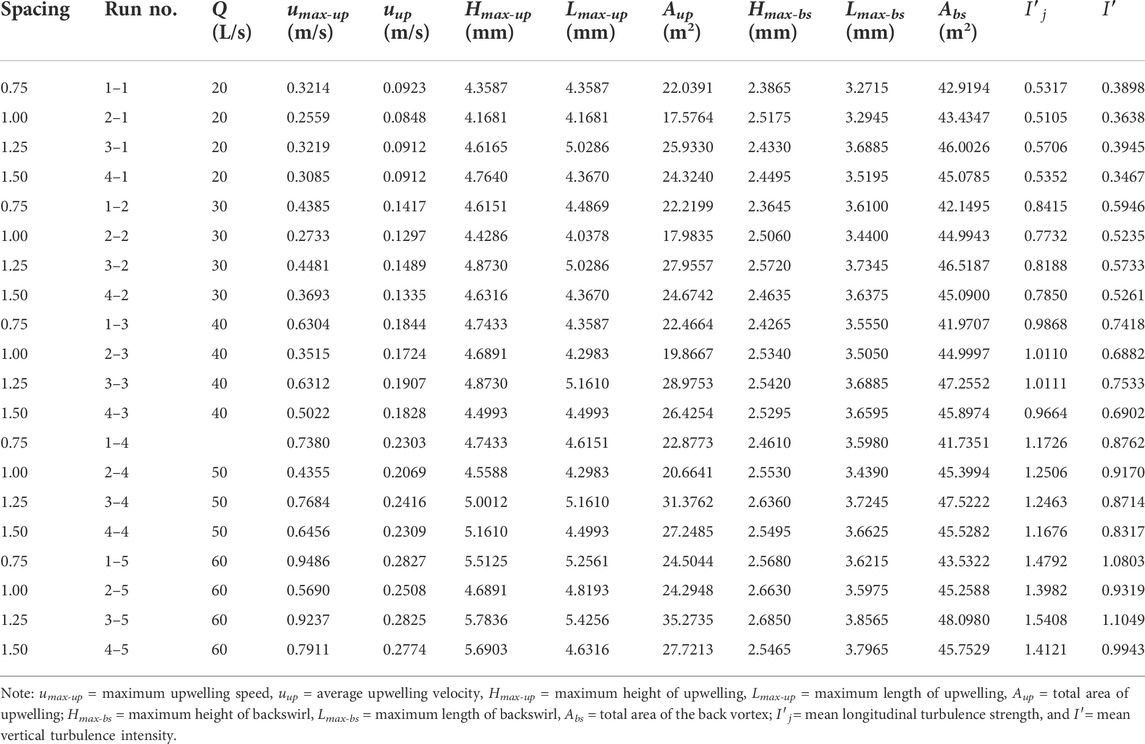
TABLE 5. Summary of hydrodynamic characteristics due to M-shaped reefs according to the flume-based study.
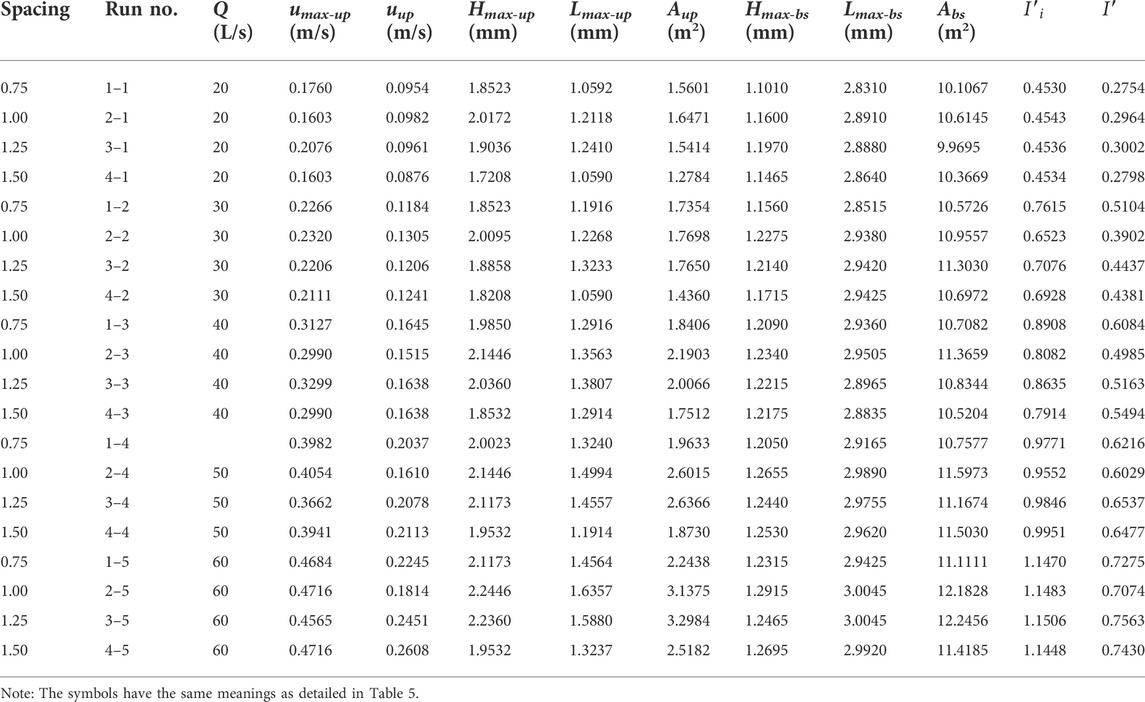
TABLE 6. Summary of hydrodynamic characteristics due to square reefs according to the flume-based study.
3.2.2 Back vortex
Similarly, the back vortex region is characterized by slow whirlpools on the lee side and/or inside of a single reef. The maximum height of the back vortex Hmax-bs, the maximum length of the back vortex Lmax-bs, and the total area of the back vortex Abs are used to represent the scale of the back vortex. The bottom of the reef was used as a reference datum to calculate the height of the back vortex. For square reefs, under a large range of flow conditions, eddy currents caused by artificial reefs reveal a similar behavior, the back vortex around the first reef monomer in each group is obviously larger than the following eddies. For M-shaped reefs, the back vortex was usually observed between adjacent individual reefs as well as the backside of the last individual reef in each group. Similar to the square-reef case, the characteristic parameters of back eddy currents due to M-shaped reefs at four distances show a positive relationship with velocity.
The values for parameters to describe back eddies induced by M-shaped square and artificial reefs were also compared. It is seen that the size of back eddy current generated by M-shaped reefs is larger than its equivalent caused by square reefs, in particular, a total area of back eddy currents in the former condition is up to about four times higher than that in the latter scenario, which can be attributed to several factors. First, this is because the M-shaped reefs have tilting ramps to force flow to halt and block to a greater degree. Second, the distance between the M-shaped reef group is slightly shorter than that of the square reef group. Third, one more M-shaped artificial reef with very small and limited number of openings is placed in the first row within each reef group, consequently, the flow is severely disturbed under the dual influence of the frontal and tail reefs; thus, a larger scale back vortex is formed in the M-shaped reef configuration.
3.2.3 Longitudinal velocities
Earlier studies suggested that the existence of artificial reefs appears to have an inhibiting effect on flow propagation (e.g., Shu et al., 2021b, 2021c; Harris et al., 2021; Gu et al., 2022). The incoming flow velocity abruptly reduced in the front of artificial reefs, and then the flow separation occurred around the top of the first reef (Figure 5). The flow velocity at the flow separation point increased dramatically, which was significantly different from the flow conditions in the vicinity. The longitudinal velocity of the wake decreases sharply with increasing distance from the separation point, this may assist in forming a distant low flow velocity zone with a moving boundary Qin (2021). This boundary rises gradually from the flow separation point until the maximum level was reached at the second reef group, then declines slightly and finally becomes stable. This is in stark contrast to the longitudinal velocity field without artificial reefs, the vertical length scale with velocities below 0.2 m/s is about ∼2 times higher than the height of an individual reef. Beyond this vertical length (i.e., the flow velocity demarcation line), the longitudinal flow velocities are very similar to those observed under flow conditions without artificial reefs. Meanwhile, the average longitudinal velocity near the bed (or artificial reefs) represents a reduction of nearly 75% in relative to measured velocity under no-artificial-reef flows, implying that flow resistance is more obvious due to the presence of artificial reefs.
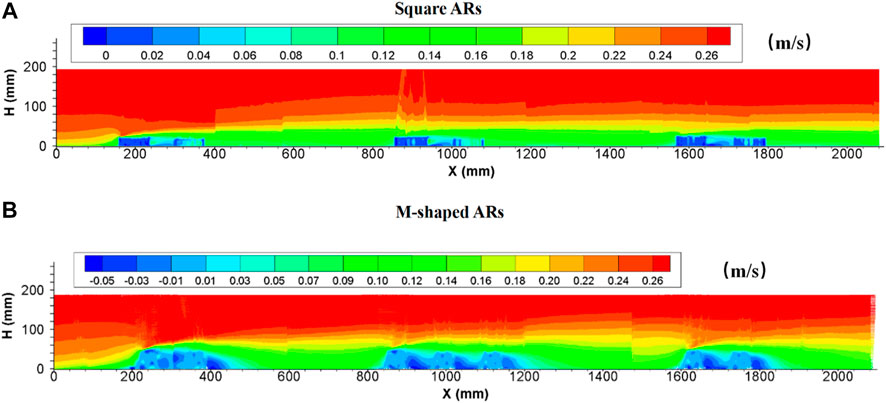
FIGURE 5. Side view of longitudinal velocity field due to the presence of (A) square ARs and (B) M-shaped ARs under the same experimental condition.
Following the deployment of M-shaped reefs, the spatial distribution pattern of longitudinal velocity was consistent with square-reef situations under the same experimental conditions, both descend and ascend of flow separation point and boundary were well identified, and the vertical length scale with velocities lower than 0.2 m/s is 2.3 times the M-shaped reef height; also, the averaged longitudinal velocity near the bed is decreased to 42% due to the presence of M-shaped artificial reefs, reductions in flow velocity is substantial, especially in the proximity to concrete reefs, due to the appearance of inverse flow velocity originated from eddy currents. Overall, the M-shaped reefs tend to have a relatively strong effect in modifying flow fields as well as flow velocities than the square reefs, which can be primarily attributed to the difference in reef structure highlighted earlier.
3.2.4 Vertical velocities
After a series of square artificial reefs were placed on the bed at a given spacing, the vertical flow velocity often reaches the maximum value in the front or around the top of the first single reef in each group, and the vertical velocity field extends outwardly with the vortex center and turns out to be in an arc distribution. The maximum vertical velocity produced by artificial reefs gradually decreased along the flow direction, this behavior is consistent with the changing behaviors of upwelling flows. Also, it can be found that the presence of artificial reefs can enhance current turbulence and spatial changes associated with the entire vertical velocity domain if compared with the flow fields devoid of artificial reefs. Vertical flow velocities increased around the reef and decreased when the flow was transported far away from the artificial reef. The vertical profile of velocity owing to the presence of M-shaped artificial reefs is largely consistent with square reef–induced counterparts; however, M-shaped reefs seem to be able to change vertical flow velocities to a greater degree than square reefs ( details in Figure 6).
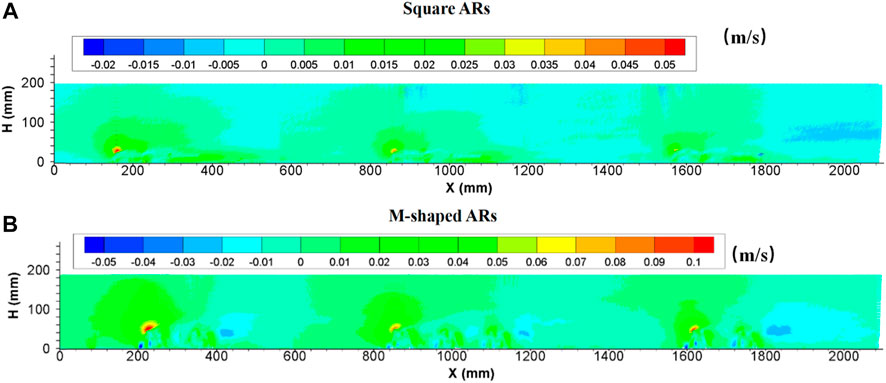
FIGURE 6. Side view of vertical velocity field following the presence of square ARs (A) and M-shaped ARs (B) under the same experimental condition.
3.2.5 Characteristics of turbulence intensity
Since the introduction of the square artificial reef into water bodies, the region subject to artificial reef disturbance was totally filled with strong turbulent flows. The turbulence intensity at the upperstream inlet was practically the same as in flows without artificial reefs, then started to increase suddenly in the front of the first artificial reef and maintained at an incremental rate by following downstream artificial reefs. The turbulent flows are enhanced when arriving to the second reef group, attenuated slightly and then become stabilized, thus forming a distinct turbulence boundary. The longitudinal turbulence intensity is obviously larger than the vertical turbulence intensity in terms of magnitude and extent of influence. The maximum height of this distinct boundary is nearly four times the artificial reef height. In terms of the length of a perturbation along the flow direction, the local flow perturbation length of the longitudinal turbulent strength (
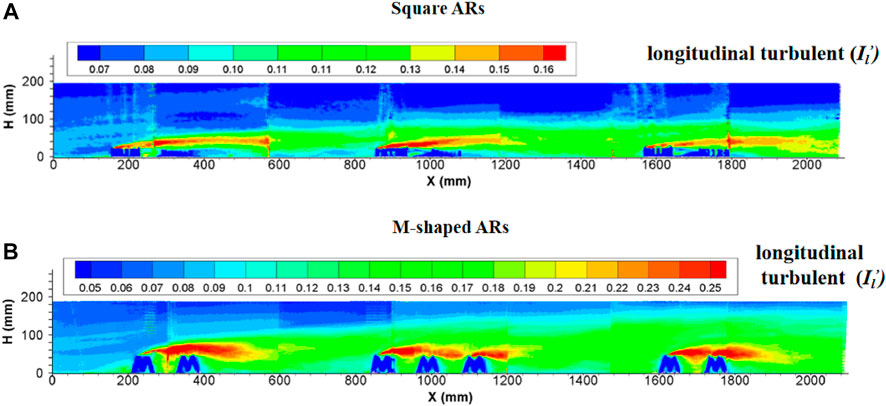
FIGURE 7. Side view of longitudinal turbulence intensity enhanced by (A) square ARs and (B) M-shaped ARs (Shu et al., 2021c) under the same experimental condition.
The turbulence currents caused by both square and M-shaped artificial reefs are very similar in many aspects discussed earlier. For each experiment, the magnitude of longitudinal turbulence intensity is higher than the vertical turbulence intensity (Figures 7, 8). The maximum height of the vertical turbulence intensity is about four times the M-shaped reef height, the vertical turbulence intensity is roughly three times higher than the reef height. In terms of the perturbation flow length along the streamwise direction, the local flow perturbation length of the longitudinal turbulent intensity (>2.0) is 7–9 times of reef height, whereas the flow perturbation length of the vertical turbulent intensity (>0.16) is 3–5 times of reef height. Comparatively, the M-shaped reefs have a larger effect on the turbulence intensity than the square reefs Qin (2021).
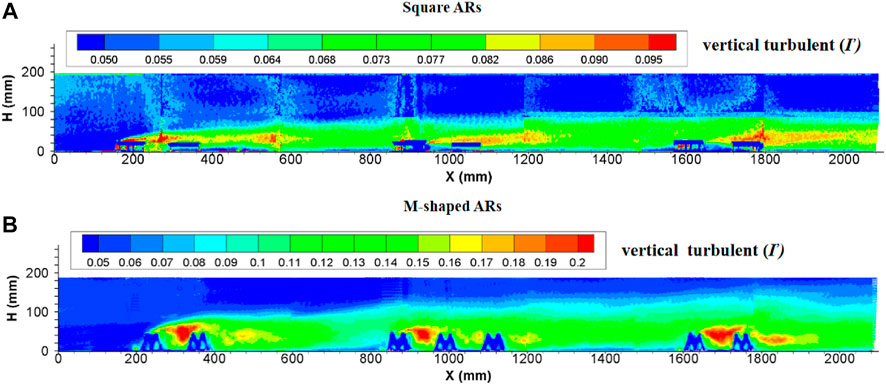
FIGURE 8. Side view of vertical turbulence intensity induced by (A) square ARs and (B) M-shaped ARs (Shu et al., 2021c) under the same experimental condition.
3.3 Net carbon sink
Field investigations of underwater cages indicated that biological resources beneath the coastal water of Juehua Island have been significantly improved. It is shown from Figure 9 that the number of biological resources in the pilot reef area (i.e., 75.25, 142.33, 298.77, and 104.7 g/cage/day) was usually higher than that measured across the control area (i.e., 43.54, 114.36, 168.79, and 55.51 g/cage/day) at the same time from July 2019 to October 2021. The growth rate for biological resources in the artificial reef working area is up to 72.81%, 24.45%, 77.00%, and 88.62% during the last 4 years if compared with those in the contrasting control area devoid of artificial reefs, indicating artificial reefs with certain configuration appear to have a positive impact on enhancing marine biological resources.
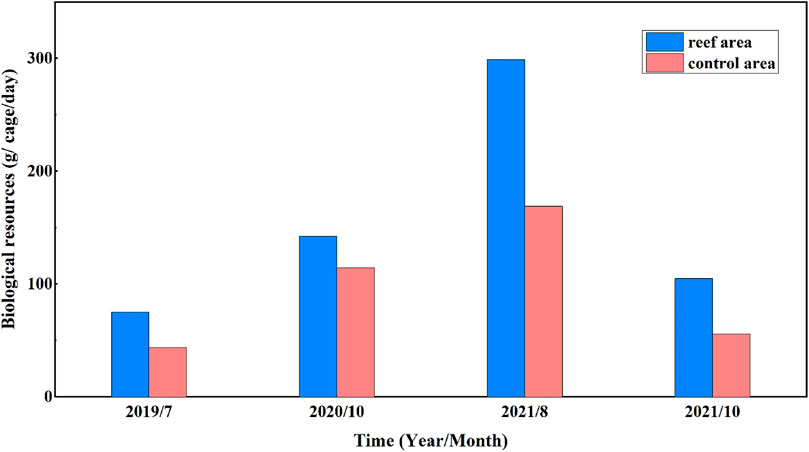
FIGURE 9. Comparison of biological resources in the artificial reef working site and contrasting control area.
The results of our calculated carbon sinks for the study site are given in Table 7. Flow characteristics near the Juehua Island are unsurprisingly modified by numerous artificial reefs deployed on purpose, which certainly reshapes the temporal and spatial distribution of nutrients, creates a desirable habitat environment for fishes, and finally leads to an increasing fishery carbon sink. In contrast, the biological net carbon sink is very low (i.e., 0.073) and shows a less-evident change, which mainly could be explained by different carbon sink contributions from different species of organisms. There are fewer crustaceans on the Juehua Island, which implies that a lower carbon sink contribution with higher carbon emissions may occur instead. In addition, Flounder was the primary breeding fish released to the Juehua Island study area, therefore, its carbon sequestration could not be stored in the ocean over a long time and the related net carbon sequestration was low. Compared with many different ecological restoration measures taken across coastal islands somewhere else in China, the Juehua marine ranch is not developed by pursuing economic benefits from higher organisms (e.g., including long-term carbon sequestration creatures such as mussels), which in turn makes Juehua Island biological net carbon sequestration on a lower level. In addition, crustaceans also represent as a marine carbon sink. In our calculation method, the difference of ocean carbon storage and influences of meteorological factors are not considered, but instead, our attention is shifted to the changes in carbon sink caused by living organisms and their activities. A parallel comparison of the relative contribution of various carbon sinks within the study site shows that the marine carbon storage is the most dominant marine carbon sink, which is regarded as static in this study, and the changes caused by meteorological factors can be reasonably ignored.
Considering the fact that the spatial scale of upwelling and back vortex induced by M-shaped artificial reefs (ARs) is approximately eight times than that by square artificial reefs (ARs), both carbon emission and carbon sinks for Juehua Island offshore ground are estimated on the basis of the total area of kindred artificial reef and additional area due to artificial reef influence. It is noted here that the offshore ground attached with M-shaped artificial reefs (ARs) is only three times larger than those with square artificial reefs (ARs), but the total amount of carbon sink potential of the Juehua Island offshore from M-shaped artificial reefs (ARs) deployed ground is almost seven times higher than that from the square artificial reefs covered region (Table 7), this clearly demonstrates a dominant role of M-shaped artificial reef in restructuring near-bed flow conditions and its influence on local carbon sink capacity.
4 Discussion
The main objective of ecological restoration in the pilot site of Juehua Island is to improve the aquatic biodiversity. The current ecological restoration measures include an optimization of breeding/releasing technology and artificial reef configuration. The former not only contains the nutrient link with a high ecological transfer efficiency by reconstructing the food network, and but also selects the appropriate breeding varieties and the flow conditions through accounting for local species, economic value, resource shortage degree, seedling breeding basis, and other factors. The latter improves the ecological environment by effectively deploying artificial reefs. Artificial reefs affect the tempo-spatial distribution of nutrients and their corresponding environment by modifying the local hydrodynamic characteristics. These artificial reefs seem to change water movement, and the incoming flow appears to be subject to flow separation, the incoming flow is partially uplifted to form upwelling currents, and the remaining part passes through the reef and generates eddy currents. Upwelling flows can promote seawater exchange vertically, and increase nutrient transport from sea bottoms to surface layers, this process help improve marine primary productivity by enhancing the bait effect and attracting more fish to gather around artificial reefs. On the back side of the reef, a vortex zone with low speed and stable structure will be generated, which is conducive to the nutrients settling and provides a man-made habitat for fish to settle down, and avoid enemies and rope bait. In this sense, a promising ecological and economic marine pasture can be achieved if artificial reefs (with a proper shape, size, and configuration) enable a reproduction of complicated flow conditions and diverse habitats. Nevertheless, the effectiveness of artificial reefs for marine ecological restoration should be assessed over a larger timescale because ecological succession changes and flow condition changes are not comparable.
There are also limitations associated with the present study. First, our understanding of offshore hydrodynamic characteristics produced by artificial reefs still remains incomplete, the primary reason is that our flume-based experiments use unidirectional flows, which is a simplified representation of complex rotating flows in the Juehua offshore, this also makes our interpretation of biological aggregation as a result of artificial reef deployment inadequate, such complex flows should be accounted for in future studies when conducting laboratory experiments. More importantly, the increase in offshore biological resources as well as production due to the presence of artificial reefs is often measured at a multi-decadal scale if compared with instantaneous flow changes due to the artificial reef deployment, this means the effect of artificial reefs on enhancing biological resources appears less convincing within short periods of time (e.g., Figure 9), our ongoing field surveys should last at least for several decades. Third, the present study of carbon sequestration only involves dominant algae and crustaceans in this region, our estimation strongly depends on a simple sampling technique (i.e., hanging basket capture). However, other marine fauna and flora are available in the Juehua offshore as well (e.g., Charybdis japonica), these uncertainties underline the importance of a more comprehensive study in the further research efforts.
5 Summary
The ocean plays an important role in carbon capture, and both hydrodynamic and ecological conditions to dictate reproduction and aggregation of organisms in the marine ecosystem largely determine carbon capture potential on offshore grounds. A set of artificial reefs designed in square and M shapes were deployed on a laboratory flume bed to generate complex flows. Because artificial reefs are able to cause flow halt and block, thereby producing well-developed upwelling and back eddy currents. It has been found that the flow turbulence increase with flow velocity and can be enhanced due to the presence of artificial reefs, particularly in the M-shaped artificial reef configurations. Both magnitudes and spatial scales of upwelling flow and back vortex induced by M-shaped reefs are obviously greater than those in square-reef cases, which is more conducive to creating an environment suitable for marine lives.
Diverse flow conditions due to the presence of artificial reefs somehow support the accumulation of marine lives, which could potentially increase the number of organisms and drive the growth of carbon sinks. However, our estimation in the present study site showed that 1) the M-shaped artificial reefs are the primary contributor to the carbon sink potential of the Juehua Island offshore in the carbon sink; 2) the carbon sink in this region brought from biological aggregation was not as high as expected, which was mainly due to limited marine biological species of Juehua offshore that can be accounted for. Therefore, the introduction of appropriate and non-invasive species should be carefully considered during the development of efficient marine pasture rather than only increasing artificial reef–induced disturbances to local flow fields.
Data availability statement
The original contributions presented in the study are included in the article/Supplementary Material; further inquiries can be directed to the corresponding author.
Author contributions
AS: conceptualization and supervision; ZZ: formal analysis and writing–original draft; LW: conceptualization and writing–original draft; TS, WY, JZ, and FZ: analysis and suggestions; JQ: experiments and analysis.
Funding
The research reported in this manuscript is funded by the National key research and development plan (Grant No. 2018YFC1406404), the Natural Science Foundation of China (Grant Nos U1901212 and 52009041), and Fundamental Research Funds for the Central Universities (Grant No. 2020MS024), and the Beijing Advanced Innovation Program for Land Surface Science.
Conflict of interest
FZ is employed by Power China ZhongNan Engineering Corporation Limited.
The remaining authors declare that the research was conducted in the absence of any commercial or financial relationships that could be construed as a potential conflict of interest.
Publisher’s note
All claims expressed in this article are solely those of the authors and do not necessarily represent those of their affiliated organizations, or those of the publisher, the editors, and the reviewers. Any product that may be evaluated in this article, or claim that may be made by its manufacturer, is not guaranteed or endorsed by the publisher.
References
Ariza, A., Garijo, J. C., Landeira, J. M., Bordes, F., and Hernandez-Leon, S. (2015). Migrant biomass and respiratory carbon flux by zooplankton and micronekton in the subtropical northeast Atlantic Ocean (Canary Islands). Prog. Oceanogr. 134, 330–342. doi:10.1016/j.pocean.2015.03.003
Bertram, C., Quaas, M., Reusch, T. B. H., Vafeidis, A. T., Wolff, C., and Rickels, W. (2021). The blue carbon wealth of nations. Nat. Clim. Change. 11 (8), 704–709. doi:10.1038/s41558-021-01089-4
Canu, D. M., Ghermandi, A., Nunes, P. A., Lazzari, P., Cossarini, G., and Solidoro, C. (2015). Estimating the value of carbon sequestration ecosystem services in the Mediterranean Sea: An ecological economics approach. Global Environ. Chang. 32, 87–95. doi:10.1016/j.gloenvcha.2015.02.008
Chen, G., Bai, J., Yu, L., Chen, B., Zhang, Y., Liu, G., et al. (2022). Effects of ecological restoration on carbon sink and carbon drawdown of degraded salt marshes with carbon-rich additives application. Land Degradation & Development (Chichester, UK: John Wiley & Sons, Ltd.), 1–12. doi:10.1002/ldr.4306
Dzierzbicka-Glowacka, L., Kulinski, K., Maciejewska, A., Jakacki, J., and Pempkowiak, J. (2011). Numerical modelling of POC dynamics in the southern Baltic under possible future conditions determined by nutrients, light and temperature. Oceanologia 53 (4), 971–992. doi:10.5697/oc.53-4.971
Fischer, G., Neuer, S., Ramondenc, S., Muller, T. J., Donner, B., Ruhland, G., et al. (2020). Long-Term changes of particle flux in the canary basin between 1991 and 2009 and comparison to sediment trap records off mauritania. Front. Earth Sci. 8, 21. doi:10.3389/feart.2020.00280
Fodrie, F. J., Rodriguez, A. B., Gittman, R. K., Grabowski, J. H., Lindquist, N. L., Peterson, C. H., et al. (2017). Oyster reefs as carbon sources and sinks. Proc. R. Soc. B 284, 20170891. doi:10.1098/rspb.2017.0891
Galdo, M. I. L., Guerreiro, M. J. R., Vigo, J. L., Rodriguez, I. A., Lorenzo, R. V., Couce, J. C. C., et al. (2022). Definition of an artificial reef unit through hydrodynamic and structural (CFD and FEM) models—application to the ares-betanzos estuary. J. Mar. Sci. Eng. 10 (2), 230. doi:10.3390/jmse10020230
Gao, Y., Yu, G., Yang, T., Jia, Y., He, N., and Zhuang, J. (2016). New insight into global blue carbon estimation under human activity in land-sea interaction area: A case study of China. Earth-Science Rev. 159, 36–46. doi:10.1016/j.earscirev.2016.05.003
Gu, S., Zheng, W., Wu, H., Chen, C., and Shao, S. (2022). DualSPHysics simulations of spillway hydraulics: A comparison between single-and two-phase modelling approaches. J. Hydraulic Res., 1–18. doi:10.1080/00221686.2022.2064343
Gui, Q., Dong, P., Shao, S., and Chen, Y. (2015). Incompressible SPH simulation of wave interaction with porous structure. Ocean. Eng. 110, 126–139. doi:10.1016/j.oceaneng.2015.10.013
Harris, L., Liang, D., Shao, S., Zhang, T., and Roberts, G. (2021). MPM simulation of solitary wave run-up on permeable boundaries. Appl. Ocean Res. 111, 102602. doi:10.1016/j.apor.2021.102602
Hu, F. W., Wang, X. L., Gao, F. X., Li, L., Jian, Y. X., Wang, X., et al. (2021). Influence of temperature, salinity, and anesthetics on the oxygen consumption and ammonia excretion rates in fat greenling(Hexagrammos otakii) juveniles. Mar. Sci. 45, 54–61. (in Chinese).
Huang, D., Su, J., and Backhaus, J. O. (1999). Modelling the seasonal thermal stratification and baroclinic circulation in the Bohai Sea. Cont. Shelf Res. 19 (11), 1485–1505. doi:10.1016/S0278-4343(99)00026-6
Huang, Y. H., Lee, C. L., Chung, C. Y., Hsiao, S. C., and Lin, H. J. (2015). Carbon budgets of multispecies seagrass beds at dongsha island in the south China sea. Mar. Environ. Res. 106, 92–102. doi:10.1016/j.marenvres.2015.03.004
Jennerjahn, T. C. (2020). Relevance and magnitude of 'Blue Carbon' storage in mangrove sediments: Carbon accumulation rates vs. stocks, sources vs. sinks. Estuar. Coast. Shelf Sci. 247, 107027. doi:10.1016/j.ecss.2020.107027
Jiao, N., Liang, Y., Zhang, Y., Liu, J., Zhang, Y., Zhang, R., et al. (2018). Carbon pools and fluxes in the China Seas and adjacent oceans. Sci. China Earth Sci. 61 (11), 1535–1563. doi:10.1007/s11430-018-9190-x
Lebrato, M., Mendes, P. D., Steinberg, D. K., Cartes, J. E., Jones, B. M., Birsa, L. M., et al. (2013). Jelly biomass sinking speed reveals a fast carbon export mechanism. Limnol. Oceanogr. 58 (3), 1113–1122. doi:10.4319/lo.2013.58.3.1113
Lee, C. L., Lin, W. J., Liu, P. J., Shao, K. T., and Lin, H. J. (2021). Highly productive tropical seagrass beds support diverse consumers and a large organic carbon pool in the sediments. Divers. (Basel). 13 (11), 544. doi:10.3390/d13110544
Liu, H., Ren, H., Hui, D., Wang, W., Liao, B., and Cao, Q. (2014). Carbon stocks and potential carbon storage in the mangrove forests of China. J. Environ. Manage. 133, 86–93. doi:10.1016/j.jenvman.2013.11.037
Luisetti, T., Turner, R. K., Andrews, J. E., Jickells, T. D., Kröger, S., Diesing, M., et al. (2019). Quantifying and valuing carbon flows and stores in coastal and shelf ecosystems in the UK. Ecosyst. Serv. 35, 67–76. doi:10.1016/j.ecoser.2018.10.013
Macreadie, P. I., Allen, K., Kelaher, B. P., Ralph, P. J., and Skilbeck, C. G. (2011). Paleoreconstruction of estuarine sediments reveal human‐induced weakening of coastal carbon sinks. Glob. Chang. Biol. 18 (3), 891–901. doi:10.1111/j.1365-2486.2011.02582.x
Mariani, G., Cheung, W. W., Lyet, A., Sala, E., Mayorga, J., Velez, L., et al. (2020). Let more big fish sink: Fisheries prevent blue carbon sequestration—Half in unprofitable areas. Sci. Adv. 6 (44), eabb4848. doi:10.1126/sciadv.abb4848
Martins, M., de los Santos, C. B., Masqué, P., Carrasco, A. R., Veiga-Pires, C., and Santos, R. (2021). Carbon and nitrogen stocks and burial rates in intertidal vegetated habitats of a mesotidal coastal lagoon. Ecosystems 25 (2), 372–386. doi:10.1007/s10021-021-00660-6
Meng, W., and Feagin, R. A. (2019). Mariculture is a double-edged sword in China. Estuar. Coast. Shelf Sci. 222, 147–150. doi:10.1016/j.ecss.2019.04.018
Muenzel, D., and Martino, S. (2018). Assessing the feasibility of carbon payments and Payments for Ecosystem Services to reduce livestock grazing pressure on saltmarshes. J. Environ. Manage. 225, 46–61. doi:10.1016/j.jenvman.2018.07.060
Shu, A., Qin, J., Sun, T., Yang, W., Wang, M., and Zhu, J. (2021a). Discussion on water and sediment dynamic characteristics and layout optimization of typical artificial reefs in Liaodong Bay of Bohai Sea. J. Hydraulic Eng. 53 (01). (in Chinese). doi:10.13243/j.cnki.slxb.20210246
Shu, A., Rubinato, M., Qin, J., Zhu, J., Sun, T., Yang, W., et al. (2021b). The hydrodynamic characteristics induced by multiple layouts of typical artificial M-type reefs with sea currents typical of liaodong bay, BoHai sea. J. Mar. Sci. Eng. 9 (11), 1155. doi:10.3390/jmse9111155
Shu, A., Qin, J., Rubinato, M., Sun, T., Wang, M., Wang, S., et al. (2021c). An experimental investigation of turbulence features induced by typical artificial M-shaped unit reefs. Appl. Sci. 11 (4), 1393. doi:10.3390/app11041393
Wang, W., Yang, T., Guan, W., Peng, W., Wu, P., Zhong, B., et al. (2021). Ecological wetland paradigm drives water source improvement in the stream network of Yangtze River Delta. J. Environ. Sci. 110, 55–72. doi:10.1016/j.jes.2021.03.015
Watanabe, K., Yoshida, G., Hori, M., Umezawa, Y., Moki, H., and Kuwae, T. (2020). Macroalgal metabolism and lateral carbon flows can create significant carbon sinks. Biogeosciences 17 (9), 2425–2440. doi:10.5194/bg-17-2425-2020
Xu, X. H. (2014). Study on the effects of environmental stress on the immune and digestive physiology of Charybdis japonica. Xuzhou, China: China Mining University. (in Chinese).
Yu, C. D., Yu, C. G., and Yan, S. Q. (2004). Hydrodynamic simulation to the best layout of artificial ship-reefs. Oceanol. Limnologia Sinica 35 (4), 305–312. (in Chinese).
Yu, X. M., Xing, K., and Chen, L. (2017). Effects of temperature on the oxygen consumption rate, ammonia excretion rate and suffocation point of Oratosquilla oratoria larvae. 2017 Chinese Fisheries Association Annual Conference. Jiangxi, China: Nanchang. (in Chinese).
Yue, D. D., and Wang, L., M. (2012). Development of Marine mollusk culture in Yangtze River Delta based on direct carbon sink accounting. J. Shandong Agric. Sci. 44, 133–136. (in Chinese).
Zhang, J. H., Fang, J. G., and Tang, Qisheng. (2005). Contribution of shallow shellfish culture to the Marine carbon cycle in China. Adv. Earth Sci. 20 (3), 359–365. (in Chinese).
Zhang, Z., Wei, Y. A. N. G., Zhang, Z., Tao, S. U. N., and Haifei, L. I. U. (2022). Characteristics of typical biological communities and identification of key environmental factors in the seagrass bed of Xingcheng-Juehua Island, Bohai Sea. J. Beijing Normal Univ. Nat. Sci. 58 (1), 90–98. (in Chinese). doi:10.12202/j.0476-0301.2021140
Zhang, Z. Y., and Yang, W. (2022). Energy fluxes and trophic structure of an artificial reef ecosystem in Juehua island based on Ecopath model. Mar. Environ. Sci. 2022 (04), 41. (in Chinese). doi:10.13634/j.cnki.mes.2022.04.013
Zhu, J. J., and Yan, B. (2022). Blue carbon sink function and carbon neutrality potential of mangroves. Sci. Total Environ. 822, 153438. doi:10.1016/j.scitotenv.2022.153438
Keywords: hydrodynamic characteristics, artificial reefs, ecological restoration, carbon sink, offshore of Juehua Island
Citation: Shu A, Zhang Z, Wang L, Sun T, Yang W, Zhu J, Qin J and Zhu F (2022) Effects of typical artificial reefs on hydrodynamic characteristics and carbon sequestration potential in the offshore of Juehua Island, Bohai Sea. Front. Environ. Sci. 10:979930. doi: 10.3389/fenvs.2022.979930
Received: 28 June 2022; Accepted: 25 July 2022;
Published: 30 August 2022.
Edited by:
Jiaye Li, Dongguan University of Technology, ChinaReviewed by:
Leicheng Guo, East China Normal University, ChinaXu-Feng Yan, Sichuan University, China
Copyright © 2022 Shu, Zhang, Wang, Sun, Yang, Zhu, Qin and Zhu. This is an open-access article distributed under the terms of the Creative Commons Attribution License (CC BY). The use, distribution or reproduction in other forums is permitted, provided the original author(s) and the copyright owner(s) are credited and that the original publication in this journal is cited, in accordance with accepted academic practice. No use, distribution or reproduction is permitted which does not comply with these terms.
*Correspondence: Ziru Zhang, MjAyMTIxMTgwMTAyQG1haWwuYm51LmVkdS5jbg==; Le Wang, TGV3YW5nQG5jZXB1LmVkdS5jbg==
 Anping Shu
 Ziru Zhang
 Le Wang
 Tao Sun
 Wei Yang
 Jiapin Zhu
 Jiping Qin
 Fuyang Zhu