 Jun Xu
 Jinye Li*
- School of Economics and Management, Xinjiang University, Urumqi, China
As the largest trading nation in the world, there have been substantial foreign trades (export and import) between China and other countries. Meanwhile, it is also one of the major forces for China’s emission reduction. This article applies the panel data of 30 provinces for the period 2004–2017 to investigate the effect of foreign trade on China’s green total factor energy efficiency (GTFEE). The slack-based measure (SBM) model is employed to calculate the provincial GTFEEs. Subsequently, the empirical results of the basic linear regression model revealed that both export and import promoted the region’s GTFEE, on which the import particularly has more effects than the export. Moreover, the spatial Durbin model (SDM) exhibited that the increase in import will not only present a positive influence on the GTFEE of the region, but also will improve the GTFEEs of the surrounding provinces through the spatial spillover mechanism. Although the increase in export will also exert a positive influence on the GTFEE of the local area, it will impose a significant negative impact on the GTFEEs of the surrounding regions. The results of this study provide important policy implications for the optimization of trade structure and high-quality development of the Chinese economy.
1 Introduction
Since the reform and opening-up, China has already made substantial achievements in economic development to become the second largest economy in the world, and scholars indicate that foreign trade has turned into a powerful engine to continually drive economic growth (Hu and Tan, 2016; Kong et al., 2020). In 2001, China obtained membership in the World Trade Organization (WTO), since which its trade development has achieved remarkable results (Yu and Luo, 2018). In 2010, China became the largest country in trading goods (Jarreau and Poncet, 2012; Caporale et al., 2015). By the end of 2019, China’s values of export and import had reached 2.50 and 2.08 trillion dollars, respectively (China’s Ministry of Commerce, 2019), ranking first and second in terms of countries. With the rapid economic development, China’s environmental problems have become increasingly severe. In 2014, China had become the world’s largest CO2 emitter, whose carbon emissions accounted for about 27.5% of the global emissions (Li and Wang, 2019). According to the Paris Agreement, the intensity of carbon emissions per GDP in China will drop by 60%–65% in 2030 compared with 2005 (Ma et al., 2017; Wang K et al., 2019). Generally speaking, the export-oriented model to drive economic growth is no longer sustainable for China.
At present, how to optimize trade structure and promote the green economy has posed a challenge for China’s government. Thus, this article selects the GTFEE to reflect the emissions and economic achievements in China (Wu et al., 2020a). It will focus on studying the impact of foreign trade on China’s GTFEE, which attaches great significance to improving the trade structure and achieving the high-quality development of the economy in China.
The contributions of this study are as follows. First, most of the previous research on the export impact on economic growth without considering import separately (Mania and Rieber, 2019; Jalles and Ge, 2020). We attempt to research the impacts of foreign trade on GTFEE. Second, the empirical result of this article draws new conclusions, foreign trade has two ways of exporting and importing, which positively impact China’s GTFEE. More importantly, the impacts of import on GTFEE are greater than those of export. Finally, the generalized method of moments (GMM) is used to solve endogeneity problems between variables. The export and import have spatial effects on GTFEE, which are examined with the Spatial Durbin model (SDM).
This article endeavors to provide a better understanding of connections between foreign trade and GTFEE, which is of great significance to the transformation of trade pattern and high-quality development of economy in China.
The remainder of this article is organized as follows: Section 2 presents a literature review. Section 3 introduces the methodology. Section 4 describes the variables and data sources. Section 5 presents an empirical analysis. Section 6 concludes the paper.
2 Literature review
At present, scholars mainly focus on three aspects of the foreign trade impact on GTFEE: carbon emissions, energy efficiency, and technology.
First, scholars have long been concerned with the problem of carbon emissions brought by foreign trade. The impact of foreign trade on global carbon emissions during 1995–2009 was examined by Wang and Ang (2018), whose results showed that a large amount of emissions had been generated. Based on the instrumental variables, Managi et al. (2009) suggested that the influence of foreign trade was significantly heterogeneous among different countries. From the perspective of export effects on carbon emissions, Dietzenbacher et al. (2012) found that ordinary export brought more emissions than the processing trade. Besides, from the regional and industrial perspectives, Yan et al. (2020) calculated the amount of carbon emissions produced by export in China. In summary, scholars have conducted profound studies on the impact of foreign trade on CO2 emissions and generally believed that foreign trade was one of the most important factors affecting carbon emissions.
Second, numerous scholars have also studied the impact of foreign trade on energy efficiency. Most of them focused on exports. Taking Latin America as the research object, Egger and Url (2010) found that the growth of export had become a crucial factor in the lack of energy supply in Austria. Kohler (2013) got the same conclusion when he took South Africa as the object. As for China, the significant correlation between its foreign trade and energy consumption during 1971–2011 was proved by Shahbaz et al. (2013). Besides, Farrow et al. (2018) and Zhang et al. (2017) pointed out that export structure was also an important factor affecting energy efficiency.
Third, Almodovar et al. (2014) firstly researched the effect on technological progress from foreign trade. Since then, it has been regarded as one of the most significant channels for transnational technology spillover (Parrado and De Cian, 2014; Yuan and Ya-Li, 2014; Tientao et al., 2016; Ho et al., 2018). Clerides et al. (1998) and Sharma (2018) indicated that trading enterprises could learn advanced clean technology and management experience from the developed countries through trade. Besides, participating in the fierce international competition required domestic enterprises to continuously improve technology and product quality to meet stricter demands (Revesz, 1992; Korves, 2011).
In addition, the spatial spillover effect on technology is one of the main topics that scholars focus on. By using SDM, Pan et al. (2020a) found that the Outward Foreign Direct Investment (OFDI) exerted a significant spillover effect on the Green Total Factor Productivity (GTFP) of neighboring provinces. With the application of SLM, Zhang et al. (2018) found that carbon productivity also exerted the spatial spillovers effect. Trade is an important way of cooperation, and its technology spillover effect should also attract more attention.
According to the related research above, it is not difficult to discover that many scholars have already studied the relationship between foreign trade and green development from different perspectives. However, few scholars have ever researched the impact of foreign trade on GTFEE and distinguished the heterogeneity between the export and import. Compared with the direct adoption of carbon emissions, energy consumption, and technology as variables, GTFEE could have considered more factors. Meanwhile, studying the impact of foreign trade on GTFEE is more consistent with China’s current reality of high-quality economic development. Moreover, this article studies the local and peripheral effects of reverse technology spillovers from foreign trade and whether the export and import can improve the GTFEEs of neighboring areas through a spatial spillover mechanism.
3 Methodology and data
3.1 Calculating method of the GTFEE
Academia has obtained fruitful results in research on energy consumption and efficiency (Wu et al., 2020b). However, the undesired output is rarely included in the indices of energy efficiency at present (Li and Hu, 2012; Li and Lin, 2017). Chung et al. (1997) firstly considered the undesired outputs and named them the Directional Distance Function (DDF). Since then, multiple expansion models continued to be produced, such as the Banker–Charnes–Cooper (BCC) model, the Malmquist index model, and the SBM models (Banker and Cooper, 1984; Tone, 2001; Long and Xiaozhen, 2010; Wang Z et al., 2019). According to the previous research and the reality of China’s economic development, this article applies the superefficiency SBM-undesirable model to measure the GTFEEs of 30 provinces in China from 2004 to 2017.
Hypothetically, there are n number of DMUs (provinces in China) at time t, l kinds of input factors to production, M types of desirable outputs, and K types of non-desirable outputs for each DMU. The input set, desirable output set, and non-desirable output set of each DMU are expressed as
where Ki,t, Ki,t-1, and Ii,t denote the capital stock (K) of province i in year t, the capital stock (K) of province i in year t-1, and the values of new capital investment of province i in year t, respectively.
In addition, m = 1 corresponds to the GDP of each province, whereas k = 3 corresponds to the discharge of industrial wastewater, the discharge of industrial solid waste, and carbon emissions.
Finally, this article will be based on the superefficiency SBM-undesirable model, which incorporates undesired outputs into the efficiency study. As shown in formula 2, each province’s GTFEE is calculated individually:
3.2 Econometric model setting
Exploring the impact of foreign trade on GFTEE and following the research of Copeland and Taylor (2004), Chen and Golley (2014), and Li and Wu (2020), this study establishes the specific model as follows:
where export and import individually indicate the foreign trade levels, i represents every province, t represents the year, EI indicates the economic development, RD indicates the investment in Research and Development (R&D), IS indicates the industrial structure, ER indicates the environmental regulation, UR indicates the urbanization rate, and α and β are parameters, respectively. Besides, EI is expressed as the scale effect, RD is expressed as the technology effect, IS and UR are expressed as the structure effect, respectively (Feng et al., 2017; Cheng et al., 2018; Yuan and Xiang, 2018).
Based on existing research, the GTFEE may be affected at an earlier stage. According to the method proposed by Wu et al. (2020b), this study also integrates the lagging one-stage variable (GTFEEi,t-1) into the following formula:
3.2.1 Spatial Durbin model
1) Spatial analysis methods
As mentioned earlier, there are spatial heterogeneity and spatial correlations of foreign trade between different regions. GTFEE of a certain region will be affected not only by the level of its local trade, but also by its neighboring regions. Before performing the spatial econometric analysis, it is essential to test the spatial correlation of these variables (Pan et al., 2019a; Pan et al., 2019b).
The Moran Index (Moran’s I) is applied to identify the spatial correlation between the province samples. The calculation method of Moran’s I is shown as follows:
In formula 6,
2) Construction of spatial weight matrix
Constructing a spatial weight matrix is the basis for establishing a spatial econometric model. Given the geographical spaces and economic discrepancies between different provinces, there have been three spatial weight matrices to be selected, including the ones of geographic adjacency, geographic distance, and economic distance (Li K et al., 2018) as follows:
Geographic adjacency spatial weight matrix (W1).
In the matrix above, if province i owns a common boundary with province j, it means W1 = 1; otherwise, W1 = 0.
Geographic distance’s spatial weight matrix (W2):
In the matrix above, disi,j is the straight-line distance between the capitals of provinces i and j.
Economic distance’s spatial weight matrix (W3):
In the matrix above, yi and yj are individually represented as the per capita GDP in provinces i and j and W3 is expressed as the reciprocal of the absolute value of the gap between the economic levels of these two provinces.
3) The design of SDM
After the spatial correlation test, this article intends to apply a spatial econometric model to study the spatial effects. There have been three applicable kinds of spatial econometric models: the Spatial Lag Model (SLM), Spatial Error Model (SEM), and SDM. However, as some scholars have argued, SDM can capture the spatial correlation between dependent variables and the spatial spillover effects of independent variables more effectively than SLM and SEM. Thus, this article employs SDM to study the influence of trade on GTFEE and its spillover effects. This model is accordingly established as follows:
where trai,t indicates either export or import; X is a series of control variables; Wi is a spatial weight matrix; and α, ρ, and β are the parameters.
3.3 Data sources and variables selection
3.3.1 Explained variables
Green total factor energy efficiency (GTFEE) is the explained variable in our basic model and SDM model. It is calculated by formula 2 in Section3.1.
3.3.2 Explanatory variables
Foreign trade (trai,t) is the most important explanatory variable in our model, including export and import values. Export mainly refers to the flow of goods from the region to other countries, and import mainly refers to the flow of goods from other countries to the region.
3.3.3 Control variables
We added multiple control variables to the model to minimize or even avoid the estimation bias caused by missing variables. These control variables are explained as follows.
1) Economic development level (EL): the per capita GDP measures the level of provincial economic development (Josep et al., 2005; Hao et al., 2020).
2) Research and Development ((R& D) investment: R&D investment is also one of the important factors in promoting technological progress. The ratio of research investment to GDP is used to measure the R&D ((Lin and Zhao, 2016).
3) Industrial structure (IS): the share of GDP in the secondary industry is used to measure the industrial structure. The secondary industry is a large energy user. This is the original intention of adding the variables. Thus, the higher the proportion of the total secondary industry, the more the emissions and the lower the GTFEE (Liu and Bae, 2018; Wu et al., 2019; Hao et al., 2020).
4) Environmental regulation (ER): Porter and Linde (1999) put forward the Porter hypothesis, suggesting that the enterprise can achieve a win-win situation between economic growth and environmental protection through ER. Here, the ratio of environmental governance investment to GDP is used to measure the ER (Lanoie et al., 2008; Nesta et al., 2014; Wu et al., 2020a).
5) Urbanization rate (UR): according to the research of Zhang et al. (2015) and Li M et al. (2018), the share of the non-agricultural population relative to the total population is used to measure the UR.
3.3.4 Data sources
The sample data set is the panel data of China’s 30 provinces from 2004 to 2017. The main data comes from the China Statistical Yearbook, China Science and Technology Statistics Yearbook, China Energy Statistical Yearbook, China Environmental Statistics Yearbook, Wind Database, and National Bureau of Statistics. Taking into the lack of data in Tibet and the availability of data in Hong Kong, Macau, and Taiwan. The research objects are 30 provinces except for Tibet, Hong Kong, Macau, and Taiwan. In order to eliminate the impact of the price factor on the results, increase the data stability, and reduce size impact, EI, export, and import values have been represented by logarithm. Here, the descriptive statistics of the data are given in Table 1.
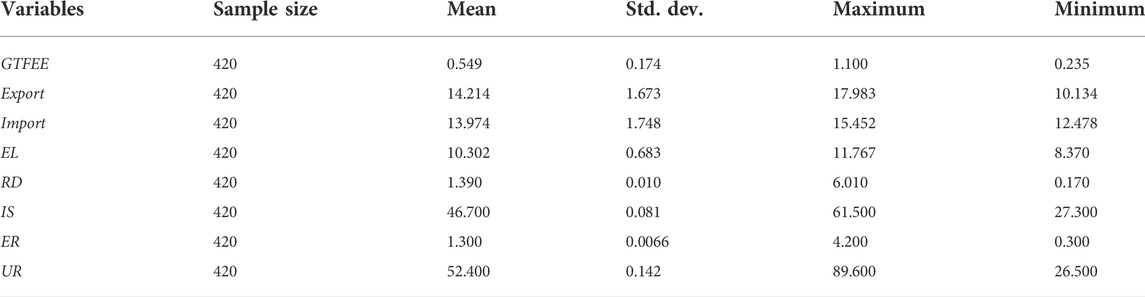
TABLE 1. The descriptive statistical analysis of variables.
4 Results and discussions
4.1 Foreign trade in China
4.1.1 Export in China
Table 2 reveals that the proportion of exports in eastern China to the total exports is much higher than that in the central and western regions during the sample period. From 2004 to 2017, the average proportion of exports in eastern China to the total exports was 89.90%, compared with just 5.50% and 4.50% in central and western China. The top three regions of total exports are Guangdong (29.21%), Jiangsu (15.91%), and Zhejiang (11.22%), respectively, all in eastern China. By contrast, the last three ones are Hainan (0.15%), Ningxia (0.11%), and Qinghai (0. 04%), respectively, all in western China. Obviously, the eastern regions located in the coastal areas play an irreplaceable role in China’s exports.
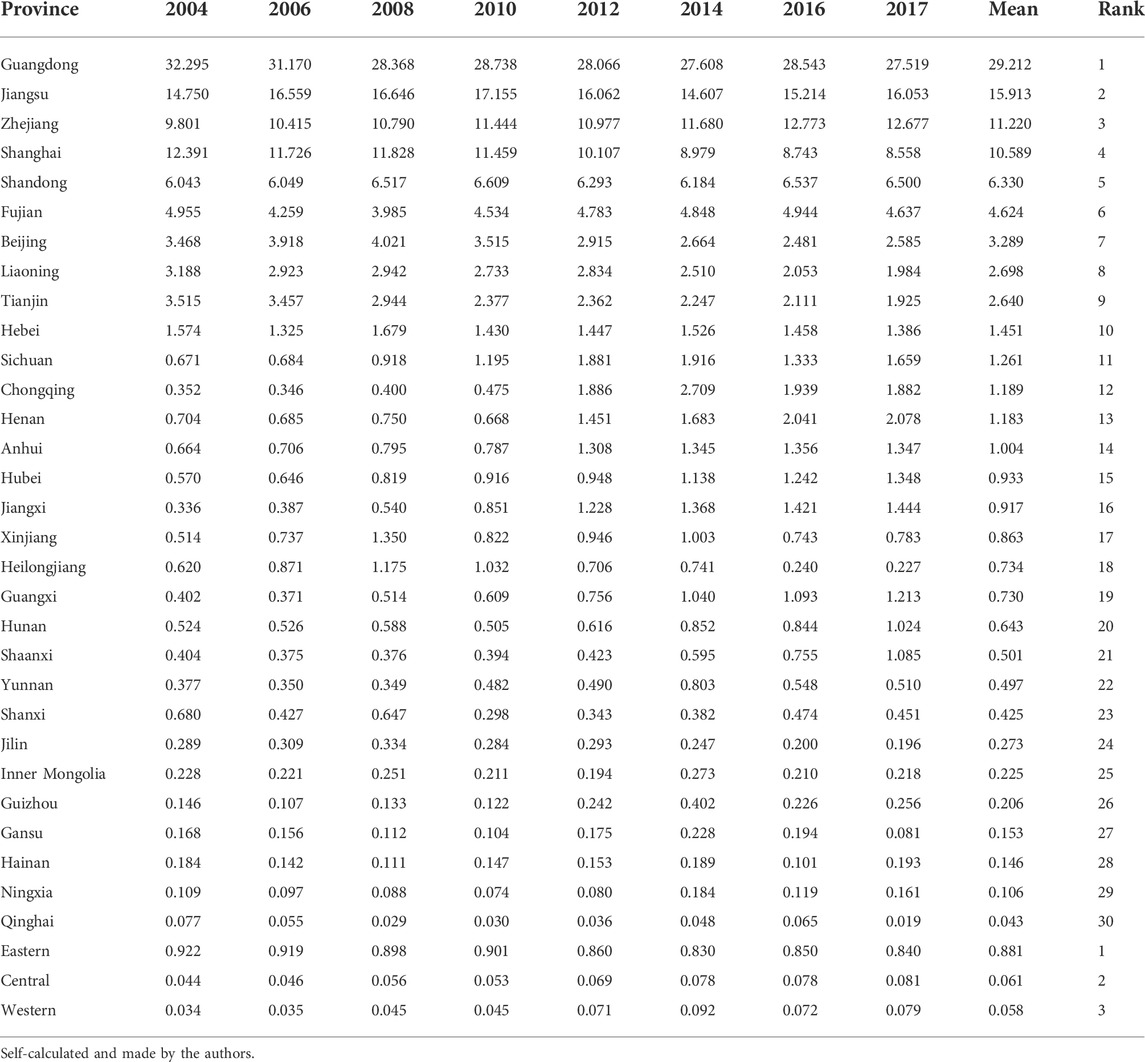
TABLE 2. China’s exports in 2004–2017.
4.1.2 Import in China
Table 3 shows that the average proportion of imports from eastern China in the total is 88.10%, compared with only 6.10% and 5.80% from central and western regions, respectively. More notably, the top three proportions of imports are from Guangdong (24.54%), Beijing (16.46%), and Shanghai (14.04%), all in eastern China. However, the last three proportions of imports are from Guizhou (0.09%), Ningxia (0.05%), and Qinghai (0.02%). Generally speaking, the eastern coastal regions hold a dominant position in China’s export and import, which is the main frontier for reform and opening-up. Among all these regions, the development of trade in China is very uneven, which must attract attention and solutions during the process of high-quality economic development.
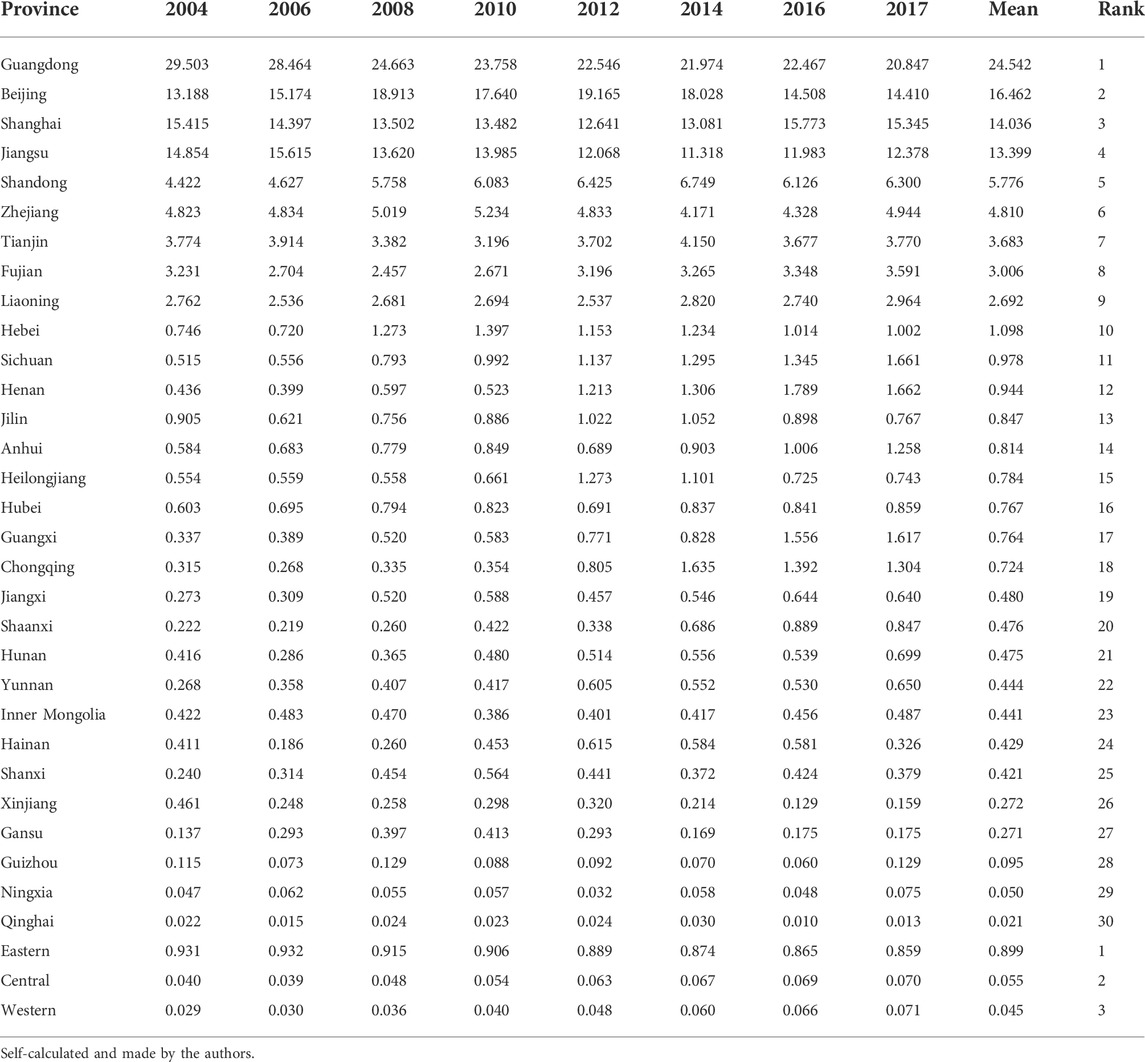
TABLE 3. China’s imports in 2004–2017.
4.2 China’s GTFEE
Based on the calculation methods of GTFEE above, this study has measured the GTFEEs of these three regions1. The results are exhibited in Figure 1. From 2004 to 2017, the results show an upward trend in China’s average GTFEE from 0.526 to 0.595. From the perspective of the region, both the central and western ones presented the GTFEEs lower than the national level. However, the GTFEE of the eastern region turned out to be higher than the national average. From 2004 to 2017, the gap between GTFEEs of eastern and central regions widened from 0.107 to 0.237, whereas the gap between GTFEEs of eastern and western regions broadened from 0.227 to 0.358. There has been an upward trend in GTFEE moving to the eastern regions from the central and western regions. Although there is a high level of coordination between economic growth and environmental performance in the eastern regions, there remain significant regional differences in China, which should be considered when making related policies.
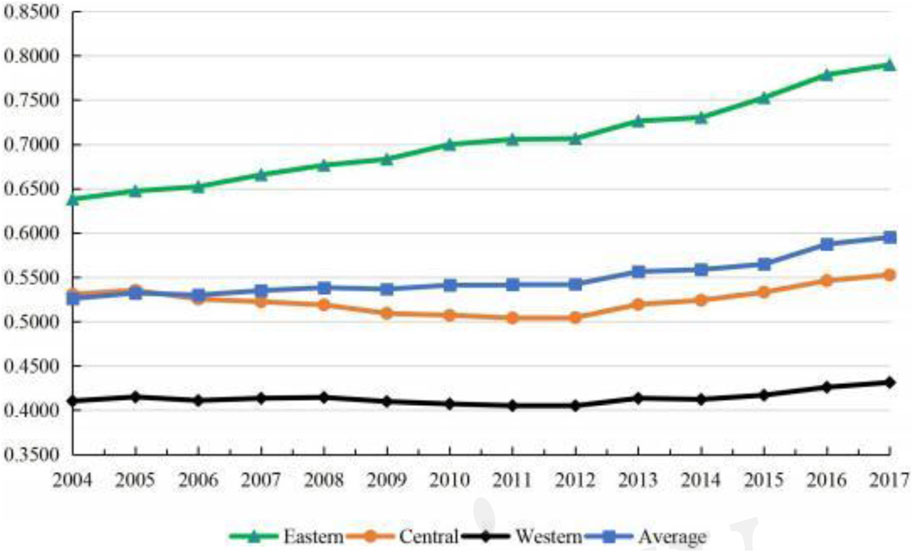
FIGURE 1. Three regional static green total factor energy efficiency.
1 According to the No. 33 (2000) document of China, this study divides 30 provinces into three regions: the eastern region (including 11 provinces, i.e., Beijing, Tianjin, Hebei, Shanghai, Jiangsu, Zhejiang, Fujian, Shandong, Guangzhou, Hainan, and Liaoning.), the central region (including eight provinces, i.e., Shanxi, Anhui, Jiangxi, Henan, Hubei, Hunan, Jilin, and Heilongjiang.), and the western region (including 11 provinces, i.e., Inner Mongolia, Guangxi, Chongqing, Sichuan, Guizhou, Yunnan, Shaanxi, Gansu, Qinghai, Ningxia, and Xinjiang.).
4.3 Baseline regression results and discussion
According to the methodology, this study applies the regression methods of Fixed Effect (FE) and Random Effect (RE) to estimate the formulas of (3) and (4). Meanwhile, in order to address the possible endogeneity problem between export, import, and GTFEE while improving the robustness of the results, the generalized moment method is adopted to conduct the estimation.
The empirical results are shown in Table 4 and Table 5, respectively. The selection of instrumental variables is reasonable because the Hansen test and the Auto-Regressive AR(2) estimation results present no second-order sequence correlation of the random error terms (Blundell and Bond, 1998). The specifics of the results are as follows: firstly, the coefficients of export and import are both positive and they are both significant at the 1% level. In other words, an improvement in export or import will inhibit an improvement in GTFEE. Secondly, the coefficient of export (0.003) is lower than that of import (0.009), which means that the import impacts GTFEE more significantly than the export trade does. In fact, China has strongly promoted the processing trade since the last century (Byrne et al., 1996; Ma et al., 2014). Processing trade accounts for over 50% of China’s total exports (He and Wang, 2020). Some scholars found that an excessive proportion of processing trade was one of the most important factors to lower productivity (Lu et al., 2010; Ma et al., 2014; Dai et al., 2016; Manova and Yu, 2016). Meanwhile, other scholars indicated that the enterprises can absorb advanced technology through import, which was a significant source of technological progress and a key driving force for improving GTFEE (Grossman and Helpman, 1991; Coe and Helpman, 1995; School of Earth Environment, University of Leeds, Leeds, UK, 2016). Thirdly, the sign of the EI coefficient among other variables is positive and statistically significant at the 1% level, which shows a higher level of economic development and a higher degree of GTFEE. The sign of the UR coefficients is negative and statistically significant at the 1% or 5% level. With progressive urbanization, China’s population and industries have inundated the cities and significantly increased energy consumption and environmental pollution in China (Sheng et al., 2020; Sun and Huang, 2020). The sign of R&D coefficients is also positive and statistically significant at the 1% level, which exhibits that technological innovation considerably reduces carbon emission by improving the GTFEE. The coefficients of the IS are significantly negative at the 1% or 10% level, which indicates that IS plays a significantly negative role in raising the GTFEE. The results also present that the coefficients of ER are negative, and the coefficients of square term (ER 2) are positive, which are both significant at the 1%, 5%, or 10% levels. It indicates a “U-shaped” relationship between the ER and GTFEE. Before the turning point, ER showed a “green paradox” effect and after the turning point, it showed an “emission reduction effect” (Cheng et al., 2017; Huang and Lei, 2021; Wu et al., 2020a).

TABLE 4. Estimation results of the basic model for export.
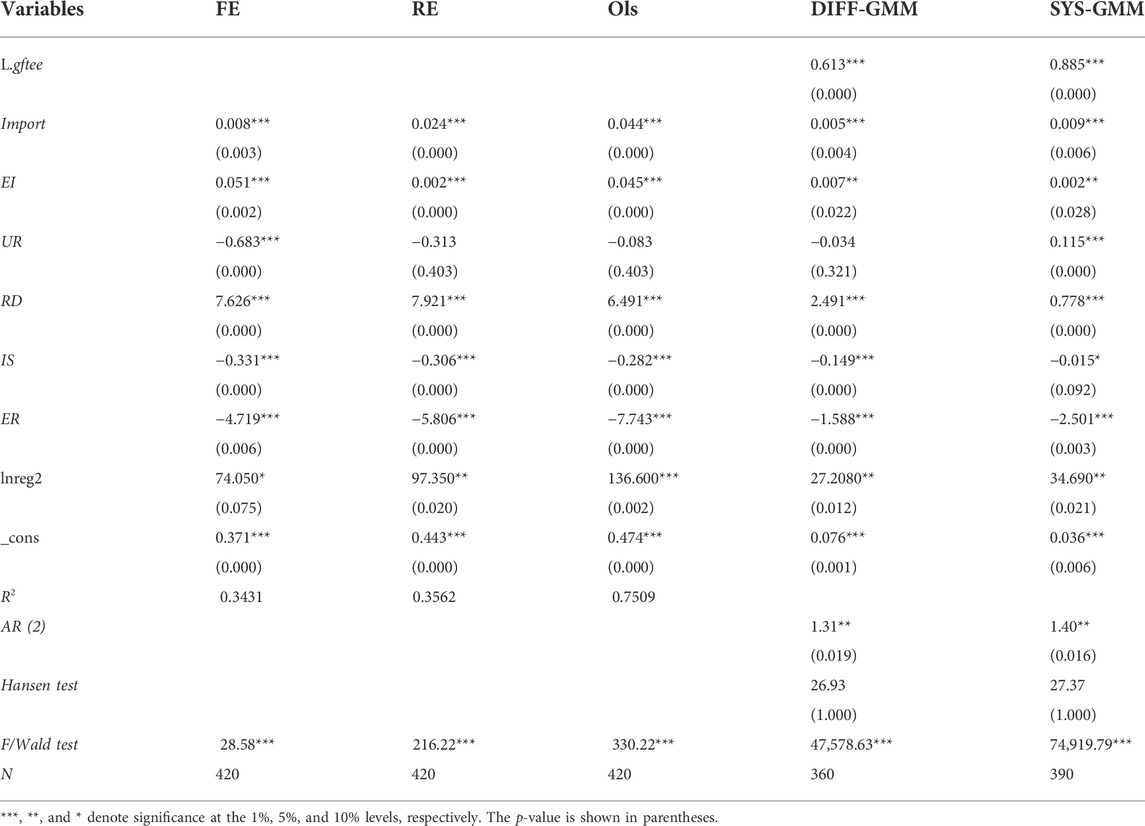
TABLE 5. Estimation results of the basic model for import.
4.4 Spatial results and analysis
4.4.1 Spatial autocorrelation analysis
Moran’s I is an effective tool for explaining spatial correlation. According to formula (6), Moran’s I test results of spatial correlation of GTFEE under three different matrices of weights are individually shown in Table 6. During 2004–2017, Moran’s I of the GTFEE are positive and statistically significant, which indicates that the GTFEE of China presented significant characteristics of spatial agglomeration.
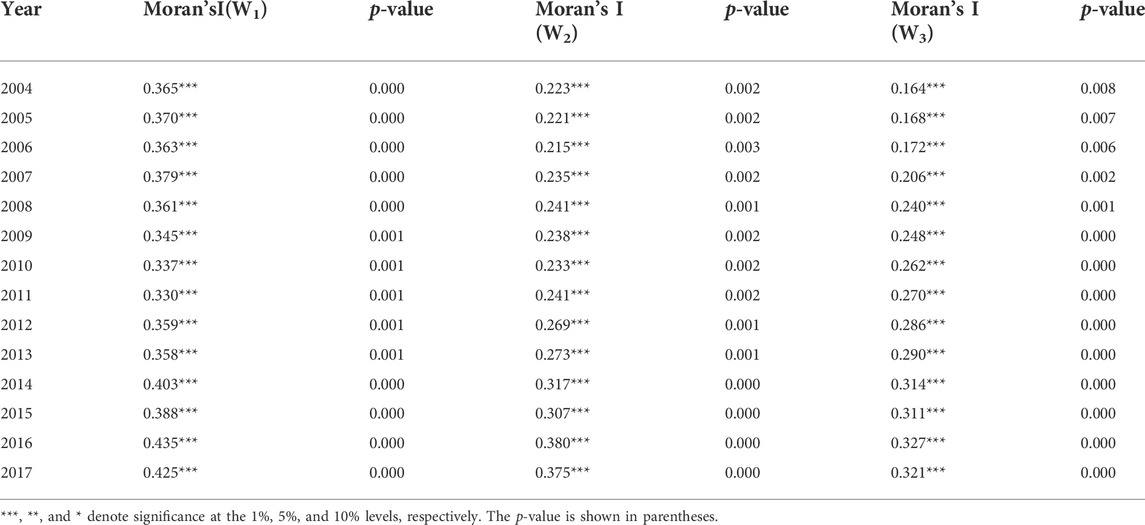
TABLE 6. Moran’s I value of GTFEE during 2004–2017.
Moreover, the degree of spatial dependence exhibits a growing uptrend.
4.4.2 Estimation of the SDM model
In order to make the estimation structure more reliable, this study applies three different matrices of spatial weight to estimate the SDM. Following the Hausmann test, this study chooses the FE model in the form of space-fixed, time-fixed, and time-space double-fixed effects. Finally, according to the likelihood function values and goodness of different fixed effects, this study reports the results of the double-fixed one. Its regression results are listed in Table 7.
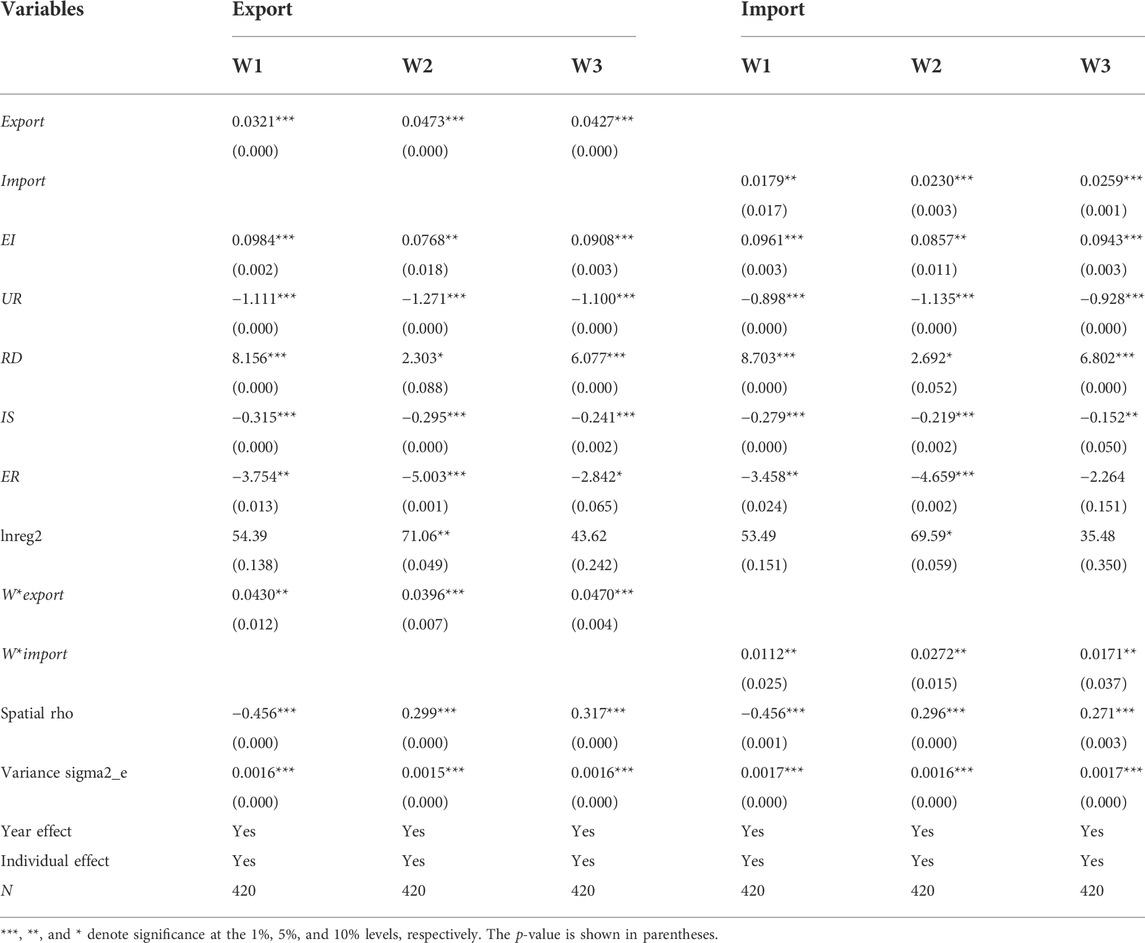
TABLE 7. Estimation of the SDM.
The coefficients of export and import are all significantly positive under W1, W2, and W3, presenting that both export and import can promote the growth of provincial GTFEEs. From another perspective, no matter what spatial matrix is adopted, the spatial lag terms of export and import are always positively significant, which also passed the significance test of the 1% or 5% level. This finding implies that the growth of provincial export or import will exert a positive effect on promoting the GTFEEs in the surrounding areas. However, this study can only make a preliminary judgment according to Table 7. On the contrary, Lesage (2008) and Yang (2019) pointed out that applying point estimation to test the spillover effects may cause model estimation errors.
4.4.3 Direct and indirect effects
Table 8 reveals that the direct estimations under three different spatial weights of export are all positive and significant, which indicates a positive influence on the region’s GTFEE growth. However, the indirect effects of export are negative and significant under three different spatial weights, and all passed the significance test of the 1% or 5% level. This proves that export in this region imposes a significant negative impact on GTFEE in surrounding areas. This occurs mainly for some reasons. China’s has obvious development differences between regions and uneven trade development structure between regions,the raw materials and intermediate products with low added-value to the regional source from the surrounding areas, which would generate much energy consumption and emissions and objectively reduce their GTFEEs. For example, China’s central and western regions have been crucial sources of energy and labor for the eastern coastal areas. Moreover, compared with competitors in regions with backward trade development, those trading enterprises in developed areas enjoy more opportunities to learn and absorb advanced technology and management experience, which play a significant role in improving their GTFEEs (Poon et al., 2006; Wang and Ang, 2018). In summary, the total effect of export is positive and composed of the most direct impacts.
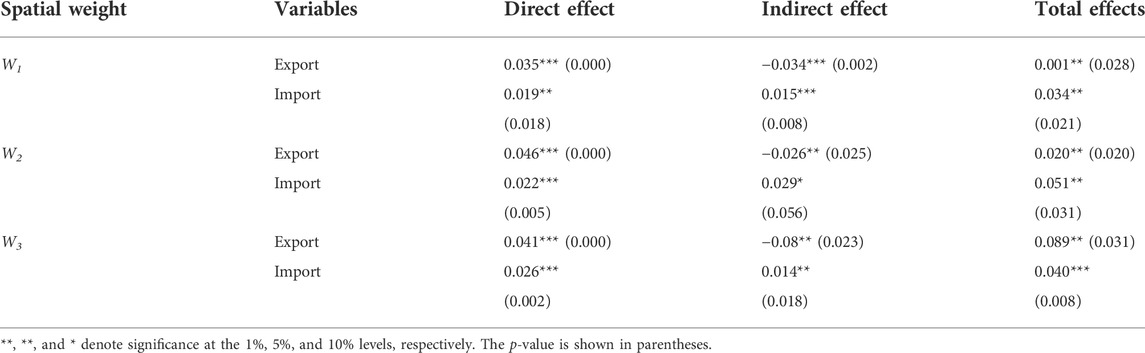
TABLE 8. Effect decomposition.
As shown in Table 8, this article can also find that the direct estimations under three different spatial weights of import are all positive and significant, indicating another positive influence on the region’s GTFEE growth. This presents that the growth of imports is conducive to improving the GTFEE. More importantly, the indirect effects of imports are positive and significant under three different spatial weights, and all passed the significance test of the 1%, 5%, or 10% level. This result indicates that the growth of imports in this region will also affect the GTFEEs in surrounding areas. The possible explanations are as follows. On the one hand, the import of capital-intensive and technology-intensive goods can facilitate the imitations and innovations by domestic enterprises, such as pollution-treatment equipment and other high-tech products, which may be called the “technology spillover effect,” thus eventually improving the GTFEE (Parrado and De Cian, 2014; Huang et al., 2017; Zhao and Lin, 2019). On the other hand, the import of consumer goods may replace domestic production and therefore reduce domestic energy consumption and emissions (Al-mulali and Sheau-Ting, 2014). Besides, during the fierce international competition, the domestic enterprises may raise their technological levels, which will bring pressure on their competitors in the surrounding regions to improve their production technology. Therefore, the GTFEEs of these adjacent regions could be improved as well.
5 Conclusion and policy recommendations
Based on the previous research, this study applied the panel data of 30 provinces from 2004 to 2017 to calculate the GTFEE with the SBM-undesirable model, based on which this study established the basic linear regression model to empirically test the influences of export and import on GTFEE. In addition, the geographic proximity matrix (W1), geographic distance weight matrix (W2), and economic, geographic distance weight matrix (W3) were introduced, respectively, into this study. The SDM was applied to test the direct and indirect spatial effects of export and import on GTFEE. The conclusions are as follows. Firstly, the inter-provincial GTFEE in China showed a ladder-like distribution pattern of eastern-central-western. Secondly, both export and import improved the regional GTFEEs, but import exhibited more effect than export on the enhancement of GTFEE. Thirdly, in terms of spatial effect, the increase in import would not only exert a positive effect on the GTFEE of the local regions, but also raise the GTFEE of surrounding provinces through the spatial spillover mechanism. Although the increase in export would have a positive influence on the GTFEE of the local regions, it would impose a significant negative impact on the GTFEE of surrounding areas. Based on the above empirical analysis, this study put forward several policy recommendations as follows:
1) The government should focus more on regionally coordinated development and keep narrowing the development gaps between regions, especially between the eastern and central-western regions. Significantly, the old path of “treatment after pollution” concentrated in the central and western regions should be avoided. The road to sustainable development requires drawing lessons from the development experience of the eastern regions. The policy needs to optimize the regional coordination of technologies and innovations and finally improve the GTFEEs in the central and western regions. For example, the government could encourage more investments in universities and scientific research institutions in the central and western provinces.
2) Moreover, the government should greatly enhance the role of imports in improving the quality of economic development, especially the imports of capital goods and high-tech products. Honestly speaking, China has been over-relying on export for numerous years. However, now, the international environment for cooperation has undergone profound changes. Therefore, as the important driving force of economic development, the import should be emphasized more than before, which will optimize the trade structure and promote the GTFEEs.
3) Additionally, the government should also promote the optimization of industrial distributions and encourage the high-tech enterprises and talents to transfer from the eastern regions to the central and western ones. The western and central provinces could fully use the late-comer advantages in trade and strengthen the cooperation with eastern provinces by introducing advanced technology and management experience. Especially for western regions, it is essential to transform their resource advantages into industrial ones, thus effectively promoting their local GTFEEs.
Though this study quantitatively investigated the relationships between export, import, and GTFEE, there remain some limitations, which could become the possible directions of future research. Firstly, the inter-provincial data applied in this study is not adequate and may easily cause some sample bias. Thus, future researchers should gather city-level or firm-level data to conduct precise investigations. Moreover, this study mainly applied total export and import to measure the level of trade. Consequently, the heterogeneity of trading partner countries may be overlooked. Therefore, future research will need to explore deeper into these fields.
Data availability statement
The original contributions presented in the study are included in the article/Supplementary Materials. Further inquiries can be directed to the corresponding author.
Author contributions
JL: conceptualization, project administration, formal analysis, writing-review and editing. Jx: conceptualization, writing-review and editing, writing-original draft. CL: writing-review and editing, methodology, validation.
Funding
This study was supported by the National Natural Science Foundation of China (Grant no. 71964032).
Acknowledgments
The authors acknowledge financial support from the National Natural Science Foundation of China (Grant no. 71964032), the Key Project of Philosophy and Social Science of the Ministry of Education of China (Grant no. 17JZD033).
Conflict of interest
The authors declare that the research was conducted in the absence of any commercial or financial relationships that could be construed as a potential conflict of interest.
Publisher’s note
All claims expressed in this article are solely those of the authors and do not necessarily represent those of their affiliated organizations or those of the publisher, the editors, and the reviewers. Any product that may be evaluated in this article, or claim that may be made by its manufacturer, is not guaranteed or endorsed by the publisher.
References
Al- mulali, U., and Sheau-Ting, L. (2014). Econometric analysis of trade, exports, imports, energy consumption and CO2 emission in six regions. Renew. Sustain. Energy Rev. 33, 484. doi:10.1016/j.rser.2014.02.010
Banker, R. D., Cooper, A. C. W., and Cooper, W. W. (1984). Some models for estimating technical and scale inefficiencies in data envelopment analysis. Manage. Sci. 30, 1078–1092. doi:10.1287/mnsc.30.9.1078
Blundell, R., and Bond, S. (1998). Initial conditions and moment restrictions in dynamic panel data models. J. Econ. 87, 115
Byrne, J., Shen, B., and Li, X. (1996). The challenge of sustainability: Balancing China's energy, economic and environmental goals. Energy Policy 24, 455–462. doi:10.1016/0301-4215(96)00011-0
Caporale, G. M., Sova, A., and Sova, R. (2015). Trade flows and trade specialisation: The case of China. China Econ. Rev. 34, 261–273. doi:10.1016/j.chieco.2015.03.010
Chen, S., and Golley, J. (2014). ‘Green’ productivity growth in China's industrial economy. Energy Econ. 44, 89–98. doi:10.1016/j.eneco.2014.04.002
Cheng, Z., Li, L., and Liu, J. (2018). Industrial structure, technical progress and carbon intensity in China's provinces. Renew. Sustain. Energy Rev. 81, 2935–2946. doi:10.1016/j.rser.2017.06.103
Cheng, Z., Li, L., and Liu, J. (2017). The emissions reduction effect and technical progress effect of environmental regulation policy tools. J. Clean. Prod. 149, 191. doi:10.1016/j.jclepro.2017.02.105
Chung, Y. H., Färe, R., and Grosskopf, S. (1997). Productivity and undesirable outputs: A directional distance function approach. J. Environ. Manage. 51, 229–240. doi:10.1006/jema.1997.0146
Coe, D. T., and Helpman, E. (1995). International R&D spillovers. Eur. Econ. Rev. 39, 859–887. doi:10.1016/0014-2921(94)00100-e
Dai, M., Maitra, M., and Yu, M. (2016). Unexceptional exporter performance in China? The role of processing trade. J. Dev. Econ. 121, 177. doi:10.2139/ssrn.1963652
Dey- Chowdhury, S. (2008). Methods explained: Perpetual inventory method (PIM). Econ. Lab. Market Rev. 2, 48–52. doi:10.1057/elmr.2008.140
Dietzenbacher, E., Pei, J., and Yang, C. (2012). Trade, production fragmentation, and China' s carbon dioxide emissions. J. Environ. Econ. Manage. 64, 88–101. doi:10.1016/j.jeem.2011.12.003
Dong, J., and Cen, Y. (2011). Measurement of highway capital stock in China: 1952 2009. J. Transp. Syst. Eng. Inf. Technol. 11, 20–23. doi:10.1016/s1570-6672(10)60100-6
Egger, P., and Url, T. (2010). Public export credit guarantees and foreign trade structure: Evidence from Austria. World Econ. 29, 399–418. doi:10.1111/j.1467-9701.2006.00790.x
Farrow, K., Grolleau, G., and Mzoughi, N. (2018). Less is more in energy conservation and efficiency messaging. Energy Policy 122, 1–6. doi:10.1016/j.enpol.2018.07.007
Feng, C., Wang, M., Liu, G., and Huang, J. (2017). Green development performance and its influencing factors: A global perspective. J. Clean. Prod. 144, 323–333. doi:10.1016/j.jclepro.2017.01.005
Grossman, G. M., and Helpman, E. (1991). Trade, knowledge spillovers, and growth. Eur. Econ. Rev. 35, 517–526. doi:10.1016/0014-2921(91)90153-a
Hao, Y., Gai, Z., and Wu, H. (2020). How do resource misallocation and government corruption affect green total factor energy efficiency? Evidence from China. Energy Policy 143, 111562. doi:10.1016/j.enpol.2020.111562
He, L., and Wang, L. (2020). Distinct exporters and the environment: Empirical evidence from China manufacturing. J. Clean. Prod. 258, 120614. doi:10.1016/j.jclepro.2020.120614
Ho, C., Wang, W., and Yu, J. (2018). International knowledge spillover through trade: A time-varying spatial panel data approach. Econ. Lett. 162, 30–33. doi:10.1016/j.econlet.2017.10.015
Hu, C., and Tan, Y. (2016). Export spillovers and export performance in China. China Econ. Rev. 41, 75–89. doi:10.1016/j.chieco.2016.08.008
Huang, J., Du, D., and Tao, Q. (2017). An analysis of technological factors and energy intensity in China. ENERG POLICY 109, 1. doi:10.1016/j.enpol.2017.06.048
Huang, L., and Lei, Z. (2021). How environmental regulation affect corporate green investment: Evidence from China. J. Clean. Prod. 279, 123560. doi:10.1016/j.jclepro.2020.123560
Jalles, J. T., and Ge, J. (2020). Emissions and economic development in commodity exporting countries. Energy Econ. 85, 104572. doi:10.1016/j.eneco.2019.104572
Jarreau, J., and Poncet, S. (2012). Export sophistication and economic growth: Evidence from China. J. Dev. Econ. 97, 281–292. doi:10.1016/j.jdeveco.2011.04.001
Josep, L. C. I. S., Tomás, D. B. C., and Enrique, L. B. (2005). Breaking the panels: An application to the GDP per capita. Econom. J. 8, 159–175. doi:10.1111/j.1368-423x.2005.00158.x
Kohler, M. (2013). CO2 emissions, energy consumption, income and foreign trade: A South African perspective. Energy Policy 63, 1042–1050. doi:10.1016/j.enpol.2013.09.022
Kong, Q., Peng, D., Ni, Y., Jiang, X., and Wang, Z. (2020). Trade openness and economic growth quality of China: Empirical analysis using ARDL model. Financ Res Lett.
Korves, N. (2011). “Is free trade good or bad for the environment? New empirical evidence.” in climate change:socioeconomic effects, edited by Juan Blanco, houshang kheradmand. London: InTech. doi:10.5772/23008
Lanoie, P., Patry, M., and Lajeunesse, R. (2008). Environmental regulation and productivity: Testing the porter hypothesis. J. Product. Anal. 30, 121–128. doi:10.1007/s11123-008-0108-4
Lesage, J. P. (2008). An introduction to spatial econometrics. rei. 123, 19–44. doi:10.4000/rei.3887
Li, B., and Wu, S. (2020). Effects of local and civil environmental regulation on green total factor productivity in China: A spatial Durbin econometric analysis. J. Clean. Prod. 153, 342. doi:10.1016/j.jclepro.2016.10.042
Li, J., and Lin, B. (2017). Ecological total-factor energy efficiency of China's heavy and light industries: Which performs better? Renew. Sustain. Energy Rev. 72, 83–94. doi:10.1016/j.rser.2017.01.044
Li, L., and Hu, J. (2012). Ecological total-factor energy efficiency of regions in China. Energy Policy 46, 216–224. doi:10.1016/j.enpol.2012.03.053
Li, S., and Wang, S. (2019). Examining the effects of socioeconomic development on China' s carbon productivity: A panel data analysis. Sci. Total Environ. 659, 681–690. doi:10.1016/j.scitotenv.2018.12.409
Li, K, K., Fang, L., and He, L. (2018). How urbanization affects China' s energy efficiency: A spatial econometric analysis. J. Clean. Prod. 200, 1130–1141. doi:10.1016/j.jclepro.2018.07.234
Li, M, M., Li, C., and Zhang, M. (2018). Exploring the spatial spillover effects of industrialization and urbanization factors on pollutants emissions in China' s Huang- Huai- Hai region. J. Clean. Prod. 19 5, 154. doi:10.1016/j.jclepro.2018.05.186
Lin, B., and Zhao, H. (2016). Technology gap and regional energy efficiency in China's textile industry: A non-parametric meta-frontier approach. J. Clean. Prod. 137, 21–28. doi:10.1016/j.jclepro.2016.07.055
Liu, X., and Bae, J. (2018). Urbanization and industrialization impact of CO2 emissions in China. J. Clean. Prod. 172, 178. doi:10.1016/j.jclepro.2017.10.156
Liu, Z., and Xin, L. (2019). Has China's belt and road initiative promoted its green total factor productivity?——evidence from primary provinces along the routeEvidence from primary provinces along the route. Energy Policy 129, 360–369. doi:10.1016/j.enpol.2019.02.045
Long, Y., and Xiaozhen, H. (2010). Analysis on regional difference and convergence of the efficiency of China' s green economy based on DEA. Economist 2, 46–54.
Lu, J., Lu, Y., and Tao, Z. (2010). Exporting behavior of foreign affiliates: Theory and evidence. J. Int. Econ. 81, 197–205. doi:10.1016/j.jinteco.2010.03.002
Ma, M., Yan, R., Du, Y., Ma, X., Cai, W., and Xu, P. (2017). A methodology to assess China's building energy savings at the national level: An IPAT – LMDI model approach. J. Clean. Prod. 143, 784–793. doi:10.1016/j.jclepro.2016.12.046
Ma, Y., Tang, H., and Zhang, Y. (2014). Factor Intensity, product switching, and productivity: Evidence from Chinese exporters. J. Int. Econ. 92, 349–362. doi:10.1016/j.jinteco.2013.11.003
Managi, S., Hibiki, A., and Tsurumi, T. (2009). Does trade openness improve environmental quality? J. Environ. Econ. Manage. 58, 346–363. doi:10.1016/j.jeem.2009.04.008
Mania, E., and Rieber, A. (2019). Product export diversification and sustainable economic growth in developing countries. Struct. Change Econ. D. 51, 138. doi:10.1016/j.strueco.2019.08.006
Manova, K., and Yu, Z. (2016). How firms export: Processing vs. ordinary trade with financial frictions. J. Int. Econ. 100, 120–137. doi:10.1016/j.jinteco.2016.02.005
Nesta, L., Vona, F., and Nicolli, F. (2014). Environmental policies, competition and innovation in renewable energy. J. Environ. Econ. Manage. 67, 396–411. doi:10.1016/j.jeem.2014.01.001
Pan, X., Li, M., Wang, M., Chu, J., and Bo, H. (2020). The effects of outward foreign direct investment and reverse technology spillover on China's carbon productivity. Energy Policy 145, 111730. doi:10.1016/j.enpol.2020.111730
Pan, X., Uddin, M. K., Han, C., and Pan, X. (2019b). Dynamics of financial development, trade openness, technological innovation and energy intensity: Evidence from Bangladesh. Energy 171, 456–464. doi:10.1016/j.energy.2018.12.200
Pan, X., Uddin, M. K., Saima, U., Jiao, Z., and Han, C. (2019a). How do industrialization and trade openness influence energy intensity? Evidence from a path model in case of Bangladesh. Energy Policy 133, 110916. doi:10.1016/j.enpol.2019.110916
Parrado, R., and De Cian, E. (2014). Technology spillovers embodied in international trade: Intertemporal, regional and sectoral effects in a global CGE framework. Energy Econ. 41, 76–89. doi:10.1016/j.eneco.2013.10.016
Poon, J. P. H., Casas, I., and He, C. (2006). The impact of energy, transport, and trade on air pollution in China. Eurasian Geogr. Econ. 47, 568–584. doi:10.2747/1538-7216.47.5.568
Porter, M. E., and Linde, C. V. D. (1999). Green and competitive: Ending the stalemate. Harv. Bus. Rev. 28, 128
Revesz, R. L. (1992). Rehabilitating Interstate Competition: Rethinking the " Race- to- the- Bottom" Rationale for Federal Environmental Regulation, 67. New York U Law Rev, 1210.
School of Earth Environment, University of Leeds, Leeds, UK (2016). Blowing policy bubbles: Rethinking emissions targets and low- carbon energy policies in the U. K. J. Environ. Pol. Plan., 1–16. doi:10.1080/1523908x.2016.1266931
Shahbaz, M., Khan, S., and Tahir, M. I. (2013). The dynamic links between energy consumption, economic growth, financial development and trade in China: Fresh evidence from multivariate framework analysis. Energy Econ. 40, 8–21. doi:10.1016/j.eneco.2013.06.006
Shan, H. J. (2008). Reestimating the capital stock of China: 1952-2006. J. Quantitative Tech. Econ. 10, 17–31.
Sheng, P., Zhai, M., Zhang, Y., and Kamal, M. A. (2020). The effects of urbanization on household wastewater emissions in China: Efficient- and inefficient- emissions. Environ. Pollut. 267, 115350. doi:10.1016/j.envpol.2020.115350
Sun, W., and Huang, C. (2020). How does urbanization affect carbon emission efficiency? Evidence from China. J. Clean. Prod. 272, 122828. doi:10.1016/j.jclepro.2020.122828
Tientao, A., Legros, D., and Pichery, M. C. (2016). Technology spillover and TFP growth : A spatial Durbin model. Int. Econ. 145, 21–31. doi:10.1016/j.inteco.2015.04.004
Tone, K. (2001). A slacks- based measure of efficiency in data envelopment analysis. Eur. J. Oper. Res. 130, 498–509. doi:10.1016/s0377-2217(99)00407-5
Wang, H., and Ang, B. W. (2018). Assessing the role of international trade in global CO2 emissions: An index decomposition analysis approach. Appl. Energy 218, 146–158. doi:10.1016/j.apenergy.2018.02.180
Wang, K, K., Miao, Z., Zhao, M., Miao, C., and Wang, Q. (2019). China ’ s provincial total- factor air pollution emission efficiency evaluation, dynamic evolution and influencing factors. Ecol. Indic. 10 7, 105578. doi:10.1016/j.ecolind.2019.105578
Wang, Z, Z., Huang, W., and Chen, Z. (2019). The peak of CO2 emissions in China: A new approach using survival models. Energy Econ. 81, 1099–1108. doi:10.1016/j.eneco.2019.05.027
Wu, H., Hao, Y., and Ren, S. (2020a). How do environmental regulation and environmental decentralization affect green total factor energy efficiency: Evidence from China. Energy Econ. 9 1, 104880. doi:10.1016/j.eneco.2020.104880
Wu, H., Hao, Y., and Weng, J. (2019). How does energy consumption affect China' s urbanization? New evidence from dynamic threshold panel models. Energ Policy 127, 24. doi:10.1016/j.enpol.2018.11.057
Wu, H., Xu, L., Ren, S., Hao, Y., and Yan, G. (2020b). How do energy consumption and environmental regulation affect carbon emissions in China? New evidence from a dynamic threshold panel model. Resour. Policy 67, 101678. doi:10.1016/j.resourpol.2020.101678
Yan, B., Duan, Y., and Wang, S. (2020). China ’ s emissions embodied in exports: How regional andtrade heterogeneity matter. Energy Econ. 87, 104479. doi:10.1016/j.eneco.2019.104479
Yang, Z. (2019). Editorial introduction to the special issue entitled: Spatial econometrics: New methods and applications. Reg. Sci. Urban Econ. 76, 1. doi:10.1016/j.regsciurbeco.2019.05.003
Yu, C., and Luo, Z. (2018). What are China's real gains within global value chains? Measuring domestic value added in China's exports of manufactures. China Econ. Rev. 47, 263–273. doi:10.1016/j.chieco.2017.08.010
Yuan, B., and Xiang, Q. (2018). Environmental regulation, industrial innovation and green development of Chinese manufacturing: Based on an extended CDM model. J. Clean. Prod. 17 (6), 895–908. doi:10.1016/j.jclepro.2017.12.034
Yuan, X. U., and Ya- Li, C. (2014). Technology effect of international trade: Based on the perspective of technology spillover. Chin. J. Popul. Resour. Environ. 24 (1), 148–156. doi:10.3969/j.issn.1002-2104.2014.01.021
Zhang, L., Xiong, L., Cheng, B., and Yu, C. (2018). How does foreign trade influence China ’s carbon productivity? Based on panel spatial lag model analysis. Struct. Chang. Econ. Dyn. 47, 171–179. doi:10.1016/j.strueco.2018.08.008
Zhang, Y., Zhao, Y., Liu, Y., Zhonghua, B., and Wang, S. (2017). Embodied carbon in China' s foreign trade: An online SCI- E and SSCI based literature review. Renew. Sust. Energy Rev. 68, 492–519. doi:10.1016/j.rser.2016.10.009
Zhang, Y., Yi, W., and Li, B. (2015). The impact of urbanization on carbon emission: Empirical evidence in beijing. Energy Procedia 75, 2963–2968. doi:10.1016/j.egypro.2015.07.601
Keywords: foreign trade, green total factor energy efficiency, spatial Durbin model, China, emission reduction
Citation: Xu J, Li J and Liu C (2022) How does foreign trade affect green total factor energy efficiency? Evidence from China. Front. Environ. Sci. 10:979177. doi: 10.3389/fenvs.2022.979177
Received: 27 June 2022; Accepted: 26 July 2022;
Published: 02 September 2022.
Edited by:
Magdalena Radulescu, University of Pitesti, RomaniaReviewed by:
Mihaela Simionescu, University of Social Sciences, PolandAlexandra Horobet, Bucharest Academy of Economic Studies, Romania
Copyright © 2022 Xu, Li and Liu. This is an open-access article distributed under the terms of the Creative Commons Attribution License (CC BY). The use, distribution or reproduction in other forums is permitted, provided the original author(s) and the copyright owner(s) are credited and that the original publication in this journal is cited, in accordance with accepted academic practice. No use, distribution or reproduction is permitted which does not comply with these terms.
*Correspondence: Jinye Li, MTUyOTkxMjc3NDVAMTYzLmNvbQ==