 Xinbin Cheng1
 Yudong Wang
 Xi Wu
Xi Wu
94% of researchers rate our articles as excellent or good
Learn more about the work of our research integrity team to safeguard the quality of each article we publish.
Find out more
ORIGINAL RESEARCH article
Front. Environ. Sci. , 05 August 2022
Sec. Environmental Economics and Management
Volume 10 - 2022 | https://doi.org/10.3389/fenvs.2022.978404
This article is part of the Research Topic Managing Climate Risk in the Global Economic System in the Post-COVID-19 Era View all 11 articles
In this study, we examine the effect of drought on industry stock prices using a balanced panel of monthly data for 15 industries classified by China Securities Regulatory Commission in 2012. By combining the results of ordinary least squares (OLS) estimation and quantile regression models, we present a comprehensive evaluation of the relationship between drought and industry stock prices. The OLS regression results generally show that drought is negatively correlated with industry stock prices. However, quantile regression reveals that the effect of drought changes from positive to negative from the lowest to the highest stock price quantile. In addition, drought resistance capacity varies by industry. We further use threshold regression to determine the effects of investor sentiment on the relationship between drought and stock prices and identify two different regimes: low sentiment and high sentiment. In the low sentiment regime, drought has a significant negative effect on industry stock prices, while in the high sentiment regime, drought has a significant positive impact on industry stock prices.
The global climate system is undergoing a major change characterized by global warming. Increasing climate change is becoming one of the main drivers of drought, as it speeds up the global water cycle, making wet areas wetter and dry areas drier (Wanders and Wada, 2015). Disintegrated planning, weak governance, and myopic water management can also lead to socioeconomic drought1. As a result, water resource management has become more important and difficult. Undoubtedly, a more detailed understanding of the economic impact of drought, including the identification of at-risk industries and the mechanisms contributing to drought hazards, are key steps toward a stronger risk-based approach to drought management. In a relatively efficient market, the impact of a disaster such as drought should be reflected by changes in short-run stock prices, which indicate market views on expected changes in the value of assets (Beatty and Shimshack, 2010; Balvers et al., 2017; Ding et al., 2022). In this study, the effect of drought is approached from the perspective of its effect on industry stock prices.
According to the Chinese Ministry of Water Resources, although China is rich in fresh water resources, its per-capita water resource level is only around a quarter of the global level. Consequently, China is one of 13 countries considered “water-poor” worldwide. This issue is exacerbated by the uneven distribution of China’s water resources, which is characterized by greater water availability in southern areas but a higher distribution of cultivated land in northern areas. More than 400 of China’s 660 cities face water shortages (i.e., two-thirds of cities have insufficient water supply)2. Regions across China exhibit significant cross-sectional variations in climate. Together with regional diversity, climate change has exacerbated the uneven distribution of water resources, thus increasing the disconnect between supply and demand in northern China and perpetuating regional drought in southern China. In addition, China is both a big agricultural country and an industrial country. Agriculture is most vulnerable to drought. Industrial production process is often accompanied by water pollution, which making the problem of drought and its impact more serious. A wrong or lack of intervention is likely to trigger socioeconomic drought. China’s geographic vastness, distinct industrial and climatological features provide a unique setting for a study on the economic impact of drought in an Asian country and enable new insights.
Initially, we estimate drought trends using the Palmer Drought Severity Index (PDSI)3, a widely used resource in climatology studies on drought (Palmer, 1965; Dai, 2011; Trenberth et al., 2014). Our sample comprises the monthly stock return data of 15 industries from 2000 to 2014. We then analyze the effect of drought by industry to account for industry heterogeneity, as this effect depends on both the industry’s water demand and the upstream and downstream water demands. From the perspective of the capital market on the economic impact of drought, we successively examine the responses of stock prices in different quantiles and the role of investor sentiment. We mainly use the quantile regression model to study the effect of drought on the conditional distribution of industry stock prices. The weather-related literature reveals that climate factors can affect stock prices by influencing investor sentiment (Kamstra et al., 2000; Hirshleifer and Shumway, 2003; Kamstra et al., 2003; Lu and Chou, 2012; Schmittmann et al., 2015) and that investor sentiment can lead to asymmetric stock price reactions (Chen et al., 2013; Ni et al., 2015). Inspired by this earlier work, we introduce the threshold regression model and find a threshold effect of investor sentiment on the relationship between drought and industry stock prices.
The OLS regression results generally show that drought is negatively correlated with industry stock prices. However, quantile regression reveals that the effect of drought changes from positive to negative from the lowest to the highest stock price quantile. In addition, drought resistance capacity varies by industry. We further use threshold regression to determine the effects of investor sentiment on the relationship between drought and stock prices and identify two different regimes: low sentiment and high sentiment. In the low sentiment regime, drought has a significant negative effect on industry stock prices, while in the high sentiment regime, drought has a significant positive impact on industry stock prices.
This study makes two contributions to the literature. First, by using data from China, a unique setting, to analyze whether and how drought affects stock prices, we contribute to a poorly explored area of research on the effects of climatological factors, climate change, and environmental disasters on economic factors. Second, we present the first industry-wide analysis of the effects of drought on stock prices. Previous studies in this area mainly focus on specific industries, such as agriculture, mining, and real estate (Bonnafous et al., 2017; Farzanegan et al., 2019; Hong et al., 2019), which usually have large water demand and undoubtedly are affected directly by drought. The potential effects of drought on other industries have received little attention. Our study addresses this gap in the literature.
The remainder of this paper is organized as follows. Section 2 describes the channels from drought to industry stock prices. Section 3 presents our data. Section 4 includes an introduction and demonstration of the model and discussion of the empirical results. Section 5 presents the robustness test. The final section contains our concluding remarks.
Drought has direct and indirect economic effects on agriculture and non-agriculture industries through soil moisture, rivers, groundwater, wetlands and reservoirs. In an efficient market, these effects will be reflected in industry stock prices. We call this phenomenon the market impacts of the drought on industry stock prices. From a non-market point of view, government departments and civil society organizations assist affect industries and individuals. For individuals, in addition to the risk of property loss, drought and the environmental chain reaction also brings threats to life and health. These consequences affect investor sentiment, which in turn feeds into risk-taking behavior and stock prices. In short, the effects of drought on industry stock prices can be divided into market and non-market levels. Among them, we focus on two more specific components, the economic impact and investor sentiment. Figure 1 is an overview of drought effects on industries stock prices.
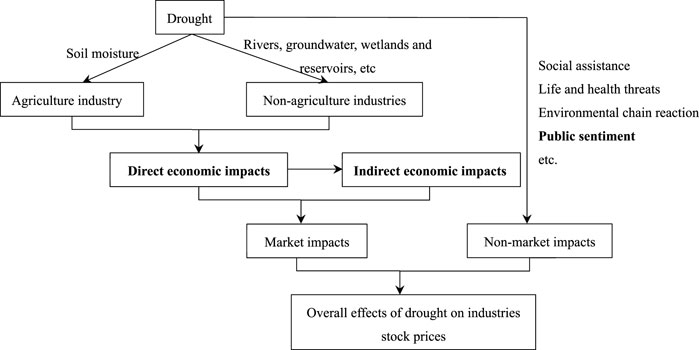
FIGURE 1. An overview of drought effects on industry stock prices.
It is a common practice in the literature to classify the economic effects of natural hazards, including drought into direct and indirect categories (Parker et al., 1987; Cochrane, 2004; Rose, 2004; Van der Veen, 2004). However, a unified and clear definition of the two categories is lacking. Defining the direct effects of drought as physical damage to buildings, crops and natural resources without considering large-scale economic damage does not meet the practical needs of drought economic impact assessment. Therefore, we follow Cochrane (2004), Rose (2004) and Ding et al. (2011) to expand the direct effects of drought to include both physical damage and consequences such as business disruption and unemployment. The indirect impacts are defined as the interaction between industries and the cost of transaction.
For direct effects, agriculture is the most vulnerable industry to drought. Inadequate soil moisture results in crop failure. The economic losses and distribution caused by negative supply shocks of agricultural products depend on the market structure and the supply-demand relations. Farmers can get compensation by buying insurance, or transfer economic losses through high prices. In extreme cases, they can even profit from drought. However, offsets are widespread across vast territories. That is, higher crop prices will attract the inflow of crops from non-arid areas, which curbing local crop prices increase.
Drought also has a direct economic impact on non-agricultural industries by affecting rivers, groundwater, wetlands and reservoirs. Utilities such as water management and water supply need to pay for a balance between supply and demand. In the tourism industry, the development space of forest, grassland, ice and snow, and wetland becomes smaller. The safety and accessibility of the shipping industry are threatened by the drying up of rivers. Other industries are more or less directly affected by drought due to water and environmental needs.
For indirect effects, the direct effects of drought on an industry spread upstream or downstream. In the shipping industry, for example, 2.93 billion tons of goods pass along the Yangtze River in 2019, including large quantities of iron ore, thermal coal and mining and construction materials4. Poor transportation of thermal coal will aggravate electricity shortage, while shortages of iron ore and mining materials will affect manufacturing, real estate and mining industries. The increase in raw material prices is expected to pass through the price transfer, but is also likely to cause a decline in income. Any form of economic losses will influence the economic decisions of market participants in the next stage, thus driving a new round of economic impacts.
A number of psychological results show that natural disasters have a great influence on sentiment (Nolen-Hoeksema and Morrow, 1991; Krug et al., 1998; Jha et al., 2021). The space-time character of drought should be considered when analyzing its impacts on sentiment. Spatially, drought affects sentiment in arid area and non-arid area through different mechanisms. Direct and indirect gains and losses of assets, as well as life and health crises, may be the main channels through which drought affects the sentiment of arid communities (Bica et al., 2017). Finance can be the savior or the oppressor. Financial Insurance promotes risk-sharing, but insurance contracts and intermediaries are usually designed to prevent subsequent renegotiations (Diamond and Rajan, 2001; Agarwal et al., 2017). When uninsured disasters occur, economic losses are usually concentrated in a small group of people, leading to dissatisfaction and negative emotions (Chetty et al., 2020; Mongey et al., 2021). However, insurance measures may also be ineffective in compensating for property losses and mitigating negative sentiment. Gennaioli et al. (2020) show that insurance claims are often disputed and lead to non-payment or reduced payment. Government aid can act as a backstop and stabilize market sentiment (Jha et al., 2021). In addition, drought may have a positive emotional impact on those who profit from it, such as producers of drought resistance devices and farmers outside the disaster zone.
Social media has changed the way the public engages in disasters and other mass emergencies (Palen and Hughes, 2018). People outside the disaster area can easily communicate sentiment with people in the disaster area through social media, and get witness texts, photos, videos, maps and other information about the disaster. Bica et al. (2017) find that locals are more focused on human suffering and losses, while non-locals are more concerned about recovery and relief efforts. Individual orientations reflected by different positions and concerns produce different sentiments (Bravo-Marquez et al., 2014). Sentiment analysis through machine learning using social media data has become a popular topic in recent years. Yoo et al. (2018) argue that real-time generated content in social media includes information about social issues and events such as natural disasters. They developed the Polaris system to use the real-time information to analyze and predict the emotional trajectories of users. Neppalli et al. (2017) use Twitter data to visualize users’ emotions around hurricanes, and then analyze their emotional communication.
From the timeline, public sentiment is evolving at different stages of disaster development. Gruebner et al. (2017) use social media data to surveilla New York population mental health after disasters. They find 24 sentiments spatial clusters. Among them, sadness and disgust are the most prominent sentiments. Anger, confusion, disgust and fear clusters appear pre disaster, surprise is found peri disaster, and sadness emerges post disaster. Han and Wang (2019) use microblog data to analyze people’s sentiments during the flood in Shouguang City, China in 2018, and detect nine sentiments. They prove that these sentiments have different time trends.
The psychological literature shows that affective states induce emotional congruence bias in risk decision making, which is expressed as a preference for risk in positive sentiments, and risk aversion in negative sentiments (Yuen and Lee, 2003; Schulreich et al., 2014; Otto et al., 2016). This phenomenon is also fully supported by clinical observations. People with depression tend to ignore the positive aspects, while people with mania tend to ignore the potentially negative consequences of their actions (Beck, 2008; Edition, 2013; Huys et al., 2015). Inspired by this, behavioral economics and finance researchers have identified events that appear to affect asset prices, particularly stock prices, through their impacts on the affective state of investors. Edmans et al. (2007) find a significant stock market decline after soccer losses. Frieder and Subrahmanyam (2004) believe that stock prices are boosted by anticipation and optimism ahead of Patrick’s Day and Rosh Hashanah. Lepori (2015) finds that endings of hit teleplay trigger negative emotions in viewers, leading to a drop in stock prices. Saunders (1993) confirms that weather-related sentiment has a significant effect on stock prices. The average stock price on a sunny day is higher than on a cloudy one. Bassi et al. (2013) provide further experimental evidence that sunshine and good weather promote risk-taking through sentiment channel.
In summary, the drought can affect industry stock prices through economic impact and investor sentiment. Given China’s vast territory, people’s complex positions and emotions, and the complex space-time nature of the drought, we cannot accurately predict the size and direction of drought impacts on industry stock prices. Therefore, it becomes a major problem to be studied in this paper. Another question we are interested in is whether the effects of drought vary depending on investor sentiment.
Our sample comprises a monthly balanced panel of data from 15 industries classified as follows by the China Securities Regulatory Commission in 2012: agriculture, forestry, animal husbandry, and fishery (AFAHF); mining (Min); manufacturing (Man); electricity, heat, gas, and water production and supply (EHGWPS); construction (Con); wholesale and retail (W&R); transportation, storage, and postal services (TSPS); accommodation and catering (A&C); information transmission, software, and information technology services (ITS); finance (Fin); real estate (RE); leasing and business services (LBS); water, environment, and public facilities management (WEPFM); culture, sports, and entertainment (CSE); and comprehensive industry (Com). The data span the 2000–2014 period. Economic and financial data are obtained from the China Securities Market and Accounting Research database. As a quantitative measure of drought, PDSI data are taken from the website of the National Center for Atmospheric Research.
Industry stock return is the dependent variable and drought trend is the independent variable. We first calculate the industry stock return (Indreturn) by weighting the monthly stock return of A-share listed companies in a given industry by the circulating market value and subtracting the risk-free interest rate as follows:
where subscripts i, t, and n represent the industry, time, and number of companies in the industry, respectively.
As the drought trend (Trend) is calculated based on the PDSI index, it is beneficial to understand the ranges and trends of the PDSI values at the sample sites. The PDSI usually falls between −4 and 4; values greater than 0 indicate the degree of moisture, while lower values indicate the degree of dryness. Table 1 presents the correspondence between the PDSI values and drought severity. Figure 2 plots the time series of monthly PDSI values for China from 1930 to 2014 with a fitted trend line. The PDSI fluctuates violently within a range of roughly −6 to 6. The downward-sloping fitted trend line indicates the increasing drought trend in China. The average PDSI from 1930 to 2014 is −1.096, compared with −2.774 during the sample period of 2000–2014; thus, the drought situation in China has changed from slight to moderate drought. Together with the short-term violent fluctuations, these data demonstrate that China is affected by long-term drought and threatened by short-term floods.
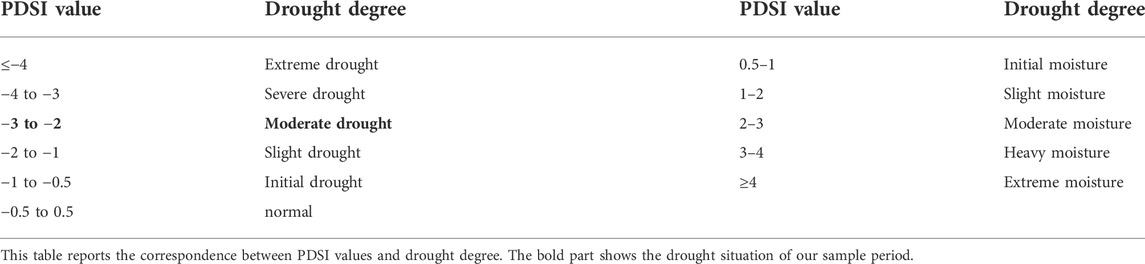
TABLE 1. The correspondence between PDSI values and drought degree.
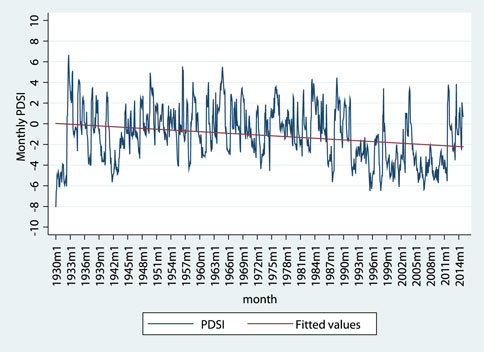
FIGURE 2. Historical PDSI for China. This figure plots the time series of monthly PDSI value for China. The sample period is from January of 1930 to December of 2014. The PDSI value is displayed on the blue line. The red line is the fit line.
We focus on the impact of the long-term drought trend because it has greater economic value and policy guidance implications. Following Hong et al. (2019), we measure Trend as
This AR(1) model is augmented with a deterministic time trend t. The coefficient b of the deterministic time trend is the parameter of interest that captures the long-term drought trend. We define Trend as equal to
We introduce some control variables according to the actual situation and the relevant theoretical model. First, we include the 36-month moving average PDSI (PDSI36) in the control variables to capture the short-term drought effect. As shown in Figure 2, China faces long-term drought problems but short-term flood hazards.
Our analysis of industry stock prices is based mainly on the Fama–French three-factor model. Therefore, we add the market factor (RP), the size factor (SMB), and the book-to-market factor (HML) to the control variables.
RP is the difference between the monthly A-share market return and the monthly risk-free interest rate. The monthly market return rate is calculated using the weighted average method for the market value of circulation, and cash dividend reinvestment is considered.
SMB is the difference between the monthly returns of a small-cap stock portfolio and a large-cap stock portfolio. Portfolio division is based on the Fama 2 × 3 portfolio division method. The monthly return of the portfolio is calculated using the weighted market value of circulation.
HML is the difference between the monthly returns of a combination of the high book-to-market ratio and the low book-to-market ratio. The portfolio division is based on the Fama 2 × 3 portfolio division method. The monthly return of the portfolio is calculated using the weighted market value of circulation.
Table 2 describes the statistical results, including the means, medians, standard deviations, skewness, kurtosis, and results of tests of normal distribution and stability. These data are intended to facilitate a preliminary understanding of the properties and distribution of industry stock returns and the key variables used in this study. As shown in Table 2, stock returns in various industries have similar statistical characteristics, and mean industry stock prices and associated SDs fluctuate widely. All of the stock return series are fat-tailed and right-skewed, suggesting asymmetry. The Jarque–Berra test provides further evidence that the stock returns in nearly all industries are not normally distributed. The last column of Table 2 presents the results of the augmented Dickey–Fuller test. All of the time series, including Trend and PDSI36, are stationary.
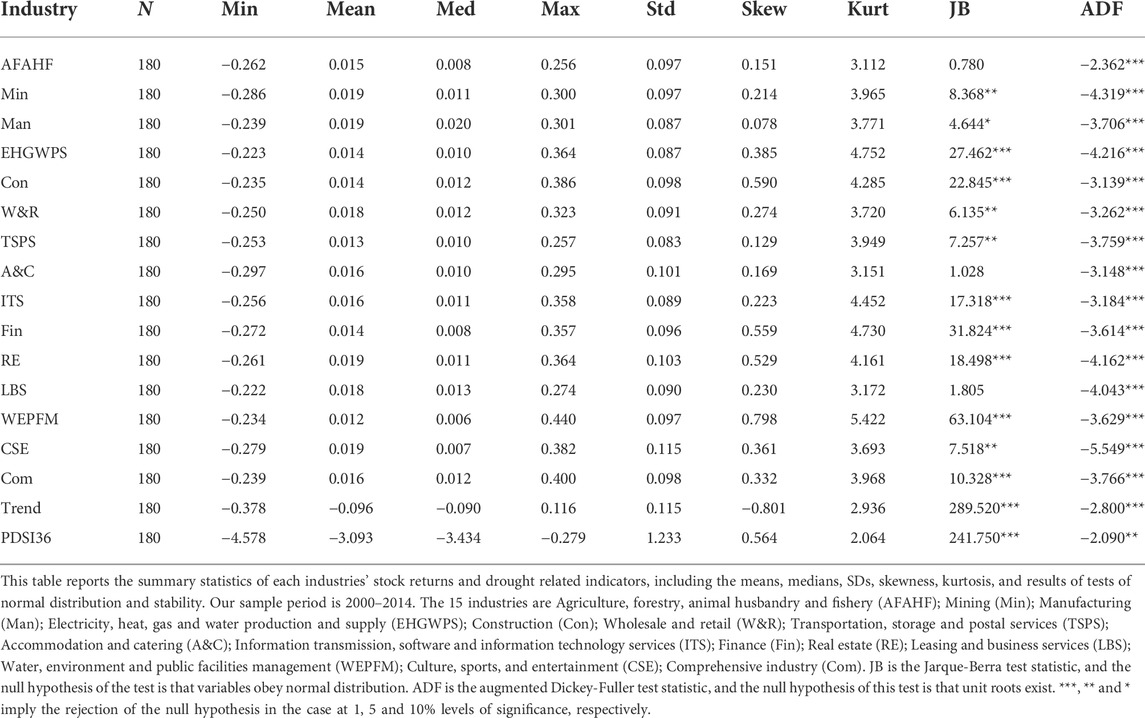
TABLE 2. Summary statistics.
We use the classical ordinary least-squares (OLS) multiple linear model and quantile regression model to examine the effect of drought on stock prices by industry. The basic model is as follows:
where
The OLS method gives the conditional mean of the target variable as
The conditional expectation
Quantile regression, as proposed by Koenker and Bassett (1978), provides comprehensive information about the conditional distribution of
where
where T is the sample size and
Table 3 reports our empirical results. Column (1) presents the results of the OLS estimation and columns (2) to (8) list the results of the quantile regression estimation. For brevity, we report only the coefficients of Trend. Notably, the OLS and quantile regression estimations are distinct, with relatively fewer significant values in the OLS regression. We first focus on column (1). Among the 15 coefficients of Trend, only one is negative and is not significant. However, 4 of the 14 positive coefficients are significant. Because Trend is negatively correlated with the degree of drought, positive coefficients of Trend indicate that drought poses downside risks to stock prices in various industries, with significant risks in the AFAHF, Man, Fin, and WEPFM industries. A study by the National Academy of Sciences (1999) classifies the effects of drought as direct, such as “physical destruction of buildings, crops and natural resources,” and indirect, such as “consequences of such destruction, such as temporary unemployment and business disruption.” The Man, WEPFM, and particularly AFAHF industries have high water demand and are more directly affected by drought (Deschênes and Greenstone, 2007). In contrast, the effect of drought on the Fin industry reflects more indirect costs related to drought-related business disruptions and backward and forward multiplier economic effects, such as non-performing loans.
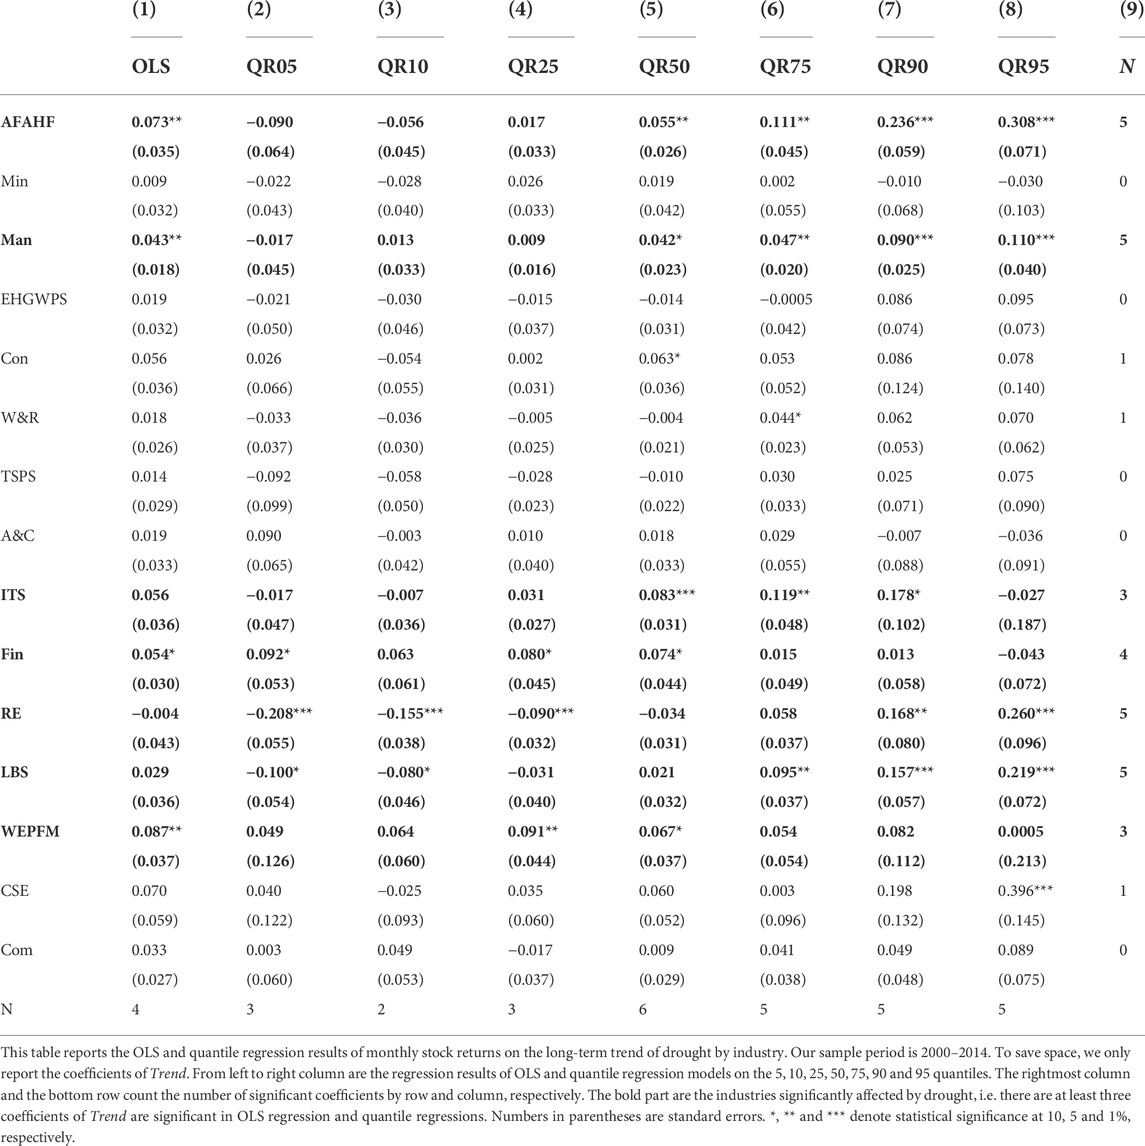
TABLE 3. Coefficients of Trend in OLS and quantile regressions by industry.
Quantile regressions can comprehensively reveal the effect of drought on industry stock prices. Columns (2) to (8) of Table 3 reveal that in addition to the four industries listed above, another six industries are affected by drought to various degrees. The strongest effects are observed in the RE and LBS industries, which are both widely associated with other industries. The RE industry is affected by many upstream industries, such as steel, cement, machinery, and home decoration. The LBS industry affects many downstream industries because it includes a wide range of areas, such as business management services, legal consulting, market management, advertising services, conferences and exhibitions, and other business services. As a result, these industries are affected more severely by droughts through subtle, indirect mechanisms involving industrial chains.
Lines 4, 7, and 8 of Table 3 demonstrate that drought does not significantly affect the EHGWPS, TSPS, and A&C industries. This phenomenon may be attributable to various factors, including an active governmental intervention policy and the nature of company ownership. As mentioned above, China’s drought problem is local, not global; dry and wet conditions not only follow an uneven spatial distribution but also a highly variable temporal distribution. To address this long-term imbalance in water resource distribution and complement current resources, the government has developed the South-to-North Water Diversion and West-to-East Electricity Transmission projects. The construction of reservoirs, desalination of seawater, prevention and control of water pollution, and protection of the environment have also effectively enhanced the resilience of these industries to drought. Furthermore, resources considered vital to livelihoods and the economy, such as water, electricity, and transportation, are mostly controlled by the state, and thus the stock prices in these industries are more strongly influenced by national policies. The food industry also is not significantly affected by drought for several reasons. First, the allocation of water resources can alleviate the problem of food production at its source. Second, national grain reserves and imported food supplies can be used as needed to address food shortages. Third, policies to control food prices can prevent excessive inflation.
The coefficients of Trend tend to change from negative to positive from the lowest to the highest stock price quantile. In high quantiles, however, the marginal effect is usually significant. We conclude that co-movement tends to exist in booming markets with high expected returns. A long-term drought trend is not conducive to economic prosperity.
Figure 3 plots changes in the coefficients of Trend across quantiles by industry. The 95% confidence interval is indicated by shading. The shift in the basic shape from negative to positive in Figure 3 confirms the overall trend of the coefficients in Table 3. For all industries, the 95% CI widens at both ends of the conditional distribution, indicating that the estimated coefficients are less accurate. The estimated OLS coefficients and 95% CIs (indicated by the dotted line) again demonstrate the superior ability of quantile regression to fully explore the relationship between drought and industry stock prices.
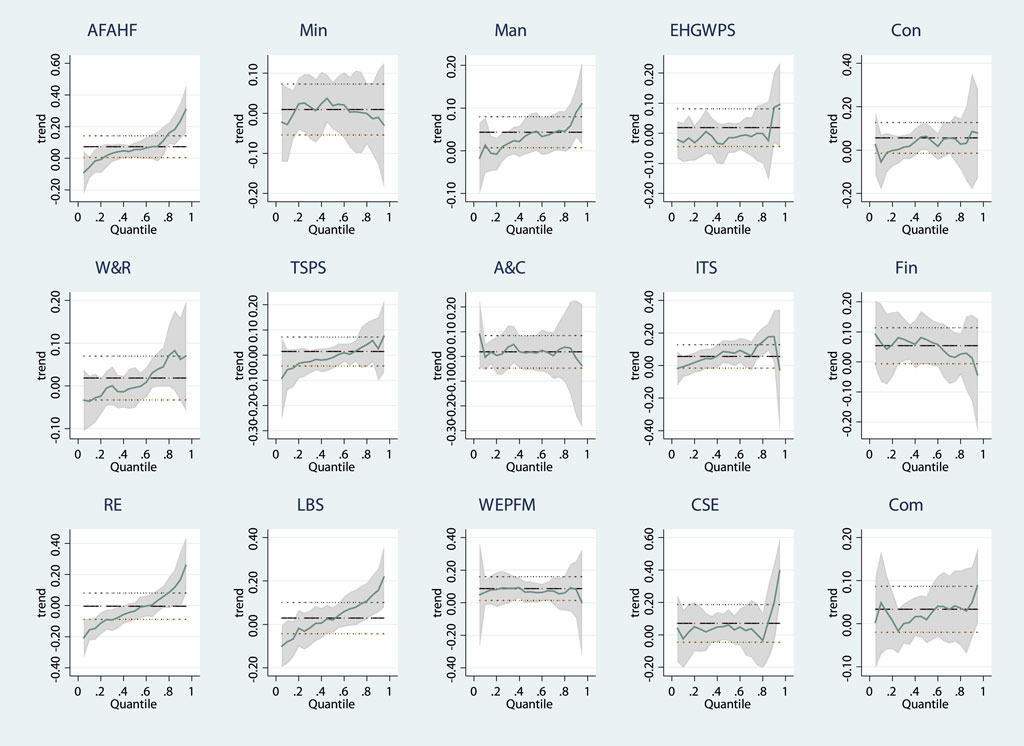
FIGURE 3. Quantile slope coefficients of Trend. The blue line is the coefficient values of Trend, and the shadow is the corresponding 95% CI. The dotted line is the coefficient value of ordinary least square estimation of Trend and its corresponding 95% CI.
Quantile regression can reveal the effect of drought on the conditional distribution of industrial stock returns. However, a study of the effect of the degree of drought on industrial stock prices is also interesting and can provide more information about the dependence and structure of the relationship between these variables. We build model (7) as follows:
where subscript t represents the month and
Table 4 shows the regression results produced by model (7), classified by industry. In all industries, the coefficients of Trend remain positive, again proving that a trend of long-term drought is not conducive to an increase in industry stock prices, as shown in Table 3. However, a discussion of Table 4 should focus on the coefficient estimates of
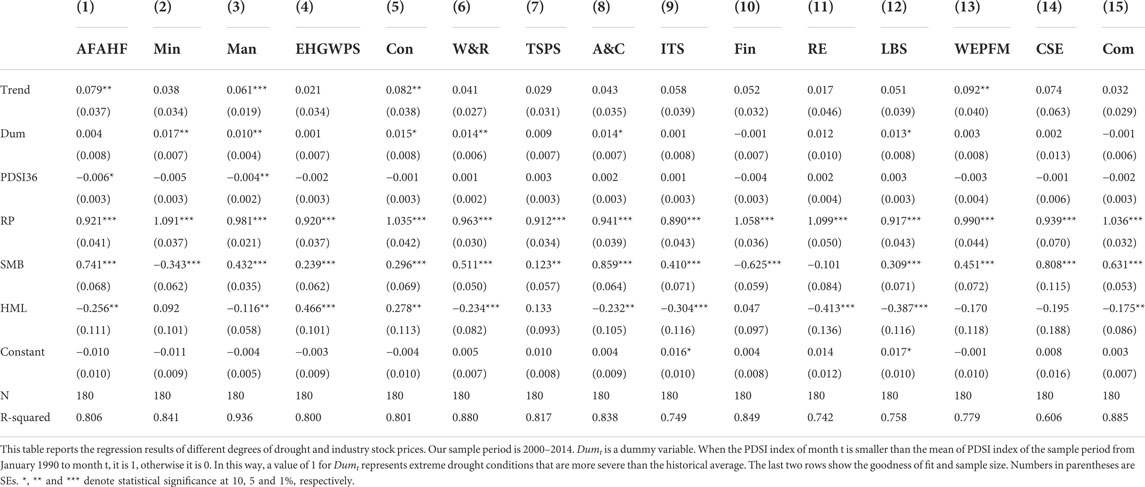
TABLE 4. The impact of different degrees of drought on industry stock price.
The results of quantile regression show that drought has a complex effect on industry stock returns. This relationship may be affected not only by fundamental factors but also by irrational factors, such as investor sentiment. The signs of the coefficients of Trend in each quantile are inconsistent, indicating that the relationship between drought and industry stock returns may be nonlinear due to variable investor sentiment. Therefore, we consider the threshold effect of investor sentiment. To avoid error caused by an artificial division of the investor sentiment interval, we use the threshold panel model developed by Hansen (1999). This model can be used to specify the threshold variable, namely investor sentiment, and endogenously divide the intervals according to the characteristics of the data, allowing a study of the relationship between drought and industry stock returns in different sentiment regimes.
We first focus on a single threshold model and expand it to a multi-threshold model. The single threshold model is set as follows:
Unlike the empirical evidence above, our threshold model (8) is based on panel data of industry stock returns: subscript i represents the various industries and t is the month.
To obtain the parameter estimator, we subtract the intra-group mean from each observation to eliminate the individual effect
Coefficients
where
If
We also divide the sample according to the empirical results in Table 3 to better test the threshold effect of investor sentiment. We divide the sample using a cut-off value of 3 for the total significant number of Trend coefficients in the OLS regression and quantile regression of an industry. Industries with a cut-off value greater than 3 comprise the first sub-sample, which includes AFAHF, Man, ITS, Fin, RE, LBS, and WEPFM. Drought has a significant effect on these industries, and it thus increases the probability of observing the threshold effect of investor sentiment. The remaining industries comprise the second sub-sample; here, drought has a lesser effect, so the evidence of a threshold effect of investor sentiment may not be observed. Table 5 presents the F-statistics, probability values, and critical values at the 10, 5, and 1% levels for each test of each sample. We use a bootstrap method to calculate the critical F-statistic value. The bootstrap number is 300.
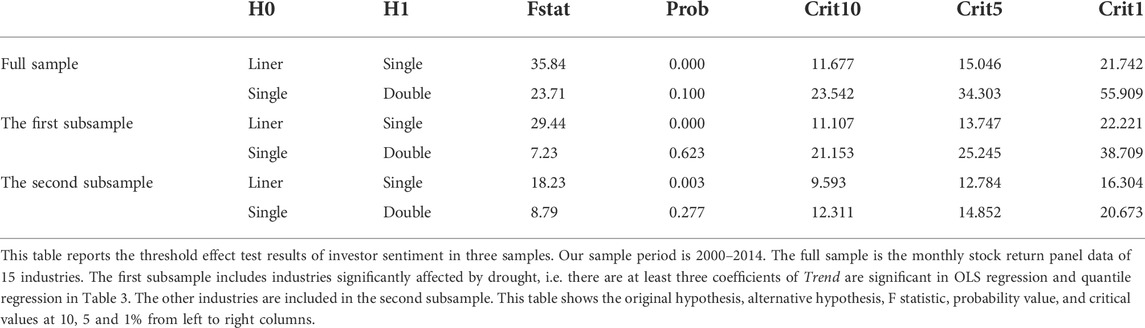
TABLE 5. Threshold effect test of investor sentiment.
In the test of the linear model, the F-statistics for the whole sample, the first and the second sub-sample are 35.84, 29.44, and 18.23, each of which rejects the null hypothesis at a 1% level of significance. However, the null hypothesis is not rejected in all samples during the test of the single-threshold model. Therefore, the single-threshold model is suitable for studying the threshold effect of investor sentiment on the relationship between drought and industry stock returns.
To verify the robustness of the results, we present the estimation results for both the linear model and the single-threshold model in Table 6, which also lists the regression results of the full sample and the subsamples. All of the linear models show positive coefficients of Trend, again verifying the results of OLS regression for each industry in Table 3. In other words, the correlation between drought and stock prices is generally negative. After the threshold feature is introduced, the SD of the model error decreases and the determinable coefficient increases, indicating that this feature captures at least some of the nonlinear components of the variable relationship. We first focus on the full sample. The estimated threshold value of 52.3 falls within the 95% CI [50.5,53.7], indicating that the estimated threshold value is consistent with the true value. We can sample into a low sentiment regime (
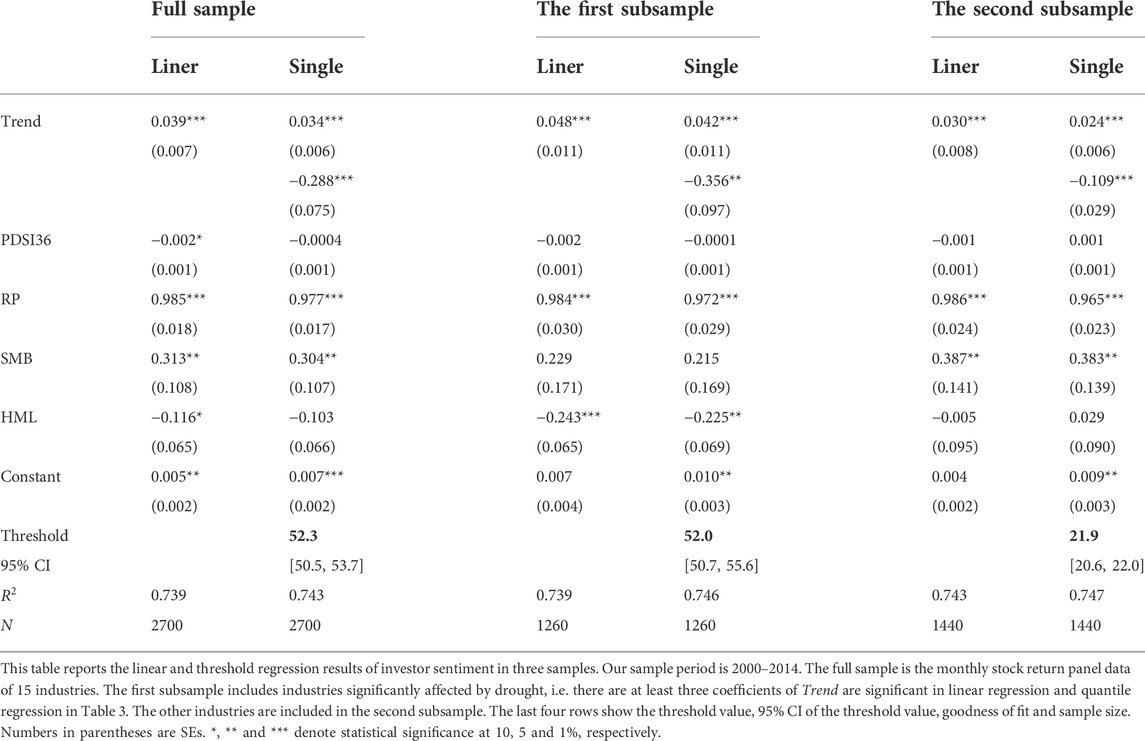
TABLE 6. Threshold regression results of investor sentiment.
The results of regression are the same in the subsamples as in the whole sample. Specifically, as investor sentiment shifts from low to high, the correlation between drought and industry stock prices shifts from negative to positive. The first subsample has a threshold value of 52.0, which is very close to that of the whole sample. Although we also observe a significant threshold effect of investor sentiment in the second subsample, its threshold value of 21.9 is less than half of the corresponding values of the whole sample and the first subsample. Therefore, the effect of drought on industry stock prices is more likely to be distorted by investor sentiment in the second subsample, although we note that the effect of drought on industry stock prices is smaller in the second than in the first subsample. In the low sentiment regime, the coefficients of Trend are 0.034, 0.042, and 0.024 in the whole sample, first subsample, and second subsample, respectively. In the high sentiment regime, the coefficient of Trend in the second subsample is −0.109, which is approximately half of the corresponding value in the full sample which is −0.288 and one-third of that in the first subsample which is −0.356. These results are consistent with the results of regression in Table 3, which demonstrate drought has a less significant effect on industry stock prices in the second subsample. In summary, the results of regression of the threshold model confirm the influence of the investor sentiment threshold on the relationship between drought and industry stock prices.
China has a pronounced monsoon climate, with seasonal variations in precipitation. According to the China Meteorological data network5, precipitation is more frequent in the second and third quarters than in the first and fourth quarters. This pattern may affect estimation of the drought trend. To determine whether our regression results are affected by this phenomenon, we add quarter dummy variables to the long-term drought trend measurement model:
This AR(1) model is augmented with a deterministic time trend t and quarter dummies.
Table 7 shows the OLS and quantile regression results of individual industries based on this alternative measure of Trend. Again, the OLS regression results show a negative correlation between drought and industry stock prices, and this relationship is significant in four industries, although Fin is replaced with ITS. The results of quantile regression demonstrate that more than half of the industries are significantly affected by drought, and this effect is usually positive when stock prices are low and negative when prices are high. The coefficient estimation accuracy is higher at high stock price quantiles. The AFHAF, Man, ITS, RE, and LBS industries are most affected by drought, similar to the results shown in Table 3. In summary, the OLS and quantile regression results are in line with our previous findings.
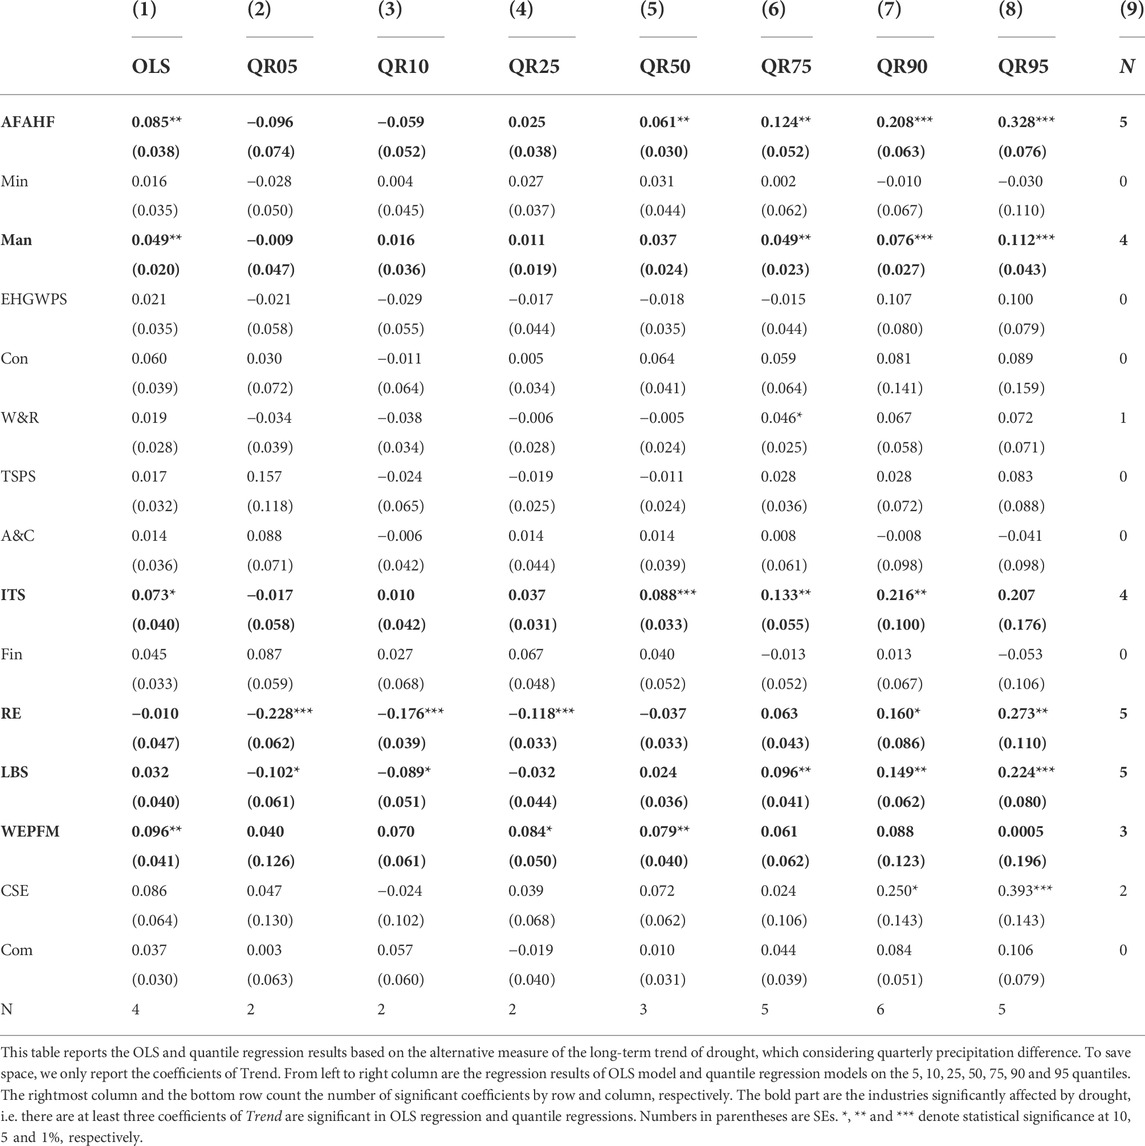
TABLE 7. Robustness check Ⅰ: OLS and quantile regressions considering quarterly precipitation difference.
As shown in Table 8, the results of the threshold effect reveal a single-threshold effect in the whole sample and the first subsample but a double-threshold effect in the second subsample. Table 9 reports both the linear and threshold regression results. The results of linear regression still show a negative correlation of drought with stock prices. No significant changes are observed in the results of threshold regression in either the whole sample or the subsamples. Despite the double-threshold effect in the second subsample, the regression results do not differ substantially from those in Table 6. Specifically, the threshold values in the second subsample are 16.3 and 18.5. At turnover rates higher than 16.3, the impact of drought on stock prices changes from negative to positive, and this positive impact becomes stronger at turnover rates higher than 18.5. Once again, these results demonstrate that the threshold effect of investor sentiment is more likely to distort the relationship between drought and stock prices in the second subsample. A comparison of the subsamples shows that drought has a greater negative effect on the first subsample but nearly identical positive effects on both subsamples, and the second subsample has a significantly lower threshold value. In summary, our main findings are not altered by considering the quarterly effects in our calculation of the long-term drought trend.
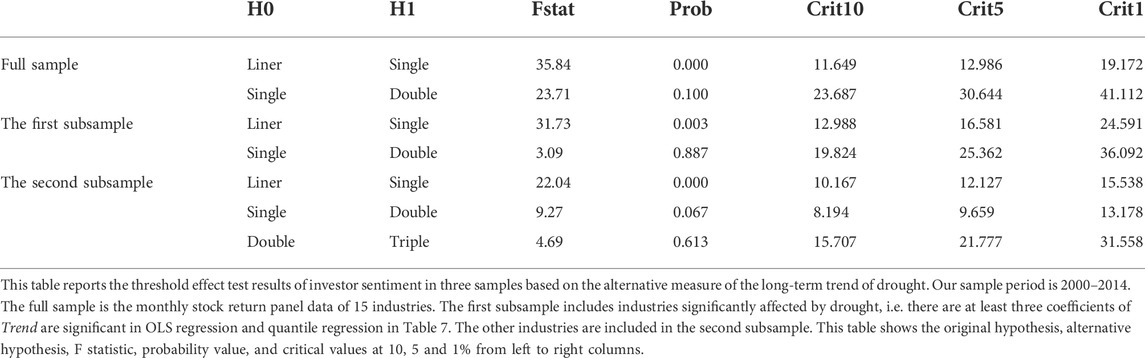
TABLE 8. Robustness check Ⅰ: Threshold effect test of investor sentiment considering quarterly precipitation difference.
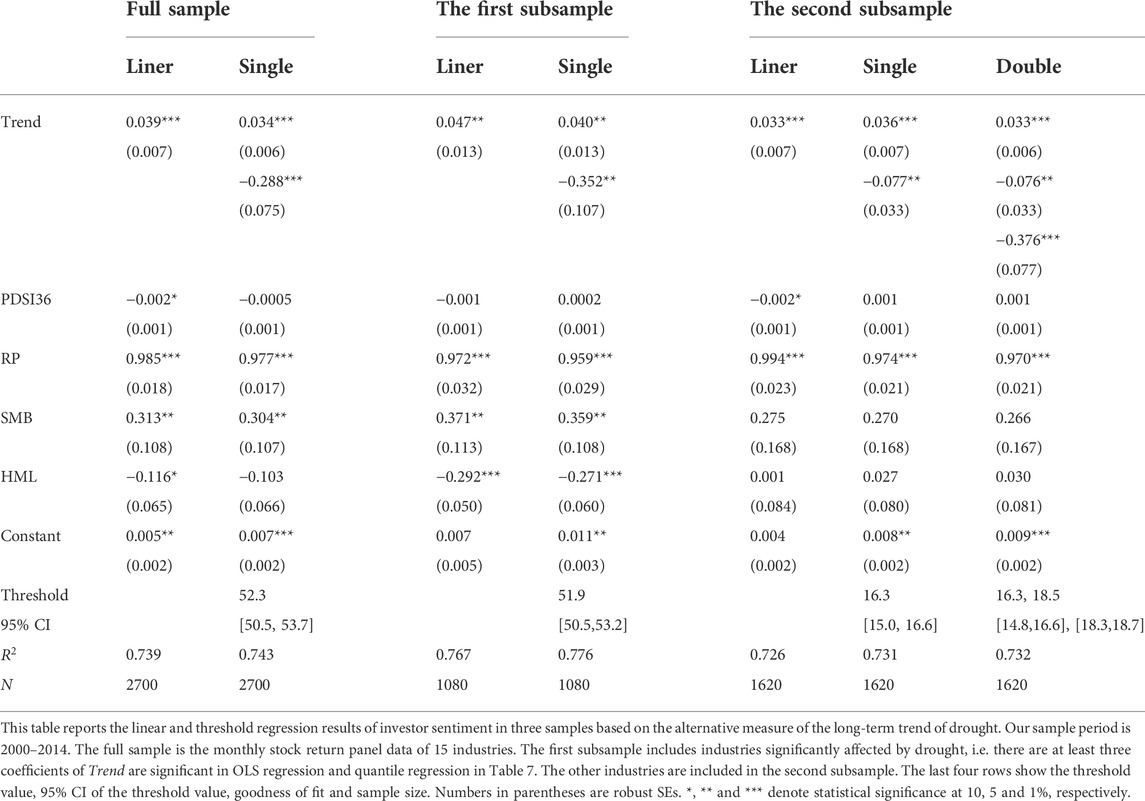
TABLE 9. Robustness check Ⅰ: Threshold regression results of investor sentiment considering quarterly precipitation difference.
Following the literature, we use Trend calculated based on the AR(1) model in our main empirical analysis. To improve robustness, we use the Box–Jenkins process to reselect the model, determine the order, and calculate Trend. As PDSI is a stationary time series, we calculate the autocorrelation coefficient and partial autocorrelation coefficient to determine the suitability of the ARMA, AR, and MA models. The autocorrelation coefficient tails off to zero, and the partial autocorrelation coefficient is truncated. Although the third-order partial autocorrelation coefficient is significantly different from zero, values above the third order can be considered equal to zero. Therefore, we extend model (2) to the AR(3) model to recalculate Trend and repeat our empirical analysis of the economic impact of drought.
Table 10 presents the results of OLS and quantile regression of the relationship between drought and industry stock prices, which are very close to the results in Table 3. OLS regression reveals a negative effect of drought on industry stock prices. Further consideration of the quantile regression results reveals that for almost all of the industries, the effect of drought shifts from positive to negative with the transition from the low to high quantile and is more significant in the high quantile. This evidence shows that drought is not conducive to economic prosperity and has a negative overall effect on industry stock prices. Individually, OLS regression captures the significant effects of drought on the AFAHF, Man, Fin, and WEPFM industries, while quantile regression further captures the significant effects of drought on the ITS, RE, and LBS industries. These results are consistent with our earlier findings.
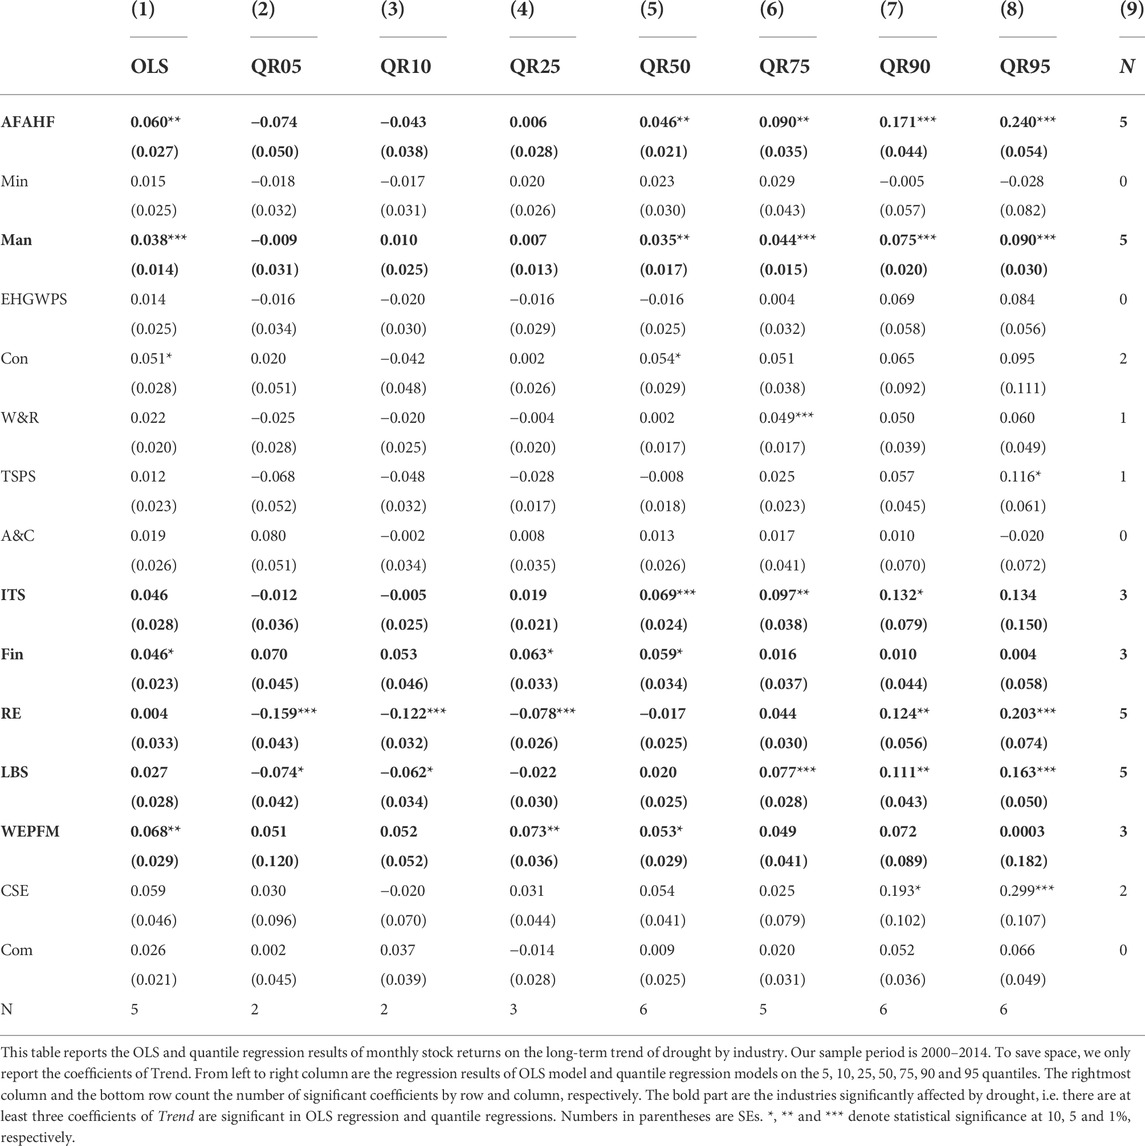
TABLE 10. Robustness check Ⅱ: OLS and quantile regressions based on Trend calculated by Box-Jenkins process.
It is also interesting to study the delayed response of industry stock prices by directly lagging Trend by one period. Here, we replace
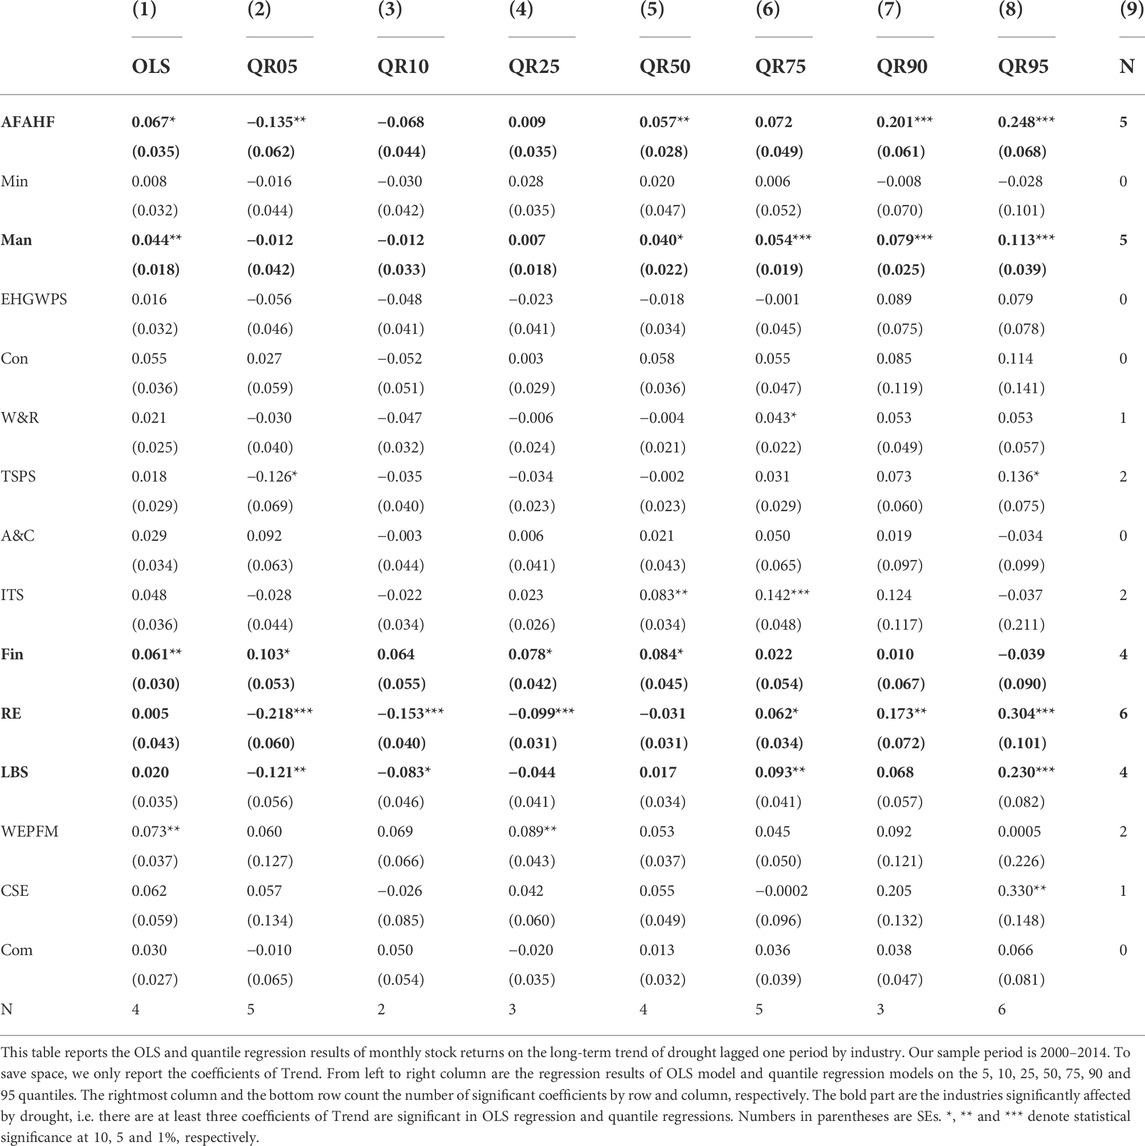
TABLE 11. Robustness check Ⅲ: OLS and quantile regressions based on
In China, drought is a frequent form of natural disaster characterized by a relative long duration and wide range of effects. Increases in global warming and changes to atmospheric circulation patterns have exacerbated the drought trend in China in recent years. This paper uses the PDSI to examine the effects of long-term drought trends on stock prices in various industries from 2000 to 2014.
The structure and strength of the relationship between drought and stock prices vary according to industry. The results obtained using OLS regression models show that drought generally has a negative correlation with industry stock prices. However, our OLS regression models only identify four industries that are significantly affected by drought. The quantile regression model provides a more comprehensive analysis of the relationship between drought and industry stock prices, revealing that drought significantly affects stock prices in 10 of the 15 studied industries to various degrees. The AFAHF, Man, ITS, Fin, RE, LBS, and WEPFM industries are particularly vulnerable to drought. Furthermore, the effect of drought on industry stock prices shifts from positive to negative as the analysis moves from low to high quantiles and is more significant in the high quantiles latter group. This result indicates that drought is not conducive to economic prosperity.
The results from our threshold model based on panel data show that the effects of drought on industry stock prices vary according to the threshold effect of investor sentiment. In the low sentiment regime, drought is negatively correlated with industry stock prices, whereas in the high sentiment regime, this correlation positive. This pattern suggests that investors are overly cautious or pessimistic during periods of low sentiment period, leading to the undervaluation of stocks, whereas they tend to speculate during periods of high sentiment, leading to the overvaluation of stocks.
Our findings have many implications for policy-makers, practitioners, and academics. First, they confirm the industry-based heterogeneity in the economic effect of drought and the threshold effect of investor sentiment. This confirmation will help the government to guide market investors and formulate drought-response policies for specific industries. Second, our findings may help investors to build portfolios that control their risk of exposure to drought. Third, our results demonstrate the need for more in-depth, detailed studies of the economic effect of drought that combine the effects of different scenarios and other factors, such as industry heterogeneity and investor sentiment.
Although the effects of drought are extensive and complex, research on these effects in the field of economics is still in its infancy. Constrained by the availability of data on drought, this paper mainly studies the economic effect of drought from a capital market perspective, focusing on different quantiles of stock prices and the role of investor sentiment. However, the field of economics still holds considerable scope for drought research. When regional drought data collected over longer time spans and at a higher frequency and greater density become easy to obtain, studies based on panel data and time series data can be carried out smoothly. For example, regional drought indicators can be matched to company addresses, enabling the construction of panel data to study the effect of drought at the firm level. Regarding time series, the overall drought index can be used to study the effects of drought on stock price indexes and commodity futures prices and to predict stock price indexes or inform the construction of commodity futures hedging strategies.
Publicly available datasets were analyzed in this study. This data can be found here: China Securities Market and Accounting Research database National Center for Atmospheric Research.
All authors contribute equally to the paper.
The authors declare that the research was conducted in the absence of any commercial or financial relationships that could be construed as a potential conflict of interest.
All claims expressed in this article are solely those of the authors and do not necessarily represent those of their affiliated organizations, or those of the publisher, the editors and the reviewers. Any product that may be evaluated in this article, or claim that may be made by its manufacturer, is not guaranteed or endorsed by the publisher.
1Socioeconomic drought refers to conditions whereby the water demand outstrips the supply, leading to societal, economic, and environmental impacts (Hayes et al., 2011; Zseleczky and Yosef, 2014).
2http://www.ches.org.cn/ches/kpyd/szy/201703/t20170303_879724.htm.
3The Palmer Drought Index (PDSI) is based on the relationship between water supply and demand. A situation wherein the local water supply falls short of demand is defined as drought; otherwise, it is considered humid. Water supply data are relatively easy to obtain and are usually expressed by precipitation. In contrast, water demand calculations are more complex because they involve the influences of temperature, soil properties, land use, and other factors. To solve this problem, Palmer put forward the concept of “climatically appropriate for existing conditions,” defined water demand as “climatically appropriate precipitation,” and use the difference between actual precipitation and climatically appropriate precipitation to determine water profit and loss status. The PDSI considers not only the current water supply and demand but also the influence of previous dry and wet conditions and their durations on the current drought situation. Although this index is not perfect, it is the most widely used and readily available resource for climate studies (Alley, 1984).
4Website of the Ministry of Transport of the People’s Republic of China: https://www.mot.gov.cn/.
Agarwal, S., Amromin, G., Ben-David, I., Chomsisengphet, S., Piskorski, T., and Seru, A. (2017). Policy intervention in debt renegotiation: evidence from the home affordable modification program. J. Political Econ. 125 (3), 654–712. doi:10.1086/691701
Alley, W. M. (1984). The palmer drought severity index: limitations and assumptions. J. Clim. Appl. Meteor. 23 (7), 1100–1109. doi:10.1175/1520-0450(1984)023<1100:tpdsil>2.0.co;2
Baker, M., and Wurgler, J. (2006). Investor sentiment and the cross-section of stock returns. J. Finance 61 (4), 1645–1680. doi:10.1111/j.1540-6261.2006.00885.x
Baker, M., Wurgler, J., and Yuan, Y. (2012). Global, local, and contagious investor sentiment. J. Financ. Econ. 104 (2), 272–287. doi:10.1016/j.jfineco.2011.11.002
Balvers, R., Du, D., and Zhao, X. (2017). Temperature shocks and the cost of equity capital: implications for climate change perceptions. J. Bank. Finance 77, 18–34. doi:10.1016/j.jbankfin.2016.12.013
Barberis, N., Shleifer, A., and Vishny, R. W. (1998). A model of investor sentiment. J. Financial Econ. 49 (3), 307–343. doi:10.1016/s0304-405x(98)00027-0
Bassi, A., Colacito, R., and Fulghieri, P. (2013). An experimental analysis of weather and risk attitudes in financial decisions. Rev. Financ. Stud. 7 (26), 1824–1852. doi:10.1093/rfs/hht004
Beatty, T., and Shimshack, J. P. (2010). The impact of climate change information: new evidence from the stock market. B. E. J. Econ. Analysis Policy 10 (1), 1–29. doi:10.2202/1935-1682.2374
Beck, A. T. (2008). The evolution of the cognitive model of depression and its neurobiological correlates. Am. J. Psychiatry 165 (8), 969–977. doi:10.1176/appi.ajp.2008.08050721
Bica, M., Palen, L., and Bopp, C. (2017). “Visual representations of disaster,” in Proceedings of the 2017 ACM conference on computer supported cooperative work and social computing, Portland, OR, USA, February 25–March 1, 2017, 1262–1276.
Bonnafous, L., Lall, U., and Siegel, J. (2017). An index for drought induced financial risk in the mining industry. Water Resour. Res. 53 (2), 1509–1524. doi:10.1002/2016wr019866
Bravo-Marquez, F., Mendoza, M., and Poblete, B. (2014). Meta-level sentiment models for big social data analysis. Knowledge-Based Syst. 69, 86–99. doi:10.1016/j.knosys.2014.05.016
Brown, G. W., and Cliff, M. T. (2005). Investor sentiment and asset valuation. J. Bus. 78 (2), 405–440. doi:10.1086/427633
Chen, M. P., Chen, P. F., and Lee, C. C. (2013). Asymmetric effects of investor sentiment on industry stock returns: panel data evidence. Emerg. Mark. Rev. 14, 35–54. doi:10.1016/j.ememar.2012.11.001
Chetty, R., Friedman, J. N., Hendren, N., and Stepner, M. (2020). Real-time economics: a new platform to track the impacts of COVID-19 on people, businesses, and communities using private sector data. NBER Working Paper, 27431.
Cochrane, H. (2004). Economic loss: myth and measurement. Disaster prevention and management. Disaster Prev. Manag. 13 (4), 290–296. doi:10.1108/09653560410556500
Dai, A. (2011). Characteristics and trends in various forms of the palmer drought severity index during 1900–2008. J. Geophys. Res. 116 (D12), D12115. doi:10.1029/2010jd015541
Deschênes, O., and Greenstone, M. (2007). The economic impacts of climate change: evidence from agricultural output and random fluctuations in weather. Am. Econ. Rev. 97 (1), 354–385. doi:10.1257/aer.97.1.354
Diamond, D. W., and Rajan, R. G. (2001). Liquidity risk, liquidity creation, and financial fragility: a theory of banking. J. Political Econ. 109 (2), 287–327. doi:10.1086/319552
Ding, H., Ji, Q., Ma, R., and Zhai, P. (2022). High-carbon screening out: a DCC-MIDAS-climate policy risk method. Finance Res. Lett. 47, 102818. doi:10.1016/j.frl.2022.102818
Ding, Y., Hayes, M. J., and Widhalm, M. (2011). Measuring economic impacts of drought: a review and discussion. Disaster prevention and management. Disaster Prev. Manag. 20 (4), 434–446. doi:10.1108/09653561111161752
Edition, F. (2013). Diagnostic and statistical manual of mental disorders. Washington, DC: Am Psychiatric Assoc, 21.
Edmans, A., Garcia, D., and Norli, Ø. (2007). Sports sentiment and stock returns. J. Finance 62 (4), 1967–1998. doi:10.1111/j.1540-6261.2007.01262.x
Farzanegan, M. R., Feizi, M., and Fereidouni, H. G. (2019). Drought and property prices: empirical evidence from Iran (No. 16-2019). MAGKS Joint Discussion Paper Series in Economics.
Frieder, L., and Subrahmanyam, A. (2004). Nonsecular regularities in returns and volume. Financial Analysts J. 60 (4), 29–34. doi:10.2469/faj.v60.n4.2634
Gennaioli, N., La Porta, R., Lopez-de-Silanes, F., and Shleifer, A. (2020). Trust and insurance contracts (No. w27189). NBER Working Paper Series.
Gropp, J. (2004). Mean reversion of industry stock returns in the US, 1926–1998. J. Empir. Finance 11 (4), 537–551. doi:10.1016/j.jempfin.2004.04.002
Gruebner, O., Lowe, S. R., Sykora, M., Shankardass, K., Subramanian, S. V., and Galea, S. (2017). A novel surveillance approach for disaster mental health. PLoS One 12 (7), e0181233. doi:10.1371/journal.pone.0181233
Han, X., and Wang, J. (2019). Using social media to mine and analyze public sentiment during a disaster: a case study of the 2018 Shouguang city flood in China. ISPRS Int. J. Geoinf. 8 (4), 185. doi:10.3390/ijgi8040185
Hansen, B. E. (1999). Threshold effects in non-dynamic panels: estimation, testing, and inference. J. Econom. 93 (2), 345–368. doi:10.1016/s0304-4076(99)00025-1
Hayes, M., Wilhite, D., Svoboda, M., and Trnka, M. (2011). “Investigating the connections between climate change, drought and agricultural production,” in Handbook on climate change and agriculture. Editors A. Dinar, and R. Mendelsohn (Northampton, MA: Edward Elgar Pub. Inc.), 73–86.
Hirshleifer, D. A., and Shumway, T. (2003). Good day sunshine: stock returns and the weather. J. Finance 58 (3), 1009–1032. doi:10.1111/1540-6261.00556
Hong, H., Li, F. W., and Xu, J. (2019). Climate risks and market efficiency. J. Econ. 208 (1), 265–281. doi:10.1016/j.jeconom.2018.09.015
Huang, D., Jiang, F., Tu, J., and Zhou, G. (2015). Investor sentiment aligned: a powerful predictor of stock returns. Rev. Financ. Stud. 28 (3), 791–837. doi:10.1093/rfs/hhu080
Huys, Q. J., Daw, N. D., and Dayan, P. (2015). Depression: a decision-theoretic analysis. Annu. Rev. Neurosci. 38, 1–23. doi:10.1146/annurev-neuro-071714-033928
Jha, M., Liu, H., and Manela, A. (2021). Natural disaster effects on popular sentiment toward finance. J. Financial Quantitative Analysis (JFQA) 56 (7), 35. doi:10.2139/ssrn.3833110
Kamstra, M. J., Kramer, L. A., and Levi, M. D. (2000). Losing sleep at the market: the daylight saving anomaly. Am. Econ. Rev. 90 (4), 1005–1011. doi:10.1257/aer.90.4.1005
Kamstra, M. J., Kramer, L. A., and Levi, M. D. (2003). Winter blues: a SAD stock market cycle. Am. Econ. Rev. 93 (1), 324–343. doi:10.1257/000282803321455322
Kaplanski, G., and Levy, H. (2010). Sentiment and stock prices: the case of aviation disasters. J. Financial Econ. 95 (2), 174–201. doi:10.1016/j.jfineco.2009.10.002
Kim, M. J., Nelson, C. R., and Startz, R. (1991). Mean reversion in stock prices? A reappraisal of the empirical evidence. Rev. Econ. Stud. 58 (3), 515–528. doi:10.2307/2298009
Koenker, R., and Bassett, G. (1978). Regression quantiles. Econometrica 46, 33–50. doi:10.2307/1913643
Krug, E. G., Kresnow, M. J., Peddicord, J. P., Dahlberg, L. L., Powell, K. E., Crosby, A. E., et al. (1998). Suicide after natural disasters. N. Engl. J. Med. Overseas. Ed. 338 (6), 373–378. doi:10.1056/nejm199802053380607
Lemmon, M., and Portniaguina, E. (2006). Consumer confidence and asset prices: some empirical evidence. Rev. Financ. Stud. 19 (4), 1499–1529. doi:10.1093/rfs/hhj038
Lepori, G. M. (2015). Investor mood and demand for stocks: evidence from popular TV series finales. J. Econ. Psychol. 48, 33–47. doi:10.1016/j.joep.2015.02.003
Lu, J., and Chou, R. K. (2012). Does the weather have impacts on returns and trading activities in order-driven stock markets? Evidence from China. J. Empir. Finance 19 (1), 79–93. doi:10.1016/j.jempfin.2011.10.001
Mian, G. M., and Sankaraguruswamy, S. (2012). Investor sentiment and stock market response to earnings news. Account. Rev. 87 (4), 1357–1384. doi:10.2308/accr-50158
Mongey, S., Pilossoph, L., and Weinberg, A. (2021). Which workers bear the burden of social distancing? J. Econ. Inequal. 19 (3), 509–526. doi:10.1007/s10888-021-09487-6
National Academy of Sciences (1999). The impacts of natural disasters: A framework for loss estimation. Available at: http://www.nap.edu/catalog/6425.html (Accessed July 5, 2022).
Neppalli, V. K., Caragea, C., Squicciarini, A., Tapia, A., and Stehle, S. (2017). Sentiment analysis during Hurricane Sandy in emergency response. Int. J. Disaster Risk Reduct. 21, 213–222. doi:10.1016/j.ijdrr.2016.12.011
Ni, Z. X., Wang, D. Z., and Xue, W. J. (2015). Investor sentiment and its nonlinear effect on stock returns—new evidence from the Chinese stock market based on panel quantile regression model. Econ. Model. 50, 266–274. doi:10.1016/j.econmod.2015.07.007
Nolen-Hoeksema, S., and Morrow, J. (1991). A prospective study of depression and posttraumatic stress symptoms after a natural disaster: the 1989 loma prieta earthquake. J. Personality Soc. Psychol. 61 (1), 115–121. doi:10.1037/0022-3514.61.1.115
Otto, A. R., Fleming, S. M., and Glimcher, P. W. (2016). Unexpected but incidental positive outcomes predict real-world gambling. Psychol. Sci. 27 (3), 299–311. doi:10.1177/0956797615618366
Palen, L., and Hughes, A. L. (2018). “Social media in disaster communication,” in Handbook of disaster research. Editors H. Rodríguez, W. Donner, and J. Trainor, 497–518. doi:10.1007/978-3-319-63254-4_24
Palmer, W. C. (1965). Meteorological drought, 30. Washington, DC: US Department of Commerce, Weather Bureau.
Parker, D., Green, C., and Thompson, P. (1987). Urban flood protection benefits, a project appraisal guide “the red book”. USA: Gower Publishing Company, Brookfield.
Rose, A. (2004). “Economic principles, issues, and research priorities in hazard loss estimation,” in Modeling spatial and economic impacts of disasters (Berlin, Heidelberg: Springer), 13–36.
Schmittmann, J. M., Pirschel, J., Meyer, S., and Hackethal, A. (2015). The impact of weather on German retail investors. Rev. Finance 19 (3), 1143–1183. doi:10.1093/rof/rfu020
Schulreich, S., Heussen, Y. G., Gerhardt, H., Mohr, P. N., Binkofski, F. C., Koelsch, S., et al. (2014). Music-evoked incidental happiness modulates probability weighting during risky lottery choices. Front. Psychol. 4, 981. doi:10.3389/fpsyg.2013.00981
Trenberth, K. E., Dai, A., Der Schrier, G. V., Jones, P. D., Barichivich, J., Briffa, K. R., et al. (2014). Global warming and changes in drought. Nat. Clim. Chang. 4 (1), 17–22. doi:10.1038/nclimate2067
Van der Veen, A. (2004). Disasters and economic damage: macro, meso and micro approaches. Disaster Prev. Manag. Int. J. 13, 274–279. doi:10.1108/09653560410556483
Wanders, N., and Wada, Y. (2015). Human and climate impacts on the 21st century hydrological drought. J. Hydrology 526, 208–220. doi:10.1016/j.jhydrol.2014.10.047
Yoo, S., Song, J., and Jeong, O. (2018). Social media contents based sentiment analysis and prediction system. Expert Syst. Appl. 105, 102–111. doi:10.1016/j.eswa.2018.03.055
Yuen, K. S., and Lee, T. M. (2003). Could mood state affect risk-taking decisions? J. Affect. Disord. 75 (1), 11–18. doi:10.1016/s0165-0327(02)00022-8
Keywords: drought, quantile regression, threshold regression, industry perspective, stock prices
Citation: Cheng X, Wang Y and Wu X (2022) The effects of drought on stock prices: An industry-specific perspective. Front. Environ. Sci. 10:978404. doi: 10.3389/fenvs.2022.978404
Received: 26 June 2022; Accepted: 07 July 2022;
Published: 05 August 2022.
Edited by:
Qiang Ji, Chinese Academy of Sciences (CAS), ChinaReviewed by:
Zhiyuan Pan, Southwestern University of Finance and Economics, ChinaCopyright © 2022 Cheng, Wang and Wu. This is an open-access article distributed under the terms of the Creative Commons Attribution License (CC BY). The use, distribution or reproduction in other forums is permitted, provided the original author(s) and the copyright owner(s) are credited and that the original publication in this journal is cited, in accordance with accepted academic practice. No use, distribution or reproduction is permitted which does not comply with these terms.
*Correspondence: Xi Wu, d3g0MzQ0Mzg4NTNAcXEuY29t
Disclaimer: All claims expressed in this article are solely those of the authors and do not necessarily represent those of their affiliated organizations, or those of the publisher, the editors and the reviewers. Any product that may be evaluated in this article or claim that may be made by its manufacturer is not guaranteed or endorsed by the publisher.
Research integrity at Frontiers
Learn more about the work of our research integrity team to safeguard the quality of each article we publish.