- 1School of Management Science and Engineering, Shandong University of Finance and Economics, Jinan, Shandong, China
- 2Institute of Marine Economy and Management, Shandong University of Finance and Economics, Jinan, Shandong, China
Marine aquaculture not only has considerable economic benefits, but also provides high-quality “decarbonization space” for carbon neutrality, which is of great significance for realizing the goal of “double carbon”. Using the two-stage LMDI (logarithmic mean division index) method, this paper comprehensively analyzes the mechanism of net carbon sink capacity of mariculture in China from five factors: aquaculture structure, aquaculture efficiency, aquaculture scale, competitiveness of shellfish and algae and aquaculture mode. The results show that: 1) the net carbon sink of mariculture in China has increased year by year from 2010 to 2019, with obvious heterogeneous spatial distribution characteristics in three marine economic zone. 2) The improvement of aquaculture efficiency and innovation of aquaculture model contribute the most to the increase of carbon sink, and technological progress plays an increasingly important role. 3) The weak competitiveness of shellfish and algae seriously hinders the growth rate of carbon sink, and is the main reason for the increasing tightening of carbon sink space. 4) Regional heterogeneity analysis shows that the mechanism of increasing carbon sink in marine aquaculture is regionally heterogeneous and resource-dependent. Based on these findings, strategies are proposed to emphasize the ecological values of marine aquaculture, accelerate the technological innovation of deep-sea marine aquaculture, improve the organizational system and the management level, and expand the space for marine carbon sink.
1 Introduction
According to the United Nations “Blue Carbon report”, the blue carbon of marine biological accounts for more than half (55%) of the biological carbon of the earth. Although the concept of carbon sink in aquaculture is still unclear, Krause-Jensen and Duarte (2016) pointed out that algae may be an important source of marine sediments and carbon sequestration in the deep sea. Algae can transform dissolved inorganic carbon in seawater into organic carbon through photosynthesis or absorption of dissolved nutrients, so as to promoting the diffusion of atmospheric CO2 into seawater. Shellfish can make use of bicarbonate in seawater to form carbonate shell, and its carbon sequestration process acts as a biological pump, which also accelerates the diffusion of CO2 in the atmosphere into seawater. Therefore, the cultivation of shellfish and algae has obvious influence on carbon cycle, and it can become a “removable carbon sink” through harvesting, which is of great significance for improving the negative emission capacity of the ocean.
China has a coastline of 18,000 kilometers on the mainland, with a sea area of 4.7 million square kilometers. Researches about carbon sink in aquaculture have been conducted for more than a decade in China (Zhang et al., 2021). Many researchers have analyzed and demonstrated carbon sink in aquaculture from various perspectives such as environment, economy, aquaculture methods, and aquaculture species (Tang et al., 2011; Tang and Liu, 2016; Jiao, 2021), marine aquaculture is increasingly becoming the “carbon sink field” with its considerable economic benefits and unique ecological value of blue carbon. However, marine aquaculture industry has been criticized for environmental pollution for a long time and is an important “pollution source” in offshore waters. Aquaculture pollution, antibiotics, growth hormone pollution, cross-contamination of water bodies and foam pollution caused by inferior equipment produced by marine aquaculture have led to serious problems of coastal eutrophication and deterioration of the water environment. In 2019, ten ministries and commissions, including the Ministry of Agriculture and Rural Affairs in China, jointly issued “Several Opinions on Accelerating the Green Development of Aquaculture”, which encourage the development of non-feeding filter-feeding shellfish and algae, and pointed out the direction for both “carbon sink increasing” and “pollution controlling".
Our research has made several contributions. Firstly, based on the resource and environmental constraints faced by the development of marine aquaculture, this paper systematically identifies the Spatio-temporal characteristics and evolution of the carbon sink of marine aquaculture in China. Secondly, this paper focuses on the “carbon sink fishery” with high-efficiency carbon sequestration and no bait, such as shellfish and algae, and systematically analyzes the influencing factors and mechanisms of net carbon sink of marine aquaculture and the evolution of its contribution to sinking. Thirdly, this paper is of great practical significance to expand the space for net carbon sink of marine aquaculture and promote the high-quality development of marine fishery.
The remainder of this paper is organized as follows: Section 2 reviews the relevant literature, Section 3 describes the research methods and data sources used in this paper, Section 4 analyzes the empirical results, and Section 5 presents the conclusions and suggestions of this paper.
2 Literature review
Jiao et al. (2010), Jiao and Xu (2018) pointed out that the micro bio-carbon pump may be an important unexplored carbon sink, which has a great application prospect to realize the function of ocean carbon sink. Many scholars have calculated the carbon sequestration capacity of different types of algae in different regions. For example, the average carbon sequestration capacity of Japanese algae is 1.3 tons per hectare per year (Muraoka, 2004), and that of Australian coastal algae is 0.4 tons per hectare per year (Filber-Dexter and Wernberg, 2020), and the carbon sequestration of Eastern seaweeds in China is 2.4, 1.2 and 8.2 times that of the Bohai Sea, the Yellow Sea and the South Sea, respectively (Shao et al., 2019b), and the carbon sequestration rate of Kirin was found to be 16–68 tons per hectare per year through indoor culture (Erlania and Radiarta, 2015). Shellfish culture, which is considered to have higher carbon sink efficiency and longer carbon sink cycles, has been called the most promising “ocean filter”. In particular, the shells of shellfish can be sequestered for a long time and become more stable carbon sink by means of handicraft processing, landfilling, or settling into sediments and be buried after ingestion and decomposition during the growth of shellfish.
Marine carbon sink is regarded as the most potential carbon sink activity (Tang and Liu, 2016), which is an important part of the upgrading of marine aquaculture industry and the supply-side structural reform of fishery output (Xu et al., 2018), and an important strategy to realize the sustainable development of marine aquaculture (Yu et al., 2018). China took the lead in putting forward the concept of carbon sink in fisheries and actively advocated low-carbon fisheries. According to the research data of Tang (2011), between 1999 and 2008, China removed 4.4 million tons of carbon dioxide from water bodies through shellfish aquaculture annually, which is equivalent to an annual average of more than 500,000 hectares of compulsory afforestation, and saving the national afforestation investment of nearly 40 billion yuan. Scholars have done a lot of research on the estimation method of carbon sink capacity of marine aquaculture and the influencing factors for the development of carbon sink fishery.
The calculation of carbon sink capacity of fishery species is more complicated (Pershing et al., 2010). The initial estimation method mainly uses the energy budget model to estimate the carbon sink output of shellfish and algae by using the feeding energy, fecal energy, excretory energy, metabolic energy and growth energy of shellfish and algae in marine aquaculture (Zhang et al., 2005). With the further understanding of the mechanism of carbon sink in fisheries, scholars began to calculate the carbon catch of algae by using the empirical coefficients of the proportion of dissolved organic carbon and particulate organic carbon released during the growth of different algae to the carbon sequestration in photosynthesis (Yan et al., 2011), or calculate the final catch by the ecological conversion efficiency of all levels in the fishery food chain (Zhang et al., 2013), so as to deduce the carbon sequestration capacity of shellfish and algae. In recent years, scholars have gradually unified the calculation method of carbon sink capacity, that is, using the output and carbon content of shellfish and algae to calculate their respective carbon sink capacity, and summing them to obtain the carbon sink capacity (Qi et al., 2012; Shao et al., 2019a; Zhang et al., 2020).
At present, the measurement of marine aquaculture carbon sink capacity is mainly divided into two dimensions. One is from the perspective of material quality, or focus on the estimation of algae carbon sink capacity (Alvera-Azcárate et al., 2003; Mitra et al., 2014; Quan et al., 2014), or expand the estimation scope to the estimation of shellfish and algae carbon sink capacity (Shao et al., 2019b; Xu et al., 2020); Second, from the perspective of fishery carbon sink value, estimate the economic value of shellfish and algae carbon sink (Yue et al., 2014; Shen and Liang, 2018; Yu et al., 2020), so as to explore the ecological and economic benefits of carbon sink fishery.
Smith (1981) pointed out that the carbon sink output of macroalgae may play an important role in the realization of global carbon balance. Since then, scholars have extensively explored the influencing factors of algae carbon sink capacity, and considered that the cost of aquaculture (Alpert et al., 1992), the way of artificial aquaculture, whether the nutrition is sufficient or not, and even whether the carbon moves out of the water due to artificial intervention in algae harvest (Orr and Sarmiento, 1992) are all the factors influencing the carbon sink capacity of algae. Researchers in China studies many factors influencing carbon sink capacity of marine aquaculture, such as aquaculture mode, fishery output technology level (Sun and Zhao, 2011), resource input, economic growth, environmental impact (Zhang et al., 2020), aquaculture output, aquaculture structure (Ji and Wang, 2015), aquaculture species (Yang et al., 2021), and so on. These studies focus on developing marine aquaculture technology, and discusses its influence on marine aquaculture carbon sink output.
At present, the research on carbon sink market is still concentrated in the field of terrestrial biological carbon sink such as grassland and forest, and related research has discussed the influencing factors of supply and demand and the operation mechanism of carbon sink market (Pfaff et al., 2000; Liu and Gao, 2012; Lu and Zhang, 2014), while the market-based mechanisms for marine aquaculture carbon sink has not been given much attention. Xu et al. (2017) investigated the owners of aquaculture in Shandong coastal areas, and found that the enthusiasm of farmers to participate in carbon sink of marine aquaculture was not high, mainly because the ecological compensation system of carbon sink fishery was not perfect. Xiang et al. (2017) investigated the development status of carbon sink of marine aquaculture in Weihai City, Shandong Province, and found that marine aquaculture unilaterally pursued economic benefits, leading to exceeding the self-purification capacity of water areas, which seriously limits the sustainable development of carbon sink fishery.
Marine aquaculture has high output, large scale, wide variety, low nutritional level and high ecological efficiency in China (Zhang et al., 2021), and the marine aquaculture carbon sink is an important part of “carbon basket”. However, because the differences of carbon conversion efficiency between marine biological resources, the relationship between marine aquaculture productivity and net carbon sink capacity is not a simple linear relationship. At present, the theoretical research on carbon sink fishery has lagged behind the actual development of marine aquaculture industry. The existing research mainly focuses on the economic value of marine aquaculture, with little consideration on the ecological value of carbon sink fishery under the constraints of resources and ecology. In particular, there is a lack of systematic research based on the interaction of complex factors such as the aquaculture scale, aquaculture structure, aquaculture mode, aquaculture efficiency, shellfish and algae competitiveness, etc., and there is little comprehensive analysis on the mechanism of net carbon sink and the solution of net carbon sink system based on this. This paper adopts the two-stage LMDI (Logarithmic Mean Divisia Index) method to comprehensively analyze the Spatio-temporal characteristics, evolutionary laws and influence mechanisms of marine aquaculture carbon sink capacity of China from five major factors: aquaculture structure, aquaculture efficiency, aquaculture scale, competitiveness of shellfish and algae and aquaculture mode, and propose carbon sink policies on this basis, which is of great significance to expand the space of marine carbon sink.
3 Data source and descriptions
3.1 Estimation method of net carbon sink capacity of marine aquaculture
The net carbon sink of marine aquaculture can be divided into carbon sequestration (removal), direct carbon emission and indirect carbon emission. Among them, the amount of carbon removal mainly depends on the harvest of shellfish and algae. The direct carbon emission mainly comes from the diesel consumption of aquaculture fishing vessels, and the indirect carbon emission mainly comes from the power consumption of marine aquaculture. The calculation formula of net carbon sink of marine aquaculture can be expressed as Eq. 1:
Among them,
According to “the 2006 IPCC Guidelines for National Greenhouse Gas Inventories” and “the Reference Standard for the Measurement of Fuel Consumption for Domestic Motor Fishing Vessel Oil Price Subsidy”, the carbon emission factor of diesel consumption is 0.5921 kg/kg standard coal, and the carbon emission factor of power consumption is 0.6800 kg/kg standard coal. According to the energy consumption calculation of facilities and systems such as aquaculture oxygenation and water pump power consumption by Xu et al. (2007), the energy consumption conversion coefficient of pond aquaculture is 0.1495 and the industrialized aquaculture is 3.4977.
Other data in this paper are mainly from China fishery statistical yearbook and China fishery Yearbook, Select nine coastal provinces from 2010 to 2019 (because the output of shellfish and algae of marine aquaculture in Shanghai and Tianjin is very small, the statistical data in China’s fishery Statistical Yearbook is 0, so it is excluded from this study; at the same time, due to the availability and effectiveness of data, this paper does not include the three coastal areas of Taiwan, Hong Kong and Macao).
3.2 Description of the development of marine aquaculture
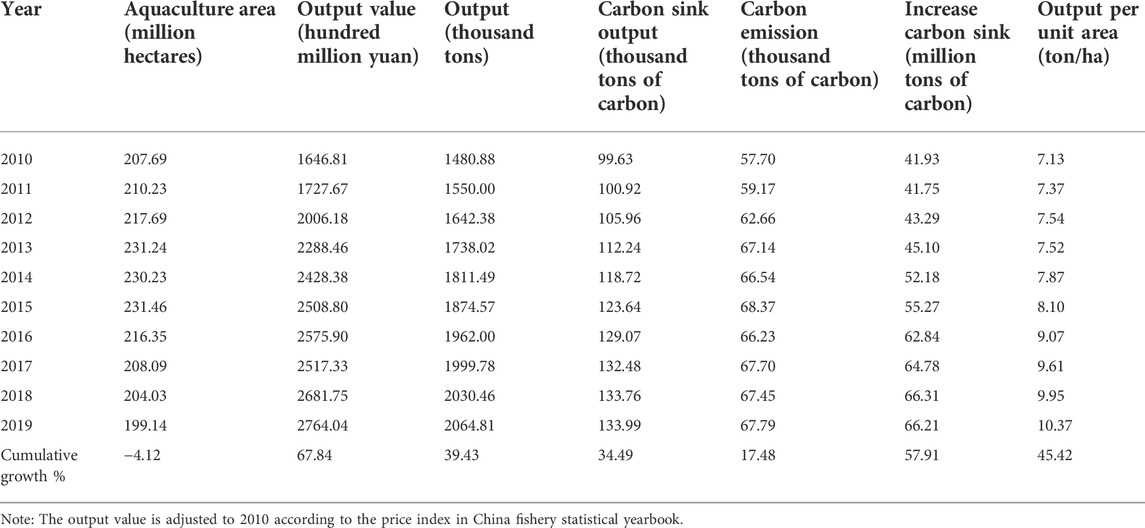
According to the relevant data of China Fishery Statistical Yearbook, combined with the carbon sink measurement method of marine aquaculture shellfish and algae, the basic development of marine aquaculture in China from 2010 to 2019 is shown in Table 2.
It can be seen from Table 2 that from 2010 to 2019, after the accelerated increase of aquaculture area in China, with the implementation of the new environmental protection law in 2015 and the in-depth development of the special rectification work of aquaculture environment, a large number of illegal mariculture seas were cleaned up and rectified, and the aquaculture area dropped sharply in 2016, with a slight downward trend in the follow-up. Besides, benefiting from the continuous increase in output capacity per unit area (cumulative increase of 45.42%), marine aquaculture output (cumulative increase of 39.43%), output value (cumulative increase of 67.84%), carbon sink output (cumulative increase of 34.49%) have been greatly improved, but the output value increase is higher than that of carbon sink, and the increase in carbon emission is far behind that of carbon sink, which indicates the development trend of high efficiency and low carbonization of mariculture in China.
Further analyze the evolution trend of marine aquaculture output value, carbon sink and increasing carbon sink in coastal areas, as shown in Figure 1. Among them, the definition of marine economic region refers to the 14th Five-Year Plan for National Economic and Social Development of the People’s Republic of China and the Outline of Long-term Objectives for 2035, which is divided into three regions: the northern ocean economic zone (Liaoning, Shandong and Hebei), the eastern ocean economic zone (Jiangsu and Zhejiang) and the southern ocean economic zone (Fujian, Guangdong, Guangxi and Hainan).
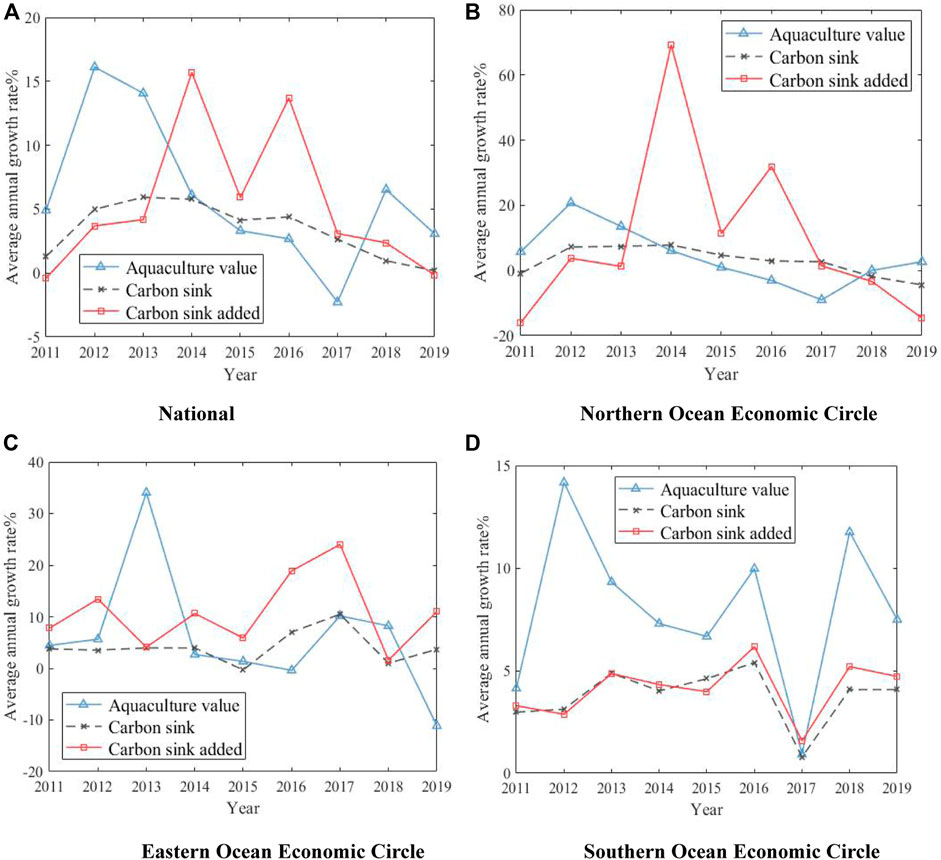
FIGURE 1. The growth trend of marine aquaculture in sub-regions from 2010 to 2019. (A) National (B) Northern Ocean Economic Circle. (C) Eastern Ocean Economic Circle (D) Southern Ocean Economic Circle.
According to Figure 1, the output value of marine aquaculture shows a dynamic wave trend nationwide, with positive growth in all other years except 2017; The net carbon sink growth of marine aquaculture across the country is in an inverted “U" shape, and the space for carbon sink is narrowing day by day, and the carbon sink even showed a negative growth in 2019. From the perspective of the three marine economic zone, the growth rate of output value and carbon sink in the eastern and southern ocean economic zone is greater than that in the northern ocean economic zone, and the growth rate of output value in the southern ocean economic zone is much greater than that in carbon sink.
3.3 Spatio-temporal characteristics of marine aquaculture
Further analyze the specific development of marine aquaculture in nine coastal provinces of China from 2010 to 2019, and the comparison of temporal and spatial distribution of main indicators is shown in Figure 2.
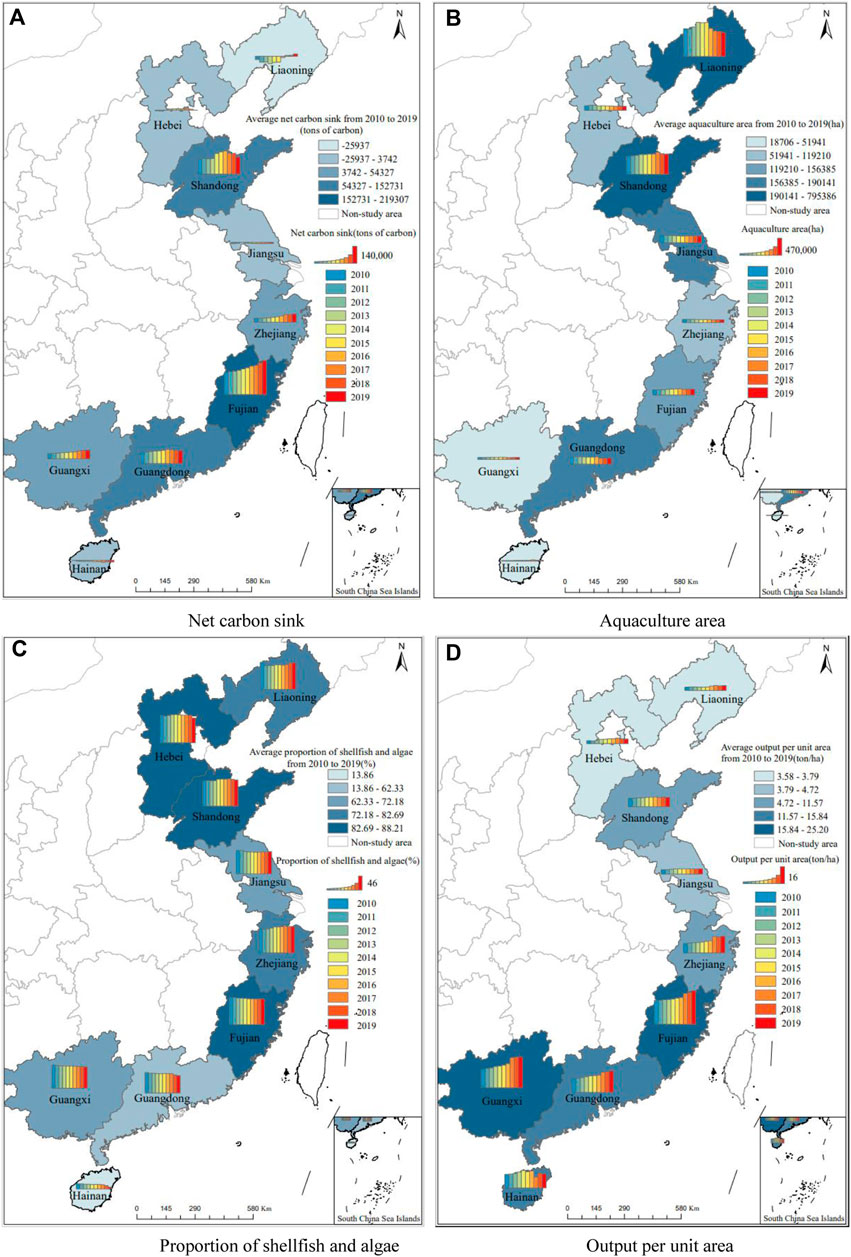
FIGURE 2. Spatio-temporal distribution map of marine aquaculture in China. Note: This map is drawn according to the standard map of the National Surveying and Mapping Geographic Information Bureau (No. GS(2019)1825), and the base map has not been modified. (A) Net carbon sink (B) Aquaculture area. (C) Proportion of shellfish and algae (D) Output per unit area.
In Figure 2, the color depth of the color block and the height of the columnar color scale can reflect the relative number of relevant indicators in each province, while the columnar color scale shows the evolution trend of relevant indicators in each province from 2010 to 2019. It can be seen from Figure 2A that the distribution of carbon sink of marine aquaculture in China is roughly in the trend of “high at both ends and low in the middle”. Shandong in the north and Fujian and Guangdong in the south are the major carbon sequestration provinces, accounting for more than 80% of the country’s carbon sequestration. Shandong in the north and Fujian and Guangdong in the south are the large provinces with carbon sink, and the carbon sink accounts for more than 80% of the country. The aquaculture area shows a pattern of “high in the north and low in the south” (see Figure 2B), which is just opposite to the trend of “high in the south and low in the north” in terms of per unit area (see Figure 2D). The proportion of shellfish and algae (see Figure 2C) has little difference in other provinces except Hainan and Guangdong.
It can be seen from the spatial and temporal evolution trend reflected by the columnar color scale that the heterogeneity among provinces and regions is obvious, and it reflects a certain degree of spatial correlation. For example, in terms of increase carbon sink, the three provinces of the northern ocean economic zone have shown a certain degree of inverted “U" shape, while the neighboring provinces of Zhejiang and Fujian have a more obvious trend of net carbon sink growth, and at the same time, the four provinces of Zhejiang, Fujian, Guangdong and Guangxi in the same southern ocean economic zone have a higher output per unit area, and all maintain a continuous upward trend.
4 Analysis of influencing factors on the carbon sink capability of marine aquaculture
4.1 Two-stage factor decomposition method
In order to further analyze the influencing factors and mechanism of marine aquaculture, referring to the carbon emission calculation formula proposed by Kaya (1989), this paper analyzes the carbon sink output of marine aquaculture into the basic formula of marine aquaculture structure, aquaculture mode, aquaculture efficiency and aquaculture scale, as shown in Eq. 2:
Where,
Where,
Where,
Thus, the carbon sink output of marine aquaculture can be further expressed as Eq. 5:
Eq. 5 indicates that the change of carbon sink output in marine aquaculture comes from the change of
In Formula 6,
Since Eq. 5 can only separate the factors of aquaculture structure or model, referring to the practice of Xu et al. (2021), this paper divides Eq. 5 into two-stage decomposition models:
In the first stage, decompose the aquaculture structure factors:
From the decomposition of the first stage, the decomposition results of the three factors of aquaculture structure, aquaculture efficiency and aquaculture scale are as Eq. 8:
Among them,
In the second stage, decompose the aquaculture mode factors as Eq. 9:
In the second stage of decomposition, the decomposition results of shellfish and algae competitiveness and aquaculture mode factors are as Eq. 10:
And among them,
In order to further compare the contribution rate of each factor to the change of carbon sink, referring to the method proposed by Sun et al. (2020), the transformation formula between the decomposition result of each factor and its contribution rate of increasing carbon sink is defined as Eq. 11:
In Eq. 11,
4.2 Factor analysis
4.2.1 Factor decomposition analysis based on time dimension
Based on the decomposition results of LMDI two-stage model, this paper mainly analyzes the factors that affect the carbon sink capacity of marine aquaculture in China from five aspects: aquaculture structure, aquaculture efficiency, aquaculture scale, competitiveness of shellfish and algae and aquaculture mode. The decomposition results of the five major influencing factors of marine aquaculture based on the time dimension (the previous year is the base period) are shown in Table 3.
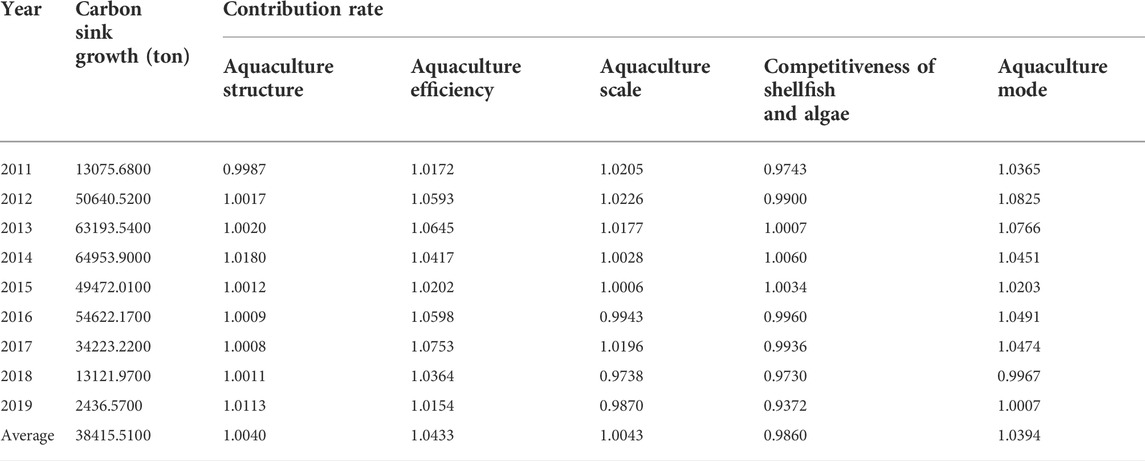
TABLE 3. Results of two-stage factor decomposition of marine aquaculture capacity from 2011 to 2019 (by year).
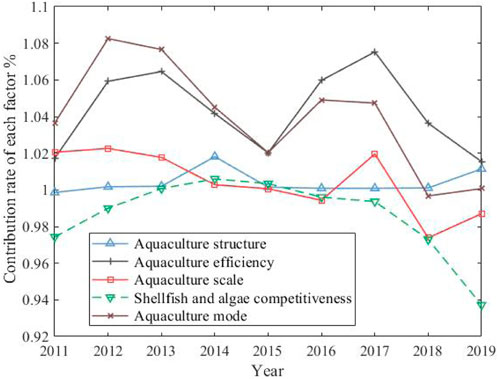
From the overall effect of each factor in Table 3, the contribution rate of aquaculture efficiency and mode to the growth of carbon sink is the largest, followed by aquaculture structure and scale, while the competitiveness of shellfish and algae can inhibit the growth of carbon sink, which indicates that the market value of shellfish and algae aquaculture lags behind that of other cultured species such as fish and crustaceans, and it is urgent to correct the value distortion of carbon sink industry by improving the market mechanism of carbon sink. The annual change trend of contribution rate of various factors to the carbon sink growth is shown in Figure 3.
From Figure 3, it can be seen that the contribution rate of increasing carbon sink of aquaculture efficiency and aquaculture mode is the largest, and both of them show the consistency of development trend, showing a double inverted “U" trend. However, the contribution rate of aquaculture mode is greater than that of aquaculture efficiency before 2015, and the aquaculture efficiency is greater than that of aquaculture mode after 2015. In recent years (after 2017), both of them show a downward trend, and the space for increasing carbon sink is narrowed. The contribution of aquaculture structure and scale factors to increase carbon sink is relatively stable, while the competitiveness of shellfish and algae shows an inverted “U" development trend, especially in recent years.
① Contribution rate analysis of aquaculture structure factors
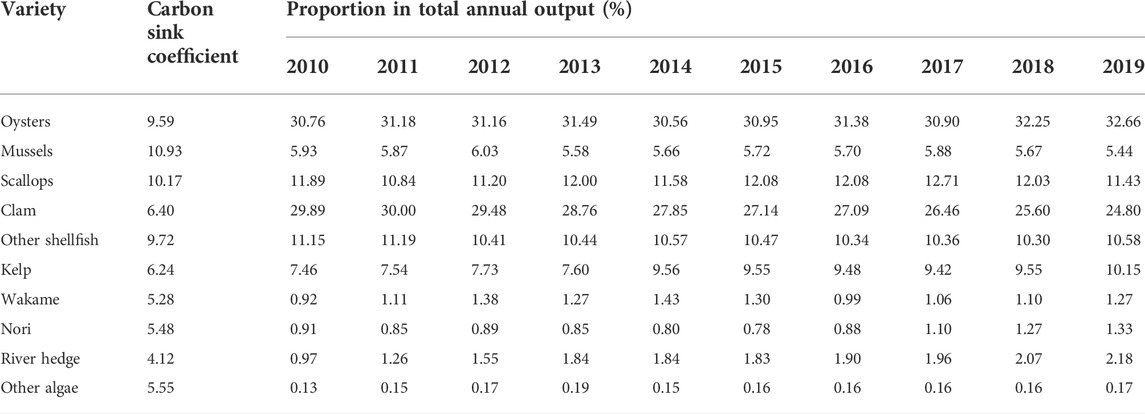
Figure 3 shows that the contribution of the increase of carbon sink of aquaculture structure has little fluctuation range, and it shows a slight upward trend in recent years. Among them, the carbon sink of shellfish decreased from 92.74 to 89.59%, while that of algae increased from 7.26 to 10.41%. The specific changes of shellfish and algae aquaculture structure from 2010 to 2019 are shown in Table 4.
In Table 4, the proportion of oysters with high carbon sink coefficient (carbon sink coefficient 9.59) in aquaculture increased from 30.76% in 2010 to 32.66% in 2019, with a cumulative increase of 6.18%. The clams with the lowest carbon sink coefficient (carbon sink coefficient 6.40) decreased from 29.89% in 2010 to 24.80% in 2019, with a cumulative decrease of 17.02%. Meanwhile, kelp with high carbon sink coefficient (carbon sink coefficient 6.24) in algae increased from 7.46% in 2010 to 10.15% in 2019, with a cumulative increase of 36.05%. It can be seen that during 2010–2019, the carbon sink capacity of shellfish and algae aquaculture structure has been continuously improved, and the change of aquaculture structure is closely related to the economic value of cultured species.
② Contribution rate analysis of aquaculture efficiency factors
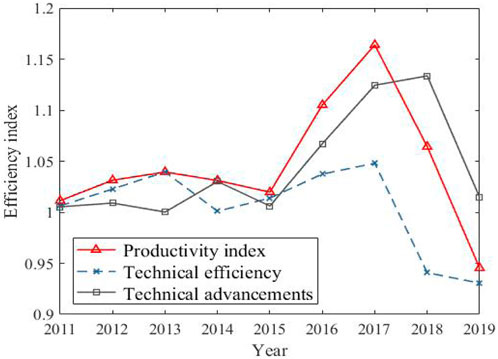
In Figure 3, the aquaculture efficiency surpassed the aquaculture model after 2015, and became the biggest factor contributing to the increase of carbon sink. However, it showed a downward trend after 2017, and the contribution space for increasing carbon sink became narrower and narrower. Taking aquaculture area as input variable and total output as the expected output, the SBM-DEA model is used to measure the aquaculture efficiency, and on this basis, the efficiency decomposition method of the Malmquist-Luenberger productivity index is used to decompose the changes in aquaculture efficiency into two aspects: technical efficiency and technological progress, and the development level of the efficiency index of each factor of aquaculture efficiency in time dimension is shown in Figure 4.
It can be seen from Figure 4 that the overall level of aquaculture efficiency is relatively stable before 2015 and rising rapidly after 2015, and technological progress is the main reason for promoting the overall improvement of aquaculture efficiency; Combined with Figure 3, the contribution rate of aquaculture mode is rising synchronously and rapidly. It is reasonable to speculate that the improvement of aquaculture efficiency comes from the technological innovation of aquaculture mode, and the overall sharp decline in aquaculture efficiency after 2017 is more affected by the lag of technical efficiency.
③ Contribution rate analysis of aquaculture mode factors
The fluctuation of the increased carbon sink contribution of the aquaculture mode in Figure 3 shows a double inverted “U" shape, and the contribution rate has been declining in recent years. the specific distribution of the aquaculture mode from 2010 to 2019 is shown in Table 5.
It can be seen from Table 5 that during 2010–2019, the aquaculture mode was continuously optimized, with the largest increase of 1.61% in deep-water cage culture, followed by factory culture with an increase of 0.73%. However, the existing models are still dominated by shallow water culture models such as pond, raft and bottom sowing culture, while the existing varieties of cage culture are mainly high economic value fish such as Pseudosciaena crocea and grouper, and there is still a large space for optimization of carbon sink aquaculture mode, so it is urgent to promote the development of three-dimensional aquaculture, and expand the space of mariculture through model innovation such as marine pasture construction and deep-sea aquaculture.
4.2.2 Factor decomposition analysis based on spatial
From the perspective of spatial dimension, the decomposition results of the five major carbon sink influencing factors of marine aquaculture in nine coastal provinces (the previous year is the base period) are shown in Table 6.
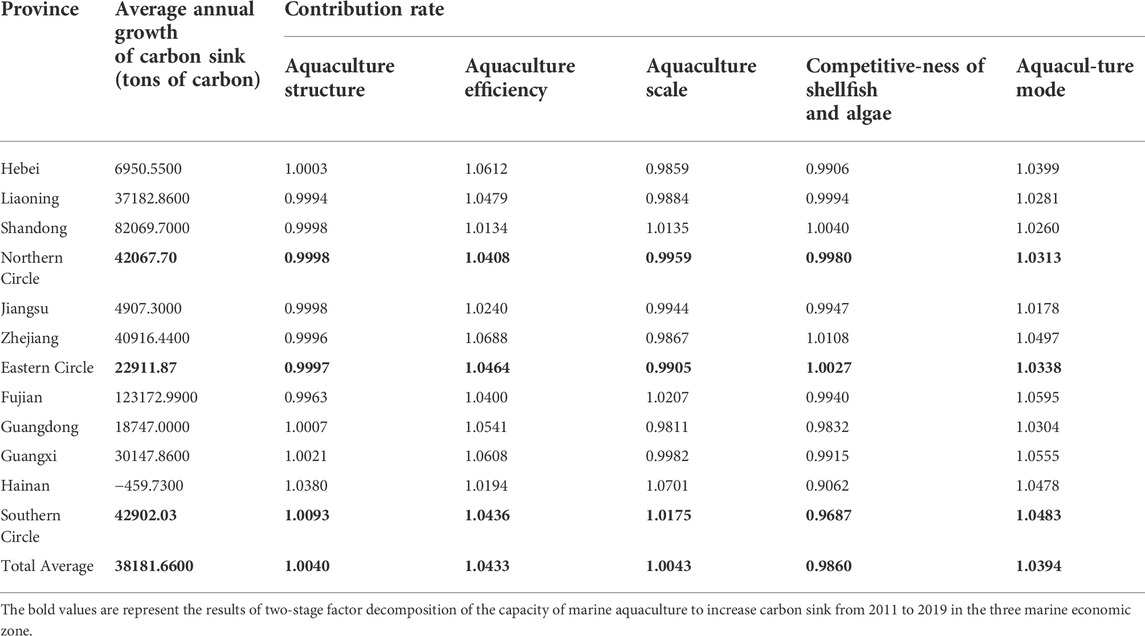
TABLE 6. Results of two-stage factor decomposition of the capacity of marine aquaculture to increase carbon sink from 2011 to 2019 (by region).
From the influence effects of various factors in each province in Table 6, the aquaculture efficiency and aquaculture mode can promote the growth of carbon sink in each province, while the contribution of other factors to the growth of carbon sink is quite different. In terms of aquaculture structure, Hebei, Guangdong, Guangxi and Hainan have a positive promoting effect, while other province have a weak inhibitory effect; In terms of aquaculture scale, Shandong, Fujian and Hainan have a larger contribution to net carbon sink, while Hebei, Liaoning, Zhejiang and Guangdong have a great inhibitory effect; In terms of the competitiveness of shellfish and algae, except Zhejiang and Shandong, the competitiveness of shellfish and algae in other province can inhibit the increase of carbon sink, and that of is the strongest in Hainan. The contribution rate level of each factor in the three marine economic zone (contribution rate-1) is shown in Figure 5.
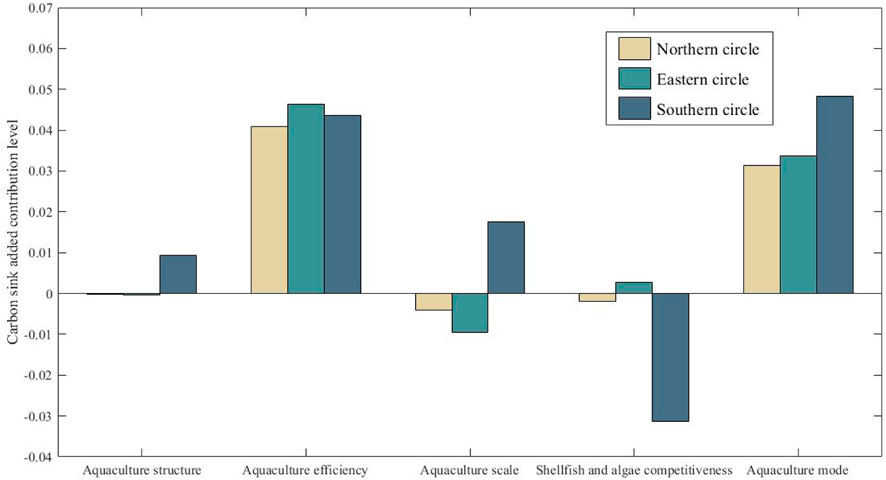
FIGURE 5. Level of contribution of different factors increases carbon sink in the three marine economic zone.
From Figure 5, it can be seen that only the aquaculture efficiency and the aquaculture mode in the northern ocean economic zone have a positive effect on the increase of carbon sink, while the competitiveness of shellfish in the eastern ocean economic zone has a weak positive contribution besides the above two factors, but only the competitiveness of shellfish in the southern ocean economic zone has a negative effect on the increase of carbon sink. The difference of contribution rates of various factors in different regions reflects the heterogeneity and resource dependence of carbon sink fishery development. Therefore, the strategy of increasing carbon sink of marine aquaculture should be determined according to the regional endowment characteristics.
The differentiated development of aquaculture efficiency in the spatial dimension also reflects the regional differences (as shown in Figure 6).
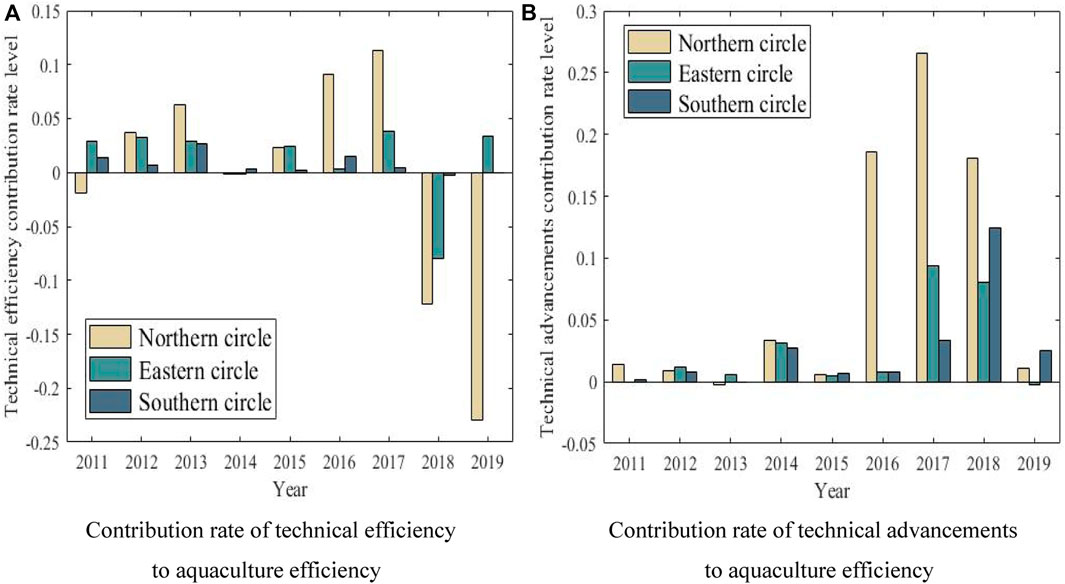
FIGURE 6. Spatial difference of aquaculture efficiency. (A) Contribution rate of technical efficiency to aquaculture efficiency (B) Contribution rate of technical advancements to aquaculture efficiency.
As can be seen from Figure 6, although the contribution level of technological progress to aquaculture efficiency is much greater than that of technological efficiency itself, the change range of technological efficiency and technological progress is shown as: northern ocean economic zone > southern ocean economic zone > eastern ocean economic zone. Especially from 2016 to 2018, the technological progress level of northern ocean economic zone is far ahead of that of other regions; However, in recent years, the development of technical efficiency in the northern ocean economic zone has lagged behind, which has dragged down the improvement of the overall aquaculture efficiency; While, the technical efficiency in the southern ocean economic zone has developed steadily, and the technical progress has been obvious in recent years, and the overall performance of aquaculture efficiency is better.
5 Conclusions and suggestions
Aiming at the shortcomings of the existing research in the field of marine aquaculture carbon sink, this study comprehensively reveals the Spatio-temporal characteristics, evolution law and influence mechanism of marine aquaculture carbon sink from the five factors of aquaculture structure, aquaculture efficiency, aquaculture scale, competitiveness of shellfish and algae and aquaculture mode, so as to provide policy reference for promoting the high-quality development of marine aquaculture carbon sink. The study found that the total carbon sink of marine aquaculture in China is “high at both ends and low in the middle” in the three marine economic zone, the aquaculture scale is “high in the north and low in the south”, and the aquaculture efficiency is “high in the south and low in the north”. Among the five factors that affect the mechanism of net carbon sink, although there is a great heterogeneity among regions, aquaculture efficiency and aquaculture mode have always played the most importantly positive role in promoting, and the contributing of technological progress to the innovation of aquaculture mode and the improvement of aquaculture efficiency has become increasingly prominent. The weak competitiveness of shellfish and algae has seriously hindered the growth of carbon sink in marine aquaculture, which is the main reason for the increasingly tight space for carbon sink; In addition, in the process of technological innovation promoting the development of marine aquaculture industry, we should constantly improve the management level, improve the production organization system and improve technical efficiency, so as to ensure the high-quality development of marine aquaculture industry. Therefore, this study puts forward the following policy suggestions:
Firstly, actively promote the marketization process of marine aquaculture carbon sink and correct the value distortion in the development of carbon sink as soon as possible. According to the annual analysis of the influencing factors of carbon sink, it is found that the market competitiveness of carbon sink marine aquaculture has shown a trend of accelerating decline. It is urgent to make economic compensation for the ecological spillover effect of carbon sink industry, so as to encourage the marine aquaculture industry to tilt to the types of carbon sink. Therefore, we should establish a carbon sink marine aquaculture measurement and monitoring system as soon as possible, explore the establishment of a carbon sink aquaculture demonstration base and a carbon sink trading market mechanism, encourage the development of aquaculture projects to increase carbon sink and promote the healthy development of the blue carbon industry.
Secondly, with the breakthrough of key technologies such as modern three-dimensional culture and deep-sea culture, the vast sea area has great spatial potential. However, the research results show that the contribution rate of aquaculture scale factors to carbon sink is at a low level, while there are still a large number of shallow beaches suitable for aquaculture in China. Taking Hebei as an example, the current utilization rate is less than 10% (Li et al., 2013). Therefore, we should build a modern marine aquaculture economic system as soon as possible, promote the aquaculture industry chain and value chain to move towards high-end, and release more huge blue carbon space while improving the economic value of carbon sink.
Finally, we should innovate the carbon sink aquaculture mode according to local conditions, build a modern three-dimensional cultivation system and further improve the aquaculture efficiency. The steady growth of marine aquaculture carbon sink in China benefits from the optimization and improvement of aquaculture efficiency and aquaculture mode. Due to the large heterogeneity and resource dependence of carbon sink mechanism between different regions, all regions should vigorously carry out technological innovation, develop marine pastures, form the advantages of characteristic aquaculture scale, and reasonably layout the aquaculture density and structure according to their own advantages and resource characteristics, so as to lay a foundation for high-quality, high-yield, efficient and ecological aquaculture of carbon sink. At the same time, all regions should coordinate the provincial location factors, and reasonably formulate the development policies of marine aquaculture carbon sink with differentiation and coordination, so as to promote the coordinated development of marine aquaculture.
Although the carbon sequestration capacity of shellfish is closely related to specific species and on-site environment, it is the most commonly used and easiest method to estimate the carbon sink of aquaculture by weighing and carbon sink coefficient (Zhang et al., 2005). This paper only discusses the possible space for increasing carbon sink from the perspective of optimizing the structure, efficiency, mode and scale of aquaculture. Although the specific carbon sink measurement method and estimation accuracy will affect the results presented, the research conclusions still have great reference value to optimize the aquaculture conditions. With the increasingly mature measurement methods in this field, more accurate measurement methods will be adopted in terms of specific aquaculture conditions in the future.
Data availability statement
The original contributions presented in the study are included in the article/Supplementary Material, further inquiries can be directed to the corresponding author.
Author contributions
Conceptualization and methodology, HG; original draft preparation, ZS; data curation and display design, AZ. All authors have read and agreed to the published version of the manuscript.
Conflict of interest
The authors declare that the research was conducted in the absence of any commercial or financial relationships that could be construed as a potential conflict of interest.
Publisher’s note
All claims expressed in this article are solely those of the authors and do not necessarily represent those of their affiliated organizations, or those of the publisher, the editors and the reviewers. Any product that may be evaluated in this article, or claim that may be made by its manufacturer, is not guaranteed or endorsed by the publisher.
References
Alpert, S. B., Spencer, D. F., and Hidy, G. (1992). Biospheric options for mitigating atmospheric carbon dioxide levels. Energy Convers. Manag. 33 (5–8), 729–736. doi:10.1016/0196-8904(92)90078-b
Alvera-Azcárate, A., Ferreira, J. G., and Nunes, J. P. (2003). Modelling eutrophication in mesotidal and macrotidal estuaries. The role of intertidal seaweeds. Estuar. Coast. Shelf Sci. 57 (4), 715–724. doi:10.1016/S0272-7714(02)00413-4
Ang, B., Zhang, F., and Choi, K. (1998). Factorizing changes in energy and environmental indicators through decomposition. Energy 23 (6), 489–495. doi:10.1016/s0360-5442(98)00016-4
Erlania, E., and Radiarta, N. (2015). The use of seaweeds aquaculture for carbon sequestration: a strategy for climate change mitigation. J. Geodesy Geomatics Eng. 2 (2), 109–115. doi:10.17265/2332-8223/2015.06.006
Filber-Dexter, K., and Wernberg, T. (2020). Substantial blue carbon in overlooked Australian kelp forests. Sci. Rep. 10 (1), 12341. doi:10.1038/s41598-020-69258-7
Ji, J. Y., and Wang, P. P. (2015). Measurement of carbon sequestration capacity of mariculture in China and decomposition of influencing factors. Mar. Environ. Sci. 34 (06), 871–878. doi:10.13634/j.cnki.mes.2015.06.012
Ji, J. Y., and Wang, P. P. (2016). Study on carbon sink decomposition of mariculture shellfish--Based on modified Laspeyres index decomposition method. China Fish. Econ. 34 (05), 79–84. doi:10.3969/j.issn.1009-590X.2016.05.011
Jiao, N. Z., Herndl, G. J., Hansell, D. A., Benner, R., Kattner, G., Wilhelm, S. W., et al. (2010). Microbial production of recalcitrant dissolved organic matter: long-term carbon storage in the global ocean. Nat. Rev. Microbiol. 8 (8), 593–599. doi:10.1038/nrmicro2386
Jiao, N. Z. (2021). Developing ocean negative carbon emission technology to support national carbon neutralization. Bull. Chin. Acad. Sci. 36 (2), 123–131. doi:10.16418/j.issn.1000-3045.20210123001
Jiao, Wang H., Xu, G., and Arico, S. (2018). Blue carbon on the rise: challenges and opportunities. Natl. Sci. Rev. 5 (4), 464–468. doi:10.1093/nsr/nwy030
Kaya, Y. (1989). Impact of carbon dioxide emission control on GNP growth: interpretation of proposed scenarios. Intergovernmental panel on climate change/response strategies working group. Available at: https://cir.nii.ac.jp/crid/1570291225678384256 (Accessed April 18, 2022).
Krause-Jensen, D., and Duarte, C. (2016). Substantial role of macroalgae in marine carbon sequestration. Nat. Geosci. 9, 737–742. doi:10.1038/ngeo2790
Li, A., Liu, C. Q., Dong, M. H., and Li, B. (2013). Assessment of carbon sink capacity of mariculture shellfish and algae in Hebei Province. J. South. Agric. 44 (07), 1201–1204. doi:10.3969/j:issn.2095-1191.2013.7.1201
Liu, H., and Gao, L. (2012). Comparative analysis and Enlightenment of forest carbon sequestration market development at home and abroad. Ecol. Econ. (11), 57–60. doi:10.3969/j.issn.1671-4407.2012.11.012
Lu, J., and Zhang, G. W. (2014). Discussion on the operation mechanism of China's forestry carbon sequestration market. China For. Econ. (03), 28–30. doi:10.13691/j.cnki.cn23-1539/f.2014.03.002
Mitra, A., Zaman, S., Pramanick, P., Bhattacharyya, S. B., and Raha, A. K. (2014). Stored carbon in dominant seaweeds of Indian sundarbans. Pertanika J. Trop. Agric. Sci. 37 (2), 263–275. http://agris.upm.edu.my:8080/dspace/handle/0/9849
Muraoka, D. (2004). Seaweed resources as a source of carbon fixation. Bull. Fish. Res. Agency 1, 59–63. http://s.dic.cool/S/BWnXb1Qm
Orr, J. C., and Sarmiento, J. L. (1992). Potential of marine macroalgae as a sink for CO2: constraints from a 3-D general circulation model of the global ocean. Water Air Soil Pollut. 64 (1), 405–421. doi:10.1007/bf00477113
Pershing, A. J., Christensen, L. B., Record, N. R., Sherwood, G. D., and Stetson, P. B. (2010). The impact of whaling on the ocean carbon cycle: why bigger was better. PLoS ONE 5 (8), e12444. doi:10.1371/journal.pone.0012444
Pfaff, A. S. P., Kerr, S., Hughes, R. F., Liu, S., Sanchez–Azofeifa, G., Schimel, D., et al. (2000). The Kyoto protocol and payments for tropical forest:An interdisciplinary method for estimating carbon-offset supply and increasing the feasibility of a carbon market under the CDM, Ecological Economics. Ecol. Econ. 35 (2), 203–221. doi:10.1016/s0921-8009(00)00199-3
Qi, Z. H., Wang, J., Huang, H. H., Liu, Y., Li, C. H., Chen, S. J., et al. (2012). Assessment of carbon sink potential of mariculture shellfish and algae in Guangdong Province. South. Fish. Sci. 8 (01), 30–35. doi:10.3969/j.issn.2095-0780.2012.01.005
Quan, W., Ying, M. M., Kang, H. J., Xu, C. L., Zhou, Q. S., Liang, W. J., et al. (2014). Estimation of seaweed culture and carbon sink intensity in offshore China. J. Fish. 38 (04), 509–514. doi:10.3724/SP.J.1231.2014.49040
Shao, G. L., Kong, H. Z., and Li, C. (2019a). Net carbon sink of mariculture in China and its coupling relationship with economy. Resour. Sci. 41 (02), 277–288. doi:10.18402/resci.2019.02.07
Shao, G. L., Liu, B., and Li, C. (2019b). Assessment of carbon sink capacity of mariculture in China's main sea areas and its impact effect--Based on the panel data of 9 coastal provinces in China. J. Ecol. 39 (07), 2614–2625. doi:10.5846/stxb201801080049
Shen, J. S., and Liang, R. F. (2018). Study on pricing of blue carbon sequestration in marine pasture. Resour. Sci. 40 (09), 1812–1821. doi:10.18402/resci.2018.09.11
Smith, S. V. (1981). Marine macrophytes as a global carbon sink. Science 211 (4484), 838–840. doi:10.1126/science.211.4484.838
Sun, J. T., and Zhao, Y. J. (2011). Study on the development model of carbon sink fishery in China. Dongyue Trib. 32 (08), 150–155. doi:10.15981/j.cnki.dongyueluncong.2011.08.004
Sun, K., Cui, Q. Q., Su, Z. X., and Wang, Y. N. (2020). Spatio-temporal evolution of economic value of carbon sink in mariculture in China and analysis of influencing factors. Geogr. Res. 39 (11), 2508–2520. doi:10.11821/dlyj020190731
Tang, Q. S., and Liu, H. (2016). Marine fishery carbon sink and its expansion strategy. China Eng. Sci. 18 (03), 68–73. doi:10.3969/j.issn.1009-1742.2016.03.012
Tang, Q. S., Zhang, J. H., and Fang, J. G. (2011). Shellfish and seaweed mariculture increase atmospheric CO2 absorption by coastal ecosystems. Mar. Ecol. Prog. Ser. 424, 97–104. doi:10.3354/meps08979
Tang, Q. S. (2011). Carbon sink fishery and sound and rapid development of modern fishery. Jiangxi Fish. Sci. Technol. (02), 5–7. doi:10.3969/j.issn.1006-3188.2011.02.002
Xiang, C. H., Dong, J. J., Hou, S. Y., Dong, H. W., and Liu, Z. H. (2017). Current situation and Development Countermeasures of carbon sink fishery in Weihai. China Fish. (06), 42–44. CNKI:SUN:SICA.0.2017-06-026
Xu, G. Q., Cai, Z., and Feng, S. W. (2021). Study on temporal and spatial differences and influencing factors of carbon emissions based on two-stage LMDI model -- a case study of Jiangsu Province. Soft Sci. 35 (10), 107–113. doi:10.13956/j.ss.1001-8409.2021.10.17
Xu, H., Liu, H., Zhang, J. H., Ni, Q., Shen, J., and Jiang, L. (2007). Estimation of fishery energy consumption in China. China Fish. (11), 74. doi:10.3969/j.issn.1002-6681.2007.11.048
Xu, J. J., Han, L. M., Luo, Y. R., and Wang, W. (2017). Willingness of marine aquaculture farmers to participate in carbon sink fishery output and its influencing factors. Mar. Econ. 7 (01), 18–29. doi:10.19426/j.cnki.cn12-1424/p.2017.01.003
Xu, J. J., Qin, T. T., and Han, L. M. (2018). Review of marine "carbon sink fishery" research. Resour. Sci. 40 (01), 161–172. doi:10.18402/resci.2018.01.15
Xu, J. J., Zhang, J., and She, C. H. (2020). Evaluation of spatial spillover effect of green development of marine carbon sink fishery. China Popul. Resour. Environ. 30 (02), 99–110. doi:10.12062/cpre.20191016
Yan, L. W., Huang, H. J., Chen, J. T., and Yang, X. G. (2011). Estimation of carbon sink intensity of offshore algae culture in China. Adv. Mar. Sci. 29 (04), 537–545. doi:10.3969/j.issn.1671-6647.2011.04.014
Yang, Y. F., Luo, H. T., Wang, Q., He, Z. L., and Long, A. M. (2021). Large-scale cultivation of seaweed is an effective way to increase ocean carbon sink and solve offshore environmental problems. J. Chin. Acad. Sci. 36 (03), 259–269. doi:10.16418/j.issn.1000-3045.20210217103
Yu, M. X., Tian, T., and Ma, Y. R. (2018). Analysis on the scale of carbon trading market required by carbon sink fishery--Calculation Based on marine fishery output data. Ocean Dev. Manag. 35 (07), 88–93. http://s.dic.cool/S/s4GLrYzg
Yu, Z. A., Xie, X., Zhu, S. W., Du, S. K., Li, X. D., Li, D. C., et al. (2020). Assessment of carbon sink capacity of mariculture shellfish and algae in Liaoning Province. J. Dalian Ocean Univ. 35 (03), 382–386. doi:10.16535/j.cnki.dlhyxb.2019-121
Yue, D. D., Wang, L. M., Geng, R., Wang, Q., and Dai, Y. Y. (2014). Preliminary study on ecological value evaluation of offshore algae culture in China. China Agric. Sci. Technol. guide 16 (03), 126–133. doi:10.13304/j.nykjdb.2013.507
Zhang, B., Sun, S., and Tang, Q. S. (2013). Carbon sink function of marine fishing industry. Prog. Fish. Sci. 34 (01), 70–74. doi:10.3969/j.issn.1000-7075.2013.01.011
Zhang, J. H., Fang, J. G., and Tang, Q. S. (2005). Contribution of shellfish culture to marine carbon cycle in shallow waters of China. Prog. Earth Sci. (03), 359–365. doi:10.3321/j.issn:1001-8166.2005.03.014
Zhang, J. H., Liu, J. H., Zhang, Y. Y., and Li, G. (2021). Ways to practice “negative marine emissions” in mariculture. J. Chin. Acad. Sci. 36 (03), 252–258. doi:10.16418/j.issn.1000-3045.20210217101
Zhang, X. X., Zheng, S., and Yu, L. H. (2020). Measurement of green efficiency of China’s marine carbon sink fishery and its spatial spillover effect. China’s Rural. Econ. (10), 91–110. http://s.dic.cool/S/w5ZTjWef
Keywords: carbon sink, marine aquaculture, LMDI, carbon neutrality, influencing factors
Citation: Guan H, Sun Z and Zhao A (2022) Spatio-temporal evolution and influencing factors of net carbon sink in marine aquaculture in China. Front. Environ. Sci. 10:978073. doi: 10.3389/fenvs.2022.978073
Received: 25 June 2022; Accepted: 21 July 2022;
Published: 15 August 2022.
Edited by:
Muhammad Mohiuddin, Laval University, CanadaReviewed by:
Xiaoran Shi, Hainan Tropical Ocean University, ChinaXuemei Li, Ocean University of China, China
Copyright © 2022 Guan, Sun and Zhao. This is an open-access article distributed under the terms of the Creative Commons Attribution License (CC BY). The use, distribution or reproduction in other forums is permitted, provided the original author(s) and the copyright owner(s) are credited and that the original publication in this journal is cited, in accordance with accepted academic practice. No use, distribution or reproduction is permitted which does not comply with these terms.
*Correspondence: Aiwu Zhao, YWl3dXpoQDEyNi5jb20=
 Hongjun Guan
 Zhenzhen Sun1
