 Xinke Du
 Tianzhi Ouyang2*
 Lingxiao Deng
 Rubab Gul
94% of researchers rate our articles as excellent or good
Learn more about the work of our research integrity team to safeguard the quality of each article we publish.
Find out more
ORIGINAL RESEARCH article
Front. Environ. Sci., 10 October 2022
Sec. Environmental Economics and Management
Volume 10 - 2022 | https://doi.org/10.3389/fenvs.2022.977733
This article is part of the Research TopicFinancial and Trade Globalization, Greener Technologies and Energy TransitionView all 46 articles
In the COVID-19 crisis, many economies suffered from sustainable energy production. The emergence of the COVID-19 crises, extreme volatility in oil prices, limited energy efficiency in energy systems, and weak form of financial stability were the key reasons for it. However, considering these issues, a recent study aims to analyze them. ASEAN countries’ energy efficiency and crude oil price volatility are examined as a solution to how financial conditions might be utilized to handle energy efficiency issues and crude oil price volatility. Extending it, the study aims to identify the influence of financial stability on crude oil price volatility and energy efficiency issues. To do this, GMM is used. According to the study’s findings, environmental mitigation was determined to be important at 18%, and financial stability and carbon risk significant at 21%. Global warming concerns have been raised due to the ASEAN nations’ 19.5% link between financial stability and emissions drift. A country’s financial stability is necessary for implementing green economic recovery strategies, among the most widely accepted measures to reduce energy efficiency and guarantee long-term financial potential on the national scale. The study on green economic growth also provides the associated stakeholders with sensible policy consequences on this importance.
It is necessary to adhere to new influencing elements, such as oil price volatility, energy efficiency, and financial stability, in light of the rising importance of sustainable energy production (Adeodoyin et al., 2021). Investors are increasingly taking a more systematic view of sustainable energy production, which incorporates a wide range of issues that negatively impact it (Henriques and Sadorsky, 2008). Variables such as these are trending up since they contribute to and influence renewable energy generation. As Oh et al. (2010) explained, businesses, governments, and society have lately paid too much attention to sustainable energy generation since it provides green commodities (Oyedepo, 2012). Market players care a great deal about oil price volatility, the stability of businesses, and energy efficiency in energy systems (Omer, 2008).
As a part of our research, we analyze if sustainable energy development impacts oil prices, financial stability, and energy efficiency. An analysis such as this might be necessary for policymakers to understand the influence of oil prices on energy systems and design suitable policies for boosting eco-friendly business. The motivations for power framework shareholders will diminish amid a slump in the energy market, leading to lower energy product pricing. When oil prices rise, however, incentives increase, causing the crude prices of ecologically friendly enterprises to rise. Several research studies have linked oil prices to an increase in green investments. For example, Baldi et al. (2014) showed that higher incentives for investing in green power companies encourage shareholders to shift away from rising energy prices. Oil price volatility (OVX), according to Sovacool (2013), also hurts clean energy equities, reflecting a similar trend.
Rather than using stock market returns, vulnerable to the endogeneity issues raised earlier, we look at the degree to which financial markets rely on fluctuating oil prices (Poudineh et al., 2018). Other metrics promote long-term financial stability, such as the “degree of centralization of government control,” where the flexibility expressed in a privately operated financial system is an instrument (or proxy) for financial depth. In this approach, we reduce the correlation between oil prices and financial depth, which limits the extent of short-term changes in financial measures owing to increases in oil prices (Tian et al., 2022). At the same time, addressing residual endogeneity concerns and ensuring that our findings from our first test, a quasi-natural experiment based on the synthetic control technique, stand up against endogeneity difficulties. According to our financial depth measurement, financial institutions may have mitigated the influence of oil price volatility on both growth and volatility of production among oil producers. This affects not just oil producers but also the world’s energy supply (Hassan et al., 2021).
Due to this, our research looks valuable in filling the current vacuum as it offers insight into the impact of innovation policies on renewable energy production and the shift away from fossil fuel-based energy sources (Bourghelle et al., 2021). Much theoretical work focused on the influence of energy policies on the implementation of renewable energy or the variables that led to its diffusion and progress (Yu et al., 2022). Nevertheless, research on the connection between energy policy and technological diffusion has received almost little attention. In particular, this contribution aims to examine how energy policy is dynamically adjusted to standardize renewable power deployment to meet policy objectives, such as obtaining a specific energy mix, limiting the effect of incentives on public finance, protecting local industry, and so on (Lee et al., 2021).
There are two key differences between this research and others of its kind. Concerning ASEAN economies, we first look at the correlation between crude oil price volatility and sustainable energy output. Even though the linkage among both energy and financial markets is susceptible to repeated changes throughout GMM, the existing studies on the relationship between energy efficiency, financial stability of ASEAN economies, and sustainable energy production mostly employ the GMM estimation technique. As a result, the GMM-based parameter assumption in the method of moments is too restrictive, and the applied model may be misspecified. Because it allows its probabilities to fluctuate between multiple states, the robustness analysis is useful in this context. For example, using this technique, we may investigate how the study variables respond to sustainable energy generation in the context of ASEAN economies with high and low volatility. This is followed by newly adopted energy development indices, which include enterprises that employ environmentally friendly industrial techniques and build environmentally friendly infrastructure. As a result, this research demonstrates its theoretical and empirical significance and its ability to have a practical impact on the stakeholders. Policymakers could potentially use our results in developing environmental asset management policies. Oil prices have a negligible impact on ethical investments. Thus, policymakers should focus on developing their guidelines for the industry. Detaching these assets may help policymakers make better hedging choices.
Experts and scientists are increasingly discussing the possibility of ecological change in the economy and society, but the ideal method for analyzing externalities and devising relevant procedures is still up for dispute. Increasing globalization processes, on the other hand, tends to worsen these financial difficulties. As a result of global warming, the links between financial activities and the normally related systems must be carefully investigated. Money-related businesses have taken advantage of this weakness by providing free cash in exchange for entertainment or support Figure 1. Private health care techniques, such as issuing horrible protections to express threats to capital company sectors, are examples of what is taking place here. The exaggeration of precariousness sources has boosted pre- and post-disaster financial strategies.
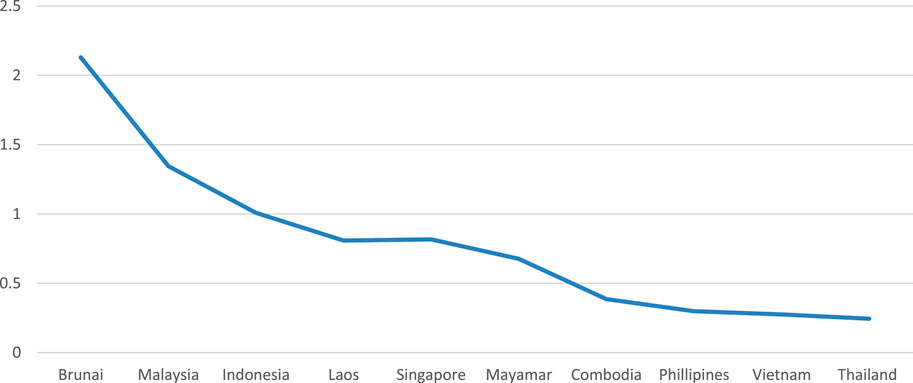
FIGURE 1. Crude oil price volatility trends in ASEAN countries during the sample period (2015–2020).
The financial sector has been required to work since the Conference of Parties (COP) in Paris in 2015. The Kyoto Protocol and the EU-ETS were studied regarding their influence on neonatal discharges and the broader economy. With no EU-ETS in place, industrialized nations could quickly boost their electricity production to adopt more environmentally friendly sources of power. According to the US Energy Information Administration (EIA), inexpensive power generation in the United States will increase by 12% in 2020 (2021). Half of the world’s controllable energy output was added in the same period. Regarding traditional energy markets, such as those in GCC countries, no previous investigation has examined how clean energy development and new trade strategies in the GCC countries interact. First and foremost, we owe it to our present colleagues. For the second time, past research has relied on data from a single country rather than on annual and regional information. New linkages between oil prices and the number of electricity users may threaten annual statistics. Long-term data, however, do not indicate much in the way of carelessness. As shown in Figure 2, we can see that energy sales have changed the ASEAN economy. This implicit relationship needs to be explored.
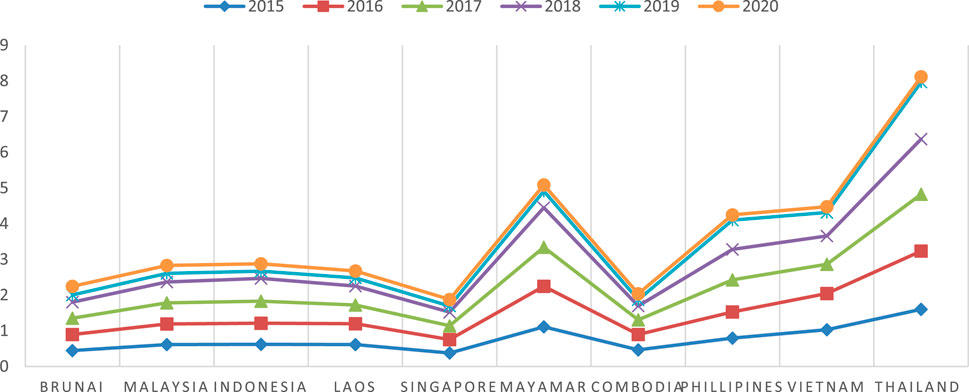
FIGURE 2. Energy production change concerns movements in ASEAN economies.
Environmental change has a significant impact on the stability of financial institutions, while the transition to a low-carbon economy and its planning and implementation provide great challenges for society as a whole (see Figure 3). Consider the mind-boggling and opportunity-creating features of capital company sites while reviewing their consistent conditions while evaluating natural and biological traits. This interconnectedness can only be effectively assessed with the development of new techniques and indicators to screen and analyze the possible spread of regular and energy production-related risks throughout financial institutions and a wider economy. These threats undermine the trustworthiness of financial institutions. While discussing the financial sector’s occupation, it proposes a method for managing input circles between the financial sector and the real economy and assessing how energy production methods started shock impacts calm or awful periods that arise in general economic activity.
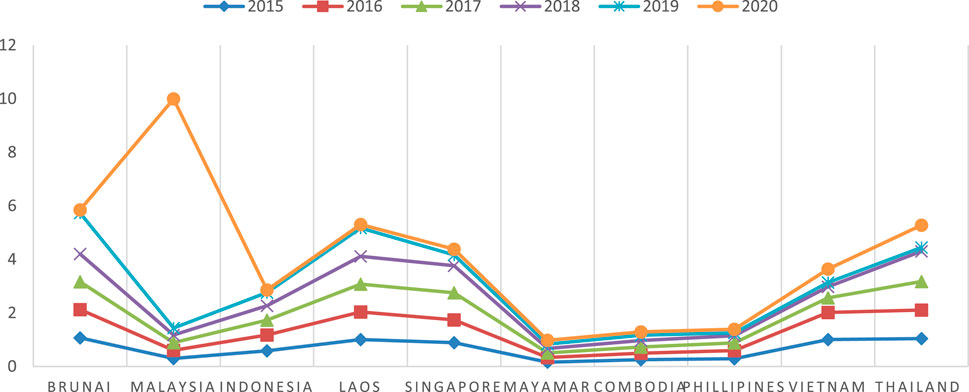
FIGURE 3. Financial stability of ASEAN economies.
Opponents of this organization should concentrate on the many linkages between financial structures and ideas in biological and energy production. Even if a product’s origin is unknown, its principal function likely is to feed and contribute to the creative process. As a consequence, changes in the price of commodities may have an impact on the profitability of the two industries that compete. The natural change affects agricultural commodities’ production, accessibility, and safety, which composers have observed firsthand. In the same way, flood effects seem to be linked. Corn, wheat, rice, and soybeans are affected by the ozone-depleting elements generated throughout the food production process. Farmers in food-insecure regions are particularly exposed to weather anomalies and bizarre occurrences because of their dependence on self-sufficiency. This is more severe on a local level. Due to the decline in province creation, nations that rely heavily on the country region may be unable to fulfill their food demands. Their public money-related balances may suffer as a result of this. As the financial industry becomes more globalized, environmental change externalities and impacts may be spread more widely over the globe. For areas that rely more on regional growth for their livelihood than other regions, this might have the unintended consequence of impeding attempts to create a world free of hunger. How goods and services are priced domestically and internationally is critical to the success of this economy.
In this study, we evaluate the impact of weather patterns on the pricing of goods to understand better how weather patterns affect financial institutions. For this purpose, we promote the employment of a few developed indications of dwellers across data series of objects that encompass both the bridge and instantaneous components of the series during either rising or falling phases, which we subsequently tie to sufficient economic linkage. It is our main objective to provide a wide range of key points for designing strength situations for financial institutions from a realistic look at the formation of foundational hazards and budgetary truthfulness while also checking up on other effects that result from danger and reinforcing an increasingly broad viewpoint to remove clear signs of the shrouded tower’s progression in the lead from horizontally polarized and started working with the real economy. Thus, we use a sparse representation of a dimensional founder to develop market ingredients that may trigger periods of unpredictability while also having provided constructed hints and tips for investigating and verifying market position in the coming years, consistent with other proposed pointers and points of view which decided to enter the risk center console for foremost risk in more wide investment industry sectors.
In other words, we begin by looking at how individual things’ transitory characteristics change over time. Apart from being typically non-fixed, financial asset series are likely to exhibit nonlinear plans, including long-range temporary dependency or time reversibility, defined as the degree of dynamic invariance under time reversal. In recent years, many methods have been proposed for transforming time series into outlines that encode a few characteristics of the original time series into the center and edges without requiring a specific useful design for data delivery processes. Detectable quality outline approaches, for example, have been found to outperform several time series assessment criteria, particularly when complicated oddities are considered.
Energy and energy-related sources for energy production seem to be two areas where co-improvements between natural change and things have been studied thoroughly (Ghaffar et al., 2020). Irfan et al. (2021) pointed out that food stock expenditures underreact to natural variation alternatives. When it comes to green goods and fills, a flurry of writing has persuaded us to evaluate a broad range of products based on these linkages. For example, it is finned as a modest oil-food connection with no outrageous competitive correlation between oil and food pricing. As a result of the business effect, Wang et al. (2020) noted that crude Middle East oil costs have seen considerable positive co-advancements, and they also note that these co-improvements seem to be frequently driven by normal macroeconomic drivers. Co-improvements across a variety of biochemical time series have started to spread in these situations via the use of complicated structural systems. Biodiesel are miserably linked to numerous things in the short to medium term, and that in the medium term, this is the case (Purkit et al., 2020).
Human-environment interactions have a logical way in which complex relations must be answered, acknowledged, and smartened using a perplexing but hugely important analysis, according to UN Headquarters for Disaster Mitigation (UNDRR) figureheads in the Global Assessment Report on Disaster Risk Reduction (Henriques and Sadorsky, 2008; Sadorsky, 2009). One additional technique to go forward with the processes and methods intended to protect money policies from regular disruptions or energy production patterns is energized by the ephemeral character of the economy and the imaginations of ordinary risks and temperature conditions in economic market responses (Cooper, 2012).
In both fixed and non-fixed systems, graphing using observed techniques detects and protects crucial elements of the old time series (Labatt and White, 2011). It is possible to correlate two different time stamps if a direct line is drawn between them and does not intersect with the magnitude of any other time stamps (Miller, 2008). A statistical method of funding market episodes is better served by observable quality chart estimates, which are based on a direct numerical grasp of the original time series (Kok and De Conick, 2007; Baffes et al., 2015; Bodnar et al., 2018; Hepburn et al., 2020; Hussain et al., 2021).
It creates scale diagrams using uncommon story arcs and self-assertive and nonlinear sequencing (Mitchell et al., 2015). Inkpen and Moffett (2011) explained that the power-law representation of the degree distribution of the connected outline, rather than quantifiable approaches such as Hurst’s, may be used to determine the periodic series’ self-relative nature. As a result, we use this framework-embedded technique to moderate the focus on how qualities, such as lengthy dependency, may contribute to price volatility (Bondia et al., 2016). The direct accessibility method enables us to differentiate between upswings and downswings in the market by showing a separate network arrangement (Lyund, 2017). To construct an affiliation with each entity’s time series, the direct visibility algorithm (DVA) is used to create centers with significant out-(in-) degree gains, as indicated by a predefined reference theory. With the help of Puaschunder (2020), we then overlay the detectable quality graph to reveal similar traits across numerous item values in time-series data. Center and authority scores are obtained each time discrimination can be carried out because of the probabilistic tensor disintegration’s multi-layer quality connection knowledge. According to Grub (2004), financial stability and oil price scores often disclose details about multidimensional settings’ produced maxima (minima), such that the higher the authority (hub) score connected with a certain center point, the more coordinating the opposed data series of items are on particular patterns (Bigger and Carton, 2020).
The self-sustaining half of authority and hub scores is often shown as input around the center (Torul and Alper, 2010). Leadership ratings and admiration for locations with a large number of links to great administrator period centers are increased because screenshots have many connections to places with high hub score capability (Sonntag-O'Brien and Usher, 2012). To attempt to discern the evolution of understanding, it is vitally necessary to have statistics about the series’ delivery window (Harvey and Pilgrim, 2011), which is defined as the structure’s most limited time needed to return a similar condition from whence it moved material (Hamilton, 2013).
Although time series analysis is a stable and most well area, it has a few imperatives when used on more sophisticated indicators (Kunstler, 2007), such as when time series are nonlinear or display fantastic memory (Song and Woo, 2008), crazy practices, and anomalies. The data-collecting method we provide is not required since our methods for data collection are almost endless. Non-direct aspects of a system’s multi-layer relationship, such as network synchronizing, may be examined by evaluating the centrality of the system’s center points. It is clear that when the organization is compelled to deviate from its agreed-upon strategy, product costs are synchronized for a long time (Buchner and Wilkinson, 2015). When the market is current and the system is on the verge of adjustment, center point centrality findings have been more steady, on the other hand (Lv et al., 2021). Finally, multi-layer coherence scores reflect the development of synchronized relationships involving product costs and may be used to check the effectiveness of identity of operations originating from market co-improvements and positive sources of information.
It is utilized to assess the sensible directional organization of weather patterns (particularly temperature and pneumatic power, precipitation, and wind directions) and the FED Financial Stress Index (Monasterolo et al., 2020), which is used as a proxy for financial integrity (Paseda et al., 2020). Because of this, we have developed a correlation between centrality metrics and environmental change’s substantial future benefits. In addition, we identified a lead-slack relationship between the FSI and topological indicators, emphasizing the link between rising product value and new facility expansions (Naifer and Al Dohaiman, 2013; Shaikh et al., 2020). Taking a holistic prudential perspective, we will analyze the transmission mechanisms integrating energy production, macroeconomics, and financial systems (Addison et al., 2011).
Our inquiry examines oil, financial, and environmental concerns in three distinct ways; the third choice connects the two preceding ones. Three main types of information address each of these aspects: product value time series for various items, natural factor data, and overall capital business sector monetary data are included here. We use 42 month-to-month value time series of goods from 2015–2020 of ASEAN countries for the primary arrangement of variables. FRED data are retrieved and delivered in US dollars. Co-developments in diverse financial contexts are to be explicitly shown in this series of studies. In particular, the following generic categories might be used to reference the series.
Environmental factors, such as precipitation, temperature, air tension, and wind strength, are stored in our minds as month-to-month information. Although this is a long way from providing an accurate representation of the natural world, it provides a useful framework for crucial aspects that may influence the selection of items. A total of five satellite evaluations are included in the typical precipitation rate esteems, including the GPI and the OPI, the dispersing SSM/I discharge, and the MSU. A global land surface temperature is defined as GHCN + CAMS (global historical climatology network + energy production anomaly monitoring system). As a result of NCEP/NCAR reanalysis, we can reconstruct the ocean-level air tension and direction and intensity of the wind. Monthly perceptions of crude oil price volatility influenced by scope and longitude are used for each environment variable in the lattice. Similarly, financial stability is a concern.
The investigators used the generalized technique of moments to forecast the outcomes. The extended technique of moments is very useful for prediction and interpretation in approaches that rely on moment conditions. Improved performance with small and intermediate datasets and the ability to withstand tiny departures from the expected model are all part of this process. For our study in this area, we focus on the generalized technique of clipped seconds, which is more robust to significant model errors than other existing techniques and may produce estimates with essentially identical variance to the original GMM in many cases. A population adjustment may affect random estimates if we assert that an estimate is robust to little or large deviations from the model. The breakdown measure of the most widely used GMM estimator approximation equals zero.
If the number of criteria is more than the number of random factors, a system of sample moment conditions may not always be able to resolve the problem related to sampling errors. Weighted distance minimization or quasi-likelihood maximization is often employed to estimate the variable. An estimator’s attributes might differ depending on how an accessory problem is presented. An estimator’s small properties may be greatly improved by using other methodologies. The econometric model is constructed as,
whereas a restricted component segment which is denominated as γ is emphasized in Eq. 1 and is thought that the paralleled resolution available, christened with ˆ γ in Eq. 2;
It is demonstrated by the lowering concerns in mind (expressed numerically in Eq. 3). This is because a stochastic result is substituted for an average absolute and will not impact the GMM solution used for practical reasoning.
More precisely, the consistent factor functions are viewed as a restricted structure of statistical features, such as in equations, which are controlled by Eq. 4. The reduced form weighting estimator is, therefore, improved by Eq. 4, which also provides a measurement solution (RWE);
In the RWE, the reloading collection is evaluated at minimum econometric parameters instead of structural elements, which is an important distinction. The next classification is optimal because of the empirical connection shown in Eq. 5. A minimum of two GMM, the vectors in (5) are converted as follows:
To calculate the lesser number of weighted estimators (RWE), argument (5) will be further extended in Eqs 6–8 correspondingly. This is to evaluate the two different GMM approaches,
Using the findings about GMM, which directed that one may deduce the RWE higher-order asymptotic bias directly from RWE;
in which,
Associated with the CUE bias, the extended notation is
Eqs 9, 10 are further extended to compute simulations and estimate the two-step GMM estimated in the study.
Nevertheless, this research uses a new technique to show the optimal weighting matrix for the two-step parametric method with a well-defined threshold multivariate regression. The purpose is to build an appropriate weighting matrix for the model using semi-parametric component estimations. The final estimate in this study is known as a diminished weighted estimate. It does not have the higher-order asymptotic bias coming from choosing a previously weighted matrix since the forecast error variance variable is clearly stated. A protracted estimator and an RWE have the same statistical parameters in linear simultaneous equation models. As long as the reduced form component is considered, statistical equivalence holds for a minimal information linear model class.
The study aims to test the impact of crude oil price volatility on energy production change mitigation;
ASEAN nations i at t time, is the vector representing the output impact of growth function, is the indicator of economic pressure with, and is a parameter. On the other hand, they are part of the world, time-specific, and error phrases.
The vivid model (Eq. 12) under OLS has limitations. Taking variable initial differences is required to remove fixed effects. The first differences are in Eq. 13.
It has been shown that the permeability strategy may remove important data about the earliest signals in an efficient and systemically controlled manner. The interaction that generates the time series may be described using a fictitious schematic measure that obtains a few essential basic properties from the first series. The Hurst type of the series can be used to represent a nonstationary time series with a long-range dependence, such as a fragmentary Brownian movement, in terms of a sans scale permeability diagram with degree dispersion. Also demonstrated is this chart’s invariance with a few time series alterations, such as the interpretation, scaling, and extension of a linear pattern of information.
Accordingly, assume that a (self-assertive) requesting basis of the series should be defined so that in the subsequent diagrams, connections will be coordinated from time stamps where series have lower esteems to those where the series have higher values, 5 if and when there are no moderate points of quality. With the help of the direct visibility variation, we can create hubs with high upsides and low downsides for ware cost series.
Indeed, the existence of a link between two hubs is a factor in determining how long it takes for the framework to return to a comparable condition from whence it started without returning there during ages and in the severity of the series in the bowl marked by the double-cross stamps. When it comes down to it, a longer return time and a smaller standard deviation in a series will lead to more likely connections between double-cross stamps that are far apart in time.
Following that, we show in Figure 4 the elements of a reconstructed time series with 15 time stamps and the accompanying centralization scores, as ranked by the normalized in-(out) degree. To join the wheels together, bolts are required. A hub t = 10 has the most degree and jurisdiction benefits and the biggest worldwide sum in this circumstance. As seen in Figure 1’s addition plot, they are mostly associated with periodic hubs with higher hub scores (light blue bars). The basic time series is expected to begin a vertical pattern after high hub and authority scores, as indicated by their strong upward trend in shared prominence measurements. It is unclear what occurs when many separate time series move simultaneously. This model aims to provide information on the procedure’s potential to create a founder over time by awarding greater points to series that follow a similar dynamic. is a great example of this.
For each product time series, immediate transparency calculates a connection representation. Measurements of circles, i.e., monthly data, may show varying degrees of in (or out), meaning that their visible quality concerning other parts of the structure may alter according to the fundamental market features that the proposed geometric indicators aim to capture. Diagrams produced from product time series are shown in Figure 1. When the center is hidden, it suggests the hub’s importance, whereas the center’s large size suggests the authority’s importance. While the seemingly interminable period preceding the financial crisis’s collapse is less crucial, the center points related to it are more critical in terms of the responsibility level. Considering this conclusion, the item market hits a breaking point in such ranges, which affects an important percentage of the value series. When all factors are considered, two or three centers throughout the model period seem to be of very high recognizable character for each time series. These centers are monthly readers to handle important deviations from their area, thereby focusing on the most crucial seasons for examining market components and instability. Therefore, we first show the description of variables and describe the basic stability of data (see Table 1).
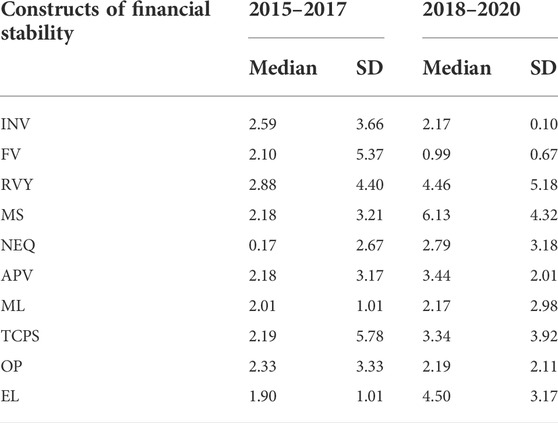
TABLE 1. Descriptive statistics.
Table 2 (right board) shows the cross-association coefficients between the authority score deviation and the FSI deviation, whereas the study disclosures show the merge rates between the hub score divergence and the FSI variance from its lengthy layout. Although the hub score is positively correlated with an imperfection in FSI deviation, the correlation is statistically large for negative values of the last variable, which suggests an unexpectedly high hub score deviation for a long time prior-run design and, conversely, an unexpectedly low FSI deviation for a short period is associated with a conceivable troubling hub point total. Strong hub scores, of course, will adversely influence the FSI’s constituents 8–18 months earlier. The autonomy deviation has a higher than the 0.5 cross-regression equation with the FSI deviation, indicating that a rising divergence from the long-run means of this centralization metric leads to a rising FSI difference, which happens roughly 90 days later. Our analysis concludes that FSI’s separation from its protracted prior-run architecture will grow if the authority deviation increases or the hub deviation lowers.
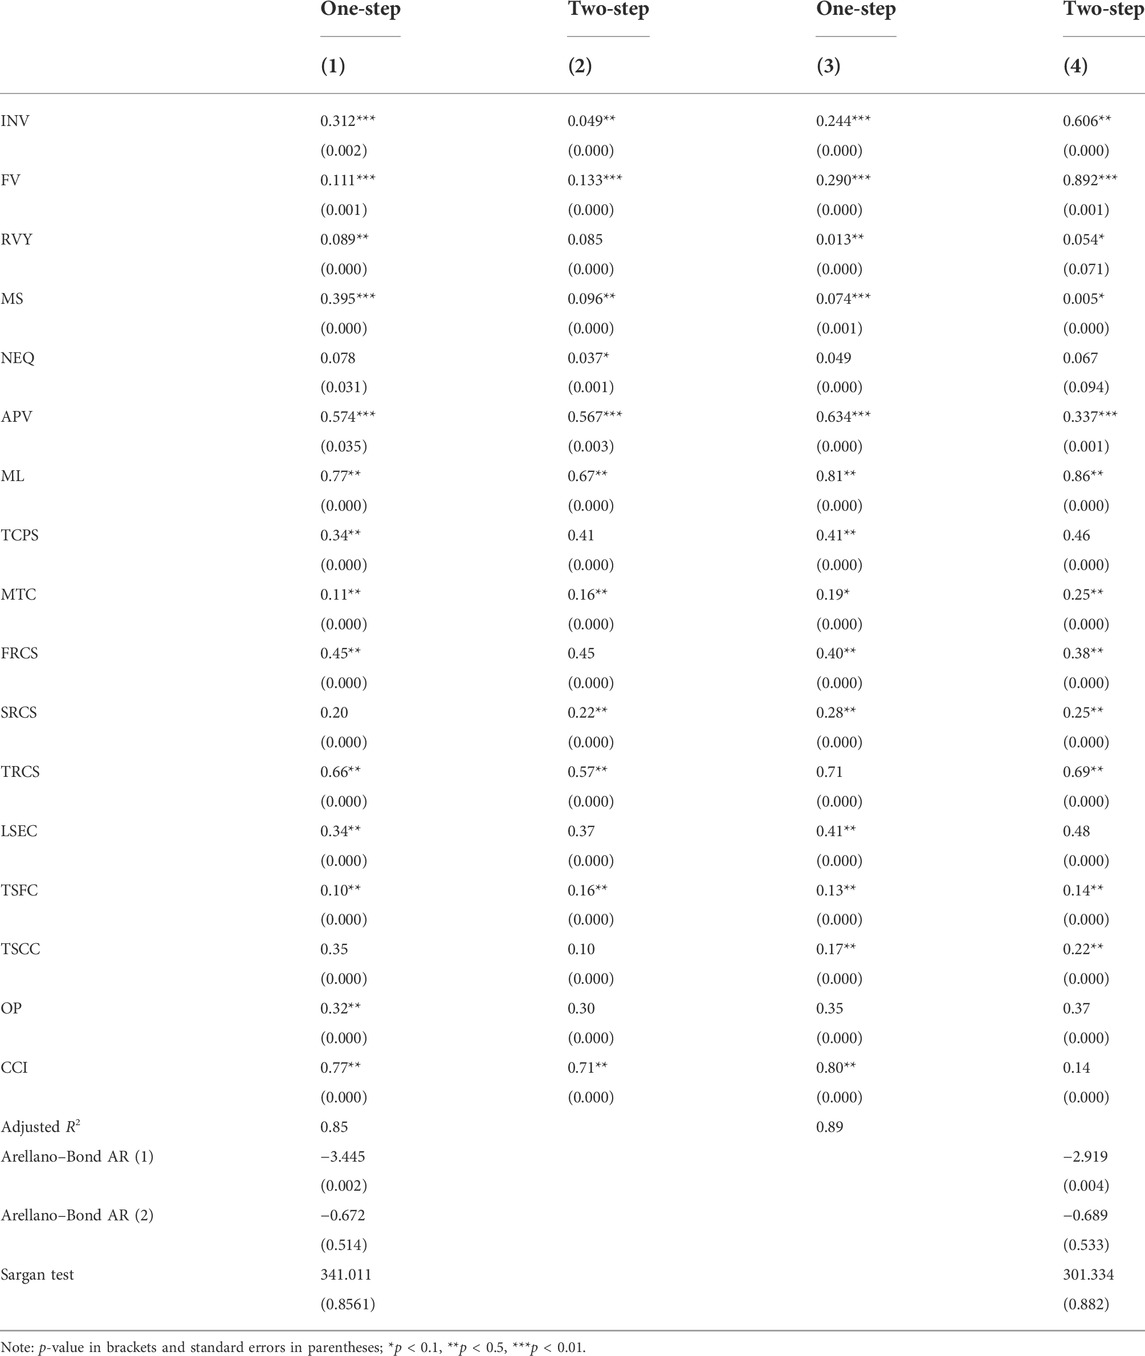
TABLE 2. One-step and two-step GMM estimates.
We employ a co-integration analysis to examine the link across weather patterns variables, product co-improvement, and financial resilience. This method allows us to evaluate the causal connections between the components by integrating the intuitive accessible in the core framework. To use the Granger causality assessment, the variables must show covariance stationarity and the models must appropriately describe the data. The statistical method may incorporate “egression” consequences if each variable’s first and second measurable minutes (mean and change) are not constant across time due to the need for covariance serial correlation. Thus, we use the extended GMM test to assess deviations from the correlated fixed premise. Stable covariances tend to return to their trustworthy mean (or deterministically moving). Large attributes are generally followed by smaller ones, while greater ones often follow smaller features. To obtain x I,t = xi,t 1, since our variables are not constant, we must first separate all of the components. Instead of focusing on multi-collinearity, we may instead pay attention to the causal links between variations in components.
Sensitivity analysis is shown in Table 4. These mathematical theories must also be evaluated by establishing a maximum number of deferrals that may be used. Modifications to the FSI’s potential gains have a greater impact on the hub than modifications to the authorities, whereas jurisdiction modifications have a greater impact on the FSI’s score. These findings may be decoded as follows: real changes in the FSI and hub scores demonstrate that recommended limits are moving forward on a continuum of severity, while the authority score, which indicates product co-forging ahead on an upward scale, incites a subsequent positive change in the FSI because it is based on the possibility of real economy interruption at these valuations. According to Kendall’s autonomously assessment, energy production-related elements have the highest measure of independence, but the FSI has the lowest degree of independence since it has the smallest level of confidence in this ecosystem.
Finally, we use a variant of Toda and Yamamoto’s Granger causality test to examine the link between FSI and topological pointers by examining the direction of causation, i.e., mean flood effects (1995). To establish stationarity, no changes to the main series are necessary. Therefore, there is no information deficiency due to differences. This testing does not need co-compromise and is possible even when a unit root is apparent in the time series. This method may be traced back to a long-term cause in the past.
Our examination mechanism gained legitimacy once we endorsed the Macroprudential Regulation Platform’s idea of an appraisal subject to board insights regarding capital safety with main hazard evaluation. Our suggested markers of tenuousness may help regulators better react to weather pattern issues that affect the stability conditions of monetary institutions, and help them develop suitable procedures for responding to weather pattern difficulties. Using our approach, we can construct the reloading period of the commodity response variable and focus critical information on item esteem co-advancements, which we show are impacted by energy production-related elements and, more strangely, are inconsequential (Yu et al., 2022).
Wealthy businesses are expected to be financially stable (Liu et al., 2022). Substantial value founder’s structural qualities allow for the quick retrieval of crucial weather patterns’ element combinations for econometric analyses of financial security in a broader range of income company fields (Syed and Bouri, 2022). Last but not least, we assess the impulse reaction on hub, jurisdiction, and FSI to evaluate how our components of interest respond to short-run shocks. Jordà's (2005) technique evaluates near-by predictions rather than the whole measurement window at each interval. Implementing different darkness material-generated networks has been demonstrated to be more resilient using this technique, which provides true joint and argument reasoning susceptible to confidence interval from conditional variance and unforeseen synchronization relapses (Deng, 2022). As shown in Table 3, our recommended topological metrics for grouping stuff based on their understanding and respect drive the motivating response to financial security situations. Shocks to one or more variables in the short term should be considered. Investment vehicles affected by recent floods directly impact resources and product marketing, even if these effects are only temporary (Yasmeen et al., 2019).
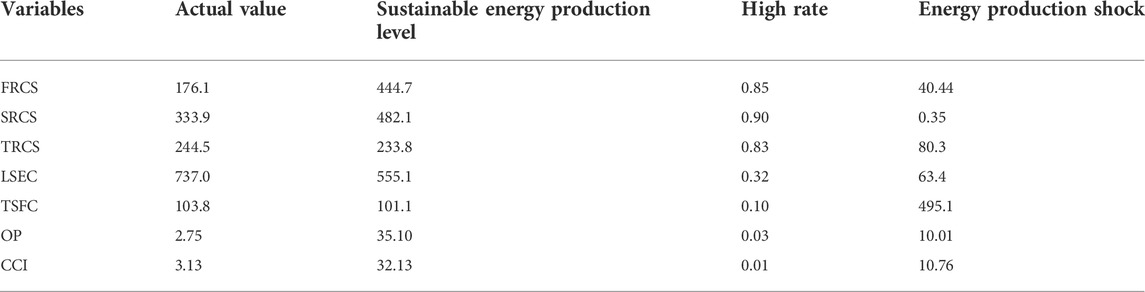
TABLE 3. Empirical parameters of sustainable energy productions of ASEAN economies.
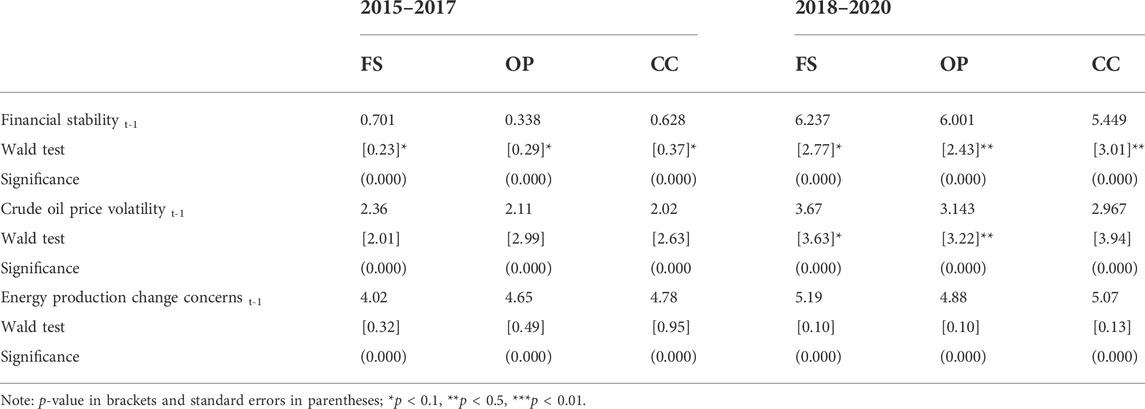
TABLE 4. Sensitivity analysis.
Our study conclusions are derived from an adaptive model that is aligned. Following that, there comes a cautionary statement. To understand the probable relative magnitudes of the oil price volatility, energy efficiency, and financial stability impacts examined, the statistics we get are important in and of themselves. Regardless, the study also highlighted a few more points concerning our investigation’s breadth. There are just a few kinds of oil reserves included in our calculations, which means that we cannot be as precise in measuring the effects of our decisions. As a result, regulators can better plan appropriate responses to energy production-related difficulties if our study depicts the nexus between energy production-related factors, goods of value, and financial stability. Intending to dissect financial instability, we propose a multidimensional graph speculative system that incorporates supplier confidence founders into adequate support points and considers both accompanying arrangements and the path these founders take in addition to central network importance. We may extract information from centrality metrics using a tensor method on a multi-layer detectable correct product. With these movements, produced scores may be secured that show the occupancy of various center points (time stamps) throughout market declines or increases, revealing, thus, the beginning of commercial anxiety. An outline estimate that can keep track of large amounts of standard statistical evidence is combined with the tensor-rot method, which is essential to eliminate many planned signals of dwellers that can then be utilized to determine market dependability situations after some time.
While analyzing the impact of oil price shocks on China’s economic stress, we break down oil prices into their parts. The increasing evidence of a quadratic connection between crude price and the stock market, quantity of money, and other multivariate time measures is leading to an increase in the popularity of regressive relationships between oil prices and these multivariate time measures. Although oil and stock prices seem to move in multiple directions, this is not necessarily the case. Our quantitative examination of the variety of interactions between oil prices in China and China’s financial market was motivated by this mismatch. Therefore, we argue that a nonlinear model is more suited to explain the relationship between oil price shocks and a financial instability index in the aforementioned circumstances. The BDS test suggests that there may be a quadratic relationship between the variables under consideration.
As previously suggested, a Markov puppet government model is used to represent the future relationship nonlinearity. Oil price volatility is one of the most used systems in dynamics models. It has often been used in the context of time series and panel data. The oil price volatility system allows for the night before going to bed correlation across domains and depends on the probability of an unknown stochastic process to determine the likelihood of a particular event occurring. External events have been successful when the modification does seem to be driven mostly by the energy efficiency model. The Markov method may tolerate time-varying causative contexts, unlike logistic regression with constant parameters and no regime changes. The impact of oil price shocks on China’s financial markets may change based on the kind of tension. Studies on the link between oil price volatility and financial difficulties have focused mostly on the presidential administration in this process. On the other hand, the standard generalized least regression’s constant hypothesis may be overly rigid, leading to an inaccurate extrapolation specification.
Oil prices and the marketplaces for debt and currencies have also been studied in depth. The association between oil prices and the foreign exchange market is also debated. When it comes to Indian petroleum products and the rupee. The Indian rupee has fallen in value versus the US dollar due to the rise in oil prices. As predicted, crude oil prices are affected by changes in the dollar’s value. Global oil prices may have a significant impact on the value of the currency, dependent on whether market equilibrium is the driving force. The research corroborates this.
The detectable quality outline framework is specifically used to grow an estimate that transforms over time into a structured graph that obtains certain key features of the primary data. These estimations change over time. By stacking up any quality chart that may be detected, we next perform tensor breaking to eliminate any knowledge from it. As a result, we suggest combining the number of co-advancements with two or three specifically developed indicators of association centralization, which we demonstrate to discern seasons of market insecurity by choice. According to the suggested centrality measures, appropriate value changes affecting a few item time series contrast with center points with high scores. Implications are used to convey information about the dispersion of multivariate time series and the amount of upward and downward founders among item costs in the multivariate time series. We next include these centralization measures into empirical models to examine the relationships between topological measures, the strength requirements of monetary structures, and weather pattern angles. Using our method, we discovered that the suggested topological markers respond to variations in energy production patterns and support the existence of an economic link. This econometric evaluation may contribute to a rational and basic investigation of the transmission elements that link climatic conditions, basic economics, and banking institutions.
Though our strategy for uncovering a link between weather pattern activities and financial stability is advantageous, we are well aware of its study limitations. A broad depiction of local energy production was chosen to show the workings of an incredibly wide construction for investigating the relationships between weather pattern scenarios (such as weather), things, and financial structures, which does not, as expect, include all energy production and perfectly natural angles that directly impact specific items. As a result, since our data are so extensive, we have been forced to average all temperature features across work centers, ignoring the influence of energy production-related qualities on surrounding item displays. For the third time, our study depends on a monthly expenditure perspective. Furthermore, we do not pay much attention to moments of market turbulence that happen more often. Enhanced product graphs are needed to show the combined proximity cross-section of the relationships between time stamps and their corresponding values. Due to our technique’s inability to secure evidence on leaps that may be utilized in the evaluation of implausible events, our method does not clearly secure information on esteem jumps that can be used, for example, in the evaluation of implausible occurrences. As a result of policy guidance, Baltic states must also embrace other existing trade legislation, define economic ties with more regions, and strengthen their global influence and voice by unifying and trying to advance trade relationships with various global economies and economic organizations. Despite technical advances in renewable energy, national power and centrality in the natural market structure may aid in developing sustainable power. This means that R and D expenditure on sustainable power production and electricity technology must be increased on the one hand, while R and D on new energies for important minerals must be bolstered, and technical achievements in recycling centers must be pushed forward.
The original contributions presented in the study are included in the article/Supplementary Material; further inquiries can be directed to the corresponding author.
XD: manuscript write-up; TO: methodology and supervision, GS: data collection and visualization; LD: editing, data assembling, and visualization; and RG: data analysis and interpretation.
This research was funded by Marxist Theory discipline of Baise University, the new round of first-class discipline construction projects in Guangxi [Gui Jiao Ke Yan (2022) No. 1].
The authors declare that the research was conducted in the absence of any commercial or financial relationships that could be construed as a potential conflict of interest.
All claims expressed in this article are solely those of the authors and do not necessarily represent those of their affiliated organizations, or those of the publisher, the editors, and the reviewers. Any product that may be evaluated in this article, or claim that may be made by its manufacturer, is not guaranteed or endorsed by the publisher.
Addison, T., Arndt, C., and Tarp, F. (2011). The triple crisis and the global aid architecture. Afr. Dev. Rev. 23 (4), 461–478. doi:10.1111/j.1467-8268.2011.00299.x
Adedoyin, F. F., Ozturk, I., Agboola, M. O., Agboola, P. O., and Bekun, F. V. (2021). The implications of renewable and non-renewable energy generating in Sub-Saharan Africa: The role of economic policy uncertainties. Energy Policy 150, 112115. doi:10.1016/j.enpol.2020.112115
Baffes, J., Kose, M. A., Ohnsorge, F., and Stocker, M. (2015). The great plunge in crude oil price volatility: Causes, consequences, and policy responses. Consequences, and Policy Responses. June 2015.
Baldi, L., Peri, M., and Vandone, D. (2014). Clean energy industries and rare Earth materials: Economic and financial issues. Energy Policy 66, 53–61. doi:10.1016/j.enpol.2013.10.067
Bigger, P., and Carton, W. (2020). “Finance and energy production change,” in The Routledge handbook of financial geography (Routledge), 646–666.
Bodnar, P., Ott, C., Edwards, R., Hoch, S., McGlynn, E. F., and Wagner, G. (2018). Underwriting 1.5°C: Competitive approaches to financing accelerated climate change mitigation. Clim. Policy 18 (3), 368–382. doi:10.1080/14693062.2017.1389687
Bondia, R., Ghosh, S., and Kanjilal, K. (2016). International crude oil prices and the stock prices of clean energy and technology companies: Evidence from non-linear cointegration tests with unknown structural breaks. Energy 101, 558–565. doi:10.1016/j.energy.2016.02.031
Bourghelle, D., Jawadi, F., and Rozin, P. (2021). Oil price volatility in the context of Covid-19. Int. Econ. 167, 39–49. doi:10.1016/j.inteco.2021.05.001
Buchner, B., and Wilkinson, J. (2015). 33 Pros and cons of alternative sources of energy production change financing and prospects for 'unconventional finance. Towards a workable and effective energy production regime, 483.
Cooper, R. N. (2012). Financing for climate change. Energy Econ. 34, S29–S33. doi:10.1016/j.eneco.2012.08.040
Deng, M. (2022). China economic performance and natural resources commodity prices volatility: Evidence from China in COVID-19. Resour. Policy 75, 102525. doi:10.1016/j.resourpol.2021.102525
Ghaffar, A., Munir, M., Aziz, O., Alhajj, R., and Sanaullah, A. (2020). COVID 19 incidence curve: Intelligent smart approach instead of lockdown. Empir. Econ. Rev.
Grubb, M. (2004). Technology innovation and energy production change policy: An overview of issues and options. Keio Econ. Stud. 41 (2), 103–132.
Hamilton, J. D. (2013). “Crude oil price volatility, exhaustible resources and economic growth,” in Handbook on energy and energy production change (Edward Elgar Publishing).
Harvey, M., and Pilgrim, S. (2011). The new competition for land: Food, energy, and climate change. Food policy 36, S40–S51. doi:10.1016/j.foodpol.2010.11.009
Hassan, A., Ibrahim, M., and Bala, A. J. (2021). On the pursuit of energy security: Evidence from the nexus between clean energy stock price and energy security elements. Int. J. Sustain. Energy 41, 846–867. doi:10.1080/14786451.2021.1986043
Henriques, I., and Sadorsky, P. (2008). Oil prices and the stock prices of alternative energy companies. Energy Econ. 30 (3), 998–1010. doi:10.1016/j.eneco.2007.11.001
Hepburn, C., O'Callaghan, B., Stern, N., Stiglitz, J., and Zenghelis, D. (2020). Will COVID-19 fiscal recovery packages accelerate or retard progress on energy production change? Oxf. Rev. Econ. Policy 36 (1), S359–S381. doi:10.1093/oxrep/graa015
Hussain, A., Oad, A., Ahmad, M., Irfan, M., and Saqib, F. (2021). Do financial development and economic openness matter for economic progress in an emerging country? Seeking a sustainable development path. J. Risk Financ. Manag. 14 (6), 237. doi:10.3390/jrfm14060237
Inkpen, A., and Moffett, M. H. (2011). The global oil & gas industry: Management, strategy and finance. PennWell Books, LLC.
Irfan, M., Akhtar, N., Ahmad, M., Shahzad, F., Elavarasan, R. M., Wu, H., et al. (2021). Assessing public willingness to wear face masks during the COVID-19 pandemic: Fresh insights from the theory of planned behavior. Int. J. Environ. Res. Public Health 18 (9), 4577. doi:10.3390/ijerph18094577
Kok, M. T. J., and De Coninck, H. C. (2007). Widening the scope of policies to address climate change: Directions for mainstreaming. Environ. Sci. policy 10 (7-8), 587–599. doi:10.1016/j.envsci.2007.07.003
Kunstler, J. H. (2007). The long emergency: Surviving the end of oil, energy production change, and other converging catastrophes of the twenty-first century, 307. Open Road+ Grove/Atlantic.
Labatt, S., and White, R. R. (2011). Carbon finance: The financial implications of energy production change, 362. John Wiley & Sons, 288.
Lee, C. C., Olasehinde-Williams, G., and Akadiri, S. S. (2021). Are geopolitical threats powerful enough to predict global oil price volatility? Environ. Sci. Pollut. Res. 28 (22), 28720–28731. doi:10.1007/s11356-021-12653-y
Liu, Q., Zhao, Z., Liu, Y., and He, Y. (2022). Natural resources commodity prices volatility, economic performance and environment: Evaluating the role of oil rents. Resour. Policy 76, 102548. doi:10.1016/j.resourpol.2022.102548
Lv, X., Dong, X., and Dong, W. (2021). Oil prices and stock prices of clean energy: New evidence from Chinese subsectoral data. Emerg. Mark. Finance Trade 57 (4), 1088–1102. doi:10.1080/1540496x.2019.1689810
Lynd, L. R. (2017). The grand challenge of cellulosic biofuels. Nat. Biotechnol. 35 (10), 912–915. doi:10.1038/nbt.3976
Miller, A. S. (2008). Financing the integration of climate change mitigation into development. Clim. Policy 8 (2), 152–169. doi:10.3763/cpol.2007.0432
Mitchell, J. V., Mitchell, B., and Marcel, V. (2015). Oil and gas mismatches: Finance, investment and energy production policy. Chatham House for the Royal Institute of International Affairs.
Monasterolo, I., Billio, M., and Battiston, S. (2020). The importance of compound risk in the nexus of COVID-19, energy production change and finance. Energy production change and Finance. June 20, 2020.
Naifar, N., and Al Dohaiman, M. S. (2013). Nonlinear analysis among crude oil prices, stock markets' return and macroeconomic variables. Int. Rev. Econ. Finance 27, 416–431. doi:10.1016/j.iref.2013.01.001
Oh, T. H., Pang, S. Y., and Chua, S. C. (2010). Energy policy and alternative energy in Malaysia: Issues and challenges for sustainable growth. Renew. Sustain. Energy Rev. 14 (4), 1241–1252. doi:10.1016/j.rser.2009.12.003
Omer, A. M. (2008). Energy, environment and sustainable development. Renew. Sustain. energy Rev. 12 (9), 2265–2300. doi:10.1016/j.rser.2007.05.001
Oyedepo, S. O. (2012). Energy and sustainable development in Nigeria: The way forward. Energy sustain. Soc. 2 (1), 15–17. doi:10.1186/2192-0567-2-15
Paseda, O., Owolabi, J., and Okanya, O. (2020). Energy production change and finance in africa: Some theoretical and practical justifications.
Poudineh, R., Sen, A., and Fattouh, B. (2018). Advancing renewable energy in resource-rich economies of the MENA. Renew. Energy 123, 135–149. doi:10.1016/j.renene.2018.02.015
Puaschunder, J. (2020). “An inquiry into the nature and causes of energy production wealth of nations: What temperature finance gravitates toward? Sketching a energy production-finance nexus and outlook on energy production change-induced finance prospects,” in Governance & energy production justice (Cham: Palgrave Macmillan), 205–248.
Purkait, S., Karmakar, S., Chowdhury, S., Mali, P., and Sau, S. K. (2020). Impacts of novel coronavirus (COVID-19) pandemic on fisheries sector in India: A minireview. Ind. J. Pure App. Biosci. 8 (3), 487–492. doi:10.18782/2582-2845.8179
Sadorsky, P. (2009). Renewable energy consumption, CO2 emissions and oil prices in the G7 countries. Energy Econ. 31 (3), 456–462. doi:10.1016/j.eneco.2008.12.010
Sheikh, U. A., Asad, M., Ahmed, Z., and Mukhtar, U. (2020). Asymmetrical relationship between oil prices, gold prices, exchange rate, and stock prices during global financial crisis 2008: Evidence from Pakistan. Cogent Econ. Finance 8 (1), 1757802. doi:10.1080/23322039.2020.1757802
Song, L., and Woo, W. T. (2008). China's dilemma: Economic growth, the environment and energy production change. ANU Press, 428.
Sonntag-O'Brien, V., and Usher, E. (2012). “Mobilizing finance for renewable energies,” in Renewable energy (Routledge), 197–223.
Sovacool, B. K. (2013). Energy policymaking in Denmark: Implications for global energy security and sustainability. Energy Policy 61, 829–839. doi:10.1016/j.enpol.2013.06.106
Syed, Q. R., and Bouri, E. (2022). Spillovers from global economic policy uncertainty and oil price volatility to the volatility of stock markets of oil importers and exporters. Environ. Sci. Pollut. Res. 29 (11), 15603–15613. doi:10.1007/s11356-021-16722-0
Tian, J., Yu, L., Xue, R., Zhuang, S., and Shan, Y. (2022). Global low-carbon energy transition in the post-COVID-19 era. Appl. energy 307, 118205. doi:10.1016/j.apenergy.2021.118205
Torul, O., and Alper, C. E. (2010). Asymmetric effects of crude oil price volatility on the manufacturing sector in Turkey. Rev. Middle East Econ. Finance 6 (1), 90–105.
Wang, B., Schlagwein, D., Cecez-Kecmanovic, D., and Cahalane, M. C. (2020). Beyond the factory paradigm: Digital nomadism and the digital future (s) of knowledge work post-COVID-19. J. Assoc. Inf. Syst. 21 (6), 1379–1401. doi:10.17705/1jais.00641
Yasmeen, H., Wang, Y., Zameer, H., and Solangi, Y. A. (2019). Does oil price volatility influence real sector growth? Empirical evidence from Pakistan. Energy Rep. 5, 688–703. doi:10.1016/j.egyr.2019.06.006
Keywords: financial stability, energy efficiency concerns, oil price volatility, sustainable production, GMM
Citation: Du X, Ouyang T, Shi G, Deng L and Gul R (2022) Role of oil price volatility, energy efficiency, and financial stability on sustainable energy production. Front. Environ. Sci. 10:977733. doi: 10.3389/fenvs.2022.977733
Received: 24 June 2022; Accepted: 28 July 2022;
Published: 10 October 2022.
Edited by:
Magdalena Radulescu, University of Pitesti, RomaniaReviewed by:
Tomiwa Sunday Adebayo, Cyprus International University, TurkeyCopyright © 2022 Du, Ouyang, Shi, Deng and Gul. This is an open-access article distributed under the terms of the Creative Commons Attribution License (CC BY). The use, distribution or reproduction in other forums is permitted, provided the original author(s) and the copyright owner(s) are credited and that the original publication in this journal is cited, in accordance with accepted academic practice. No use, distribution or reproduction is permitted which does not comply with these terms.
*Correspondence: Tianzhi Ouyang, b3V5YW50ejExMUAxNjMuY29t
Disclaimer: All claims expressed in this article are solely those of the authors and do not necessarily represent those of their affiliated organizations, or those of the publisher, the editors and the reviewers. Any product that may be evaluated in this article or claim that may be made by its manufacturer is not guaranteed or endorsed by the publisher.
Research integrity at Frontiers
Learn more about the work of our research integrity team to safeguard the quality of each article we publish.