 Xinhao Li1†
 Yong Niu
- 1College of Forestry, Shandong Agricultural University, Taian, China
- 2School of Soil and Water Conservation, Beijing Forestry University, Beijing, China
- 3Beijing Water Science and Technology Research Institute, Beijing, China
- 4College of Water Conservancy and Civil Engineering, Shandong Agricultural University, Taian, China
Ecological deterioration and water scarcity motivate people to seek a balance between ecological reserves and water consumption in cities located in Semi-humid regions. This study is designed to develop a method for evaluating cooling water-saving characteristics of green space structures. Land surface temperature (TS), vegetation quantity (VQ) and evapotranspiration (ET) of typical green vegetation structures in 50 plots with an average area of 10,000 m2 were studied. Parameters were obtained based on data from three temporal remote sensing images; the surface energy balance algorithm for land (SEBAL) model, single-channel algorithm, and normalized difference vegetation index (NDVI) were utilized in the calculation. The relationships between the TS, VQ, and ET of green land were explored using regression analysis. A comprehensive index (EWI) was proposed to evaluate the cooling and water-saving abilities of different green space structures. Based on assessment results, species were classified into three: good (EWI ≥ 0.795), common (0.795 > EWI ≥ 0.419), and weak (EWI < 0.419). The characteristics of 17 species or species compositions with good cooling and water-saving abilities were summarized as: 1) a mix of the arbor, shrub, and herb, and 2) complete cover of green space by shrub.
Introduction
Water is the source of life; efficient water use has significant implications for people who live in regions with little precipitation. Approximately 53% of China’s territory is made up of arid and Semi-humid regions. Ranked 121th in the world, China has annual per capita water resources of only 2,200 m3, and with over 400 cities, there is a serious water deficiency especially in the north. Currently, deficits existing between the water demand and supply are becoming the principal bottleneck to sustainable development. To alleviate the pressure on water resources, the Chinese government has implemented several significant water transfer and water-saving projects (Cai, 2008). However, with rapid urbanization, people have to cope with the problems brought about by the deterioration of the ecological environment in cities, such as water pollution, hazy weather, and heat island effect etc. This has resulted in economic losses.
As an important part of the urban ecosystem, urban green spaces can provide vital services to humans (World Resources Institute, 2005), and make both the ecosystem and society sustainable (Katherine et al., 2010). Although urban green spaces might be smaller in size compared to other land uses, the value of its ecosystem services is likely to be disproportionately higher depending on their locations (Perino et al., 2014). Maximizing the ecological value of green spaces partly dependents on a reasonable mix of landscape plants (Katherine et al., 2010). In 2011, the green coverage rate reached 38.62% in the cities of China (The National Afforestation Committee, 2019), but there are still problems such as unreasonable green space structure and inefficient use of water. Take Beijing as an example; in 2009, the green space area was 617 km2, urban green coverage rate was 43.5%, and annual irrigation water requirement was 2.2 m3 × 108 m3, nearly 10% of the gross city water consumption (Beijing Municipal Bureau of Statistics, 2019). The great water requirement of green space irrigation further aggravates the pressure on water supply in the cities, especially in the arid and Semi-humid regions. It is critical to understand the potential tradeoffs between service functional values of ecology and city water usage. In this regard, it is necessary to conduct a study on water consumption and ecological functions of vegetation structures. We also hope that our work can bridge the gap between ecological environmental quality and water resources in the arid and Semi-humid regions.
Hydrology is regarded as an important technological path in the study of water utilization and vegetation management (Masoud et al., 2007; Cheng et al., 2009; Yan et al., 2010; Zhao et al., 2010). This method laid the foundation for understanding plant water consumption. However, only a few studies focused on different green space structures with monoculture species. Also, the hydrology method is difficult when comparing large quantities of objects because of the unbearable cost (Li et al., 2009). Analogously, existing studies on service function of vegetation are mostly single case studies that focused on carbon sequestration, dust-retention, and oxygen releasing abilities, etc. (Katri et al., 2011; Yen and Lee, 2011; Liu et al., 2013; Zhao et al., 2013). Thus, there is a lack of comparative analysis. Meanwhile, spatial gradient analysis was widely used in landscape ecology studies, but it was not suitable for a plot scale (Kong et al., 2005; Tohru et al., 2011). The vegetation evapotranspiration, leaf quantity, and temperature of 50 different green space communities in the Beijing urban area can reflect the regional ecological carrying capacity to a certain extent. Above all, there would be some disadvantages of the above research methodology in a comparative study of ecological functions and water consumption of various urban green space structures.
The capacity and efficiency of environmental information collection for the Earth’s surface have been greatly improved by the development of remote sensing (RS) technology. Many algorithms have been applied to estimate vegetation evapotranspiration, structure, and land surface temperature at multiple spatial scales (Liu et al., 2007). Historically, there are three methods applied in the estimation of evapotranspiration: statistical methods (Jackson et al., 1977), energy residual methods (Granger and Gray, 1989; Hobbins et al., 1999), and numerical models. Recently, many quantitative RS studies have been conducted with SEBAL (Surface Energy Balance Algorithm for Land), SEBS (Surface Energy Balance System), and S-SEBI (Simplified-Surface Energy Balance Index) models (SEBS model and S-SEBI model were generated based on SEBAL model) (Idso et al., 1975; Bastiaanssen et al., 1998a; Roerink et al., 2000; Su, 2002), and good results were obtained. Since 1960, several algorithms including single-channel, split-window, multi-view single-channel, and multi-channel and multi-angle algorithms, have been proposed for the calculation of surface temperature with different RS data. (Becker, 1987; Roerink et al., 2000; Dash et al., 2002; Su, 2002; Jiménez Muñoz and Sobrino, 2003; Qin et al., 2010) used different algorithms to estimate the temperature of underlying surfaces.
This study investigated the vegetation evapotranspiration, leaf quantity, and temperature of 50 different green space communities in the Beijing urban area. The study sought to explore a method for evaluating the cooling and water-saving abilities of typical green space structures using RS and GIS and to provide a reasonable focus on green space structure and information in the management of urban green space, and research results are of significance in improving the ecological carrying capacity of the Semi-humid Region.
Materials and methods
Study site
The study sites were located in Beijing, northern China (Figure 1). Beijing, an ancient city with over 1,000 years of history, is a rapidly developing city, with more than eight million urban residents. The city consists of 14 administrative districts and four counties. In downtown, there are approximately 40 main parks.
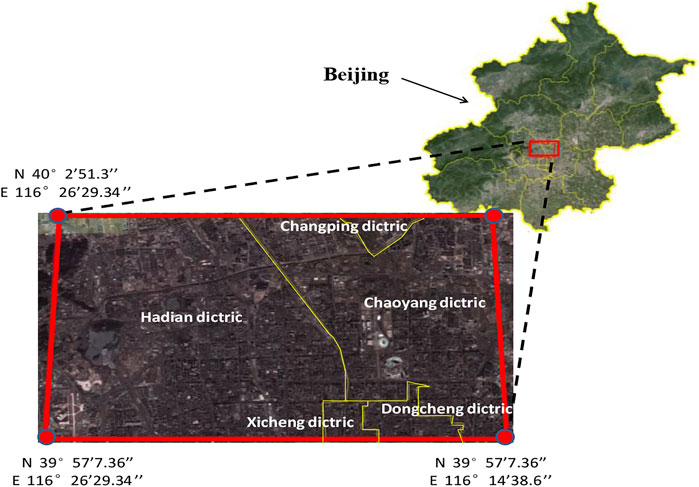
FIGURE 1. Study area (bold-red bordered line).
The main study area, located in the northwest of the city (116˚14′38.6″E–116˚24′29.34″E, 39˚57′7.36″N–40˚2′51.3″N), includes parts of Haidian, Chaoyang, Changping, Dongcheng, and Xicheng district, with a gross area of 147.5 km2; the annual total rainfall ranges from 544.7 to 575.6 mm (Figure 1). The green space is mainly located in the National Olympic Park, Old summer Palace Park, summer Palace Park, Bajia Park, Haidian Park, Beitucheng Park, etc. Buildings, roads, water, green land, and bare land are the main land cover types present. Monoculture and mix-species arbor forests, shrubbery, grass and multi vegetation structures of tree-shrub-grass typically make up the green vegetation types.
Remote sensing data
Three temporal remote sensing Landsat-8 images, which were generated on 12 May 2013, 13 June 2013, 1 Sep 2013, respectively, were used. The standard Landsat eight data products provided by the USGS EROS Center (http://landsat.usgs.gov/index.php) consist of multispectral image data acquired by both the Operational Land Imager (OLI) and Thermal Infrared Sensor (TIRS). One image scene consists of nine spectral bands with a spatial resolution of 30 m for bands one to seven and 9. Thermal bands 10 and 11 are useful in providing more accurate surface temperatures and are collected at 100 m.
Meteorological data
The meteorological data were collected on 12 May 2013, 13 June 2013, 1 Sep 2013, respectively, and the hourly meteorological data involved in this study were collected from the Beijing Weather Observatory website (http://cdc.bjmb.gov.cn/shuju.asp), and this included solar radiation, rainfall, wind speed, temperature, and relative humidity. The collected meteorological data were used to evaluate the cooling and water-saving abilities of typical green space structures.
Sample plots
50 plots with different vegetation communities were selected in the study area; their areas ranged from 6,400 to 12,100 m2 (average size, 100 m × 100 m), and away from buildings and water. Vegetation structure can be classified into pure arbor type, arbor-grass type, arbor-shrub type, arbor-shrub-grass type, shrub-grass type, and grass type. The vegetation structure information was collected by field survey, and it included: dominant plant species, species coverage, and sand density (as shown in Table 1).
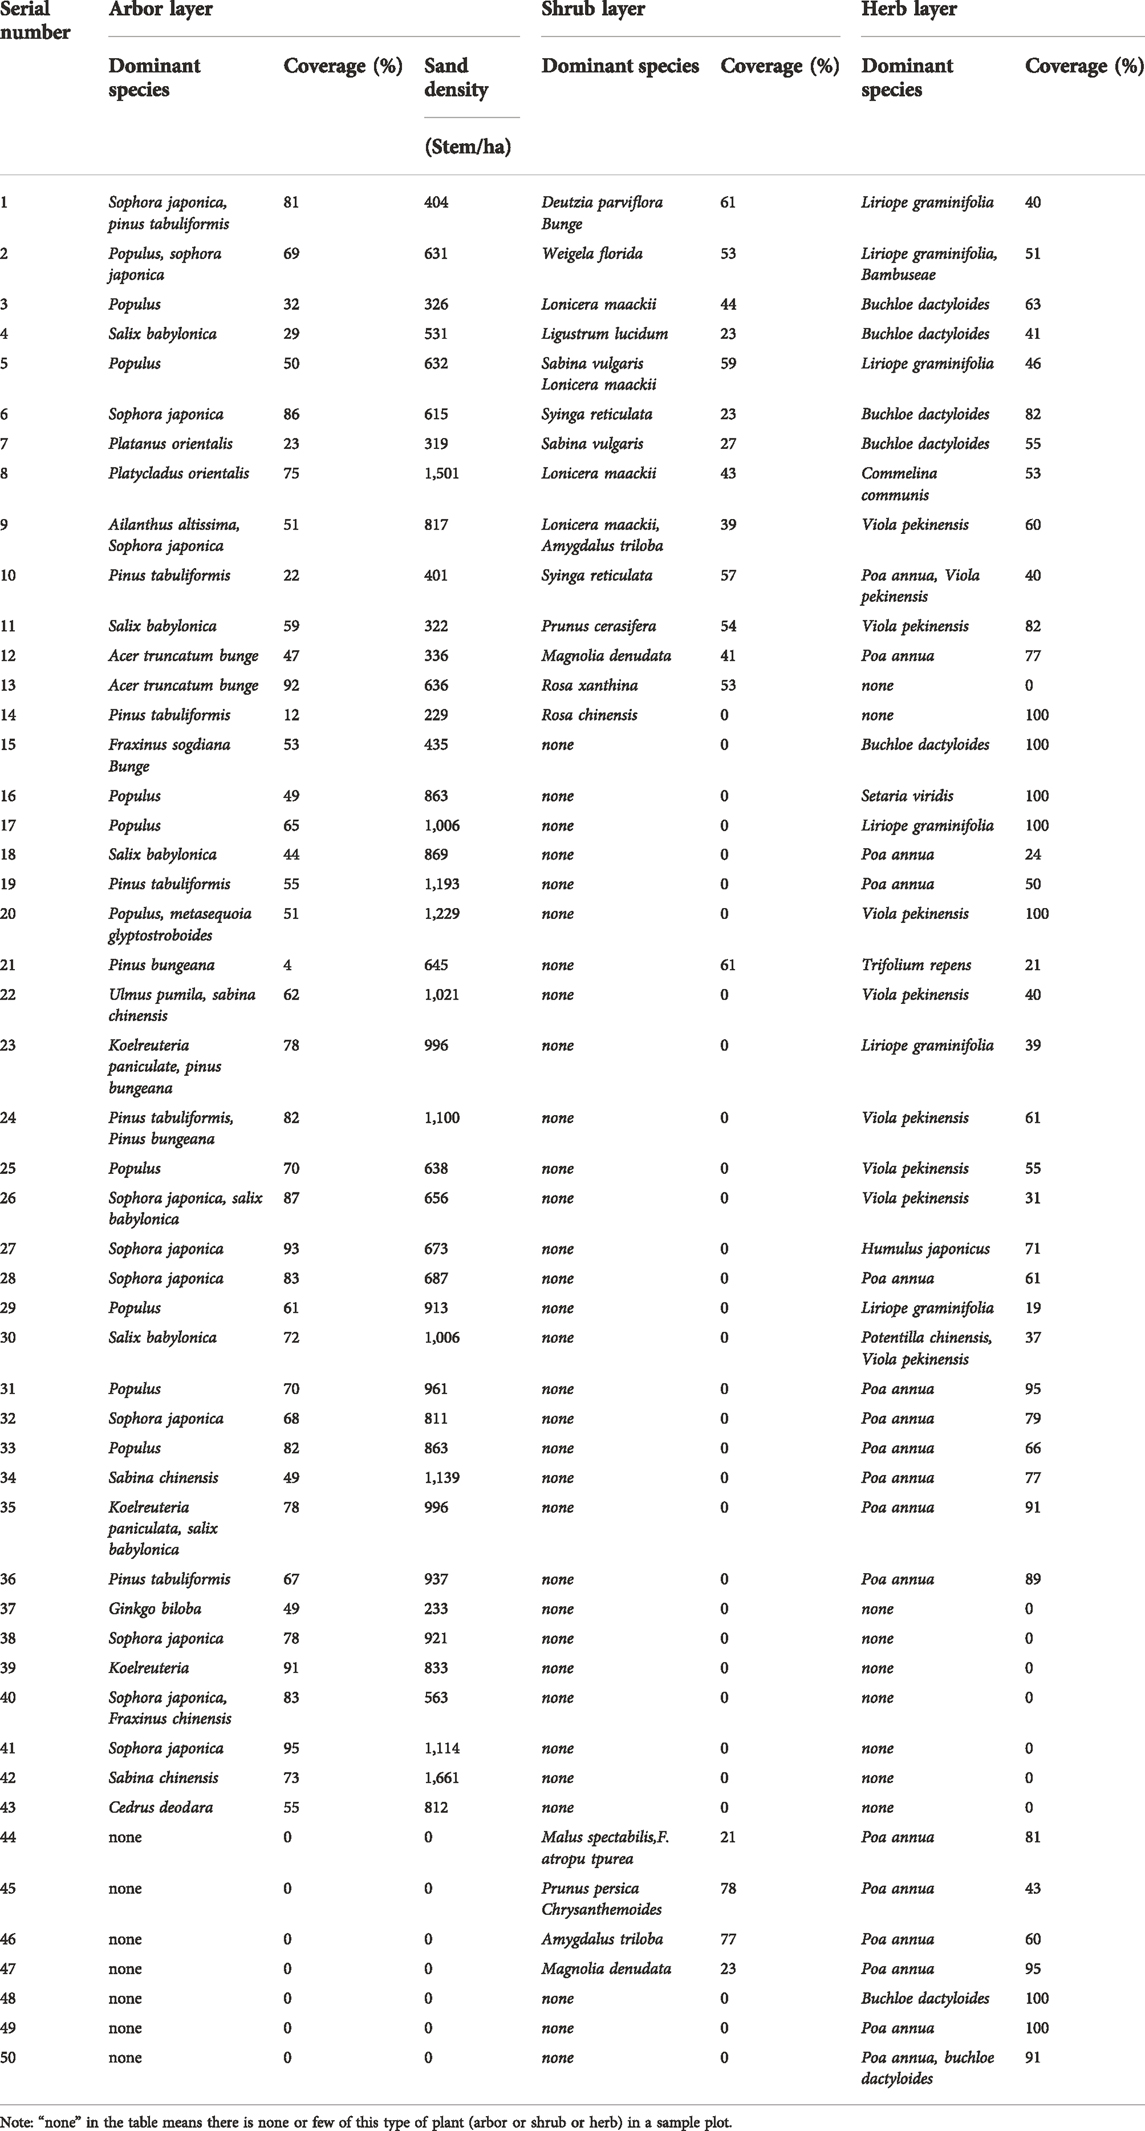
TABLE 1. Sample plot status.
Vegetation quantity
There is a reasonable relationship between vegetation quantity and NDVI in pixel scale (Di et al., 2012) for the study area, and this was expressed as:
Where VQi (m2/900 m2) is the vegetation quantity in pixels, which were covered by sample plots, and NDVIi is the normalized difference vegetation index in pixels; the NDVIi estimation model was obtained from Eq. 2 (Di et al., 2012).
Where ρ5 is reflectivity in OLS-5 band, and ρ4 is reflectivity in OLS-4 band.
Mean VQ per-plot was calculated as follows:
Where n is the number of pixels covered by a sample plot.
On 12 May 2013, 13 June 2013, and 1 Sep 2013, the VQ of 10 plots were measured with a LAI-2200 canopy analyzer (LI-COR, United States) to verify the accuracy of calculation of VQRS.
Land surface temperature
In this paper, The land surface temperature (Ts) of different land-use types was calculated with a single-channel algorithm (Di et al., 2012), including road, urban water body, residential area, high vegetation quantity area and low vegetation quantity area, as shown in Eqs 4,5. The mean Ts of a sample plot was expressed as an average of the temperature values of all the pixels covered by the sample plot in 3 days, which corresponded to days when the three remote sensing images were taken. These were defined by the equations below.
Where T10 is radiant brightness temperature (K) in TIRS-10 band, °C, Ts (K) is land surface temperature, °C, K1 (m2 sr μm) and K2 (K) are constants, ε is thermal emissivity, and L10 is radiant brightness (m2 sr μm) in TIRS-10 band.
Evapotranspiration
The calculation of evapotranspiration (ET) was based on SEBAL, which was established by (Bastiaanssen et al., 1998b) and widely used in the retrieval of ET by RS (Mohammad and Samaneh, 2012). The processes involved in SEBAL utilization can be summarized as the instantaneous latent heat fluxes of every pixel that can be gotten by surface energy balance, as expressed in equation Eq. 6. The instantaneous evaporative fraction is shown in the literature to be similar to the 24-h evaporative fraction (Shuttleworth et al., 1989), and thus daily average value of ET can be calculated through time scale transformation (Brutsaert and Sugita, 1992; Crago, 1996), as expressed in Eqs 7,8. The mean ET of a sample plot was expressed as an average of the ET values of all the pixels that were covered by the sample plot in 3 days, and this corresponded to days when the three RS images were taken. In Bajia Park, the actual ETs were measured in seven plots based on the principle of water balance to verify its accuracy.
where Rn is the instantaneous net radiation (Wm−2); G is the instantaneous soil heat fluxes (Wm−2); H is the instantaneous sensible heat exchange between air and land surface (Wm−2); λ is the latent heat of vaporization of water (Wm−2 mm−1), and Ains and A24 are the instantaneous and 24-h evaporative fractions. The algorithms of the above parameters are similar to those established by (Du et al., 2013).
Model evaluation criteria
Using satellite data and meteorological data, the coefficient of determination (R2), mean absolute relative error (MARE) and average relative error (
where
Evaluation of vegetation eco-water-saving ability
A comprehensive eco-water-saving ability index of vegetation (EWI) was proposed to evaluate vegetation cooling and water-saving abilities of different vegetation structures. EWI can be defined as:
Where EWIi is the comprehensive eco-water-saving ability index value of the ith vegetation structure, and it is dimensionless value greater than 0; Ti is the land temperature of the ith vegetation structure, °C;
Result
Surface temperature of the study area
The results showed that temperature between different land use types in the growing season varies (Figure 2). The Ts of the road was the highest, followed by those of the residential area, low vegetation quantity area, high vegetation quantity area, and urban water body, respectively. Compared with other land use types, the temperatures of the urban water body and high vegetation quantity area are 9–18 degrees lower. This indicates that vegetation can help to relieve the urban heat island effect, and vegetation index appears to be an indicator of environmental temperature (Gallo et al., 1993).
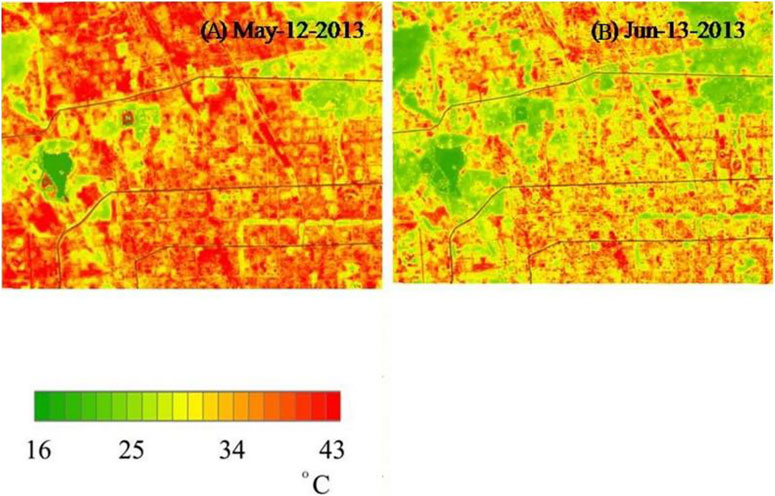
FIGURE 2. Dynamics of Ts patterns in the study area in (A) May and (B) June 2013 based on the surface energy balance method using Landsat-8 satellite data. Each date had different ranges.
Evapotranspiration of study area
After an evaluation of the ET results calculated using the SEBAL model and that measured based on the water balance principle of four sample plots on May-12-2013, June-13-2013, and Sep-1-2013, a linear relationship was observed between the calculated ET and measured ET; R2 was 0.445, MARE was 0.16, and (
The distribution of ET on May-12-2013 and June-13-2013 is shown in Figure 3; the highest ET was observed in water bodies such as the Kunming Lake, Fuhai, Jing-Mi water diversion canal, and Olympic lake (7.2 ± 1.6 mm). The second highest ET value was observed in places with greater vegetation coverage. For instance, the Olympic Forest Park, the summer Palace, and Dongsheng country parks were in the area bounded by the dotted line (4.3 ± 2.1 mm). The third-highest ET regions were the residential areas and greenbelts along the city roads with lower vegetation coverage (3.3 ± 1.7 mm). Dense human settlements and commercial districts had the lowest ET value which shows that vegetation played a significant role in the water consumption of the soil-plant-atmosphere system. In different months, ET in June is lower than that in May, because May is the dry season, with less rainfall and less air humidity, while June is the rainy season, with more rainfall and higher air humidity, resulting in smaller ET.
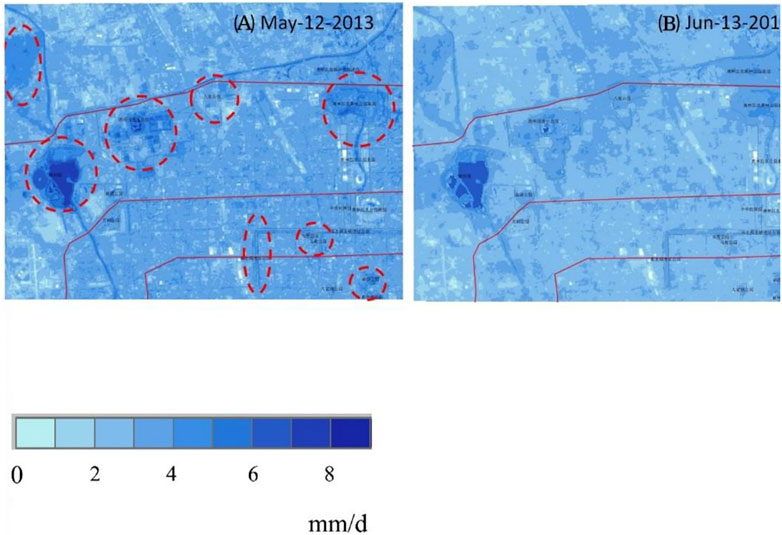
FIGURE 3. Dynamics of evapotranspiration patterns in the study area during (A) May and (B) June, 2013 based on surface energy balance method using Landsat-8 satellite data. Each date had different ranges.
Vegetation quantity of study area
Based on an evaluation of VQ results calculated using the NDVI and actual VQ observation of 12 sample plots on May-12-2013, June-13-2013, and Sep-1-2013, a linear relationship was detected between the calculated VQ and observed VQ; R2 was 0.66, MARE was 0.21, and (
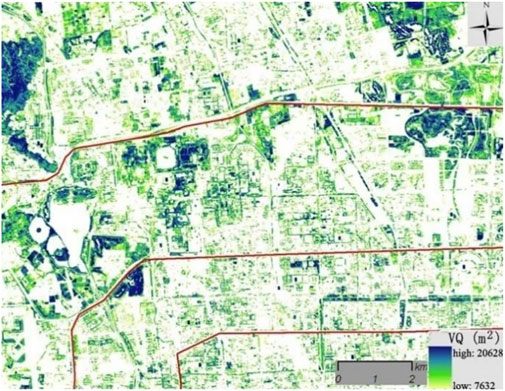
FIGURE 4. Distribution of vegetation quality per pixel; the area of a single pixel is 900 m2.
Relationships between surface temperature, evapotranspiration, and LAI
The mean Ts, ET, and LAI of 50 sample plots were presented in a scatter plot (Figure 5). A negative correlation was observed between mean Ts and mean LAI; an increase in mean LAI by 1, can reduce Ts by 0.62-degree centigrade. However, a positive correlation was observed between mean ET and mean LAI; an increase in mean LAI increase by 1 mm/d can increase mean ET by 0.073 mm/d.
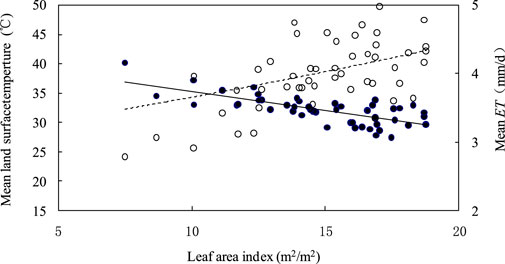
FIGURE 5. Relationships between mean Ts, mean ET and mean LAI. Regression line for mean ET and mean LAI can be expressed as: ET = 3e0.019LAI, R2 = 0.127; p < 0.01 (unfilled circles, unbroken line). Regression line for mean Ts and mean LAI can be expressed as: ET = −0.62LAI + 41.42, R2 = 0.49; p < 0.01 (filled circles, broken line).
To analyze the effect of species, the mean ET of sample plots were expressed as ET per LAI (ET/LAI), and the relationship between mean Ts and ET/LAI was determined as Figure 6. There were 11 species (indicated by the points in a solid line ellipse) with a mean Ts < 30°C. Their corresponding serial numbers are 8, 9, 10, 16, 22, 23, 24, 25, 29, 45, and 48 (Table 1), respectively, accounting for 22% of the total. Eleven species (indicated by points in a dashed ellipse) had ET/LAI < 0.23 mm/d, accounting for 22% of the total. Their corresponding serial numbers are 1, 2, 11, 12, 13, 16, 32, 39, 40, 44, and 47, respectively (Table 1).
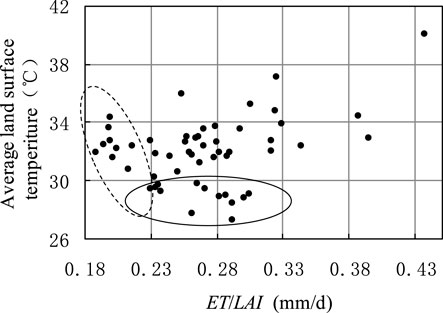
FIGURE 6. Relationships between Ts and ET/LAI.
As shown in Table 2, the EWIs of species or species compositions in 50 sample plots were divided into three categories based on the natural breakpoint method by their EWI value: Good (EWI ≥ 0.795), Common (0.795 > EWI ≥ 0.419) and Weak (EWI < 0.419). Each category included 5–29 species or species compositions. The species or species compositions were classified as Good, it means that the species or species need less water for per unit LAI.
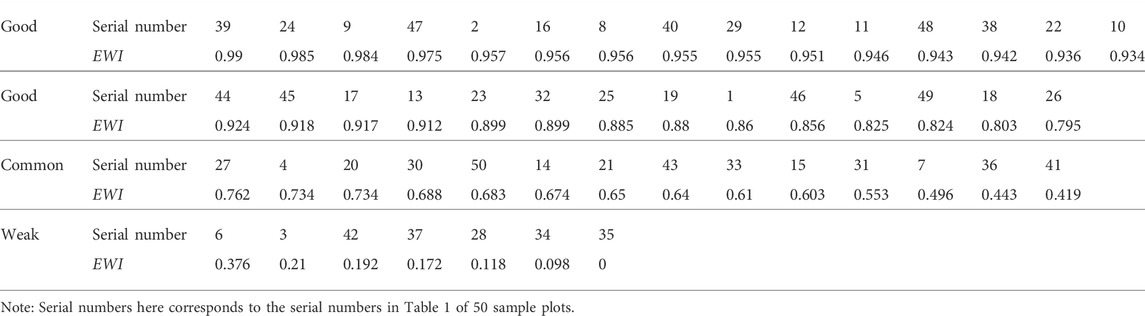
TABLE 2. EWI of species or species compositions of 50 example plots.
Discussion
Two characters of vegetation structures with lower Ts can be found: 1) those with higher arbor density, 2) warm-season turf grasses. This because the arbor has higher vegetation quantity and more water is used in cooling air by transpiration compared to that used by shrubs and herbs. Furthermore, the evapotranspiration of warm-season grasses is higher than that of cool-season grasses (Aronson et al., 1987; Xiao et al., 2006). The vegetation structures with lower ET can be summarized as 1) thin native trees with greater species composition, such as Sophora japonica and Pinus tabuliformis, 2) cool-season turf grasses. Since the average water consumption of native vegetation is lower than that of extrinsic vegetation in arid areas, it is difficult to have optimal cooling and water-saving abilities for green spaces. However, because of water shortages, green space managers in Semi-humid areas have to compromise with ecological benefit for less irrigation. In that case, species or species compositions which can balance ecological benefit and water-saving for urban green space should be used.
In this study, 50 typical vegetation structures were divided into three categories according to EWI; the main difference can be found by a comparison of the different categories: the proportion of vegetation structures which include the arbor, shrub, and herb is 28% in the category with good comprehensive eco-water-saving ability; and the proportion is 21% and 29%, respectively, for the remaining two categories. In addition, the proportion of vegetation structures without shrub is 79% and 71% in the categories with common and weak eco-water-saving ability, respectively, and these are significantly higher than that of the category Good. It is indicated that, generally, the arbor-shrub-herb mix and complete coverage by shrubs gave vegetation structures a better comprehensive eco-water-saving ability. This ability can be explained by the features of their vegetation structures such as great heat capacity and high reflectivity, and relatively low water consumption (Zhou et al., 2005; Song et al., 2007).
Conclusion
Urban ecological environment and water resources are key issues of concern. In this study, RS inversion methods were utilized to calculate the land temperature, evapotranspiration and vegetation quantity of 50 typical green space vegetation structures. According to verification tests, the accuracy of calculation is acceptable. The relationships between Ts, VQ, and ET of green land were determined with regression analysis. An eco-water-saving abilities index (EWI) was proposed to evaluate different green space structures. Fifty species or species compositions were classified into good (EWI ≥ 0.795), common (0.795 > EWI ≥ 0.419) and weak (EWI < 0.419) categories, respectively, based on the assessment results. The characteristics of 17 species or species compositions with good cooling and water-saving abilities were summarized as 1) a mix of arbor, shrub and herb, 2) complete coverage of green space by shrub. The method and eco-water-saving species or species composition can be utilized in developing possible models of urban green space management, and were of significance in improving the ecological carrying capacity of the Semi-humid Region.
Data availability statement
The original contributions presented in the study are included in the article/supplementary material, further inquiries can be directed to the corresponding authors.
Author contributions
XL: Conceptualization, Methodology, Formal analysis, Writing—Original Draft, Writing—Review and Editing, Visualization. YL: Methodology, Formal analysis, Writing—Original Draft, Software, Visualization. SD: Resources, Data Curation, Writing—Review and Editing, Supervision, Project administration, Funding acquisition. YN: Conceptualization, Methodology, Writing—Review and Editing. CZ: Conceptualization, Methodology, Visualization.
Funding
This study was financially supported by the Natural Science Foundation of Shandong Province (Grant No. ZR2016DB12).
Acknowledgments
The insightful comments by editors and reviewers are greatly acknowledged. These comments helped us improve our original manuscript greatly.
Conflict of interest
The authors declare that the research was conducted in the absence of any commercial or financial relationships that could be construed as a potential conflict of interest.
Publisher’s note
All claims expressed in this article are solely those of the authors and do not necessarily represent those of their affiliated organizations, or those of the publisher, the editors and the reviewers. Any product that may be evaluated in this article, or claim that may be made by its manufacturer, is not guaranteed or endorsed by the publisher.
References
Aronson, L. J., Gold, A. J., Hull, R. J., and Cisar, J. L. (1987). Evapotranspiration of cool‐season turfgrasses in the humid northeast 1. Agron. J. 79, 901–905. doi:10.2134/agronj1987.00021962007900050029x
Bastiaanssen, W. G. M., Menenti, M., Feddes, R. A., and Holtslag, A. A. M. (1998). A remote sensing surface energy balance algorithm for land (SEBAL). 1. Formulation. J. Hydrol. X. 212, 198–212. doi:10.1016/s0022-1694(98)00253-4
Bastiaanssen, W. G. M., Pelgrum, H., Wang, J., Ma, Y., Wal, T. V. D., Roerink, G., et al. (1998). A remote sensing surface energy balance algorithm for land (SEBAL). J. Hydrol. X. 212-213, 213–229. doi:10.1016/s0022-1694(98)00254-6
Becker, F. (1987). The impact of spectral emissivity on the measurement of land surface temperature from a satellite. Int. J. Remote Sens. 8, 1509–1522. doi:10.1080/01431168708954793
Beijing Municipal Bureau of Statistics (2019). Beijing statistical yearbook. Available at: http://www.bjstats.gov.cn/tjnj (accessed June, 26)
Brutsaert, W., and Sugita, M. (1992). Application of self-preservation in the diurnal evolution of the surface energy budget to determine daily evaporation. J. Geophys. Res. 97, 18377–18382. doi:10.1029/92jd00255
Cai, X. (2008). Water stress, water transfer and social equity in northern China—implications for policy reforms. J. Environ. Manage. 87, 14–25. doi:10.1016/j.jenvman.2006.12.046
Cheng, X., Huang, M., Shao, M., and Warrington, D. N. (2009). A comparison of fine root distribution and water consumption of mature Caragana korshinkii Kom grown in two soils in a semiarid region, China. Plant Soil 315, 149–161. doi:10.1007/s11104-008-9739-5
Crago, R. D. (1996). Conservation and variability of the evaporative fraction during the daytime. J. Hydrol. X. 180, 173–194. doi:10.1016/0022-1694(95)02903-6
Dash, P., Göttsche, F. M., Olesen, F. S., and Fischer, H. (2002). Land surface temperature and emissivity estimation from passive sensor data: Theory and practice-current trends. Int. J. Remote Sens. 23, 2563–2594. doi:10.1080/01431160110115041
Di, S. C., Wu, W. Y., Liu, H. L., and Pan, X. Y. (2012). Water consumption estimation and evapotranspiration inversion based on remote sensing technology. Trans. Chin. Soc. Agric. Eng. 28, 98–104.
Du, J., Song, K., Wang, Z., Zhang, B., and Liu, D. (2013). Evapotranspiration estimation based on MODIS products and surface energy balance algorithms for land (SEBAL) model in Sanjiang Plain, Northeast China. Chin. Geogr. Sci. 23, 73–91. doi:10.1007/s11769-013-0587-8
Gallo, K. P., Mcnab, A. L., Karl, T. R., Brown, J. F., Hood, J. J., and Tarpley, J. D. (1993). The use of a vegetation index for assessment of the urban heat island effect. Int. J. Remote Sens. 14, 2223–2230. doi:10.1080/01431169308954031
Granger, R. J., and Gray, D. M. (1989). Evaporation from natural nonsaturated surfaces. J. Hydrol. X. 111, 21–29. doi:10.1016/0022-1694(89)90249-7
Hobbins, M. T., Ramírez, J. A., and Brown, T. C. (1999). The complementary relationship in regional evapotranspiration: The CRAE model and the advection-aridity approach. Proc. Ninet. Annu. A. G. U. Hydrol. Days, 199–212.
Idso, S. B., Jackson, R. D., and Reginato, R. J. (1975). Estimating evaporation: A technique adaptable to remote sensing. Science 189, 991–992. doi:10.1126/science.189.4207.991
Jackson, R. D., Reginato, R. J., and Idso, S. B. (1977). Wheat canopy temperature: A practical tool for evaluating water requirements. Water Resour. Res. 13, 651–656. doi:10.1029/wr013i003p00651
Jiménez Muñoz, J. C., and Sobrino, J. A. (2003). A generalized single‐channel method for retrieving land surface temperature from remote sensing data. J. Geophys. Res. 108 (D22), 2003JD003480. doi:10.1029/2003jd003480
Katherine, N. I., Richard, A. F., Patrick, D. W., Jamie, T., Sarah, R. P., Philip, H. W., et al. (2010). Ecological and psychological value of urban green space. Dimensions Sustain. City Future City 2, 215–237.
Katri, O., Aigars, I., Iveta, V. K., Malle, M., Tatjana, K., Jaan, K., et al. (2011). Changes in the canopies of Pinus sylvestris and Picea abies under alkaline dust impact in the industrial region of Northeast Estonia. For. Ecol. Manage. 262, 82–87. doi:10.1016/j.foreco.2010.07.031
Kong, F., Nakagoshi, N., Yin, H., and Kikuchi, A. (2005). Spatial gradient analysis of urban green spaces combined with landscape metrics in Jinan City of China. Chin. Geogr. Sci. 15, 254–261. doi:10.1007/s11769-005-0038-2
Li, Z. Z., Li, G. H., Zhao, B. X., Lai, N. N., and Jing, L. J. (2009). Water consumption of green space and gardens in the Summer Palace of Beijing. J. Beijing For. Univ. 31, 66–72.
Liu, C. S., Gao, Z. Q., and Gao, W. (2007). Retrieval evapotranspiration and land surface temperature in response to land use/cover change based on remote sensing data. Trans. Chin. Soc. Agric. Eng. 23, 1–8.
Liu, L., Guan, D., Peart, M. R., Wang, G., Zhang, H., and Li, Z. (2013). The dust retention capacities of urban vegetation—A case study of guangzhou, south China. Environ. Sci. Pollut. Res. 20, 6601–6610. doi:10.1007/s11356-013-1648-3
Masoud, E., Sayyed, A. K., Ali, A. M., and Ali, B. (2007). Water consumption of a six-year-old river red gum plantation in the Southern Zagros Mountains, Iran. J. Mt. Sci. 4, 136–145. doi:10.1007/s11629-007-0136-y
Mohammad, T. D., and Samaneh, P. (2012). Evaluation of water balance in a mountainous upland catchment using SEBAL approach. Water Resour. manage. 26, 2069–2080. doi:10.1007/s11269-012-9999-y
Perino, G., Andrews, B., Kontoleon, A., and Bateman, I. (2014). The value of urban green space in britain: A methodological framework for spatially referenced benefit transfer. Environ. Resour. Econ. (Dordr). 57, 251–272. doi:10.1007/s10640-013-9665-8
Qin, Z., Karnieli, A., and Berliner, P. (2010). A mono-window algorithm for retrieving land surface temperature from Landsat TM data and its application to the Israel-Egypt border region. Int. J. Remote Sens. 22, 3719–3746. doi:10.1080/01431160010006971
Roerink, G. J., Su, Z., and Menenti, M. (2000). S-SEBI: A simple remote sensing algorithm to estimate the surface energy balance. Phys. Chem. Earth Part B Hydrology Oceans Atmos. 25, 147–157. doi:10.1016/s1464-1909(99)00128-8
Shuttleworth, W. J., Gurney, R. J., Hsu, A. Y., and Ormsby, J. P. (1989). The variation in energy partitioning at surface flux sites, remote sensing and large scale global processes. Wallingford, UK: IAHS.
Song, Y. T., Yu, S. X., and Li, N. (2007). Spatial structure of the surface temperature in Shenzhen. Acta Ecol. Sin. 27, 1489–1498.
Su, Z. (2002). The Surface Energy Balance System (SEBS) for estimation of turbulent heat fluxes. Hydrol. Earth Syst. Sci. 6, 85–100. doi:10.5194/hess-6-85-2002
The National Afforestation Committee (2019). China greening bulletin. Available at: http://www.forestry.gov.cn//portal/main/s/195/content -531395.html (accessed July, 12).
Tohru, M., Keitaro, I., Daisuke, H., Dai, I., Takashi, U., and Shuji, I. (2011). Landscape ecology in asian cultures. Japan: Springer.
World Resources Institute (2005). Millennium ecosystem Assessment: Ecosystems and human well-being: Biodiversity synthesis. Washington DC: IslandPress.
Xiao, J., Sun, X. H., and Li, G. Y. (2006). The water consumption regularity and irrigation system of Turfgrass under the condition of spray irrigation. Sci-Tech Inf. Dev. Econ., 152–153.
Yan, M., Yamanaka, N., Yamamoto, F., and Du, S. (2010). Responses of leaf gas exchange, water relations, and water consumption in seedlings of four semiarid tree species to soil drying. Acta Physiol. Plant. 32, 183–189. doi:10.1007/s11738-009-0397-x
Yen, T., and Lee, J. (2011). Comparing aboveground carbon sequestration between moso bamboo (Phyllostachys heterocycla) and China fir (Cunninghamia lanceolata) forests based on the allometric model. For. Ecol. Manage. 261, 995–1002. doi:10.1016/j.foreco.2010.12.015
Zhao, K. L., Fu, W. J., Jiang, P. K., and Zhou, G. M. (2013). Functions of natural organic matter in changing environment. Zhejiang (China): Zhejiang University Press.
Zhao, W., Niu, Z., Chang, X., and Li, S. (2010). Water consumption in artificial desert oasis based on net primary productivity. Sci. China Earth Sci. 53, 1358–1364. doi:10.1007/s11430-010-4028-6
Keywords: urban green space, vegetation structure, remote sensing inversion, heat island effect, water-saving
Citation: Li X, Li Y, Di S, Niu Y and Zhang C (2022) Evapotranspiration and land surface temperature of typical urban green spaces in a semi-humid region: Implications for green management. Front. Environ. Sci. 10:977084. doi: 10.3389/fenvs.2022.977084
Received: 24 June 2022; Accepted: 28 July 2022;
Published: 24 August 2022.
Edited by:
Jifeng Deng, Shenyang Agricultural University, ChinaReviewed by:
Jing Qin, China Institute of Water Resources and Hydropower Research, ChinaWenyi Dong, Chinese Academy of Agricultural Sciences (CAAS), China
Copyright © 2022 Li, Li, Di, Niu and Zhang. This is an open-access article distributed under the terms of the Creative Commons Attribution License (CC BY). The use, distribution or reproduction in other forums is permitted, provided the original author(s) and the copyright owner(s) are credited and that the original publication in this journal is cited, in accordance with accepted academic practice. No use, distribution or reproduction is permitted which does not comply with these terms.
*Correspondence: Yong Niu, bml1eW9uZzE5ODhAMTI2LmNvbQ==; Chuanjie Zhang, WmhhbmdjaHVhbmppZTE5ODNAMTI2LmNvbQ==
†These authors have contributed equally to this work and share first authorship