 Xiaowei Wang
 Hui Cheng
95% of researchers rate our articles as excellent or good
Learn more about the work of our research integrity team to safeguard the quality of each article we publish.
Find out more
ORIGINAL RESEARCH article
Front. Environ. Sci. , 29 September 2022
Sec. Land Use Dynamics
Volume 10 - 2022 | https://doi.org/10.3389/fenvs.2022.974812
This article is part of the Research Topic Land Governance, Integrated Socio-Ecosystem and Sustainable Development View all 33 articles
The lower reaches of the Yellow River are China’s grain production base and ecological barrier. Its total grain production ranks third in China in 2021, and its cultivated land plays an extremely important role in ensuring food security in the Yellow River Basin and even the whole country. Based on the data of GlobeLand30 in 2000, 2010 and 2020, this study studied the spatial distribution of cultivated land use and the cultivated land transfer pattern, the spatial distribution concentration degree and directional distribution characteristics of cultivated land and grain production, and the sensitivity analysis of grain production to the change of cultivated land area in the lower reaches of the Yellow River by using the methods of land cover transfer matrix, spatial distribution concentration model, sensitivity analysis model, standard deviation ellipse model and spatial autocorrelation analysis. The results show that: 1) The land type with the largest area transferred from cultivated land in the lower Yellow River is artificial surface, and its regional distribution is scattered; At the same time, the land type with the largest area transferred into cultivated land is still artificial surface, which is directly related to the rural land remediation measures implemented by the government. 2) During the period from 2000 to 2020, the spatial distribution concentration index (HHI) grade of cultivated land in the lower reaches of the Yellow River was moderately concentrated and below, and there was no obvious concentration trend; the concentration degree of grain production distribution in the lower reaches of the Yellow River is higher than that of cultivated land, such as Rizhao, Dongying, Qingdao and Weihai, where the HHI grades of grain production are higher; The center of gravity of cultivated land in the lower reaches of the Yellow River is relatively stable, while the center of gravity of grain production shows an obvious trend of “westward shift”. 3) During 2000–2010, the grain productions of 68.38% of districts and counties were insensitive to the change of cultivated land, while the grain productions of 18 districts and counties were highly sensitive to the change of cultivated land, mostly distributed in the hilly and mountainous areas of central and southern Shandong; During 2010–2020, the proportion of insensitive districts and counties decreased to 36%, and the middle and high sensitive areas obviously showed a gradual decreasing trend. Based on GlobeLand30 remote sensing image technology, this study can effectively reveal the temporal and spatial dynamic changes of cultivated land use and grain production in the lower reaches of the Yellow River, and provide scientific reference for further rational development and utilization of cultivated land resources in the lower reaches of the Yellow River and promoting the high-quality development of the Yellow River Basin.
Cultivated land is the scarcest production resource in China, and it is the irreplaceable material basis and bearing condition to ensure national food security. Rural areas are the birthplace of farming civilization and the strategic highland to ensure food security. Rural spatial governance is particularly important for the implementation of rural revitalization strategy (Wang et al., 2020). In 2020, the Chinese government issued the “Opinions on Preventing Cultivated Land from Being Non-grain” and Stabilizing Grain Production ", and in November 2021, it issued the” Notice on Strict Control of Cultivated Land Use ", which stipulated that the “balance of entry and exit” of cultivated land into other agricultural land can be implemented across administrative regions. The optimization of spatial allocation of non-grain cultivated land and the fairness, benefit and efficiency of “balance between entry and exit” of cultivated land utilization are all important issues worthy of attention. Many scholars’ researches on cultivated land use mainly focus on economic compensation effect of cultivated land protection (Niu and Xiao, 2019), evaluation of cultivated land productivity (Zhao et al., 2019), quality management of cultivated land (Guo et al., 2019), fallow scale of cultivated land (Tan et al., 2020), ecological efficiency of cultivated land use (Liu et al., 2022a), distribution of soil elements of cultivated land (Liu et al., 2022b), emissions of CO2, N2O and CH4 from cultivated land (Berglund et al., 2021), identification of cultivated land change using time-series Landsat images (Li et al., 2021) and elastic space of cultivated land protection (Liang et al., 2022). The exploration of cultivated land security is more inclined to think about food security. “Barn is full, and the world is stable”, China is a populous country, and ensuring national food security is related to the long-term stability of the country and the rice bowl on which everyone depends. The research on food security is mainly manifested in the change of food output (Xu et al., 2012), the distribution of food production (Liu et al., 2019), the evaluation of food production system (Ge et al., 2021; Zhuo et al., 2022) and so on.
Farmland management requires significant spatial analysis. It is of practical significance to adjust agricultural production structure, promote agricultural modernization, improve agricultural production capacity and ensure food security. For a long time, drought, little rain, ecological destruction and frequent natural disasters in the Yellow River Basin have always plagued the sustainable development of social economy in the areas along the Yellow River. Based on the national major development strategic background of ecological protection and high-quality development in the Yellow River Basin, how to scientifically and reasonably solve the problems of cultivated land utilization and grain production in the lower reaches of the Yellow River Basin is a realistic problem that the society generally pays attention to and needs to solve urgently. Looking at the related research on the Yellow River Basin at home and abroad, the research areas are mainly concentrated in Ningxia (Wen et al., 2018), Shanxi (Liu and Ma, 2003), Henan (Zhang et al., 2017), Yellow River Delta (Li et al., 2019), Shaanxi (Zhang et al., 2020; Wei et al., 2021), and the research fields are mainly concentrated in cultivated land quality protection (Wang and Guo, 2020), cultivated land reconstruction in historical period (Guo et al., 2021), cultivated land temporal and spatial change (Han et al., 2021), water-energy-grain coupling development (Xu et al., 2021), and so on. Based on this, with the help of GIS technology and GlobeLand30 data in 2000, 2010 and 2020, this paper studies the spatial pattern and temporal and spatial changes of cultivated land resources and grain production in the lower reaches of the Yellow River, in order to provide basis for scientific management decision-making of cultivated land use and food safety production in Shandong Province and even the Yellow River Basin, and provide reference for promoting high-quality development of the Yellow River Basin.
In view of the consistency and integrity of natural resources, geographical location, society, economy and policy in the study area, this study selects the complete administrative unit (16 prefecture-level cities in Shandong Province) in the lower reaches of the Yellow River as the study area, which can better match the socioeconomic data and increase the accuracy of the study. The grain production data of each prefecture-level city in the lower reaches of the Yellow River in 2000, 2010 and 2020 are derived from the socio-economic statistical yearbook of counties (cities) in China. The data of prefecture-level city administrative divisions in the lower Yellow River in vector format (ESRI shapefiles) comes from National Catalogue Service for geographic information (http://www.webmap.cn), and this data is re-projected to Albers Equal-area Conic Projection using ArcGIS 10.2.
The global land cover remote sensing data GLobeLand30 is the first set of global land cover data products in the world with a resolution of 30 m independently developed by China, and it is also the global land cover data with the highest resolution in the world at present. The Chinese government donated it to the United Nations for sharing by the international community in September 2014 (Chen, 2018). In this paper, the global land cover data GlobeLand30 in 2000, 2010 and 2020, is used as the data source of cultivated land information (http://www.globallandcover.cn). The data set defines cultivated land as “land for planting crops” (Chen et al., 2017). The classified images used in the development of GlobeLand30 data set are mainly 30-m multispectral images, including TM5, ETM + and OLI multispectral images of Landsat, HJ-1 multispectral images of China Environmental Disaster Reduction Satellite and GF-1 multispectral images (Yimuranjiang et al., 2021). GlobeLand30 data includes ten first-class types, which are: cultivated land, woodland, grassland, shrub land, wetland, water body, tundra, artificial surface, bare land, glacier and permanent snow (Yang et al., 2016). GlobeLand30 data is based on WGS-84 coordinate system. In this study, ArcGIS 10.2 software is used to re-project the data of the lower reaches of the Yellow River to Albers Equal-area Conic Project, as shown in Figure 1.
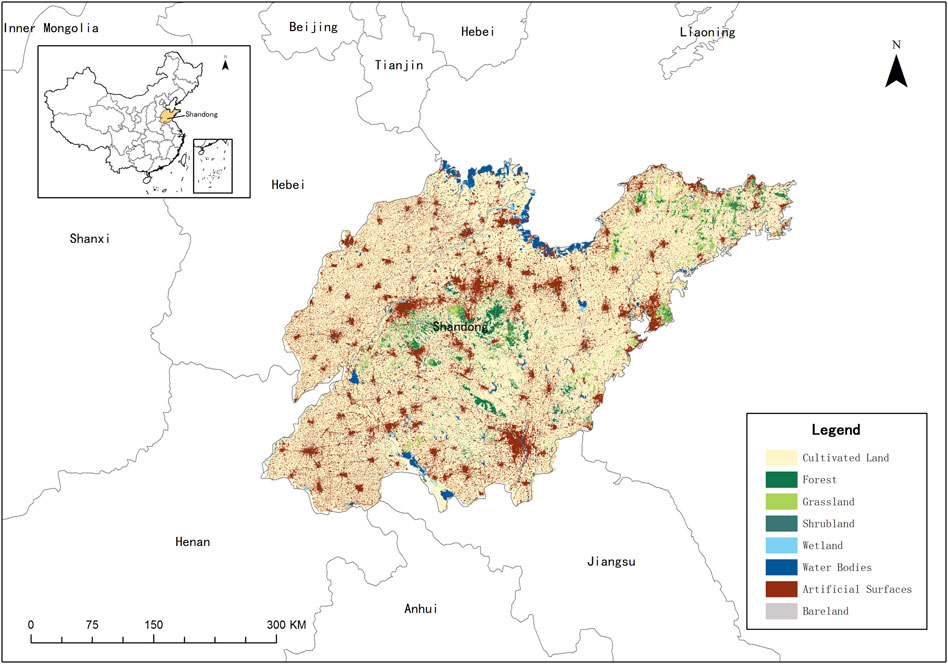
FIGURE 1. Research area.
In the study of land cover change, the basis of land use structure and change direction analysis is land cover transfer matrix, which plays an important role in the analysis of land use change. Land cover transfer matrix lists the transfer areas of various types of land use change according to the form of matrix, which can carefully reflect the mutual transformation relationship between various types of land use, so as to understand the structural characteristics of various types before and after transfer. The land cover transfer matrix reflects the dynamic process of mutual transformation between different areas at the beginning and end of a certain period of time in a certain region. The general form of the land cover transfer matrix is (Sun, 2020):
Where: S represents the land type area; n is the number of land use types before and after transfer; i, j (i, j = 1, 2, … , n) denote the land use types at the beginning and the end of the study period respectively; Sij represents the area where the initial land use type i is transferred to the final land use type j. Each row of elements in the matrix represents the flow direction information of the i land class before the transfer to the local class after the transfer, and each column of elements represents the source information of the area of the j land class after the transfer from the local class before the transfer.
Because all agricultural planting industries take cultivated land as their material resource base, the concentration degree of spatial distribution of cultivated land resources in a certain administrative region can reflect the concentration degree of regional spatial distribution of agricultural planting in that administrative region. This paper adopts the concentration index of spatial distribution of cultivated land constructed by Wang Jiayue (Wang and Xin, 2017):
Where: HHIi is the spatial distribution concentration index of cultivated land in the ith prefecture-level city. N is the total number of districts and counties in the ith prefecture-level city, Xij is the cultivated land area of the jth district and county in the ith city, and Xi is the total cultivated land area of the ith prefecture-level city. The range of HHIi is between 0 and 1, and the larger the value, the more concentrated the distribution of cultivated land resources in this prefecture-level city; the smaller the value, the more dispersed the distribution of cultivated land resources in this prefecture-level city. By the same token, the spatial distribution concentration index of grain production in each prefecture-level city can be calculated by using the grain production data of each district and county.
The influence of cultivated land area change on grain production determines the grain management policy in a region, so it is necessary to study the sensitivity of grain production to cultivated land change. The Intergovernmental Panel on Climate Change (IPCC) defines sensitivity as the ratio of grain production change rate to cultivated land area change rate in a certain period of time as the sensitivity of grain production to cultivated land change (IPCC, 2007). In this paper, the sensitivity index constructed by Liu Yansui (Liu et al., 2009) is adopted:
Where: β is the sensitivity index of grain production to cultivated land change in a prefecture-level city. Gt and Gt+1 are the grain production of the prefecture-level city in year t and year t+1 respectively, and Lt and Lt+1 are the cultivated land area of the prefecture-level city in year t and year t+1 respectively. When β < 0, it means that the direction of grain production change is opposite to the direction of cultivated land area change in the study period, and in this case, grain production is insensitive to cultivated land area change. When β is greater than 0, it means that the change direction of grain production is the same as that of cultivated land area in the study period. In this case, grain production is sensitive to the change of cultivated land area, and the larger the β value, the higher the sensitivity of grain production to the change of cultivated land area, that is, the small fluctuation of cultivated land area will lead to the larger change of grain production. In addition, HHIi and β can effectively solve the problem of integrating different spatial scales and data.
The standard deviation ellipse (SDE) is an important geospatial statistical method, which is mainly used to measure the concentration, dispersion and directional trend of geographical elements (He et al., 2016; Lv et al., 2016). It can accurately reveal the global characteristics of spatial distribution of research objects from multiple angles, and quantitatively interpret the information such as centrality, directionality and extended direction deviation (Zuo et al., 2022). In this study, the standard deviation ellipse model was used to explore the spatial evolution trend and development direction of cultivated land use in the lower reaches of the Yellow River from 2000 to 2020. The relevant calculation formula of standard deviation ellipse model is expressed as (Ren et al., 2016; Zuo et al., 2022):
Where:
Global spatial autocorrelation is used to measure the spatial distribution characteristics of a certain attribute value in a region, and to reflect the similarity degree of attribute values of adjacent or adjacent regional units in space. It is mainly measured by global Moran’s I exponent measure, and its calculation formula is as follows (Ren, 2014):
After the global Moran’s I exponent is calculated, the normalized statistic Z is usually used for statistical test to verify whether there is spatial autocorrelation. The larger the I value, the higher the spatial autocorrelation. Because the spatial autocorrelation change in a region may not be stable, in order to better reflect the spatial aggregation degree of a local region, it is necessary to introduce a local spatial autocorrelation statistic, that is, a local Moran’s I index, whose calculation formula is as follows (Zuo et al., 2022):
By processing and summarizing the data of GlobeLand30 in 2000, 2010 and 2020, the cultivated land resources data of 16 prefecture-level cities in the lower reaches of the Yellow River in Table 1 was obtained. It can be seen from the table that the cultivated land resources in the lower reaches of the Yellow River are unevenly distributed in 16 prefecture-level cities, among which Linyi, Weifang, Yantai and Heze are rich in cultivated land resources, while Rizhao, Zibo, Weihai and Zaozhuang rank lower in the lower reaches of the Yellow River. During the 20 years from 2000 to 2020, the area of cultivated land resources decreased obviously. The total amount decreased from 12,503,631 ha in 2000–11,135,228 ha in 2020, with a total decrease of 1,368,403 ha and an average annual decrease of 68,420 ha, with an average annual decrease of 0.55%.
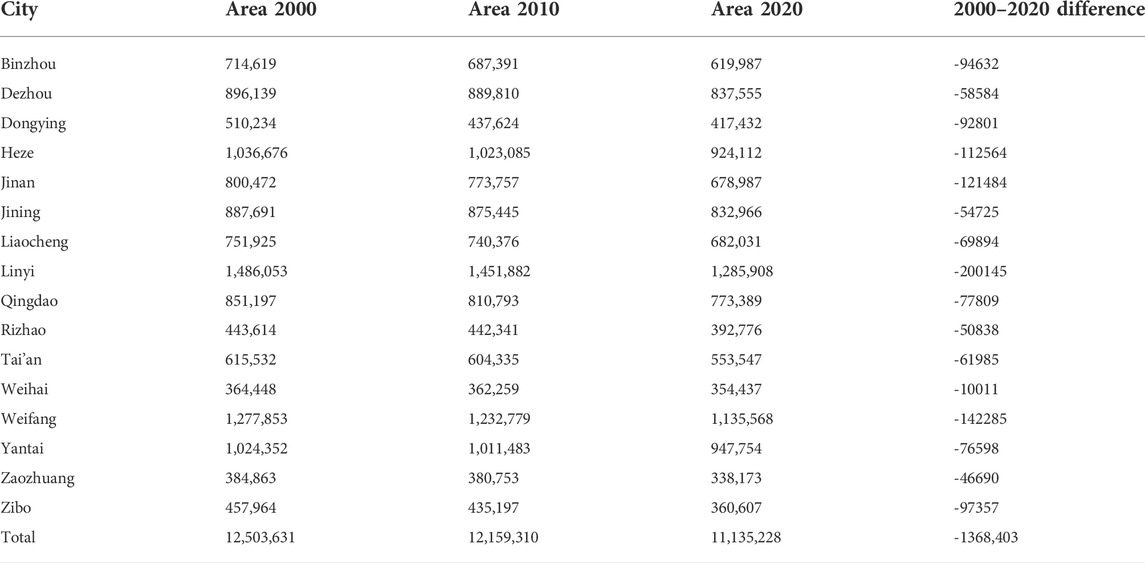
TABLE 1. Data of cultivated land resources during 2000–2020 (ha).
The ArcGIS software is used to calculate the data of GlobeLand30 in 2000, 2010 and 2020, and the transfer matrix of cultivated land resources in the lower reaches of the Yellow River is in Table 2. It can be seen that the cultivated land resources in the lower reaches of the Yellow River have different magnitudes of transfer in different periods, during 2000–2010, the area of cultivated land transferred out to artificial surface is as high as 497,510 ha. During 2010–2020, the area of cultivated land transferred out to artificial surface reaches 10,99,642 ha. In the meantime, from 2000 to 2010, the main type of land type with the largest area transferred into cultivated land is still artificial surface, and its transferred cultivated land area was 241,743 ha. From 2010 to 2020, more areas were transferred from artificial surface and water to cultivated land, which were 154559 and 129,290 ha respectively.
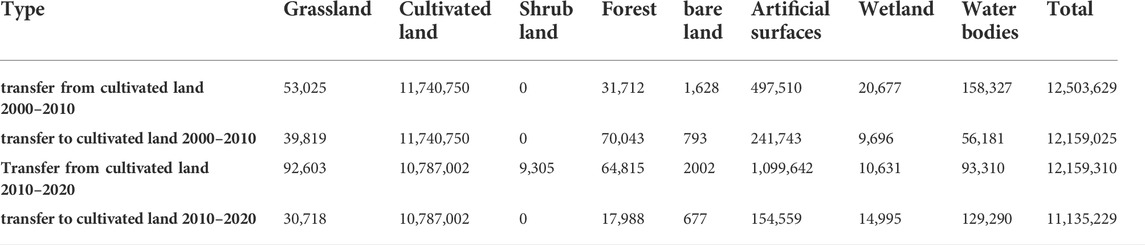
TABLE 2. Aggregate converted area of cultivated land resources during 2000–2020 (ha).
By processing and summarizing the grain production data in 2000, 2010 and 2020, the grain production and yield data of 16 prefecture-level cities in the lower reaches of the Yellow River were obtained in Table 3. It can be seen from the table that the distribution of grain production in 16 prefecture-level cities in the lower reaches of the Yellow River is very uneven, among which, Heze, Dezhou, Liaocheng, Jining, Weifang, Linyi have sufficient grain output, while Zibo, Dongying, Rizhao, Weihai rank lower in the lower reaches of the Yellow River. At the same time, the cities with higher grain yield are Dezhou, Heze, Liaocheng, Binzhou, Jining and Zaozhuang, while Rizhao, Weihai and Yantai have lower grain yield. From 2000 to 2010, the prefecture-level cities with obvious increase in grain production mainly include Dezhou, Heze, Liaocheng, Zaozhuang and Weifang, with an increase of more than 40%. On the contrary, the grain production of Dongying City decreased by 3.74%, and the cultivated land area of Dongying City decreased by 14.2% during this period, far exceeding the decrease of other prefecture-level cities. Under certain agricultural planting level and farmland management experience, the cultivated land area of Dongying City will inevitably lead to a decrease in grain production. During the 10 years from 2000 to 2010, Dongying, Heze and Binzhou were the prefecture-level cities with obvious increase in grain output, while Rizhao, Yantai, Weihai experienced a reduction of more than 30%, and the cultivated land area of these cities decreased by more than 10%, which led to the decrease of grain produciton in the current period. The sharp decrease in cultivated land area cannot make up for the decrease in grain prodcution even when the grain yield is generally increased.
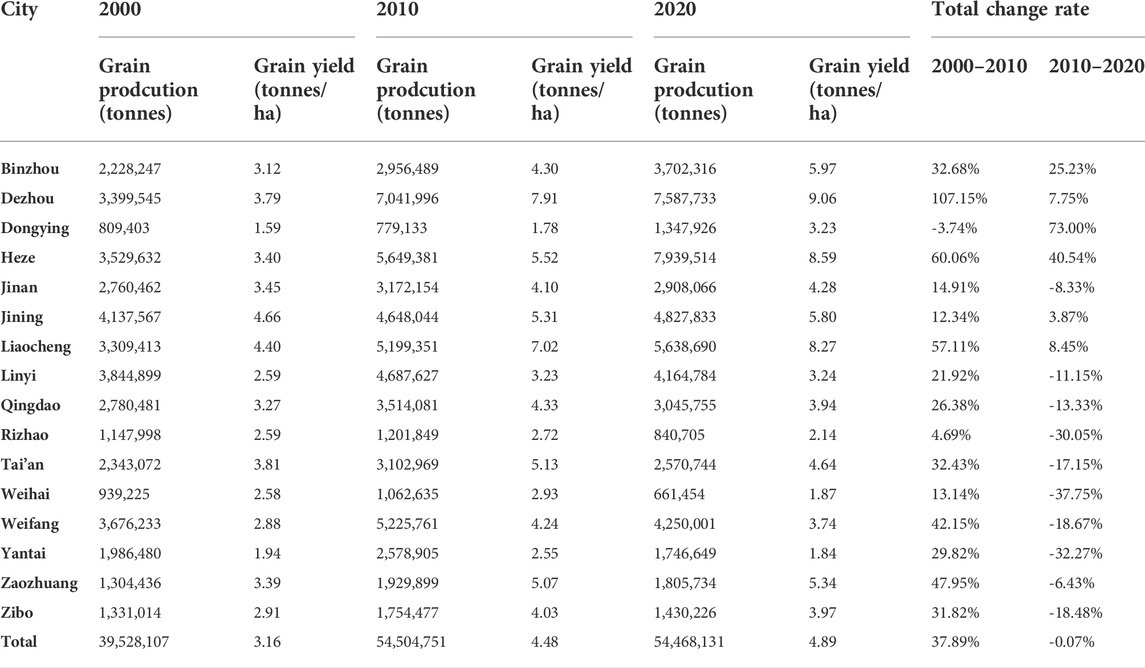
TABLE 3. Grain production and grain yield during 2000–2020 (ha).
According to the formula of cultivated land spatial distribution concentration index, the cultivated land spatial distribution concentration index in, as shown in Figure 2 Of each city in the lower reaches of the Yellow River from 2000 to 2020 was calculated, and the regional spatial distribution concentration degree of regional agricultural planting in the 20 years from 2000 to 2020 was revealed by this index. It can be seen that the spatial distribution concentration index of cultivated land in each prefecture-level city in the lower reaches of the Yellow River is between 0.1 and 0.3, and the change range between different years is very small, which shows that the spatial distribution of cultivated land in the lower reaches of the Yellow River is relatively scattered, the cultivated land resources in each prefecture-level city are relatively uniform, and the distribution pattern of cultivated land resources changes little.
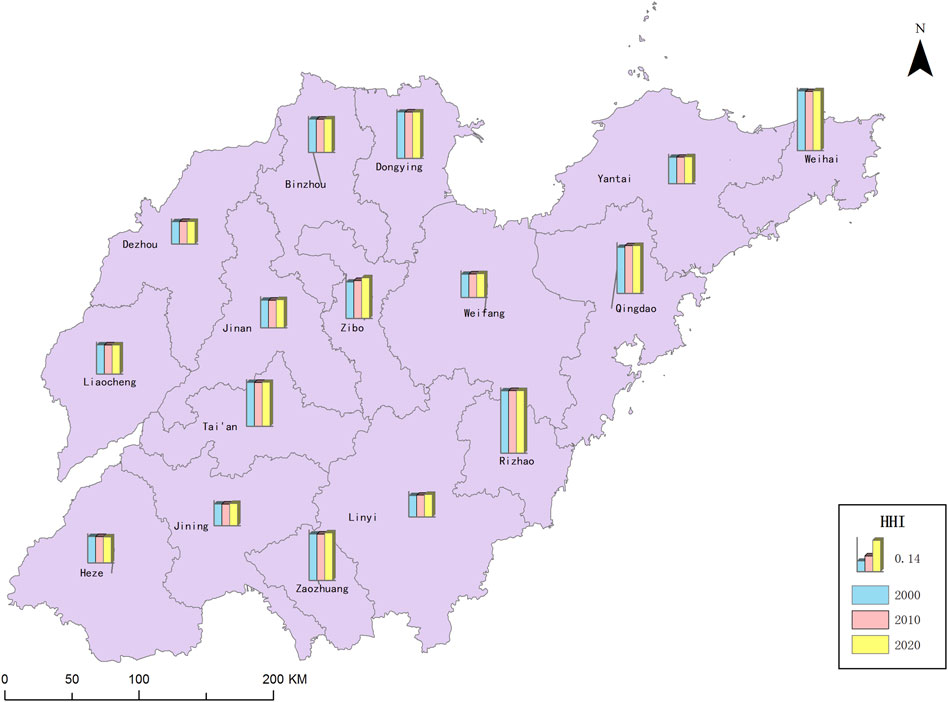
FIGURE 2. Spatial distribution concentration index of cultivated land.
According to the cultivated land data extracted from GlobeLand30 images in 2000, 2010 and 2020, the cultivated land sensitivity indexes of cities in the lower reaches of the Yellow River in 2000–2010 and 2010–2020 are calculated, as shown in Table 4. It can be seen that the cultivated land sensitivity index of all prefecture-level cities in the lower reaches of the Yellow River from 2000 to 2010 is negative except Dongying City, which indicates that the grain production of all prefecture-level cities in the lower reaches of the Yellow River is not sensitive to the change of cultivated land area in this period. During 2010–2020, the cultivated land sensitivity index of Weihai, Yantai, Qingdao, Rizhao, Weifang and Tai’an changed to positive, indicating that the grain production in these areas began to become sensitive to the change of cultivated land area.
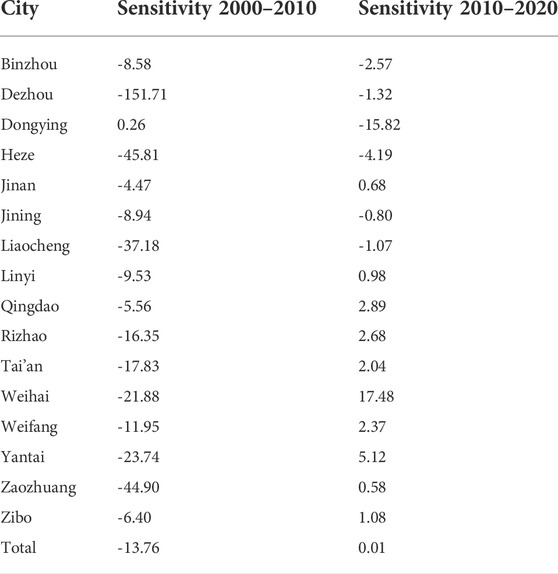
TABLE 4. Cultivated land sensitivity index during 2000–2020.
According to the cultivated land data extracted from GlobeLand30 images in 2000, 2010 and 2020, combined with the grain production data, the distribution of cultivated land center of gravity and grain production center of gravity in 16 prefecture-level cities in the lower reaches of the Yellow River was calculated, and the standard deviation ellipses of cultivated land use and grain production in three periods in the lower reaches of the Yellow River were calculated respectively, as shown in Table 5. In 2000, the coordinates of cultivated land barycenter in the lower reaches of the Yellow River were (1,148,233, 3,959,488). The barycentric coordinates of cultivated land in the lower reaches of the Yellow River in 2010 are (1,147,694, 3,958,393). In 2020, the coordinates of cultivated land barycenter in the lower reaches of the Yellow River were (1,149,001, 3,959,701). During the decade from 2000 to 2010, the cultivated land barycenter only shifted by 1,220 m. During the 10 years from 2010 to 2020, the center of gravity of cultivated land only shifted by 1854 m, and the displacement of the center of gravity of cultivated land use changed little in the past 20 years, and the center of gravity of cultivated land was located in Boshan District of Zibo City. The centers of standard deviation ellipse of cultivated land in the lower reaches of the Yellow River in 2000, 2010 and 2020 are completely consistent with the centers of gravity of cultivated land in corresponding years. The interior of an ellipse is the main area of cultivated land resources distribution in the lower reaches of the Yellow River. During the 20 years from 2000 to 2020, the main area of cultivated land utilization, the spatial distribution direction and spatial dispersion degree of cultivated land utilization have maintained good consistency, and the change range is very small.
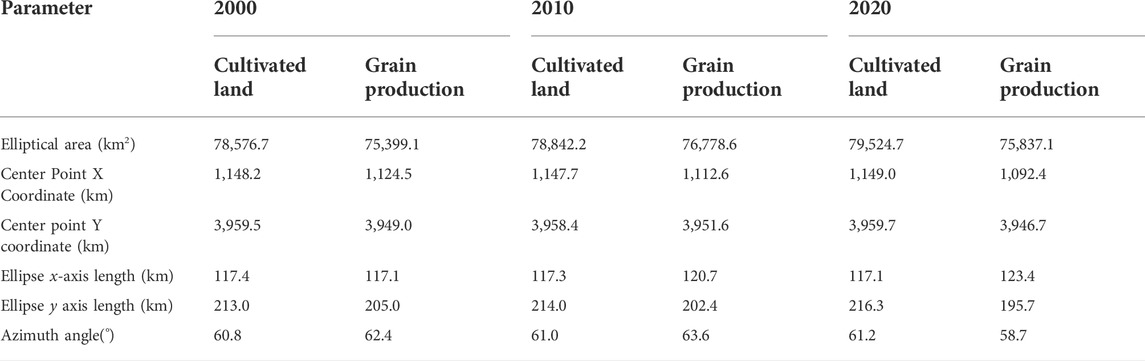
TABLE 5. Standard deviation ellipse model of cultivated land and grain production.
The barycentric coordinates of grain production in the lower reaches of the Yellow River were (1,124,516, 3,948,975) in 2000 (1,112,577, 3,951,556) in 2010 and (1,092,396, 3,946,694) in 2020. During the decade from 2000 to 2010, the barycentric coordinates of cultivated land shifted westward by 12,214 m. During the decade from 2010 to 2020, the center of gravity of grain production further shifted by 20,805 m to the southwest. In the past 20 years, the displacement of the center of gravity of grain production changed obviously, and the center of gravity of grain production shifted in Laiwu District of Jinan City all the time. The temporal and spatial migration of the center of gravity of grain production showed a slow moving trend to the west. The centers of standard deviation ellipse of grain production in the lower reaches of the Yellow River in 2000, 2010 and 2020 are completely consistent with the centers of gravity of grain production in corresponding years. The interior of an ellipse is the main area of grain production distribution in the lower reaches of the Yellow River. During the 20 years from 2000 to 2020, the spatial distribution area of the standard deviation ellipse of grain production shifted to the southwest as a whole, and its distribution direction also showed obvious deflection.
The spatial distribution of cultivated land transfer in the lower reaches of the Yellow River from 2000 to 2010 and from 2010 to 2020 is mapped respectively, as shown in Figure 3. It can be seen that during the period from 2000 to 2010, the cultivated land in the lower reaches of the Yellow River was transferred numerously to artificial surface, and the regional distribution of the transferred artificial surface in 16 prefecture-level cities was scattered, which was directly related to the rapid expansion of urban construction during this period, and the transfer of some cultivated land for urbanization. During 2000–2010, the second land type of cultivated land transferred out is water body, which is mainly distributed in the Yellow River Delta and Weishan Lake. During this period, with the construction of the Yellow River Delta National Eco-economic Demonstration Zone and the prominent role of Weishan Lake, the largest freshwater lake in the north, in the eastern route of the South-to-North Water Transfer Project, some cultivated land needs to be transformed and restored to important water resources. During 2010–2020, the area of cultivated land transferred to artificial surface in the lower reaches of the Yellow River has further increased, and the demand for urban construction land has further increased sharply. Only in 2017–2019, the urban expansion speed of Shandong Province was further accelerated, and the average annual growth rate of urban construction land area reached 12.29%[ (Zeng and Lin, 2022), (Zhang et al., 2022)]. Therefore, the type with the largest area among all land types transferred from is artificial surface, and the area of artificial surface transferred from cultivated land is as high as 1,099,642 ha. It can be seen from Figure 3B that with the rapid urbanization process, the concentrated areas of the artificial surface transferred from cultivated land in various cities are consistent with the spatial distribution of outward diffusion and construction of urban built-up areas in these cities.
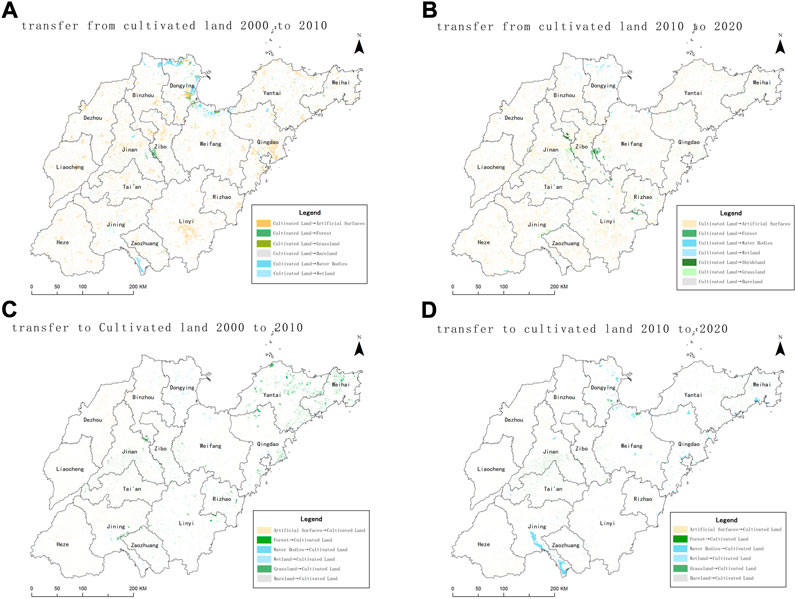
FIGURE 3. Temporal and spatial distribution of cultivated land transfer during 2000–2020. (A) transfer from cultivated land 2000 to 2010, (B) transfer from cultivated land 2010 to 2020, (C) transfer to cultivated land 2000 to 2010, (D) transfer to cultivated land 2010 to 2020.
From 2000 to 2010, the most land type transferred into cultivated land in the lower reaches of the Yellow River is artificial surface, with an area of 241,743 ha, followed by forest land transferred into 70,043 ha. As can be seen from Figure 3C, the spatial distribution area of artificial surface transferred into cultivated land is mainly the non-urban central areas of various cities, and the spatial distribution is very scattered, which is directly related to the rural land remediation implemented during this period. In the lower reaches of the Yellow River, through comprehensive treatment of rural fields, water, roads, forests and villages, idle homesteads and collective construction land are reclaimed into cultivated land, which obviously increases the number of cultivated land, improves the quality of cultivated land and improves the productivity of farmland. However, the situation of forest land turning into cultivated land is very obvious in Yantai and Weihai. Because Yantai and Weihai are dominated by low mountains and hills, forest land resources are abundant, and cultivated land occupies forest land. During the period of 2010–2020, the area of artificial surface converted into cultivated land in the lower reaches of the Yellow River still ranks first among all types, reaching 154,559 ha. With the promotion of “living together in villages” in many places in Shandong Province during this period, a large number of idle rural construction land has been reclaimed, increasing a large amount of cultivated land area. At the same time, integrated land can be operated on a large scale, which greatly promotes the development of agricultural industrialization.
According to the spatial distribution concentration index of cultivated land and grain production in the lower reaches of the Yellow River, the spatial distribution concentration patterns are divided into five grades, which are: HHI ≥0.3 is highly concentrated distribution, 0.2 ≤ HHI <0.3 is moderately concentrated distribution, 0.1 ≤ HHI <0.2 is low concentrated distribution, and HHI <0.1 is uniform distribution. It can be seen from Figure 4 that during the period from 2000 to 2020, the concentration degree of grain production distribution in the lower reaches of the Yellow River is generally higher than the spatial distribution concentration degree of cultivated land. The HHI grades of cultivated land in each year are moderately concentrated and below, among which the HHI grades of Qingdao, Zaozhuang, Dongying, Tai’an, Weihai and Rizhao are moderately concentrated. In 2020, 51.1% of cultivated land in Qingdao is located in Pingdu City and Huangdao District; 56.4% of cultivated land in Zaozhuang City is located in Tengzhou City and Shanting District; 46.2% of cultivated land in Dongying City is located in Kenli County and Hekou District. 47.4% of cultivated land in Tai’an city is located in Xintai city and Daiyue district; 61.4% of cultivated land in Weihai is located in Rushan City and Wendeng District; 66.3% of cultivated land in Rizhao City is located in Juxian County and Wulian County. The HHI grade of cultivated land in other cities is low concentrated distribution, among which, the HHI value of cultivated land in Dezhou, Linyi and Jining is 1.0, and the HHI grade is uniform distribution, which shows that the cultivated land in these cities is scattered and uniform in the city range. The average value of HHI of cultivated land in three periods in the lower reaches of the Yellow River is 0.16, and its spatial distribution concentration degree is low, showing no obvious concentration trend, which shows that cultivated land is not concentrated in some cities in this region, and the distribution of cultivated land resources in the whole region is relatively uniform and reasonable.
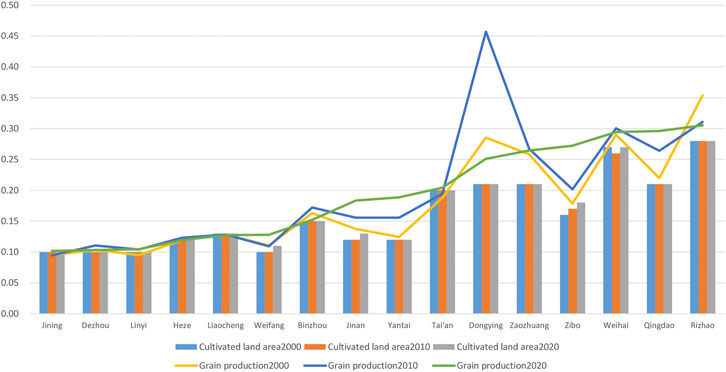
FIGURE 4. Spatial distribution concentration of cultivated land and grain production.
During the period from 2000 to 2020, the concentration level of grain production distribution in the lower reaches of the Yellow River is not completely consistent with the concentration level of cultivated land. For example, the HHI grade of grain production in Rizhao, Dongying, Qingdao and Weihai is relatively high, and the HHI grade of grain production in Rizhao is highly concentrated Within three periods. The HHI of grain production in Dongying in 2010 is as high as 0.46, and the HHI value of grain production in Qingdao has been continuously improved until it reaches 0.30 in 2020. The average HHI of grain production in Weihai in three periods also approached 0.3. According to the grain production data of these cities in 2020, 44.1% of Rizhao City’s grain production is produced in Juxian County, 60.7% of Dongying City’s grain production is produced in Guangrao County and Lijin County, 47.1% of Qingdao City’s grain production is produced in Pingdu City, and 62.0% of Weihai City’s grain production is produced in Wendeng District and Rushan City, so the grain distribution in these cities is relatively concentrated. The HHI grade of grain production in Zibo and Zaozhuang is moderately concentrated distribution, while the HHI grade of grain production in other cities is low concentrated distribution. The average HHI of grain production in Jining, Linyi and Dezhou is 0.10, 0.10 and 0.11 respectively, which are almost close to the state of uniform distribution. From the internal composition of grain production in these prefecture-level cities, it can be seen that grain production is not concentrated in a few districts and counties, but relatively evenly distributed in each district and county of the prefecture-level city. The average value of HHI of total grain production in three periods in the lower reaches of the Yellow River is 0.19, which is slightly higher than the average value of HHI of cultivated land in the whole region. The spatial distribution concentration of grain production tends from low to medium concentration, which shows that grain production in the lower reaches of the Yellow River is not very evenly distributed, and there are still great differences in grain production among different cities.
As shown in Figure 5, during the period from 2000 to 2020, the spatial movement trend of cultivated land center of gravity and grain production center of gravity in the lower reaches of the Yellow River showed completely different characteristics. The center of gravity of cultivated land only shifted by 796 m to the east, and the position of cultivated land center of gravity was relatively stable. However, the center of gravity of grain production moved westward by 32,203 m, and the center of gravity of grain production showed an obvious trend of “westward shift”. In the past 20 years, the focus of cultivated land has always been in Boshan District of Zibo City, while the focus of grain production has been in Laiwu District of Jinan City. The shifting trend and range of the grain production center of gravity in the lower Yellow River is much larger than the change of cultivated land center of gravity, which shows that the grain production pattern has obvious trend change compared with the change of cultivated land spatial and temporal distribution pattern in this area. During the 30 years from 2000 to 2020, the obvious trend of “westward shift” of grain production center of gravity in the lower reaches of the Yellow River also shows that the grain production of western cities contributes more and more to the whole lower reaches of the Yellow River, especially the grain production of western cities such as Heze, Dezhou, Liaocheng and Jining rank in the forefront of the whole region, and the growth rate in the past 20 years is very obvious. The grain growth rate of Heze and Dezhou is more than 120%, which plays a leading role in the grain pattern of the whole western region. In the past 20 years, the area of standard deviation ellipse of cultivated land use has increased by 1.2%, while that of standard deviation ellipse of grain production has only increased by 0.6%. This phenomenon shows that the spatial distribution of cultivated land in 2020 is more dispersed and the coverage is larger than that in 2000, while the spatial distribution of grain production has not changed much in the past 20 years. In the past 20 years, the rotation amplitude of the standard deviation ellipse of grain production is larger than that of cultivated land. The rotation angle of the standard deviation ellipse of grain production inclines from 62.4° in 2000 to 58.7° in 2020, resulting in a change of 3.7°, and the axis of the ellipse shows an obvious counterclockwise rotation trend. At the same time, the cultivated land standard deviation ellipse only changed by 0.4°, and the cultivated land standard deviation ellipse in the third period changed very little. In the process of social and economic development in the lower reaches of the Yellow River, this unbalanced development trend of grain spatial distribution must be highly valued, not only fully coordinate the contradiction of land use between grain areas and industrial areas, but also fully consider how to better meet the grain demand within and outside the region under the realistic background of “transferring grain from north to south".
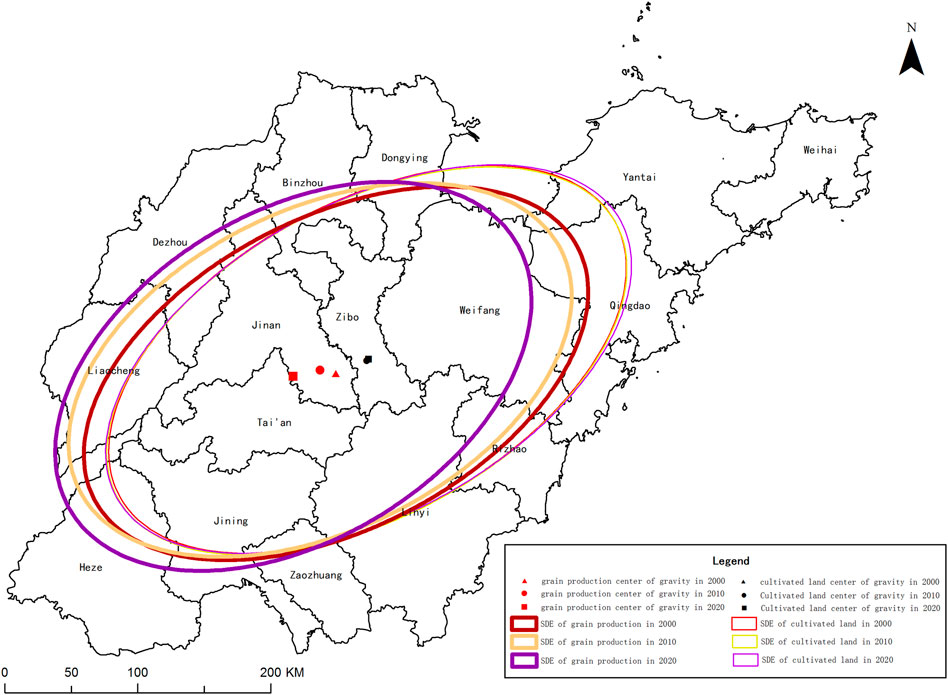
FIGURE 5. Barycenter and standard deviation ellipse of cultivated land and grain production.
The standard deviation elliptic model mainly reveals the global characteristics of the spatial distribution of the research object, and quantitatively interprets the information such as centrality, directivity and extended direction deviation. In order to further understand the regional spatial clustering pattern of grain production in the lower Yellow River region, the global Moran’s I index of grain production in the lower Yellow River region was calculated to be 0.57 by using the global spatial autocorrelation method, which shows that the grain production in the lower Yellow River region is obviously clustered in space. However, the global spatial autocorrelation analysis can not reflect the clustering distribution of grain production in various cities in the lower reaches of the Yellow River. Therefore, according to Formula (8), the Local Moran’s I index and LISA distribution map are calculated to reflect the spatial agglomeration degree and distribution characteristics of grain production in the lower reaches of the Yellow River. The specific results are shown in Figure 6.
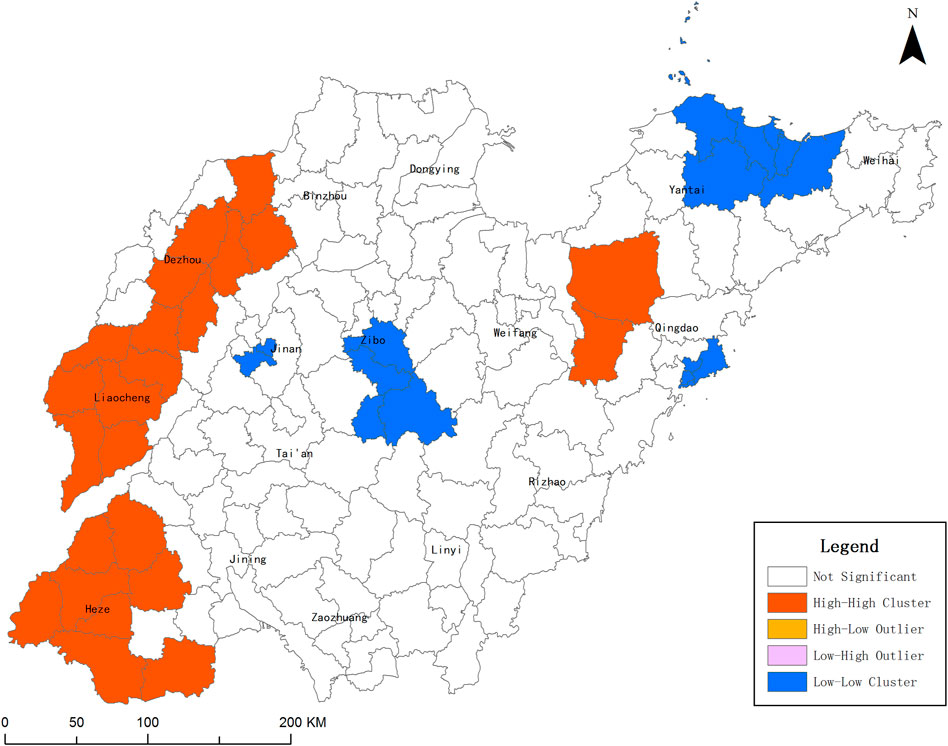
FIGURE 6. Spatial agglomeration and distribution of grain production.
It can be seen from Figure 6 that the grain production in the lower reaches of the Yellow River has obvious spatial agglomeration distribution characteristics. Among them, Lingcheng District, Leling County, Pingyuan County, Linyi County, Shanghe County, Yucheng City, Gaotang County, Linqing County, Chiping District, Guanxian, Dongchangfu District, Yanggu County, Shenxian County and other counties in northwestern Shandong are HH areas, indicating that the grain production level of these counties is relatively high, and the grain production level of their neighboring areas is correspondingly high. Juancheng County, Yuncheng County, Juye County, Mudan District, Dongming County, Dingtao District, Cao County and Shan County in Southwest Shandong Province are HH areas, which also shows that the grain production level of these counties is relatively high, and the grain production level of their neighboring areas is correspondingly high. However, only Pingdu city and Gaomi city show HH clustering in the eastern region, and HH clustering in the eastern region is not obvious on the whole. Penglai District, Zhifu District, Fushan District, Lai Shan, Qixia City, Muping District and other districts and counties are LL areas, which indicates that the grain production level of themselves and surrounding cities is weak, reflecting that the low-value concentration area of grain production in the lower reaches of the Yellow River is mainly distributed in Jiaodong area; In addition, Laoshan District, Shinan District and Shibei District are also LL areas. Zichuan District, Boshan District, Yiyuan County and Gangcheng District in central Shandong, Lixia District and Shizhong District, which belong to Jinan, the provincial capital, are all LL areas.
According to the combination of grain production and cultivated land area changes in 2000–2010 and 2010–2020, the lower reaches of the Yellow River are divided into four patterns: ① The cultivated land area increases and the grain production increases. ②The cultivated land area decreases and the grain production decreases. ③The cultivated land area increases and the grain production decreases. ④The cultivated land area decreases and the grain production increases, as shown in Figure 7. During the two periods of 2000–2010 and 2010–2020, the cultivated land area in the lower reaches of the Yellow River continued to decrease, and there was no type ① and ③. During the period from 2000 to 2010, only Dongying City belongs to the situation ② that cultivated land area decreases and grain production also decreases, while other cities belong to the situation ④ that cultivated land area decreases and grain production increases. The reason is that China’s grain production is highly dependent on cultivated land planting area (Wang and Xin, 2017). Historically, grain yields in eastern China have increased around 2% per year, largely due to improved varieties, mechanization, and improving management. During this period, the cultivated land area in Dongying City decreased by 14.2%, far exceeding that in other prefecture-level cities. Under certain agricultural planting level and farmland management experience, the sharp reduction of cultivated land area in Dongying City will inevitably lead to a decrease in grain production. However, the reduction of cultivated land in other cities is a slow process. With the continuous improvement of agricultural science and technology level, more refined field management, the use of chemical fertilizers, the continuous improvement of agricultural water conservancy facilities and a series of other reasons, the cultivated land area in most cities has decreased, but the total grain production is still increasing. During the period of 2010–2020, there are 10 cities, which belong to the situation ② that the cultivated land area decreases and the grain production also decreases. Among them, the cultivated land area of Zibo, Jinan, Linyi, Rizhao, Zaozhuang decreased by more than 10%, which led to the increase of grain production in the previous period to the decrease at present. The cities with increased grain production are all distributed in Dezhou, Liaocheng, Heze, Jining, Binzhou and Dongying in the western region. These cities are located in the coastal areas of the lower reaches of the Yellow River, with relatively flat terrain, high degree of agricultural mechanization and high reclamation efficiency, and a large amount of high-quality land is suitable for agricultural planting. Especially in Heze City and Dezhou City, the total grain production ranks in the forefront, and the total grain production of the two cities accounts for 28.5% of the grain production of the whole region. It can be seen from the above analysis that the lower reaches of the Yellow River presents an unreasonable trend that the cultivated land area continues to decrease and the spatial distribution of grain production is uneven, and the grain production in most cities is sensitive to the change of cultivated land area.
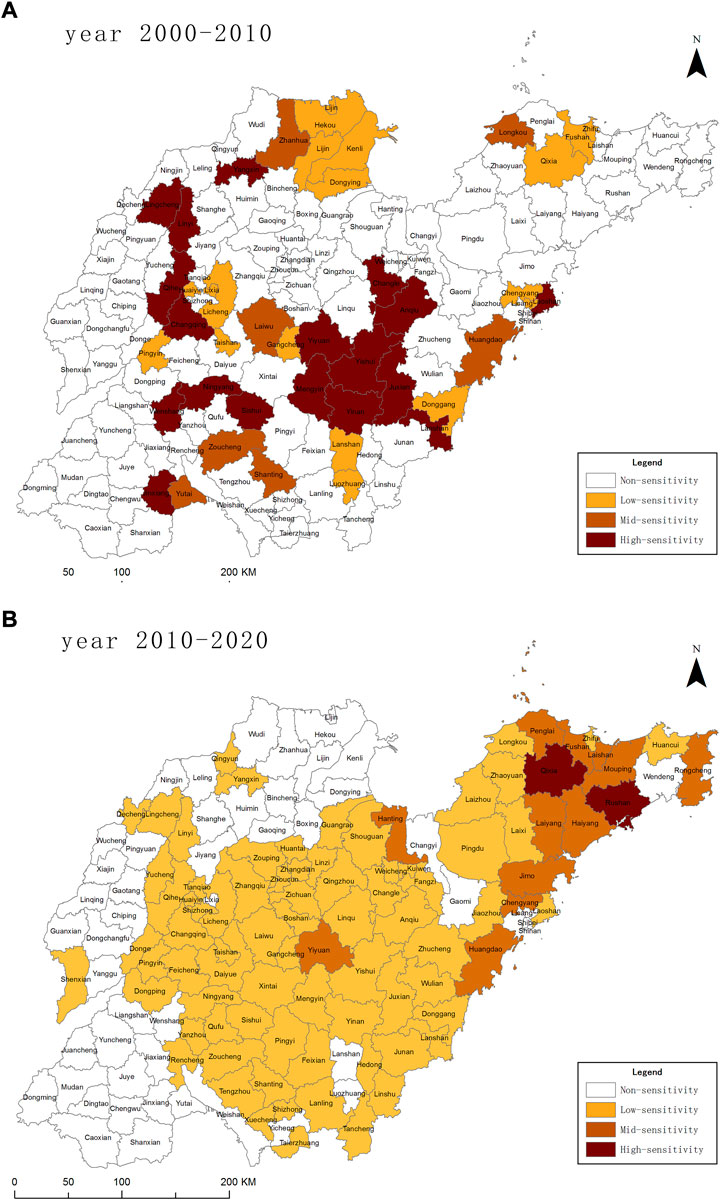
FIGURE 7. Sensitivity analysis of grain production and cultivated land area change. (A) year 2000–2010, (B) year 2010–2020.
According to the sensitivity analysis model, the sensitivity index value can reflect the sensitivity of grain production to the change of cultivated land area. The sensitivity of district and county administrative units is divided into four grades (Yang et al., 2016), which are: β ≤ 0 is an insensitive area; 0 < β ≤ 5 is a low sensitive area; 5 < β ≤ 10 is a moderately sensitive area; β > 10 is a highly sensitive region. The sensitivity distribution maps of grain production and cultivated land area change in district and county administrative units in 2000–2010 and 2010–2020 are shown in Figures 7A,B. It can be seen that during the period from 2000 to 2010, the grain production of 93 districts and counties was insensitive to the change of cultivated land, accounting for 68.38%, 18 districts and counties were low sensitive to the change of cultivated land, seven districts and counties were moderately sensitive to the change of cultivated land, and 18 districts and counties were highly sensitive to the change of cultivated land, among which the sensitivity indexes of Ningyang County, Qihe County, Changle County and Juxian County all exceeded 100. It can also be seen from Figure 7A that the most sensitive districts and counties are distributed in the hilly and mountainous areas in central and southern Shandong. These districts and counties are limited by the influence of mountainous and hilly topography. Most cultivated land plots are small, the distribution is fragmented, the agricultural infrastructure is relatively backward, modern agricultural machinery and equipment cannot be used in large-scale planting activities, and the management level of individual farmers is low. Therefore, once the cultivated land area is reduced, the grain production will be significantly reduced. During 2010–2020, the number of insensitive districts and counties decreased to 49, accounting for only 36%. During this period, the grain production of many districts and counties began to change from insensitive to sensitive to the change of cultivated land, 73 districts and counties were low sensitive to the change of cultivated land, 12 districts and counties were moderately sensitive to the change of cultivated land, and two districts and counties were highly sensitive to the change of cultivated land. During this period, although the whole cultivated land area decreased to a certain extent, with the promotion of land remediation and development projects, the soil conditions of cultivated land and the conditions of agricultural water conservancy and mechanized facilities have been improved to a great extent. The grain production in most areas will be sensitive to the change of cultivated land area reduction, but the degree of influence is not very significant, and the middle and high sensitive areas obviously have a gradual decreasing trend. Therefore, as one of the main grain producing areas in China, the lower reaches of the Yellow River should make reasonable policies in controlling the decreasing trend of cultivated land area and improving the level of agricultural modernization facilities to improve agricultural production efficiency and ensure regional food security.
From the perspective of remote sensing and geographic information technology, using the latest GlobeLand30 data to extract the cultivated land distribution data of the lower Yellow River in 2000, 2010 and 2020, the spatial distribution of cultivated land use and the cultivated land transfer pattern, the spatial distribution concentration degree and directional distribution characteristics of cultivated land and grain production, and the sensitivity analysis of grain production to the change of cultivated land area in the lower reaches of the Yellow River are obtained: ① The land type with the largest area transferred from cultivated land in the lower Yellow River is artificial surface, and its regional distribution is scattered; At the same time, the land type with the largest area transferred into cultivated land is still artificial surface, which is directly related to the rural land remediation measures implemented by the government. ② During the period from 2000 to 2020, the HHI grade of cultivated land in the lower reaches of the Yellow River was moderately concentrated and below, and there was no obvious concentration trend; the concentration degree of grain production distribution in the lower reaches of the Yellow River is higher than that of cultivated land, such as Rizhao, Dongying, Qingdao and Weihai, where the HHI grades of grain production are higher; The center of gravity of cultivated land in the lower reaches of the Yellow River is relatively stable, while the center of gravity of grain production shows an obvious trend of “westward shift”. ③ During 2000–2010, the grain productions of 68.38% of districts and counties were insensitive to the change of cultivated land, while the grain productions of 18 districts and counties were highly sensitive to the change of cultivated land, mostly distributed in the hilly and mountainous areas of central and southern Shandong; During 2010–2020, the proportion of insensitive districts and counties decreased to 36%, and the middle and high sensitive areas obviously showed a gradual decreasing trend.
Based on GlobeLand30 remote sensing image technology, this study can effectively reveal the temporal and spatial dynamic changes of cultivated land use and grain production in the lower reaches of the Yellow River. At present, the study only focuses on the sensitivity of total grain production to the change of cultivated land area in the lower reaches of the Yellow River, but there is no in-depth study on grain production of different planting types and “non-grain” land use. Meanwhile, the average annual grain yields growth rate of 2% in eastern China due to improved varieties, mechanization, and improving management also needs to be further considered as the effect on G and beta in future studies. Therefore, on the basis of analyzing the overall law of temporal and spatial dynamic changes of cultivated land use and grain production in the lower reaches of the Yellow River, in the future further research, we can combine other higher-resolution satellite images, topographic and meteorological data to carry out multi-scale and long-time series research on grain production and “non-grain” of different planting types. At the same time, although there are some analysis on the influencing factors of the change of cultivated land and grain production, the analysis of special influencing factors is the direction of further research in the future, which can provide scientific reference for further rational development, utilization and decision-making of cultivated land resources in the lower reaches of the Yellow River and promoting the high-quality development of the Yellow River Basin.
The raw data supporting the conclusion of this article will be made available by the authors, without undue reservation.
All authors listed have made a substantial, direct, and intellectual contribution to the work and approved it for publication.
This paper is supported by the National Natural Science Foundation of China (42101240), Shandong Women’s University High-level Scientific Research Project Cultivation Fund (2019GSPGJ04).
The authors declare that the research was conducted in the absence of any commercial or financial relationships that could be construed as a potential conflict of interest.
All claims expressed in this article are solely those of the authors and do not necessarily represent those of their affiliated organizations, or those of the publisher, the editors and the reviewers. Any product that may be evaluated in this article, or claim that may be made by its manufacturer, is not guaranteed or endorsed by the publisher.
Berglund, Ö., Kätterer, T., and Meurer, K. (2021). Emissions of CO2, N2O and CH4 from cultivated and set aside drained peatland in central Sweden. Front. Environ. Sci. 9, 630721. doi:10.3389/fenvs.2021.630721
Chen, J. (2018). Framing the spatio-temporal changes in globe cultivated land using GlobeLand30. Sci. Agric. Sin. 51, 1089–1090. doi:10.3864/j.issn.0578-1752.2018.06.008
Chen, J., Liao, A., Chen, j., Peng, S., Chen, L., and Zhang, H. (2017). 30-meter global land cover data product: GlobeLand30. Geomatics World 24, 1–8. doi:10.3969/j.issn.1672-1586.2017.01.002
Ge, D., Sun, P., Zhou, G., and Lu, X. (2021). Grain production transformation mechanism and the security effects in traditional farming areas: The perspective of rural spatial governance. J. Nat. Resour. 36, 1588–1601. doi:10.31497/zrzyxb.20210618
Guo, Q., Liu, S., and Liu, W. (2019). Study on quality management of cultivated land in main grain-producing areas of China in three dimensional coordinates:take northeast grain main-producing area as an example. Acad. J. Zhongzhou 10, 39–45.
Guo, R., Liu, F., Chen, Q., Zhou, Q., Gu, X., and Cai, X. (2021). Reconstruction of cultivated land pattern in the upper reaches of the Yellow River in the late northern song dynasty: Take hehuang valley as an example. J. Nat. Resour. 36, 27–37. doi:10.31497/zrzyxb.20210102
Han, C., Shen, Y., Wu, L., Guo, Y., and Chen, X. (2021). Spatial and temporal variation characteristics of cultivated land in the upper Yellow River from 2002 to 2018 based on time series MODIS. Chin. J. Eco-Agriculture 29, 1940–1951. doi:10.13930/j.cnki.cjea.210113
He, S., Wang, W., and Zeng, C. (2016). Spatial-temporal pattern of economic development and the forecast in China. Geogr. Sci. 36, 1622–1628. doi:10.13249/j.cnki.sgs.2016.11.003
IPCC (2007). Summary for policymakers of climate change 2007: The physical science basis, contribution of working group I to the fourth assessment report of the Intergovernmental Panel on Climate Change. Cambridge: Cambridge University Press.
Li, J., Jiang, Z., Miao, H., Liang, J., Yang, Z., Zhang, Y., et al. (2021). Identification of cultivated land change trajectory and analysis of its process characteristics using time-series Landsat images: A study in the overlapping areas of crop andmineral production in yanzhou city, China. Sci. Total Environ. 806, 1–16. doi:10.1016/j.scitotenv.2021.150318
Li, Y., Han, M., and Kong, X. (2019). Study on transformation trajectory and driving factors of cultivated land in the Yellow River Delta in recent 30 years. China Popul. Resour. Environ. 29, 136–143. doi:10.12062/cpre.20190601
Liang, X., Jin, X., Sun, R., Han, B., Ren, J., and Zhou, Y. (2022). China's resilience-space for cultivated land protection under the restraint of multi-scenario food security bottom line. Acta Geogr. Sin. 77, 697–713. doi:10.11821/dlxb2022003014
Liu, J., and Ma, J. (2003). Problems and solutions of sloping farmland in the Yellow River valley of Shanxi province. China Land Sci. 17, 59–64. doi:10.3969/j.issn.1001-8158.2003.02.011
Liu, K., Du, J., Ma, C., Qu, X., Han, T., Liu, S., et al. (2022). Spatio-temporal evolution characteristics of soil potassium in main dryfarming grain arable land of China. Acta Pedol. Sin., 1–12. doi:10.11766/trxb202109080399
Liu, M., Zhang, A., and Wen, G. (2022). Regional differences and spatial convergence in the ecological efficiency of cultivated land use in the main grain producing areas in the Yangtze Region. J. Nat. Resour. 37, 477–493. doi:10.31497/zrzyxb.20220214
Liu, Y., Wang, J., and Guo, L. (2009). The spatial-temporary changes of grain production and arable land in China. Sci. Agric. Sin. 42, 4269–4274. doi:10.3864/j.issn.0578-1752.2009.12.018
Liu, Y., Zhang, F., Xie, Z., and Zhang, T. (2019). Evolution of spatio-temporal characteristics of grain production in China from the perspective of arable land use. J. China Agric. Univ. 24, 173–182. doi:10.11841/j.issn.1007-4333.2019.11.19
Lv, X., Shi, Y., and Huang, X. (2016). Geo-spectrum characteristics of land use change in Jiangsu Province. Chin. J. Appl. Ecol. 27, 1077–1084. doi:10.13287/j.1001-9332.201604.006
Niu, H., and Xiao, D. (2019). Effect of economic compensation for cultivated land protection on grain production under scenario simulation in Henan. J. Arid Land Resour. Environ. 33, 58–64. doi:10.13448/j.cnki.jalre.2019.009
Ren, G. (2014). The agglomeration characteristics and influencing factors of exhibition venues in Yangtze River Delta. Econ. Geogr. 34, 86–92. doi:10.15957/j.cnki.jjdl.2014.09.043
Ren, J., Fang, B., and Xu, S. (2016). Study on spatial distribution and impact factors of reserved cultivated land resources in the Middle and Lower Reaches of Yangtze River. China Land Sci. 30, 71–79. doi:10.11994/zgtdkx.20160607.105432
Sun, M. (2020). Study on land use transfer matrix and spatial change in Kunming municipal district. Anhui Agric. Sci. Bull. 26, 106–109. doi:10.16377/j.cnki.issn1007-7731.2020.23.042
Tan, S., Han, S., and Zhang, L. (2020). Study on fallow scale and dynamical simulation of major grain producing areas in China from the food security perspective. China Land Sci. 34, 9–17. doi:10.11994/zgtdkx.20200207.134200
Wang, J., and Xin, L. (2017). Spatial-temporary variations of cultured land and grain production in China based on GlobeLand30. Trans. Chin. Soc. Agric. Eng. 33, 1–8. doi:10.11975/j.issn.1002-6819.2017.20.001
Wang, Q., and Guo, X. (2020). Perceived benefits, social network and farmers’ behavior of cultivated land quality protection: Based on 410 grain growers’ surveys in hua county, henan province. China Land Sci. 34, 43–51. doi:10.11994/zgtdkx.20200701.104922
Wang, Y., Wen, Q., and Liu, Y. (2020). Achieving ef-fective connection between rural revitalization and targeted poverty alleviation in poverty-stricken regions. Sci. Geogr. Sin. 40, 1840–1847. doi:10.13249/j.cnki.sgs.2020.11.009
Wei, X., Song, L., Wang, S., Yu, Z., and Wang, N. (2021). Spatial and temporal changes and its variation of cultivated land quality of counties and cities in Shaanxi on the West Bank of the Yellow River. Res. Soil Water Conservation 28, 326–334. doi:10.13869/j.cnki.rswc.20200817.002
Wen, Q., Shi, L., Ma, C., and Wang, Y. (2018). Spatial heterogeneity of multidimensional poverty at the village level: Loess Plateau. Acta Geogr. Sin. 73, 1850–1864. doi:10.11821/dlxb201810003
Xu, G., Jin, X., Song, J., and Zhou, Y. (2012). The impact of intensive use of agricultural land on grain productions: A case study of JiangSu province. Geogr. Res. 31, 1621–1630. doi:10.11821/yj2012090008
Xu, H., Wang, Y., Zhang, Z., Gao, Y., and Zhang, D. (2021). Coupling mechanism of water-energy-food and spatiotemporal evolution of coordinated development in the Yellow River Basin. Resour. Sci. 43, 2526–2537. doi:10.18402/resci.2021.12.14
Yang, Y., Ma, X., and He, C. (2016). The loss process of cultured land based on GlobeLand30: A case study of binhai rim. China Land Sci. 30, 72–79. doi:10.11994/zgtdkx.20160817.134456
Yimuranjiang, A., Zhang, Y., and Zibibula, S. (2021). A study on change of land use pattern in Hami city during 2000-2020 based on GlobeLand 30. Bull. Soil Water Conservation 41, 182–189. doi:10.13961/j.cnki.stbctb.2021.01.026
Zeng, C., and Lin, C. (2022). .Huang W. Evaluation of the implementation effect of the policies on the intensive use of urban and rural construction land. J. Huazhong Agric. Univ. 4, 202–213. doi:10.13300/j.cnki.hnwkxb.2022.04.018
Zhang, B., Guo, F., and Huang, D. (2020). Pattern and evaluation of land consolidation model for “one household one plot” and “one village one plot” to solve land fragmentation in northern Shaanxi province, China. Trans. Chin. Soc. Agric. Eng. Trans. CSAE) 36, 28–36. doi:10.11975/j.issn.1002-6819.2020.15.004
Zhang, P., Pang, B., and He, J. (2017). Coupling relationship and trend of cultivated land productivity and food security: A case study of henan province. Sci. Geogr. Sin. 37, 1392–1402. doi:10.13249/j.cnki.sgs.2017.09.012
Zhang, W., Lin, C., Zeng, C., Cheng, W., and Guo, L. (2022). Spatio-temporal pattern evolution and influencing factors of construction land use efficiency under environmental Control in Shandong province. Ecol. Econ. 8, 153–160. doi:10.1007/s11442-020-1752-5
Zhao, R., Wu, K., Zhang, X., and Feng, Z. (2019). Evaluation on farmland health productivity in main grain production areas: A case study in wen county of henan province. China Land Sci. 33, 67–75. doi:10.11994/zgtdkx.20190214.153708
Zhuo, L., Shang, K., Yang, X., and Wu, P. (2022). Evalution of blue and green water resources utilization in grain production system in the Yellow River Basin based on emergy analysis. Trans. Chin. Soc. Agric. Eng. 38, 132–140. doi:10.11975/j.issn.1002-6819.2022.01.015
Keywords: cultivated land use, grain production, dynamic changes, GlobeLand30, sensitivity
Citation: Wang X and Cheng H (2022) Dynamic changes of cultivated land use and grain production in the lower reaches of the Yellow River based on GlobeLand30. Front. Environ. Sci. 10:974812. doi: 10.3389/fenvs.2022.974812
Received: 21 June 2022; Accepted: 29 August 2022;
Published: 29 September 2022.
Edited by:
Chen Zeng, Huazhong Agricultural University, ChinaReviewed by:
Nathan Moore, Michigan State University, United StatesCopyright © 2022 Wang and Cheng. This is an open-access article distributed under the terms of the Creative Commons Attribution License (CC BY). The use, distribution or reproduction in other forums is permitted, provided the original author(s) and the copyright owner(s) are credited and that the original publication in this journal is cited, in accordance with accepted academic practice. No use, distribution or reproduction is permitted which does not comply with these terms.
*Correspondence: Hui Cheng, Y2hlbmdodWl3aHVAMTYzLmNvbQ==
Disclaimer: All claims expressed in this article are solely those of the authors and do not necessarily represent those of their affiliated organizations, or those of the publisher, the editors and the reviewers. Any product that may be evaluated in this article or claim that may be made by its manufacturer is not guaranteed or endorsed by the publisher.
Research integrity at Frontiers
Learn more about the work of our research integrity team to safeguard the quality of each article we publish.