 Ziwei Mo
 Qi Luo
 Yanwei Zheng
 Dongxiao Yu
- School of Computer Science and Technology, Shandong University, Qingdao, China
Analysis of large-scale networks generally requires mapping high-dimensional network data to a low-dimensional space. We thus need to represent the node and connections accurate and effectively, and representation learning could be a promising method. In this paper, we investigate a novel social similarity-based method for learning network representations. We first introduce neighborhood structural features for representing node identities based on higher-order structural parameters. Then the node representations are learned by a random walk approach that based on the structural features. Our proposed truss2vec is able to maintain both structural similarity of nodes and domain similarity. Extensive experiments have shown that our model outperforms the state-of-the-art solutions.
1 Introduction
Connections between entities are ubiquitous in the real world, and networks are a powerful structure for modeling such connections between entities Newman (2010). With the widespread application of network structures, network analysis has received increasing attention in both academia and industry. For example, analyzing the social groups of users can help various applications in social network scenario, such as advertising Farahat et al. (2012), recommendation Forsati et al. (2013), and community detection Watanabe et al. (2019). Moreover, in information networks, analyzing the network structure can help people understand how information spreads and how rumors spread Moradabadi and Meybodi (2018).
However, analyzing networks thoroughly means that we need to address the high-dimensional network data challenge. Intuitively, a very important problem in network analysis arises: how can we reduce high-dimensional data Goyal et al. (2018) to a low-dimensional equivalent representation space to obtain a more concise and effective analysis without introducing high-computation consumption. Representation learning is an emerging technique that maintains both the relationship and attribute information of the nodes in the network and generates representation vectors in a lower-dimension space. In our work, we argue that there are two severe challenges for network representation learning. The first challenge is to find a representation that appropriately measures the characteristics of node connectivity relationships, and the second problem is how to map such characteristics into the vector space. To address above problems, we need to consider two types of similarities in representation learning process, the nodes with similar features and the nodes with similar structural roles. Intuitively, interconnected nodes are considered to have similar features. Nodes that are connected to each other in the network are in the same community, then these nodes are also close in the vector space. This proximity-based network representation learning is also known as community-based representation learning Rossi et al. (2019). Another way to measure node similarity is to consider the structural roles of nodes in the network Rossi and Ahmed (2015) Referring to nodes with similar structural properties, structural roles define the set of nodes that are structurally more similar to nodes within a community than to nodes outside the community. This approach aims to embed nodes with structurally similar neighborhoods together, while allowing nodes to be farther apart in the network. The node roles represent general structural functions such as nodes acting as hubs, star edges, near neighbors and bridges connecting different regions in the graph. More precisely, two nodes belong to the same role if they are structurally similar, do not need to be connected by edges, and are not in the same community Ahmed et al. (2018).
From above observations, we notice that the similarity between nodes in the network is not only characterized by local community properties, but also by the role structure of the global network topology. Therefore, both local intra-community node connectivity similarity and global node role similarity should be preserved in network representation learning. However, in many real-world networks, the network exhibits strong sparsity despite the large size of the network. Such sparsity challenge makes it difficult to obtain node characteristics by only extracting the neighborhood structure information of nodes. In addition, the attributes of nodes and edges in the network are usually incomplete, which increases the difficulty of node similarity metrics. Consequently, network representation learning faces the following challenges.
• Challenge 1. Structural identity of nodes is difficult to represent accurately. The structural features of nodes can not be accurately described by simple neighborhood information, such as degree, motif, etc., and higher-order structural features are needed.
• Challenge 2. Nodes within the same community also need a more fine-grained way to distinguish the nodes with high similarity. Although nodes within the same community are closely connected, they still need to be differentiated, and a more efficient way to measure their similarity is needed to represent the learning of these closely adjacent nodes.
• Challenge 3. It is difficult to balance structural similarity and community similarity of nodes. In most methods, only one of structural similarity and community similarity between nodes can be maintained. The vector represents the community similarity while losing the properties of nodes with similar structures far from these nodes.
To address the above challenges, we propose a network representation learning method based on the social similarity of nodes. In order to capture the higher-order structural information of the nodes, we utilize a higher-order measure of the relationship between nodes, the truss number, to construct the structural identity of the nodes. Truss number is a value that can be calculated on each edge to mark the strength of the relationship between two nodes on this side. The truss number of an edge is determined by the maximum k-truss in which the edge is located, a k-truss is a maximal connected subgraph structure in which each edge is in at least k − 2 triangles. We then utilize the truss number information of the neighboring edges within a node h-hop to construct the structural identity of this edge, which is more effective than using simple structural information in the way of degree, motif, etc. by using higher-order structural information. To preserve the community proximity of nodes, we use the walking strategy with the most similar structure identity. This ensures both the structural similarity of the node learning vectors and the community proximity. In summary, our contribution is as follows.
• We are among the first to utilize the truss number, a higher-order structural information, to describe the structural identity of nodes. This approach contains a large scope of structural features using a small quantity of local higher-order information.
• We propose a random walk strategy based on structural similarity, which can capture the similarity of nodes within the same community.
• The proposed truss2vec for network representation learning can guarantee adjacency similarity while preserving node structural similarity. The experimental results show that our method significantly outperforms the baseline in node clustering, multi-classification.
2 Related work
Our work consider the both community-based representation learning and structural role-based representation learning in networks. The following introduces the related work.
2.1 Community proximity representation learning
Most community-based representation learning methods arise from random walks or feature propagation. The random walk-based methods capture nodes in networks that are close to each other within the communities for representation learning. Nodes that are close to each other in the network are embedded together, and random walks may visit nearby nodes first, which makes them suitable for finding communities. The representative methods based on random walks such as DeepWalk Perozzi et al. (2014), node2vec Grover and Leskovec (2016), LINE Tang et al. (2015), GraRep Cao et al. (2015), and ComE+ Cavallari et al. (2019).
The feature propagation-based methods assume that the initial attributes of nodes are used as inputs. Then, the embeddings of nodes are generated through a k-step propagation process. In each step, the features of a node are diffused to its neighbors. After k rounds, each node gets an embedding that is essentially a collection of information from its k-hop neighbors. Although the propagation process relies on walks between pairs of nodes, methods belonging to this do not explicitly use walks to approximate the graph structure. Instead, they propagate information over the network structure and describe individual nodes by collecting the propagation features of their neighbors Rossi et al. (2018b). The representative network embedding methods based on feature propagation are GCN Kipf and Welling (2016), GraphSage Hamilton et al. (2017), MuliLENS Jin et al. (2019).
2.2 Structural similarity representation learning
The main mechanisms of structural similarity-based representation learning methods utilize the initial set of structural features of the nodes to produce feature-based roles Rossi and Ahmed (2015).
When using this mechanism, nodes with similar structural features could have similar representation, even though these nodes may be located in different parts of the networks. The basic building blocks of networks, graphlets, naturally capture the key structural features of the nodes Rossi et al. (2019). Notably, the node representation is universal and can be easily computed on any types of network. One of the fast algorithms for computing such graphlets in large-scale networks, called PGD Ahmed et al. (2015), which can only take a few seconds to compute graphlets in networks with hundreds of millions of edges. The other methods with similar performance include deepGL Rossi et al. (2020b), MCN Lee et al. (2018), HONE Rossi et al. (2018a).
Representative methods such as roleX Henderson et al. (2012) first map each node to a network role via a function and then derive role-based representation for the nodes using the concept of feature random walks to capture structural similarity. The node representations learned from these feature-based walks are able to capture network role Rossi et al. (2020a).
None of the methods mentioned have used subgraph-based structures to measure the similarity between nodes and the neighborhood structure properties of the vertices themselves. This paper innovatively proposes a graph representation learning method based on very practical cohesiveness subgraph indicator k-truss to represent the similarities between vertices and the domain structure of nodes.
3 Network representation learning based on truss similarity
In this section, we first introduce the notations and definition of our model, then we give the procedure of our network representation learning framework based on k-truss.
Considering an undirected and unweighted graph G(V, E), where V is the set of nodes and E is the set of edges. The neighbors of node v ∈ V is denoted as N(v). Then, the definition and related properties of k-truss can be denoted as follows.
3.1 Definition 1 (k-truss)
The k-truss of G, denoted by Hk, is defined as the maximal connected subgraph of G, where each edge e in Hk is contained in at least k − 2 triangles.
We define truss number of an edge e in G as t(e) = max{k: e ∈ Hk}. It indicates that if t(e) = k, then there is a Hk contains e but there is not a Hk+1 contains e. We define the truss number of a node v in G as t(v) = max{t(e): v ∈ e}, which indicates the value of the largest k-truss that a vertex can be. The maximum truss number of all edges in G is defined as tmax. Figure 1 shows an example of k-truss.
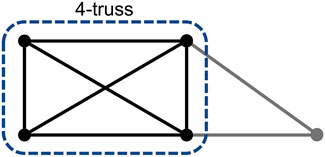
FIGURE 1. Example of k-truss.
Next, we design the representation learning model based on k-truss, which includes three steps: Step 1: Structural Identity Extraction. This step aims to define an identity for a node, and the identity can generalize the structural similarity of nodes.
Based on the assumption of structural role learning methods Rossi et al. (2020a) that nodes with the same role have similar structures in their neighborhoods. The wider the range of neighborhoods is more useful for characterizing a node. To obtain high-order structural information of nodes, we consider the neighbors to h hops from the original node. Formally, for a node v ∈ V, we denote
where
Step 2: Node Similarity Computation. We now incorporate the above node identities into a node similarity function that relies on the node structural identity to compare node similarities:
In our model, the similarity of two nodes is the Euclidean distance of the structural vectors of nodes.
Step 3: Walks based on Similarity. After we obtain the node similarity, we use random walk to learn the vector representation of the nodes. To make the random walk process match the node similarity, we need to consider a more reasonable walk strategy rather than using a complete random strategy. Therefore, we need an improved random walk method with the feature that the higher similarity between the nodes, the higher probability of wandering occurs. To this end, inspired by node2vec Grover and Leskovec (2016), a recent research learning a network by sequences of nodes. However, the sampling strategies of nodes in recent works are too simple or singular and do not consider the structural similarity between nodes.
We design a neighborhood sampling strategy based on node similarity that allows us to maximize the capture of sequences of nodes with similar structures. Starting from each given source node v, we perform a random walk of fixed length l to generate a sequence of nodes (c0, …, ci, …, cl−1), where c0 = u, let ci denote the ith node in the walk. The node ci is generated by the following distribution.
where ci is one of the neighbors of ci−1. Each neighbor of ci−1 has the above probability to be chosen as the next node of the sequence. The more similar the neighborhood structure of nodes, the more the probability of being in the same walk sequence.
The pseudocode for truss2vec is presented in Algorithm 1. The inputs are the graph and all the parameter we need in the learning procedures, and the output is the embeddings of nodes. Firstly, the truss numbers of vertices can be computed by truss decomposition Wang and Cheng (2012) (Line 1). Then the structural identity of each node based on the truss numbers computed by Eq. 1 (Lines 2–7). We sample nodes by R walks for each node, and the nodes in each walk satisfy the structural similarity (Lines 8–12). Finally, all the nodes in the selected walks are training by SGD and the embeddings are returned (Lines 13–14).
ALGORITHM 1. Truss2vec.
Input: G=(V, E), D: embedding dimensions, R: walks per node, l: walk length, w: context size, h: neighborhood hop count, δ: attenuation factor
Output: embeddings
1 Compute the truss numbers t(u) for u ∈ V;
2 foreach u ∈ V do
3 Compute the set of h-hop neighbors of u,
4 for i = 1 → h do
5 foreach v ∈ V do
6
7
8 walks ←∅;
9 for iter = 1 → R do
10 foreach u ∈ V do
11 walk = GenerateWalk(G, u, l);
12 walks.add(walk);
13 emb = StochasticGradientDescent(w, D, walks);
14 return emb;
15 Procedure GenerateWalk(G, u, l):
16 walk ← [u];
17 for l = 1 → l do
18 31 32v = walk[l − 1];
19 s ← select a node from N(v) by Pr(s|v), s∉walk;
20 walk.add(s);
21 return walk;
4 Experiments
In this section, we evaluate our network representation learning framework based on truss similarity. We first introduce the datasets, and then we evaluate the multi-classification task and sensitivity of the algorithm.
4.1 Datasets
We conducted comparative experiments on four datasets. The three datasets Brazile, Europe and USA are directed networks of flights between airports. Each edge represents a connection from one airport to another, and the label of a node shows the categories of the airports. Wiki is a communication network of Wikipedia, where nodes represent users and edges denote the talk page where two users have written messages. In each dataset, each vertex has its own corresponding category label, and the statistics of datasets are as follows. In each dataset, each vertex has its own corresponding category label, and the statistics of datasets are as show in Table 1.
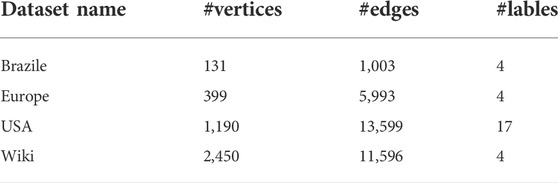
TABLE 1. The statistics of the datasets.
4.2 Clustering
For each graph, we perform the truss2vec algorithm to generate the embedding vectors. For visualisation purposes, we plot the embedding vectors for each vertex on a two-dimensional axis by dimensionality reduction to observe the aggregation of categories of vertices. The dimensionality reduction method is based on T-SNE van der Maaten and Hinton (2008). Figure 2 shows the distribution of vertices by embedding vector for the four datasets. It can be seen that some of the vertices with the same label are aggregated in close proximity to each other, but due to the limitations of the word2vec model and the fact that the dimensionality reduction algorithm loses some accuracy, not all vertices can be aggregated perfectly.
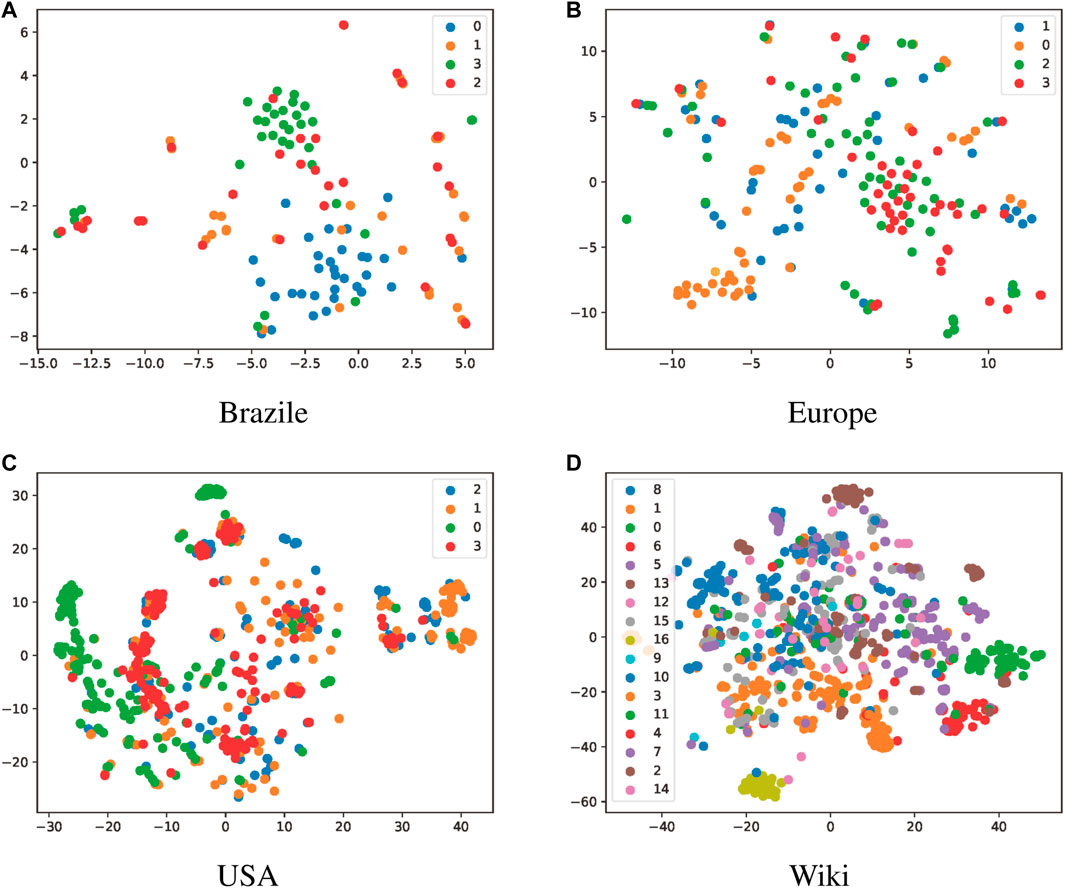
FIGURE 2. The results of node clustering. The differently colored points represent data with different labels, and the label number is the category names of the labels.
4.3 Multi-classification
Our experiments evaluate the node feature vector representation obtained with truss2vec by means of the following standard supervised learning task: multi-classification of nodes. For the vertex multi-classification problem, we evaluate the performance of truss2vec against the following representation learning algorithms.
• LINE Tang et al. (2015). This method learns the representation of nodes by two separate stages. In the first stage, it learns the
• DeepWalk Perozzi et al. (2014). This method is based on a random walk, starting from a specified node, randomly selecting the next node to be walked from its neighbors, and continuously walking downwards until the set walk length l. By performing this work several times, multiple node sequences can be obtained, and these node sequences are treated as word sequences to be input into the word2vec Grohe (2020) model to obtain the node representation vector.
• Node2vec Grover and Leskovec (2016). Unlike DeepWalk where the sequences of nodes is completely random, in node2vec the sequences from one node to the next has a certain probability, which controls whether the sequences of nodes favor depth-first or breadth-first.
In our comparison experiments, we use the same parameter settings for each algorithm to ensure that the parameters and the sampling method do not have an effect on the experimental results. For DeepWalk, Node2vec, and Truss2vec, since all the three methods are implemented based on the random walk, the difference lies in the way of generating node sequences. Thus, the parameters of these three algorithms are set to be the same, specifically, we set d = 128, l = 80, r = 10, k = 10, where d is the vector dimension, l is the length of the sequence, r is the number of sequences starting at each node, and k is the number of samples (context size). We repeated the random seed initialization experiment 10 times and averaged the results to minimize the error.
Representations of nodes are fed into a one-vs-rest logistic regression classifier with L2 regularization. The training and test data are divided equally into 10 random instances. We used Macro-F1 scores and Micro-F1 scores to compare the performance. Since the accuracy trends are similar to those of Micro-F1, they are not shown in our results. For a fine-grained analysis, we compared performance when varying the percentage of training tests from 10% to 90%. For brevity, we have summarized the results for the Micro-F1 and Macro-F1 scores in Figure 3. According to the trend of the curves, it can be seen that the scores of all algorithms improved as the percentage of the training set increased, i.e., the accuracy of node classification improved. Moreover, for all three datasets except brazile-airports, truss2vec outperforms the other three algorithms. Node2vec is close to deepwalk, and in some cases node2vec outperforms deepwalk, and LINE has a worse performance. However, in brazil-airports, LINE scores the highest, well ahead of deepwalk and node2vec, and truss2vec is second only to LINE. the reason for this situation is that the network is sparse, so the structured nature of the nodes has little effect on the representation of the nodes. On the contrary, the first-order and second-order neighbors of the nodes better reflect the identity of the nodes, so the neighborhood-based LINE algorithm achieves better performance. Collectively, our truss2vec performs more consistently in the above four datasets, and achieves good results in all datasets.
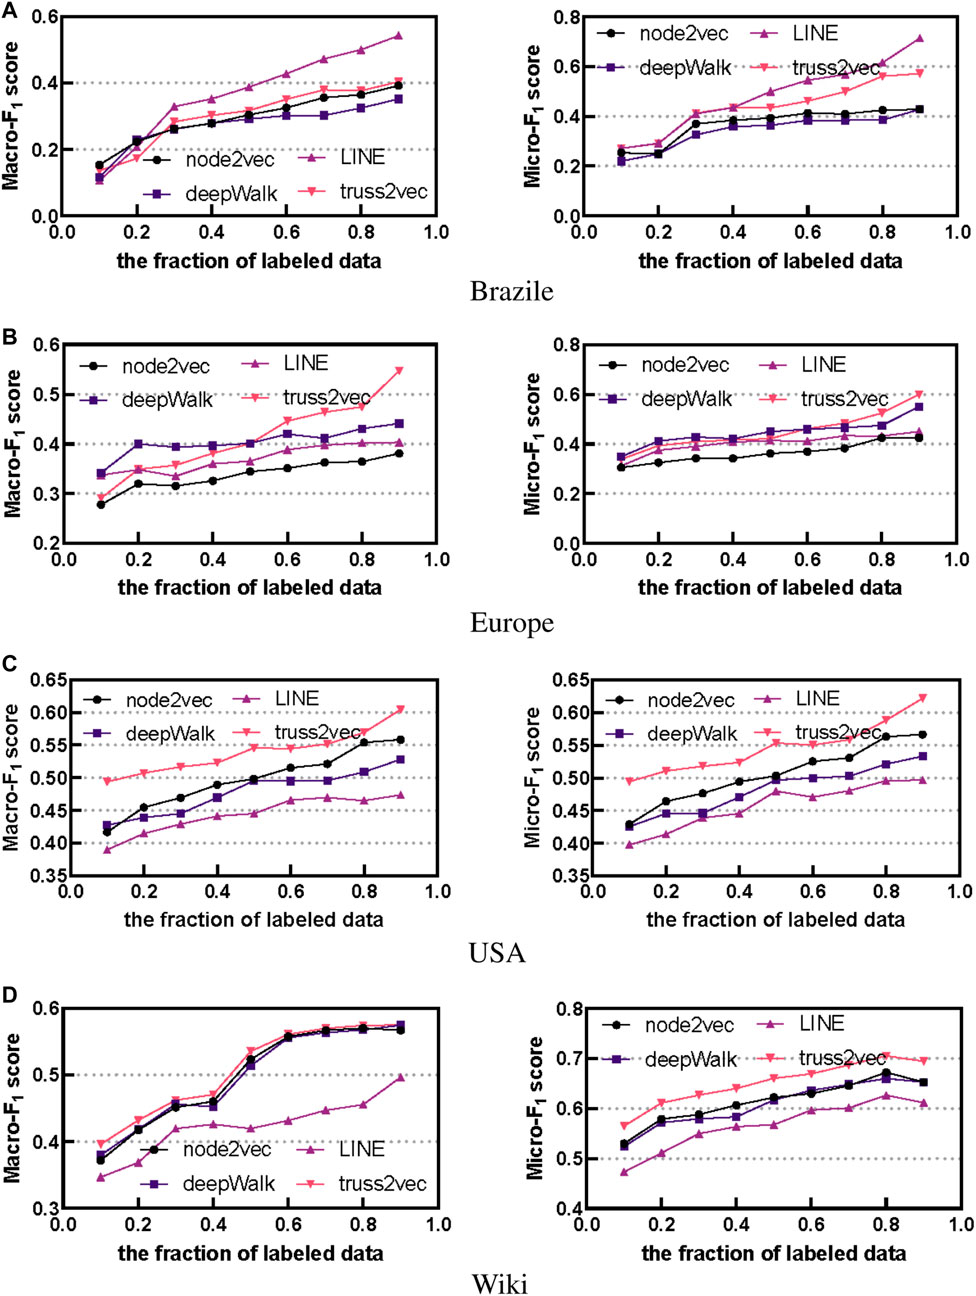
FIGURE 3. The results of multi-classification. We use different fraction of labeled data as the training set, showing the scores of 4 algorithms.
4.4 Sensitivity
The performance of truss2vec involves a number of parameters, and in this experiment we investigate the effect of different parameter choices on truss2vec performance. Labeled data is used in each graph accounting for 80% of the data, and default values are used for all parameters except those being tested. Since our proposed truss2vec considers the h-hop neighbors of the nodes as the structural identity and the more distant neighbors have less influence on the structure of the nodes as the number of hops increases. In Eq. 1, δ is the hop number attenuation factor, the distribution vector of truss number constituted by the node’s 1-hop neighbors is multiplied by the attenuation factor σ, the distribution vector of truss number constituted by the 2-hop neighbors is multiplied by δ2, and so on, the distribution vector of truss number constituted by the vertex’s h-hop neighbors needs to be multiplied by the attenuation factor δh, and the choice of the influence factor δ affects the embedding vector of each node. To measure the effect of the attenuation factor δ on the performance of the algorithm, we perform an experimental analysis of the Macro-F1 and Micro-F1 scores as a function of the parameter δ. As shown in Figure 4, when δ = 0.1, the higher-order neighbors of a node have almost no effect on the representation vector of that node, while when δ = 0.9, the higher-order neighbors of a node have little effect on that node as opposed to the lower-order neighbors. For the three datasets of Brazile, USA, and Europe, the highest scores are obtained when δ is 0.5 and 0.6. When δ is smaller or larger, both Macro-F1 scores and Micro-F1 scores decrease. This also means that to consider the influence of the near-low-order neighbors and high-order neighbors of the nodes together, the attenuation factor of this kind will work better. However, for Wiki, the experimental effect is superior when δ takes a smaller value, i.e., it means that for the nodes in wiki, their lower-order neighbors have more influence on the node representation vector and higher-order neighbors have almost no influence.
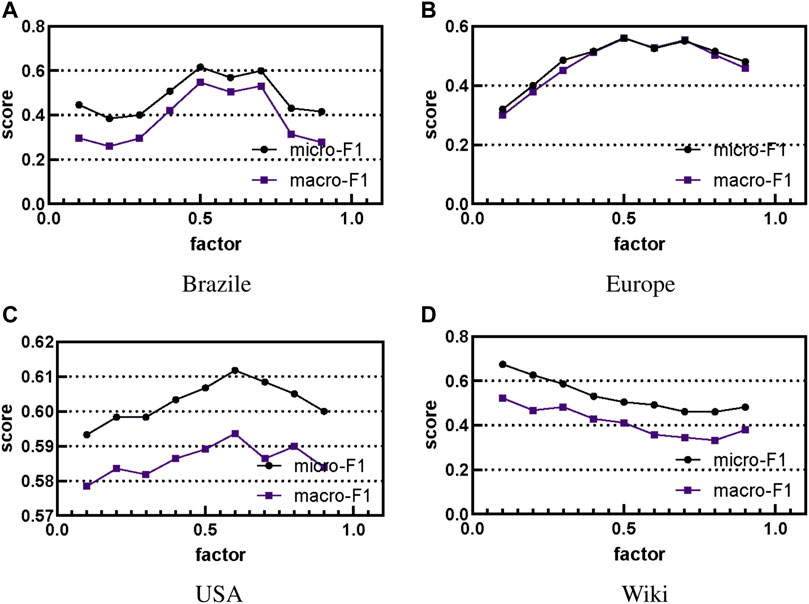
FIGURE 4. The results of the effect of attenuation factor on the performance of the algorithm. We show the scores of 4 algorithms under different factors.
5 Conclusion
Graph learning has been a critical and fundamental problem of real-world graph-based applications. In this paper, we proposed a new approach, truss2vec, which based on the social similarities and can maintain both structural similarity and domain similarity of nodes. Extensive experiments have shown that the truss2vec outperforms in clustering, multi-classification, and sensitivity.
In the future, it is possible that more effective cohesive subgraph indicators can be used in the learning representation of graphs.
Data availability statement
The original contributions presented in the study are included in the article/supplementary materials, further inquiries can be directed to the corresponding authors.
Author contributions
ZX contributed to conception and design of the study. XZ organized the database. QL performed the statistical analysis. ZM wrote the first draft of the manuscript. ZX and YZ wrote sections of the manuscript. All authors contributed to manuscript revision, read, and approved the submitted version.
Funding
This work was supported in part by the National Key Research and Development Program of China under Grant 2020YFB1005900, in part by National Natural Science Foundation of China (NSFC) under Grant 62122042, and in part by Shandong University multidisciplinary research and innovation team of young scholars under Grant 2020QNQT017.
Conflict of interest
The authors declare that the research was conducted in the absence of any commercial or financial relationships that could be construed as a potential conflict of interest.
Publisher’s note
All claims expressed in this article are solely those of the authors and do not necessarily represent those of their affiliated organizations, or those of the publisher, the editors and the reviewers. Any product that may be evaluated in this article, or claim that may be made by its manufacturer, is not guaranteed or endorsed by the publisher.
References
Ahmed, N. K., Neville, J., Rossi, R. A., and Duffield, N. G. (2015). “Efficient graphlet counting for large networks,” in 2015 IEEE International Conference on Data Mining (Atlantic City, NJ, USA: IEEE Computer Society), 1–10.
Ahmed, N. K., Rossi, R. A., Lee, J. B., Kong, X., Willke, T. L., Zhou, R., et al. (2018). Learning role-based graph embeddings. Corr. abs/1802.02896.
Cao, S., Lu, W., and Xu, Q. (2015). “Grarep: Learning graph representations with global structural information,” in Proceedings of the 24th ACM International Conference on Information and Knowledge Management,CIKM (New York, NY: ACM), 891–900. doi:10.1145/2806416.2806512
Cavallari, S., Cambria, E., Cai, H., Chang, K. C., and Zheng, V. W. (2019). Embedding both finite and infinite communities on graphs [application notes]. IEEE Comput. Intell. Mag. 14, 39–50. doi:10.1109/MCI.2019.2919396
Farahat, A., Ahmed, N. K., and Dholakia, U. M. (2012). Does a daily deal promotion signal a distressed business? An empirical investigation of small business survival. Corr. abs/1211.1694.
Forsati, R., Doustdar, H. M., Shamsfard, M., Keikha, A., and Meybodi, M. R. (2013). A fuzzy co-clustering approach for hybrid recommender systems. Int. J. Hybrid. Intell. Syst. 10, 71–81. doi:10.3233/HIS-130166
Goyal, P., Hosseinmardi, H., Ferrara, E., and Galstyan, A. (2018). Capturing edge attributes via network embedding. IEEE Trans. Comput. Soc. Syst. 5, 907–917. doi:10.1109/tcss.2018.2877083
Grohe, M. (2020). “word2vec, node2vec, graph2vec, x2vec: Towards a theory of vector embeddings of structured data,” in Proceedings of the 39th ACM SIGMOD-SIGACT-SIGAI Symposium on Principles of Database Systems, PODS (New York, NY: ACM), 1–16.
Grover, A., and Leskovec, J. (2016). “node2vec: Scalable feature learning for networks,” in Proceedings of the 22nd ACM SIGKDD International Conference on Knowledge Discovery and Data Mining (New York, NY: ACM), 855–864. doi:10.1145/2939672.2939754
Hamilton, W. L., Ying, Z., and Leskovec, J. (2017). “Inductive representation learning on large graphs,” in Advances in Neural Information Processing Systems 30: Annual Conference on Neural Information Processing Systems 2017, Long Beach, CA, USA, December 4-9, 2017, 1024–1034.
Henderson, K., Gallagher, B., Eliassi-Rad, T., Tong, H., Basu, S., Akoglu, L., et al. (2012). “Rolx: Structural role extraction & mining in large graphs,” in The 18th ACM SIGKDD International Conference on Knowledge Discovery and Data Mining (New York, NY: ACM), 1231–1239.
Jin, D., Rossi, R. A., Koh, E., Kim, S., Rao, A., and Koutra, D. (2019). “Latent network summarization: Bridging network embedding and summarization,” in Proceedings of the 25th ACM SIGKDD International Conference on Knowledge Discovery & Data Mining (New York, NY: ACM), 987–997. doi:10.1145/3292500.3330992
Kipf, T. N., and Welling, M. (2016). Semi-supervised classification with graph convolutional networks. Corr. abs 1609.02907.
Lee, J. B., Rossi, R. A., and Kong, X. (2018). “Graph classification using structural attention,” in Proceedings of the 24th ACM SIGKDD International Conference on Knowledge Discovery & Data Mining (New York, NY: ACM), 1666–1674.
Moradabadi, B., and Meybodi, M. R. (2018). Link prediction in stochastic social networks: Learning automata approach. J. Comput. Sci. 24, 313–328. doi:10.1016/j.jocs.2017.08.007
Newman, M. E. J. (2010). Networks: An introduction. Oxford, UK: Oxford University Press. doi:10.1093/ACPROF:OSO/9780199206650.001.0001
Perozzi, B., Al-Rfou, R., and Skiena, S. (2014). “Deepwalk: Online learning of social representations,” in The 20th ACM SIGKDD International Conference on Knowledge Discovery and Data Mining (New York, NY: ACM), 701–710. doi:10.1145/2623330.2623732
Rossi, R. A., Ahmed, N. K., and Koh, E. (2018a). Hone: Higher-order network embeddings. Corr. abs/1801.09303.
Rossi, R. A., and Ahmed, N. K. (2015). Role discovery in networks. IEEE Trans. Knowl. Data Eng. 27, 1112–1131. doi:10.1109/TKDE.2014.2349913
Rossi, R. A., Jin, D., Kim, S., Ahmed, N. K., Koutra, D., and Lee, J. B. (2019). From community to role-based graph embeddings. Corr. abs/1908.08572.
Rossi, R. A., Jin, D., Kim, S., Ahmed, N. K., Koutra, D., and Lee, J. B. (2020a). On proximity and structural role-based embeddings in networks: Misconceptions, techniques, and applications. ACM Trans. Knowl. Discov. Data 14, 1:1–63:37. doi:10.1145/3397191
Rossi, R. A., Zhou, R., and Ahmed, N. K. (2020b). Deep inductive graph representation learning. IEEE Trans. Knowl. Data Eng. 32, 438–452. doi:10.1109/TKDE.2018.2878247
Rossi, R. A., Zhou, R., Ahmed, N. K., and Eldardiry, H. (2018b). “Relational similarity machines (rsm): A similarity-based learning framework for graphs,” in IEEE International Conference on Big Data (Seattle, WA, USA: IEEE), 1807–1816. doi:10.1109/BigData.2018.8622638
Tang, J., Qu, M., Wang, M., Zhang, M., Yan, J., and Mei, Q. (2015). “Line: Large-scale information network embedding,” in Proceedings of the 24th International Conference on World Wide Web,WWW (Republic and Canton of Geneva Switzerland: ACM), 1067–1077. doi:10.1145/2736277.2741093
van der Maaten, L., and Hinton, G. (2008). Visualizing data using t-sne. J. Mach. Learn. Res. 9, 2579–2605.
Wang, J., and Cheng, J. (2012). Truss decomposition in massive networks. Proc. VLDB Endow. 5, 812–823. doi:10.14778/2311906.2311909
Keywords: social networks, graph learning, network representation, k-truss, social similarities
Citation: Mo Z, Xie Z, Zhang X, Luo Q, Zheng Y and Yu D (2022) Network representation learning based on social similarities. Front. Environ. Sci. 10:974246. doi: 10.3389/fenvs.2022.974246
Received: 21 June 2022; Accepted: 01 August 2022;
Published: 30 August 2022.
Edited by:
Hao Sheng, Beihang University, ChinaReviewed by:
Yang Zhao, Beijing University of Chemical Technology, ChinaShuo Zhang, Beijing Jiaotong University, China
Copyright © 2022 Mo, Xie, Zhang, Luo, Zheng and Yu. This is an open-access article distributed under the terms of the Creative Commons Attribution License (CC BY). The use, distribution or reproduction in other forums is permitted, provided the original author(s) and the copyright owner(s) are credited and that the original publication in this journal is cited, in accordance with accepted academic practice. No use, distribution or reproduction is permitted which does not comply with these terms.
*Correspondence: Zhenzhen Xie, eGllenoyMUBzZHUuZWR1LmNu