 Nour Lajimi
 Nour Ben Taher2
95% of researchers rate our articles as excellent or good
Learn more about the work of our research integrity team to safeguard the quality of each article we publish.
Find out more
ORIGINAL RESEARCH article
Front. Environ. Sci. , 19 January 2023
Sec. Environmental Systems Engineering
Volume 10 - 2022 | https://doi.org/10.3389/fenvs.2022.973725
This article is part of the Research Topic Environmental Waste and Renewable Energy Optimization for the Sustainable Development Goals Achievement View all 9 articles
Before planning to equip buildings with energy systems, it is essential to first understand and control the behavior of the premises (via control of heat and water transfer phenomena) (air conditioners, heat pumps, heat exchangers, etc.). Given the amount of solar radiation to which it is exposed in summer and its significant contribution to energy loss in winter, the thermal insulation of the ceiling appears effective. The objective of this work is to study the heat and mass transfer through a ceiling wall containing micro-encapsulated phase change materials under realistic climatic conditions based on meteorological data in Tunisia. This article is about a numerical study that uses software (DIGITAL Visual FORTRAN 95) to predict the effect of incorporating a layer of PCM on thermal behavior, mass, and occupant thermal comfort, as well as energy consumption for summer and winter periods.
We investigated another technique, the integration of phase change concrete (PCC), to improve the thermal inertia of a building envelope due to the high latent heat that it exchanges during heat transfers. Several studies have been conducted with the goal of improving building energy performance.
Laurie et al., 2013 used Comsol Multiphysics software to study the model of hollow core slabs serving as a floor or ceiling filled with MCP in order to increase the thermal inertia of a building. To avoid the possibility of PCM (phase change material) leaks when it is in the liquid state, a polymer/MCP composite is made and then incorporated inside the existing cylindrical cavities in the slabs of floors or ceilings. They used commercial paraffin as a PCM with a melting temperature close to 27°C, its apparent latent heat is around 110 kJ/kg. Then, they carried out several dynamic tests, a periodic temperature variation (between 22° and 35°C) was imposed on the inside face of a slab and the temperature on the upper face was measured and compared to that observed for a reference panel without MCP. They showed that the variations of this temperature have lower amplitude when the slab contains an MCP and moreover the phase shift between the imposed variations and those measured on the other face is about 1.5 times greater for the slabs with MCP. Which clearly shows the increase in thermal inertia. Sharma et al., 2009 have shown that the MCP microencapsulation method is best suited to the building envelope because PCMs are easy to handle and integrate into all building materials; Thiele et al., 2015 studied the addition of micro-encapsulated MCP to the exterior concrete walls of a mid-size family residence in San Francisco and Los Angeles. They used numerical simulations to process this study. The results showed that adding PCM can lead to significant annual energy savings. In fact, the annual reduction in cooling load varies from 85% to 100% and from 53% to 82% in San Francisco and Los Angeles, respectively, thus the decrease in power consumption; Lei et al., 2016 numerically studied the energy performance of buildings integrating MCP in order to reduce the cooling load in Singapore. They incorporated a 10 mm thick MCP layer with a melting temperature of 28°C in all vertical walls either on the exterior surfaces or on the interior surfaces of the building envelope. They have shown that the optimum phase change temperature is affected by the location of the MCP and that the integration of MCP into the exterior surfaces of the walls improves the thermal performance of a building more than that of the interior surfaces; Saafi and Daoues, (2019) have shown that MCP applied to the exterior face of a brick wall provides better energy efficiency, with the highest energy savings of up to 13.4% achieved for south orientation. The integration of the 3 cm thick MCP improved the thermal inertia of the wall with a 2 h increase in the jet lag for the east orientation. A 30 years life cycle cost analysis has shown that integrating MCP into a brick wall is not cost effective. The interaction between MCP and thermal insulation in a brick wall showed improved efficiency of MCP in the absence of insulation, providing the highest rate of reduction in energy consumption, estimated at 12.21%. Integrating the MCP into the ceiling compensated for winter penalties and reduced the surface temperature to 5.35°C; Baniassadi et al., 2016 have shown that PCM is the most favorable thermal insulation in the Iranian climate; Ye et al., 2014 studied the comparison between PCM and thermal insulation and proved that PCM performance is better during the cooling season; Pisello et al., 2015 proved that adding PCM to the ceiling minimizes energy consumption during the cooling and heating periods of Italy; Roman et al., 2016 for seven climatic zones in the United States, where the PCM roof type performed better than the Cool Roof technology; Aguilar et al., 2013 showed an optimal analysis of a PCM in the temperate climate of Sydney and investigated the similar influence of roof solar reflectivity and PCM on energy savings in several cases; Li et al., 2015 numerically studied the thermal performance of roofs with and without PCM in China and showed that PCM increased the temperature delay through the roof by 3 h. According to Saffari et al., 2018, the combination of cool roof and PCM technologies reduced roof cooling stress by 18%–30% and resulted in energy savings of 1%–6%; Khetib et al., 2021 simulated heat transfer (conduction, convection and radiation) in a double glazed window A phase change material (PCM) is used in the window frame (WF) to control temperature. By changing the angle of the window from 0 (vertical position) to 60°, the melting time of the PCM and the amount of heat loss from the window are analyzed. The results show that an increase in the window angle reduces the free convective heat transfer in the cavity and the heat transfer rate. They showed that increasing the window angle by 60° reduces the window heat transfer rate by 10% and the lowest PCM melting time occurs when the window angle is 0°, and the maximum occurs for a window angle of 60° and increasing the air gap between the two glasses by 40 mm reduces the amount of heat transfer by 44%. Abidi et al., 2021 showed that the use of a blade of longer length results in a higher temperature of the enclosure in the charging mode and lower in the freezing state than in the case of the mode without blades at the same time. Adding a blade with a length of 1.5 to the enclosure results in an increase in Nusselt number of 252% in 100 s and a decrease of 87% in 1,000 s in charging mode, while the number of Nusselt is reduced by 94% and is increased by 115% at the same times, respectively, in the discharge process. An increase in blade length leads to an increase in the amount of molten nano-PCM in the charge mode and an increase in the amount of frozen nano-PCM in the discharge state. Also, using a casing with a longer blade length speeds up the charging and discharging processes; Alqaed et al., 2022 simulated a nano-PCM (NPCM) in a circular enclosure where an inverted triangle is placed in its middle. Inside the barrier is a Li-ion battery (LIIBP) with a triangular arrangement. The results prove that under the same circumstances, the fusion time of NPCM is longer than the freezing period. An improvement in LBL intensifies the TAve of NPCM in the melting process and reduces the TAve in the freezing process. LBL enhancement increases the amount of NPCM at constant times from the start of the melting and freezing processes. The complete fusion time of NPCM in longer BL is lower than in bladeless mode. The same behavior is observed for freezing time.
Controlling indoor air humidity is a major factor in improving comfort in a building. Subramanyam et al., 2004 have shown that maintaining indoor relative humidity is important for improving indoor air quality, energy performance and the durability of the building envelope. (Zhang and Yoshino, 2010; Rao et al., 2012). pointed out that a low humidity environment causes dryness of the skin and throat, mucous membranes, while a high humidity environment can lead to dryness, discomfort and respiratory allergies affecting the visibility of air quality, causing fungal growth, affecting the durability of the building, etc. (Shi et al., 2014) concluded that PCM models are thermally efficient and that by reducing relative humidity 8%–16%, they provide a comfortable and healthy indoor environment. Additionally, they showed that the application of PCM in social housing in Hong Kong is economically visible with an 11-year payback period. Therefore, thermal and water performance are essential for a comfortable and healthy life. For the above reasons, this research also investigated the effect of microencapsulated concrete on changes in temperature and humidity based on physical models (Tariku et al., 2010; Dubois and Evrard, 2014) to predict the coupling between the transfer of heat and mass of different types of envelopes in the building. We divided the building into several elements using the nodal method as a numerical method, which gives 81 nodes in total, and we solved the heat and mass transfer problem using the thermoelectric analogy method (Figure 1). The ease of use of the model, which was based on thermoelectricity and validated with an analytical method (Lajimi and Boukadida, 2015; Bentaher et al., 2019; Lajimi et al., 2022), helped in the prediction and evaluation of the energy performance of the walls.
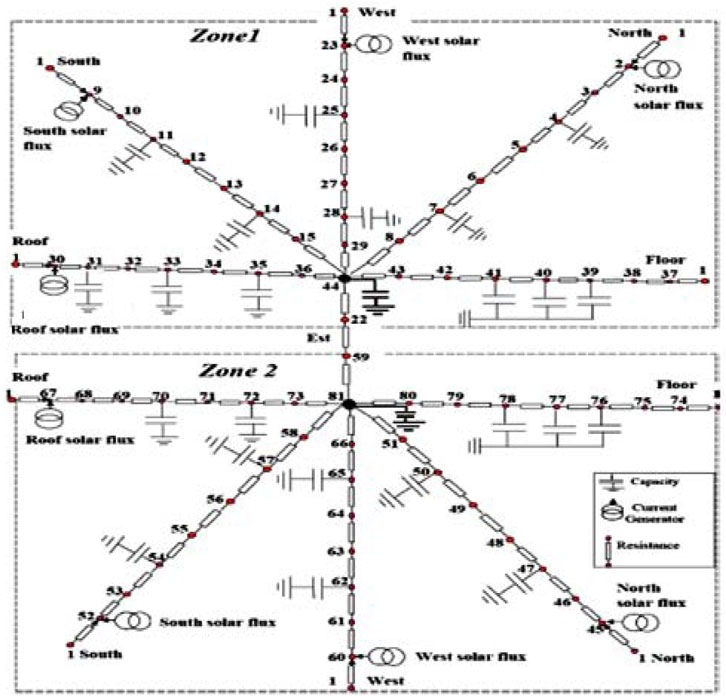
FIGURE 1. Thermoelectricity analogy model used for two-zone building.
We investigated the hydrothermal response of micro-encapsulated PCC composite panels with a melting temperature of 26°C in a two-zone building (Figure 1) with identical walls in two zones (zone 1, zone 2) (surface S = 100 m2 with a height of 3 m) and the effect of adding PCC in an exposed wall in the ceiling as shown in Figures 2, 3.
- The vertical walls which are placed on the North, South and West exposed walls are composed of: Thin plaster and layers of plaster, brick (8 cm, 12 cm) separated by a layer of wool (5 cm)
- The ceiling is composed of a PCC layer of a thickness 3 cm (Saafi and Daoues, 2019) placed on the exterior side, a layer of brick of 10 cm and a layer of concrete of 12 cm (Figure 2). For all the thermo-physical properties of the different layers are shown in Table 1.
- Case 1: PCC wall with a layer of 3 cm thickness,
- Case 2: A wall with an insulating layer (glass wool).
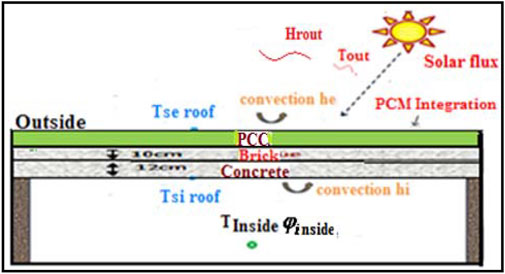
FIGURE 2. Integration of a layer of PCC in a wall exposed to the ceiling.
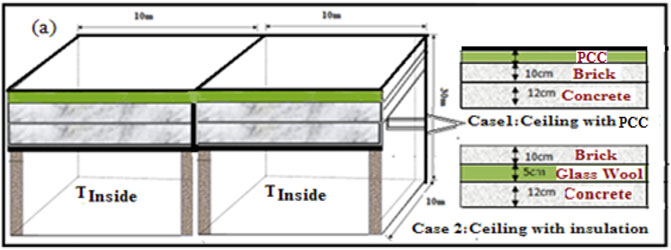
FIGURE 3. The different cases of a multi-layered wall in a room.
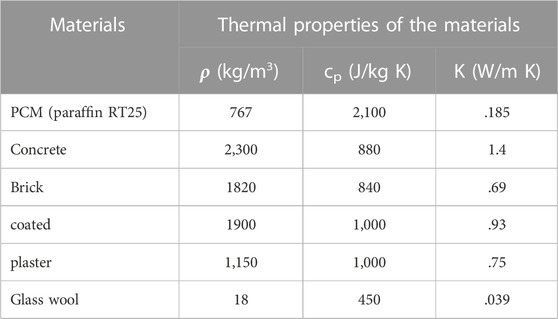
TABLE 1. Thermo-physical properties of materials (Bergman et al., 2011; Biwole et al., 2013).
The thermal properties of the materials are given in the following Table 2.
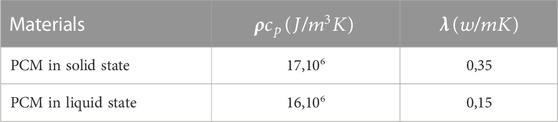
TABLE 2. Summarizes the thermophysical properties of the PCM RT 25used in this study.
The heat transfer by conduction through a wall, in the case without a heat source, is described by:
where ρ, cp and k are the density, thermal conductivity and specific heat capacity of the material, respectively. Modified PCM/concrete materials can be considered as two-phase materials consisting of reference concrete and PCM particles. In this case, the thermal conductivity of the composite material can be predicted from homogenization schemes as a function of the thermal conductivities of the two phases (concrete and PCM) and of their volume fractions. The expression of the effective thermal conductivity of the composite wall has been accurately predicted by Felske’s model (Felske, 2004):
The effective volumetric heat capacity is given by (Felske, 2004):
It depends on the temperature, as it is written below
With:
We have integrated micro-encapsulated PCM composite panels of a building (Figure 4).
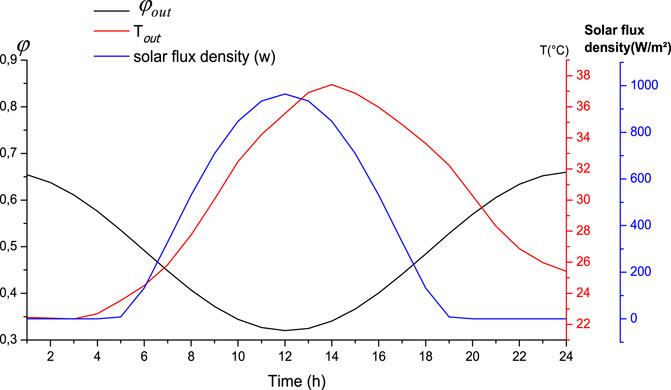
FIGURE 4. Hourly evolution of outdoor temperature, relative humidity and the density of the incident solar flux for the month July.
In this work, we have assumed the following assumptions.
- The heat and mass transfer is unidirectional.
- Air is considered a perfect transparent gas.
- The thermo-physical properties of each material are constants.
- The liquid vapor interface is permeable only to water vapor,
- Relative humidity was chosen as the potential governing mass transfer,
- The diffusion of water vapor in the air, assuming that humid air is an ideal gas, is described according to Fick’s law,
- The adsorbed water remains immobile because of the strong adhesion with the pore surface
- Constant pressure
- The transfer of water vapor diffusion in building materials is expressed by the experimental correlation of Milos J. and Robert C (Milos and Robert, 2012):
- Dv0 is the diffusion coefficient of water vapor in the air, Rd is the factor ofresistance to vapor diffusion and D is the coefficient of water vapor diffusion in building materials.
• The participation energy of the occupant is taken into account. To give more precision in our calculation, we considered that the bi-zone building is occupied by two persons at rest and taking a standing position (one in the center of each zone), so breathing contributes only with 10% to the global exchange, conduction with only 1% [given the very small contact surface of the feet with the ground (Thellier, 1989)]. These two contributions are neglected. The metabolism is assumed to be equal to 70 W m−2 (Serres et al., 2001).
The mathematical model based on the balance equation is written:
Knowing that the mass balance is written (Alexander et al, 2015):
Thermal exchanges by evaporation (
•
•
•
•
One method is to count the percentage of people dissatisfied with the comfort conditions. This percentage is directly linked to the average vote of a given population.
There are thus two parameters making it possible to measure thermal comfort:
PMV: Average Predicted Vote and is used to quantify the feeling of comfort using the standardized scale according to EN ISO 7730 (EN ISO 7730, 1994).
The Fanger equation (EN ISO 7730, 1994) is given below:
PPD predicts the percentage of unsatisfied people in a thermal environment (EN ISO 7730, 1994):
The values of the meteorological temperature and the relative humidity of the outside air are provided by the meteorological station of Sousse as shown in Figure 4 represent the evolution of the temperature, the relative humidity of the air exterior and the incident solar flux density on the exterior face of the ceiling for the months of July (Figure 4) and January (Figure 5) as a function of time (Lajimi and Boukadida, 2015).
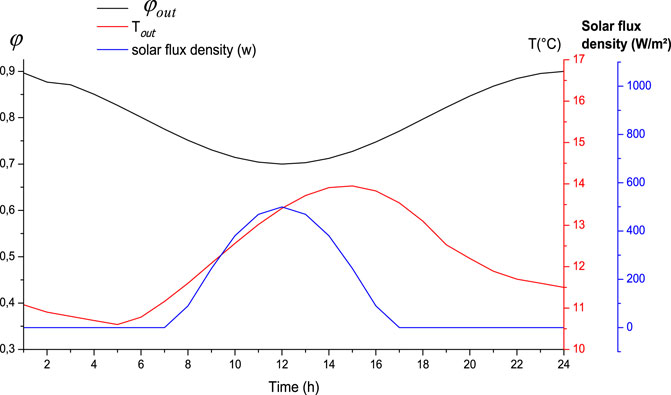
FIGURE 5. Hourly evolution of outdoor temperature, relative humidity and the density of the incident solar flux for the month Janaury.
The average emission and absorption coefficients of the exterior and interior surfaces of each wall are set respectively at ε = 0,9 et α = 0, 8.
The coefficient of heat transfer by convection at the outer and inner surfaces of the horizontal wall is he = 14 [W/m2K] and hi (T) = 11 [W/m2K], respectively.
First, we have plotted the variation in thermal power (Pt) and mass (Pm) for the months January and July. We notice that there are two time intervals during a day (winter or summer):
From 1 a.m. to 3 p.m.: there is a thermal storage which is the origin of the increase in the temperature of the indoor air (which was shown in Figure 6) and a mass de-stocking which leads to the decrease in the amount of water vapor in indoor air, therefore a decrease in relative humidity φ.
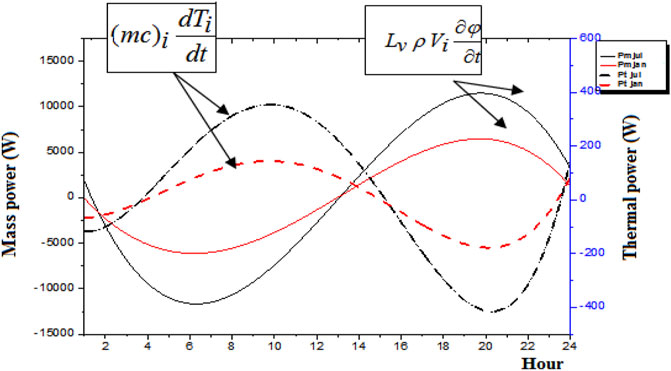
FIGURE 6. Time evolution of thermal power (Pt) and mass (Pm) for the months January and July.
From 3 p.m. to midnight: there is a thermal destocking which is the origin of the decrease in the temperature of the interior air (which was shown in Figure 6) and a mass storage which leads to the increase in the quantity of water vapor in indoor air, hence an increase in relative humidity φ.
We have plotted the evolution of the temperature of the interior air according to the different cases of the multilayer walls for the months July (Figure 7) and January (Figure 8). We have observed that the integration of the PCC during the summer period allows to reduce the temperature of the indoor air compared with a wall provided with a layer of glass wool. The difference between the room temperature without PCC and that of the room with PCC can reach 3°C. This is due to the large storage capacity provided by the phase change material. During the winter period, this temperature variation is small, around 1°C. We have traced the evolution of the relative humidity of the indoor air (Figures 9, 10) of a wall with PCC and wall with glass wool for the months of January and July. We have noticed that there is a difference between the indoor air humidity of the room without PCC and that of the room with PCC, which can reach 8% during the month of January and for the month of July with a difference of 12%. It can be seen that the addition of PCC improved the reduction in relative humidity. In addition, this feature can be useful in reducing air conditioning cooling loads and hence power consumption.
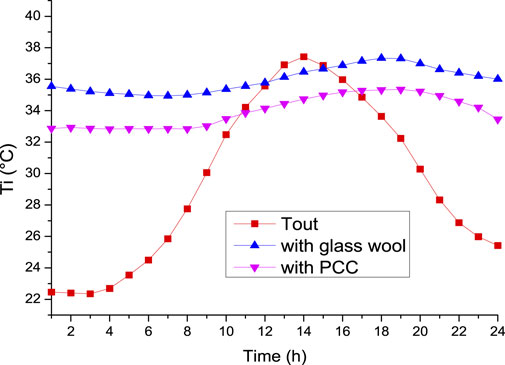
FIGURE 7. Temperature evolution indoor air for the month of July.

FIGURE 8. Temperature evolution indoor air for the month of January.
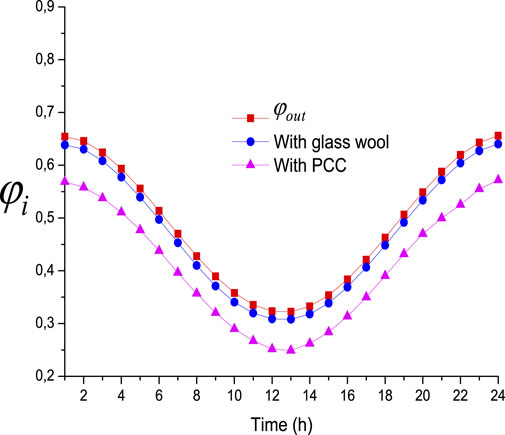
FIGURE 9. Relative humidity evolution indoor air for the month of January.
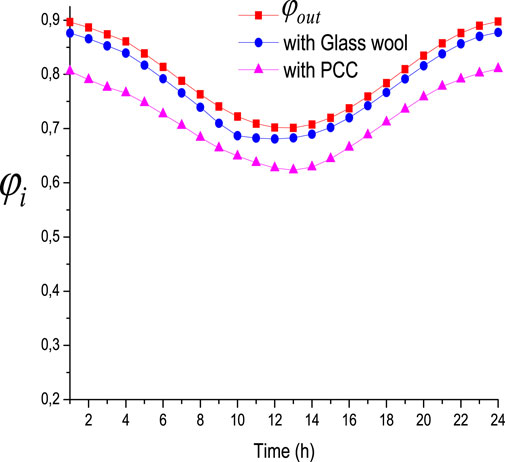
FIGURE 10. Relative humidity evolution indoor air for the month of July.
The figures represent the daily evolution of the total power consumed by the indoor air for the different types of premises in the month of July (Figure 11A) in the case where the indoor air temperature is maintained at 25°C for all day and month of January if the indoor air temperature is set at 19°C throughout the day. It has been noted that the average air conditioning power consumed by the indoor air (Figure 11A) is around 5426 W for a room with glass wool and 4001 W for a room with PCC. This difference is due to the role of the PCC which ensures the increase in the thermal inertia of the building. We can then say that a room with PCC consumes less energy than a room with glass wool of around 14%.In the case of heating (Figure 11B). The average powers consumed for the two cases are appreciably similar and they are of the order of 1051 W for the room (glass wool), of 963 W for the room (with PCC). They are more important during the night period than the daytime period. For the room (with PCC), during the night time the energy consumption is lower than that for a room (glass wool), thanks to the importance of the heat capacity which this room has to store heat during the period of sunshine (room with high inertia). We have observed also that the energy consumption in the case of an air conditioning application (month of July) is high with a reduction rate of 35% than that in the case of an application of type of heating (month of January) with a rate of 15% (Figure 12) and that due to the influence of the solar flux (see Figure 4).
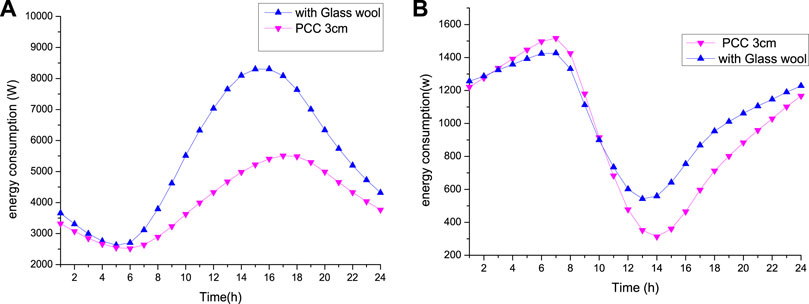
FIGURE 11. Time evolution of energy consumption.
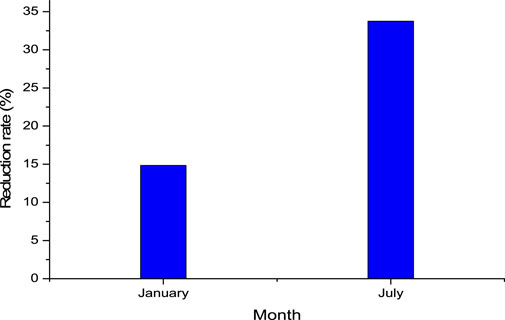
FIGURE 12. The variation in the reduction rate for the month July and for the month January.
To quantify sensation of comfort using the standardized scale according to EN ISO 7730 (Voelker, 2009). Figure 13 showsrelationship between the percentages ofdissatisfied (PPD) and the average vote (PMV) for different configurations (wit and without PCC). We notice the thermal sensation of the occupant is tepid in the case where the ceiling with PCC, on the other hand in the case where the ceiling without PCC the thermal sensation is almost hot (Table 3).
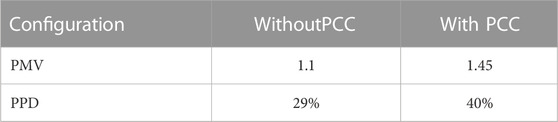
TABLE 3. We plotted the comfort index for different configurations studied.
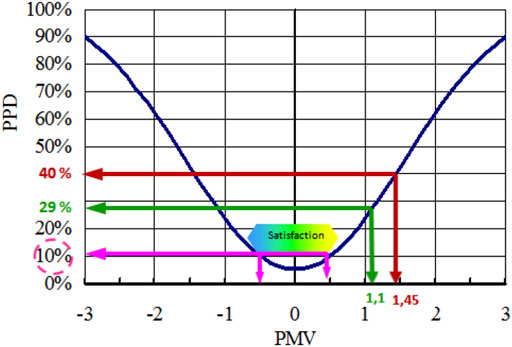
FIGURE 13. Relationship between the percentages ofdissatisfied (PPD) and the average vote (PMV)for different configurations.
A thermo-economic analysis of the wall of the envelope incorporated with PCM by varying its thickness will allow us to analyze the optimization of the cost of heating or cooling during the winter and summer periods.
According to (Saafi and Daoues, 2019) the total cost per unit area of the wall Ct, including the present value of energy cost (Cenr) and PCM cost (CPCM) is given by:
With.
-Qh and QC are the energy consumption of air conditioning and heating.The parameters used in the economic calculations used (Saafi and Daoues, 2019) are: BioPCM cost, CPCM: 5.64 TND/m2, Cost of electricity (for cooling) Cel: .21 TND/kWh, Coefficient of performance of the air conditioning system COP = 3, Cost of Natural gas (for heating) Cg: .2515 TND/m3, The calorific value, Hu = 34.526,106 J/m3 and Efficiency of the heating system ηS = 0.8.
PWF: the present value Factor which is an economic indicator defined as:
i: The inflation rate is 5.5%.
D: The discount rate is 7%.
This table shows the total energy cost during the winter and summer periods by varying the nature of the wall of a room. We have noticed that there is a reduction in cost of 20% (Table 4).
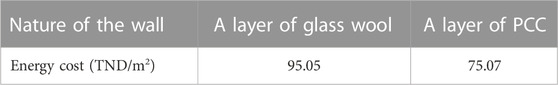
TABLE 4. The total energy cost during winter and summer periods.
In this article, we carried out a numerical study of the unidirectional thermal and mass behavior of a two-zone building under variable meteorological conditions for the Tunisian climate (Sousse region). We based ourselves on the thermoelectric analogy and we used the nodal method as a numerical method. We coupled the model of the building with a model of the occupant to take into account the exchange between the occupant and the interior of the building. We have shown that the energy contribution of the individual is not negligible. In this work we studied the integration of the PCC in the ceiling of a Tunisian building; particularly in terms of energy savings where heating and air conditioning have become essential. The results obtained show in particular that.
- The temperature of the inner surface of the PCC wall is slightly reduced compared to glass wool insulation.
- The relative humidity reduction percentage for the PCC wall is approximately 8% for the month of January and 12% for the month of July. In addition, this incorporation of the PCC in the ceiling can reduce the cooling loads of the air conditioning and therefore the energy consumption.
- The thermal sensation of the occupant is lukewarm in the case where the ceiling with PCC, on the other hand in the case where the ceiling without PCC the thermal sensation is almost warm.
- An economic analysis showed that the use of PCC reduces the energy cost by 20%.
The original contributions presented in the study are included in the article/Supplementary Material, further inquiries can be directed to the corresponding author.
NB integrated the MCP heat balance into the building model. He completed the discretization of the physical problem equation, the numerical simulation, the analysis and the interpretation of the obtained results. The work is based on what has been studied by NL who used the same building model and the same numerical method (nodal method) in previous work to evaluate the energy performance of buildings with a MCP integrated in the roof wall. NB contributed with his correction of the present paper is the supervisor of this team.
The authors declare that the research was conducted in the absence of any commercial or financial relationships that could be construed as a potential conflict of interest.
All claims expressed in this article are solely those of the authors and do not necessarily represent those of their affiliated organizations, or those of the publisher, the editors and the reviewers. Any product that may be evaluated in this article, or claim that may be made by its manufacturer, is not guaranteed or endorsed by the publisher.
Abidi, A., Rawa, M., Khetib, Y., Sindi, H. F. A., Sharifpur, M., and Cheraghian, G. (2021). Simulation of melting and solidification of graphene nanoparticles-PCM inside a dual tube heat exchanger with extended surface. J. Energy Storage 44, 103265. Part A. doi:10.1016/j.est.2021.103265
Aguilar, J. L. C., Smith, G. B., Gentle, A. R., and Chen, D. (2013). “Optimum integration of albedo, subroof R-value, and phase change material for cool roofs,” in 13th conference of international building performance simulation association, Chambery-France, Held 25-28 August 2013.
Alexander, M. T., Jamet, A., Sant, G., and Pilon, L. (2015). Annual energy analysis of concrete containing phase change materials for building envelopes. Energy Convers. Manag. 103, 374–386. doi:10.1016/j.enconman.2015.06.068
Alqaed, S., Almehmadi, F. A., Mustafa, J., Husain, S., Cheraghian, G., Saeed, A., et al. (2022). Effect of nano phase change materials on the cooling process of a triangular lithium battery pack. J. Energy Storage 51, 104326. doi:10.1016/j.est.2022.104326
Baniassadi, A., Sajadi, B., Amidpour, M., and Noori, N. (2016). Economic optimization of PCM and insulation layer thickness in residential buildings. Sustain Energy Technol. Assess. 14, 92–99. doi:10.1016/j.seta.2016.01.008
Bentaher, N., Lajimi, N., and Boukadida, N. (2019). Evaluation of the effect of a phase-change material on the thermal response of a bizone building under the climatic conditions of Tunisia. Complete R. Phys. Elsevier 20, 593–603. doi:10.1016/j.crhy.2019.01.004
Bergman, T. L., Lavine, A. L., DeWitt, D. P., and Incropera, F. P. (2011). Fundamentals of heat and mass transfer”. New York City: John Wiley and Sons.
Biwole, P., Eclache, P., and Kuznik, F. (2013). Phase-change materials to improve solar panel’s performance. Energy Build. 62, 59–67. doi:10.1016/j.enbuild.2013.02.059
Dubois, S., and Evrard, A. (2014). Non-isothermal moisture balance equation in porous media: A review of mathematical formulations in building physics. Biotechnol. Agron. Soc. Environ. 18, 383–396.
EN ISO 7730 (1994). Moderate thermal environments. Determination of PMV and PPD indices and specifications of thermal comfort conditions. Genève, et CEN: ISO.
Felske, J. D. (2004). Effective thermal conductivity of composite spheres in a continuous medium with contact resistance. Int. J. Heat Mass Transf. 2004, 3459–3461. doi:10.1016/j.ijheatmasstransfer.2004.01.013
Khetib, Y., Alotaibi, A. A., Alshahri, A. H., Rawa, M., Cheraghian, G., and Sharifpur, M. (2021). Impact of phase change material on the amount of emission in the double-glazed window frame for different window angles. J. Energy Storage 44, 103320. Part A. doi:10.1016/j.est.2021.103320
Lajimi, N., Bentaher, N., and Boukadida, N. (2022). Numerical study of the energy efficiency of the building envelope containing multi-alveolar structures under Tunisian weather conditions. Int. J. Nonlinear Sci. Numer. Simul. IJNSNS 23 (6), 931–946. doi:10.1515/ijnsns-2021-0090
Lajimi, N., and Boukadida, N. (2015). Numerical study of the thermal behavior of bi-zone buildings. Comptes Rendus Phys. 16 (8), 708–720. doi:10.1016/j.crhy.2015.08.010
Laurie, K., Bontemps, A., Grados, A., and Royon, L. (2013). “Amélioration du confort thermique par intégration de MCP dans les planchers/plafonds de bâtiment à structure légère,” 16ème Journées Internationales de thermique, Marrakech (Maroc), 13 au 15 Novembre, 2013.
Lee, S. (2009). Field thermal performance of naturally ventilated solar roof with PCM heat sink. Sol. Energy 86, 2504–2514.
Lei, J., Yang, J., and Yang, Y. (2016). Energy performance of Building envelopes integrated with phase change materials for cooling load reduction in tropical Singapore. Nanyang Technol. Univ. Appl. Energy 162, 207–217. doi:10.1016/j.apenergy.2015.10.031
Li, D., Zheng, Y., Liu, C., and Wu, G. (2015). Numerical analysis on thermal performance of roof contained PCM of a single residential building. Energy Convers. Manag. 100, 147–156. doi:10.1016/j.enconman.2015.05.014
Milos, J., and Robert, C. (2012). Effect of moisture content on heat and moisture transportand storage properties of thermal insulation materials. Energy Build. 53, 39–46. doi:10.1016/j.enbuild.2012.07.002
Moujalled, B. (2007). Modélisation dynamique du confort thermique dans les bâtiments naturellement ventilés, thesis. N° d’ordre 2007-ISAL-0005. Lyon: Ecole Nationale des Tavaux Publics de l’Etat.
Pisello, A. L., Castaldo, V. L., and Cotana, F. (2015). Dynamic thermal-energy performance analysis of a prototype building with integrated phase change materials. Energy Procedia 81, 82–88. doi:10.1016/j.egypro.2015.12.062
Rao, Z., Wang, S., and Zhang, Z. (2012). Energy saving latent heat storage and environmental friendlyhumidity-controlled materials for indoor climate. Renew. Sustain. Energy Rev. 16 (5), 3136–3145. doi:10.1016/j.rser.2012.01.053
Roman, K. K., O'Brien, T., Alvey, J. B., and Woo, O. J. (2016). Simulating the effects of cool roof and PCM (Phase Change Materials) based roof to mitigate UHI (Urban Heat Island) in prominent US cities. Energy 96, 103–117. doi:10.1016/j.energy.2015.11.082
Saafi, K., and Daoues, N. (2019). Energy and cost efficiency of phase change materials integrated in building envelopes under Tunisia Mediterranean climate. Energy 187, 115987. doi:10.1016/j.energy.2019.115987
Saffari, M., Piselli, C., de Gracia, A., Pisello, A. L., Cotana, F., and Cabeza, L. F. (2018). Thermal stress reduction in cool roof membranes using phase change materials (PCM). Energy Build. 158, 1097–1105. doi:10.1016/j.enbuild.2017.10.068
Serres, L., Trombe, A., and Miriel, J. (2001). Flux solaires absorbés par l'occupant d'un local vitré. Prise en compte dans l'équation du confort thermique. Int. J. Therm. Sci. 40, 478–488. doi:10.1016/s1290-0729(01)01236-4
Sharma, A., Tyagi, V. V., Chen, C. R., and Buddhi, D. (2009). Review on Thermal energy storage with phase change materials and Applications. Renew. Sustain. energy Rev. B, 318–345. doi:10.1016/j.rser.2007.10.005
Shi, X., Memon, S. A., Tang, W. C., Cui, H. Z., and Xing, F. (2014). Experimental assessment of position of macro encapsulated phase change material in concrete walls on indoor temperatures and humidity levels. Energy Build. 71, 80–87. doi:10.1016/j.enbuild.2013.12.001
Subramanyam, N., Maiya, M. P., and Murthy, S. S. (2004). Application of desiccant wheel to control humidity inair-conditioning systems. Appl. Therm. Eng. 24 (17–18), 2777–2788. doi:10.1016/j.applthermaleng.2004.04.008
Tariku, F., Kumaran, K., and Fazio, P. (2010). Transient model for coupled heat, air and moisture transfer through multilayered porous media. Int. J. Heat Mass Transf. 53, 3035–3044. doi:10.1016/j.ijheatmasstransfer.2010.03.024
Thellier, F. (1989). “Modélisation du comportement thermique de l'homme et de son habitat. Une approche de l'étude de confort,” (Toulouse, France: Université Paul Sabatier - Toulouse III). thesis.
Thiele, A. M., Sant, G., and Pilon, L. (2015). Diurnal thermal analysis of microencapsulated PCM/concrete walls. Energy Convers. Manag. 93, 215–227. doi:10.1016/j.enconman.2014.12.078
Voelker, C. (2009). Heat and moisture transfer through clothing. Eleventh International IBPSA Conference Glasgow. Scotland July 27-30.
Ye, H., Long, L., Zhang, H., and Zou, R. (2014). The performance evaluation of shape-stabilized phase change materials in building applications using energy saving index. Appl. Energy 113, 1118–1126. doi:10.1016/j.apenergy.2013.08.067
Zhang, H., and Yoshino, H. (2010). Analysis of indoor humidity environment in Chinese residential buildings. Build. Environ. 45 (10), 2132–2140. doi:10.1016/j.buildenv.2010.03.011
Ti Real-time temperature K
(mc)i Heat capacity J K−1
Ci,j Conductive or convective coefficient between nodes i and j W K-1
Ki,j Radiative coupling coefficient W K−4
Pi(t) The solar flux absorbed at time t by node iW
kc, ks, kms Thermal conductivities of the core (PCM), the shell (HDPE), the matrix (concrete) Wm−1K−1
ϕc, ϕsVolume fractions of the core and the shell.
K Thermal conductivity of a material Wm−1K−1
ρ Volumic mass
Cp Material heat capacity J/kg.k
Rd Resistance factor to water vapor diffusion -
Dvo Diffusivity coefficient of water vapor in air 2.2610–6 m2s−1
DWater Vapor Diffusion Coefficient in Construction Materials M2s−1
S(t) Thermal load of the human body W/m2
hm Evaporation coefficient W/Pa.m2
LR Lewis ratio -
Keywords: micro-capsulate, energy consumption optimization, phase change materials (PCM) numerical simulation, confort, thermal inertia effect
Citation: Lajimi N, Ben Taher N and Boukadida N (2023) Numerical simulation of heat and mass transfer of a wall containing micro-encapsulated phase change concrete (PCC). Front. Environ. Sci. 10:973725. doi: 10.3389/fenvs.2022.973725
Received: 20 June 2022; Accepted: 28 December 2022;
Published: 19 January 2023.
Edited by:
Antonis A. Zorpas, Open University of Cyprus, CyprusReviewed by:
Goshtasp Cheraghian, Technische Universitat Braunschweig, GermanyCopyright © 2023 Lajimi, Ben Taher and Boukadida. This is an open-access article distributed under the terms of the Creative Commons Attribution License (CC BY). The use, distribution or reproduction in other forums is permitted, provided the original author(s) and the copyright owner(s) are credited and that the original publication in this journal is cited, in accordance with accepted academic practice. No use, distribution or reproduction is permitted which does not comply with these terms.
*Correspondence: Nour Lajimi, bm91cmxhamltaUB5YWhvby5mcg==
Disclaimer: All claims expressed in this article are solely those of the authors and do not necessarily represent those of their affiliated organizations, or those of the publisher, the editors and the reviewers. Any product that may be evaluated in this article or claim that may be made by its manufacturer is not guaranteed or endorsed by the publisher.
Research integrity at Frontiers
Learn more about the work of our research integrity team to safeguard the quality of each article we publish.