
94% of researchers rate our articles as excellent or good
Learn more about the work of our research integrity team to safeguard the quality of each article we publish.
Find out more
ORIGINAL RESEARCH article
Front. Environ. Sci., 15 November 2022
Sec. Environmental Economics and Management
Volume 10 - 2022 | https://doi.org/10.3389/fenvs.2022.973334
This article is part of the Research TopicCarbon Neutrality Approaches in Buildings and Agriculture SectorsView all 12 articles
 Huimin Lu1,2
 Yi-Kai Juan1*
China is expected to have an annual demand of 1 billion square meters of new residential floor areas in the next few years. Housing developers have adopted various green building technologies (GBTs) in building designs to meet the constantly rising green building (GB) standards. However, they often ignore users’ satisfaction and perception of these GBTs and doubt the cost-benefit assessment of GBTs. This study first constructed GBTs commonly used in residential construction in the Yangtze River Delta region, China. In particular, it adopted the Kano model and the Customer Satisfaction Coefficient (CSC) model to conduct questionnaire surveys on 171 Ningbo households to analyze the differences between developers’ and users’ perceptions of GBTs. Further, a zero-one integer programming (ZOIP) approach was used to build an optimal decision-making model for housing developers to select GBTs that take into account developers’ incremental cost and benefit assessment. The results showed that residents focus on technologies related to comfort and health issues, followed by energy-efficient technologies with lower costs. High-cost and low-scoring GBTs, such as new air systems and Low-E center louvered glass, will be excluded. The decision model clarifies the differences between developers’ and users’ perceptions of GBTs and effectively assists developers in rationalizing the selection of GBTs. Furthermore, it is suggested that the proposed model can be widely applied to other projects in different regions in the future to promote GB markets in China.
Global warming and energy consumption have become the major environmental issues in the world today. Among many industries, the construction industry tops the list with 40% energy consumption (WBCSD, 2008) and generates 30% of greenhouse gases (UNEP, 2009). According to statistics, nearly 30% of China’s energy consumption comes from the construction sector (Feng et al., 2014), with building operations accounting for 25% of total energy consumption and carbon emissions from building materials, reaching 15% of total emissions. By the end of 2019, the total floor area of residential buildings in China has reached 28.2 billion square meters. In addition, the number of completed residential building units has reached 5.97 million in 2020. It is speculated that from 2022 to 2030, China will still need 1 billion square meters of residential construction each year to meet housing needs due to high urbanization (China Building Energy Efficiency Annual Development Research Report 2021). These new homes will be mostly concentrated in the Yangtze River Delta region, where the population is constantly flowing in.
The further implementation of GBs has become one of the key policies of the Chinese government to reduce energy consumption. In 2021, the Chinese government planned to achieve carbon peaking by 2030 and carbon neutrality by 2060. To this end, the government has proposed many strict regulations for the construction industry to fully implement GB standards for new buildings in urban areas by 2025. However, in the practice of residential GBs in China, developers often blindly pile up advanced energy-efficient technologies for acquiring GB certification and ignore the actual benefits and return on the investment of these technologies (Lu et al., 2018). Consequently, many technologies and equipment are left unused, and there are even cases where tenants change the original design after occupancy due to the lack of GBT awareness or based on more cost considerations. For developers, the practical challenge lies in providing GBTs that meet users’ needs under limited costs to enhance the competitive advantage of companies in the green building market.
A number of existing studies have explored GBTs and their impact on building energy management decisions. For example, Juan et al. (2010) developed a hybrid approach based on genetic algorithms (GA) for sustainable office building renovation and energy performance improvement. Ascione et al. (2015) proposed a new methodology for cost-optimal analysis by means of the multi-objective optimization based on GA for building energy performance. Seyedzadeh et al. (2020) presented a data driven model based on machine learning techniques improved by multi-objective optimization to predict building energy loads. Wu et al. (2018) integrated the multi-objective optimization technique with the comprehensive evaluation method technique of renewable energy systems in the building. Gossard et al. (2013) presented the multi-objective optimization of a building envelope for thermal efficiency using GA and artificial neural network.
The review of previous studies on GBTs revealed three major research gaps. First, only a few researchers have explored the users’ evaluation and feelings about the GBTs. Second, many studies have addressed the potential and importance of application of simulations and optimization approaches on GBs, and most of these studies were operated from the designers’ and experts’ perspectives, rarely taking into account users’ expectations of the technology. Third, from the developer’s point of view, the relationship between GB benefits and technology cost in the selection of GBTs is less explored. Hence, the research questions of this study are as follows:
• What are the users’ preferences for GBTs applied on GB projects?
• How can developers provide GBTs that meet user needs under a limited budget according to user preferences?
• How can developers conduct cost-benefit assessments for GBTs to enhance the advantages of green building projects?
To address the above research questions, this study presents a systematic optimal decision model suitable for residential GBTs in the Yangtze River Delta, China. Firstly, based on the local GB assessment standards, a series of residential GBTs have been formed by combining the common technologies of green settlements in the Yangtze River Delta over the past 3 years. Secondly, a neighborhood to be developed in Ningbo, China was selected. Then, the questionnaire based on the Kano model was distributed to the residents of its surrounding green neighborhoods. Subsequently, the Customer Satisfaction Coefficient (CSC) analysis was conducted on the questionnaire results to clarify the user preference attributes of each GBT. Finally, zero-one integer programming (ZOIP) was applied in this project to find the optimal strategy for selecting GBTs considering technology cost, user preference, and developer budget. In addition, this optimal decision model was tested using sensitivity analysis, after which, the maximum improvement efficiency of the optimal budget was explored, thus promoting the most efficient use of the budget and reducing ineffective design and construction costs.
The green building evaluation system has been established and developed in many countries since the 1990s. Up to now, there have been more than 600 rating systems. Building Research Establishment Environmental Assessment Method (BREEAM) in the United Kingdom is considered to be the first assessment system. Leadership in Energy and Environmental Design (LEED) in the United States has become the most widely used evaluation system in the world because of its clear evaluation mechanism. In addition, Deutsche Gesellschaft für Nachhaltiges Bauen e.V. (DGNB) of Germany, Haute Qualité Environnementale (HQE) of France, Green Star of Australia, Green Star of New Zealand, Green Mark of Singapore, Comprehensive Assessment System for Built Environment Efficiency (CASBEE) of Japan and other systems are used to evaluate green building performance in different countries (Doan et al., 2017).
Under the different green building evaluation systems in different regions, many studies have successively focused on the application and development of GBTs and their impact on the environments in different climate conditions. For example, Huang et al. (2012) evaluated the sustainability of 11 energy-efficient technologies in the Chinese construction industry based on a multi-attributive assessment methodology—the results of which can be used to guide the development of regional projects. Dangana et al. (2013) developed a decision-making system to help retailers and building professionals define and evaluate options for sustainable technology solutions. Ahmad et al. (2016) combined a hierarchical analysis (AHP) of an interview study of 30 technical professionals for the optimal selection of pre-design GBTs. Juan et al. (2010) developed an integrated decision support system to assess existing office building conditions and to recommend an optimal set of sustainable renovation actions, considering trade-offs between renovation cost, improved building quality, and environmental impacts. Nguyen et al. (2017) argued that developers and designers should consider whether conditions and incorporate sustainability measures into the life cycle of GB projects at the early stage of building design. From the above literature, it can be found that past research generally believed that the selection of GBTs should be introduced in the early design stage. In addition, the existing GBTs studies focus more on the energy efficiency of technologies and the impact of GBTs on users and costs was less discussed (Ge et al., 2020).
Many researchers have pointed out that the adoption of GBTs may increase GB costs (Mapp et al., 2011; Tatari & Kucukvar, 2011; Juan et al., 2017). These additional costs incurred in adopting GBTs can be defined as incremental costs (Zhang, Wu, & Liu, 2018); for instance, Ge et al. (2018) selected 276 GB projects in China and evaluated the incremental cost of GBTs according to different building areas and types. The results showed that the incremental cost of GBTs was less than 2% of the total construction cost, and this cost will increase with the GB certification level. Although the cost of GB has increased, it can also bring some benefits. According to Zhang et al. (2018), the benefits of incremental costs mainly include reduced operating costs, improved comfort, health, and productivity, improved corporate reputation, positive environmental externalities, and increased GB market value. As far as developers are concerned, the green premium to improve corporate reputation and increase the market value of GB is the main driving force behind the implementation of GB. However, the relationship between users’ preferences for GBTs and the incremental cost developers are willing to invest has rarely been studied.
According to the above literature and the identified research gaps, there are still some important issues and questions in GBT studies. Firstly, what are the preferences of users and the market for GBTs? On the other hand, from a developer’s perspective, how should the cost-benefit assessment of these preferred GBTs be measured in the GB projects?
China’s GB standards began with the assessment standard for green buildings (GB/T50378-2006) implemented in June 2006 (Zhang et al., 2018). In August 2007, the Ministry of Construction released the GB Evaluation Technical Regulations (for trial implementation) and the GB Evaluation Management Measures. Following Beijing, Tianjin, Chongqing, and Shanghai, more than 20 provinces and cities issued local standards, widely promoting GB standards (Li et al., 2021). As one of China’s most economically developed regions, the Yangtze River Delta is one of the most active regions for GB implementation. In order to achieve its carbon peak and carbon-neutral goals, the Chinese government has increased its promotion of GBs and proposed the Carbon Reach Action Plan by 2030, requiring the full implementation of GB standards for new buildings in urban areas by 2025. In previous developments, many developers have invested in energy-efficient technologies to meet China’s GB certification, blindly “(piling) on” technologies to meet the standards (Lu et al., 2018). Therefore, it is not difficult to imagine that more developers will invest in more diverse forms of technology to meet the more stringent GB energy efficiency standards in the future.
The latest version of China’s Assessment standard for GB (GB/T50378-2019) sets certification requirements for GBs in terms of six major components: safety and durability, health and comfort, the convenience of living, and resource conservation, environmental livability, and improved innovation. Since applying GBTs has climatic and regional differences, the Yangtze River Delta is considered cold winter and hot summer region in the building climate zoning of China. Therefore, this study selected 13 residential projects in the Yangtze River Delta that have been certified as GBs in China in the past 2 years Table 1 presents a summary of the 21 technologies commonly used in GBs (certified) in residential projects.
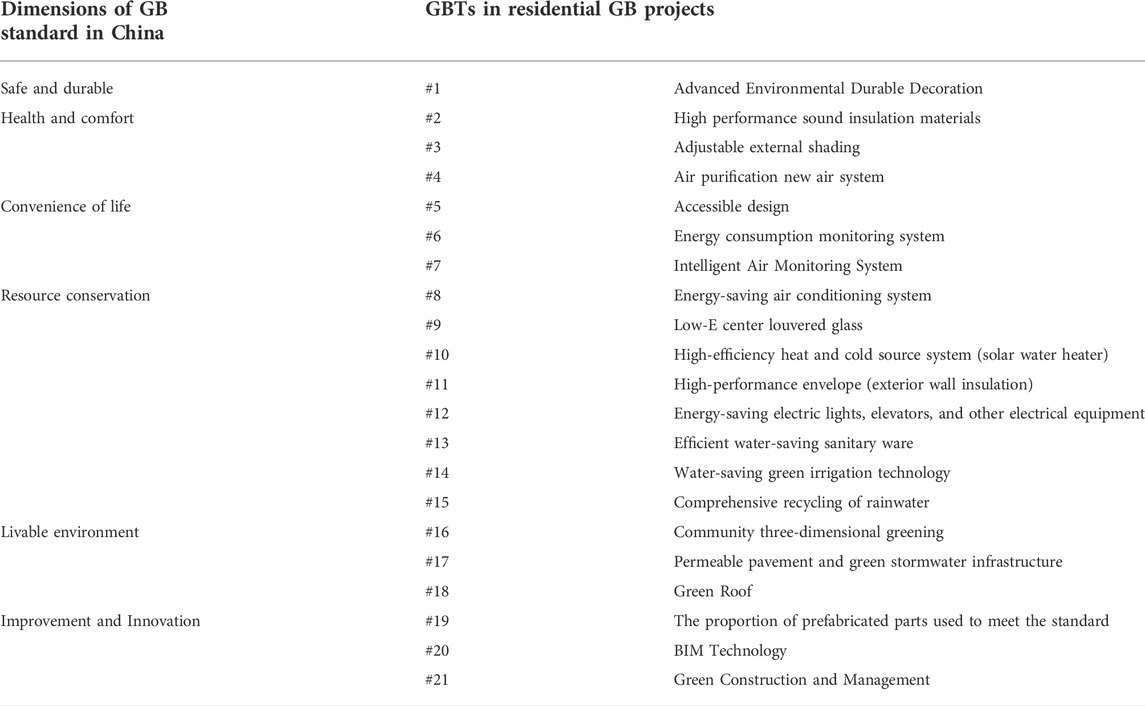
TABLE 1. GBTs for green settlements in the Yangtze River Delta.
According to the purpose of the research, this study attempts to explore the user preferences for GBTs and the cost-benefit analysis of GBTs in GB projects. In view of user preferences, many previous studies have proposed various qualitative and quantitative methods for mining user needs. Qualitative methods focus on understanding user needs through observation, interview, and user experience analysis (Park et al., 2013), while quantitative methods have attracted more attention in recent years by using the Kano model to classify and rank user needs, which has been widely used in various fields (Juan et al., 2019; Lu & Juan, 2021; Xu & Juan, 2021). As for cost-benefit analysis, the zero-one integer programming (ZOIP) method, an important branch of management science, is suitable for dealing with the optimization problem of scheme selection under a limited budget, and has mature applications in the construction field (Juan et al., 2021). Therefore, this study adopts these two methods to explore user preferences for GBTs and the cost-benefit analysis respectively.
The Kano model, a popular approach in product and service design, was proposed by Noriaki Kano in 1984, which can effectively identify and classify user requirements and rank them optimally. In this study, the Kano model is used to identify and classify users’ preferences toward GBTs summarized in the previous section. The Kano model divides quality attributes into five categories:
1) One-dimensional attribute: If the technology presents this attribute characteristic, it means that the more (better) the technology provides, the higher the user satisfaction and vice versa.
2) Attractive attribute: the more (better) the technology of this type of attribute is provided, the higher the user satisfaction; if less is provided, the user satisfaction will not decrease.
3) Must-be attribute: users consider this type of technology mandatory and will cause great dissatisfaction if not provided.
4) Indifferent attribute: This refers to technologies that do not help increase user satisfaction regardless if provided or not.
5) Reverse attribute: The more techniques of this type of attribute are provided, the more dissatisfied users will be.
Conducting the Kano model requires an establishment of a questionnaire that consists of positive/functional and negative/dysfunctional questions. The respondent can answer a pair of questions in one of five different ways, “Like,” “Must-be,” “Neural,” “Live with,” and “Dislike,” for each attribute of a GBT. The first question concerns the reaction of the customer if the GBT has that attribute (positive form); the second involves the reaction if the GBT does not have that attribute (negative form) (Xu & Juan, 2021). The questionnaire is then administered to various respondents, and each answer pair is aligned with the Kano evaluation table, as shown in Table 2, which can reveal each respondent’s perception or preference toward attributes of the GBT.
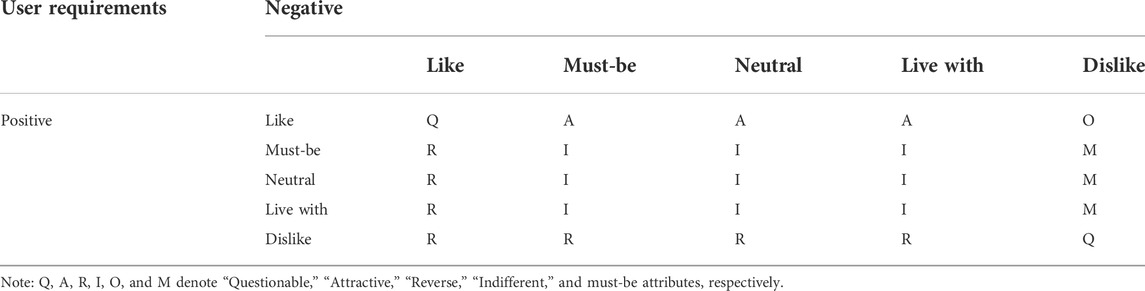
TABLE 2. The kano evaluation table.
In order to further quantify the Kano model, Matzler & Hinterhuber (1998) proposed the concept of Customer Satisfaction Coefficient (CSC). The positive CSC (Better) ranges from 0 to 1, and the closer the value is to 1, the higher the impact of the technology’s attributes on user satisfaction. Conversely, the closer the negative CSC (Worse) is to 1, the greater the effect on user dissatisfaction if the user’s needs for the technology are not met. The Better and Worse coefficients can be calculated by the following equations:
The questionnaire based on the Kano model is used to specify the attribute of the GBTs. On the other hand, the CSC can further quantitatively analyze the weight score of these GBTs of users. Figure 1 presents the CSC weight score assignment schematic. The weight score of attributes in the CSC model is based on the rule of equidistant segmentation proposed by Juan et al. (2019) and Lu & Juan (2021), where the further the points in the same quadrant are from the center, the greater is their weight value.

FIGURE 1. Distribution of CSC score.
In the four quadrants of CSC, the Must-be attribute in the lower right corner means users will be highly dissatisfied if the attribute is not provided; however, user satisfaction will not be increased if provided. The Must-be attributes should first be satisfied to reduce dissatisfaction, so the highest value of the preference score is 10–12. The upper right quadrant represents the One-dimensional attribute, which means that user satisfaction increases with the increase of the attribute provided. On the contrary, the less the attribute is provided, the more the satisfaction decreases. Compared to Must-be attribute, its importance is slightly lower. Hence, the GBTs that fall in this area are given moderately important scores (e.g., 7, 8, 9). In addition, the upper left quadrant belongs to the Attractive attribute, which means that the more technologies are provided in this area, the higher the satisfaction of users; meanwhile, the less it is provided, the less the satisfaction will be. The GBTs that fall in this area are given slightly important scores (e.g., 4, 5, 6). The last quadrant in the lower-left corner is an Indifferent attribute, which is generally chosen to be ignored. Due to the improvement of GB evaluation standards, a certain amount of technical support is needed to ensure compliance, so a minimum score of 1-3 is given in this category.
To test the market validity of the Kano model and CSC model decisions, this study uses Zero-one integer programming (ZOIP) approach to explore the relationship between the incremental cost and the user preference (CSC score) of GBTs for real development cases. ZOIP is a type of linear operation in management and operations research. It is used to solve programming with integer values of variables limited to 0 or 1 (Williams, 2002). To some extent, it has also been employed for solving multi-criteria problems. It is particularly effective for situations where projects are mutually exclusive and have interdependent technologies (Siu et al., 2016).
This study measures the relationship between incremental cost and user preference with GBTs from developers’ perspectives (i.e., users’ preference score for GBTs is considered with a fixed incremental cost budget). It is calculated as follows.
where Kj is the users’ preference (CSC score) for GBT j; aj is the incremental cost of GBT j; b is a limited budget of incremental costs; and Xj is the decision variable for GBT j.
In order to test the effectiveness of this system framework, an upcoming residential development project in Ningbo, a city in the Yangtze River Delta, China, was selected as a case study, as shown in Figure 2. The site is located in the core area of the northern part of Ningbo Yongjiang Science and Technology Innovation Corridor, surrounded by several universities and technology industrial parks, which is the main residential area attracting the population to settle in Ningbo in the future. The east of the site is a new community built in recent years, with a population of 11,000 residents. The site covers an area of 52,700 square meters, with 1,000–1,100 residential units. With the growing foreign population in the Yangtze River Delta, developers are highly willing to provide residential units with 100 square meters to meet the rigid housing demand of the moving-in population.
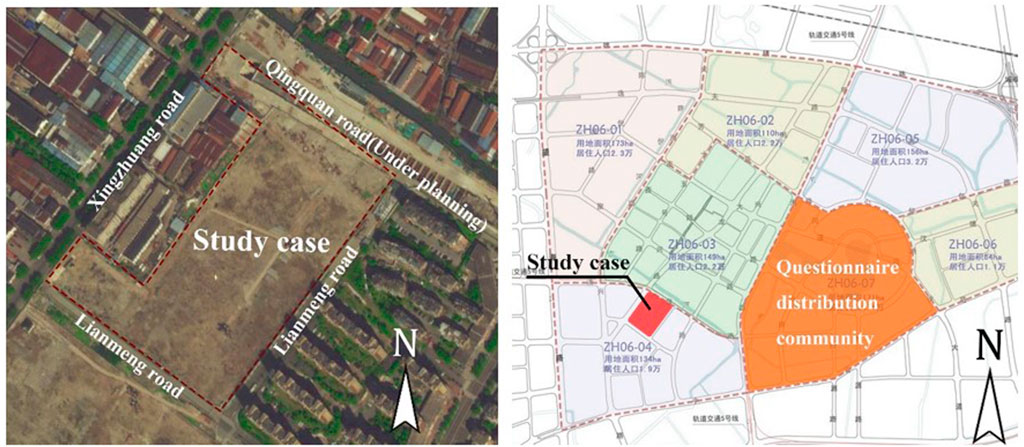
FIGURE 2. Environmental characteristics of the case study.
In this study, 250 questionnaires based on the Kano model were distributed to the residents of the existing community on the east side of the site. They were all local residents willing to buy a housing unit in the next 5 years. Among all questionnaires, 171 were valid. Considering that most respondents were not professional enough to know about GBTs, each question was explained and described to enhance their understanding. In addition, among the 21 technologies, three (#19, #20, and #21) were removed from the questionnaire because they were more related to professional construction technologies and had a slight relationship with users’ experience. Therefore, only the first 18 items were selected for study in the follow-up questionnaire.
Furthermore, a reliability analysis was conducted for the Kano model forward/reverse questions using SPSS, respectively, to ensure the rigor of the study. The standardized Cronbach’s α coefficient for the positive questions was 0.831, while that for negative questions was 0.905. The results indicate that the quality of data reliability passed the test and can be used for further research.
The questionnaire results were calculated using the Kano model and CSC, as shown in Figure 3. The user preference (CSC score) is shown in Table 3. Further, the study conducted interviews on this result and obtained some findings.
1) Among the top five items, the first three items, #1, #5, and #2, were closely related to the quality of the indoor environment used by users. As for Item #17, respondents reported that Ningbo has a lot of rainfall, especially in the summer typhoon weather, where waterlogging and flooding occur, so permeable pavement was necessary. Item #16 was also closely related to the quality of the outdoor environment for users. It is apparent that the first five items are directly related to occupants’ life experience, and the rest of the GBTs mostly favor energy-saving effects.
2) Developers did not expect that the “#4 New air system” and “#9 Low-E center louvered glass” also belong to indoor environmental quality improvers, which incurred high costs. Hence, it fell into the quality of Indifference. This result may be related to the local climate and living culture. For instance, most households believe that Ningbo is windy in all seasons, and opening windows for ventilation might be more efficient than the new air system for air exchange. In addition, the Low-E center louvered glass is a new technology based on the traditional Low-E glass. Developers have employed this technology in recent years to improve the effect of shading and insulation. However, many users found that the Low-E center louver glass was aesthetically low, and the device controlling the louvers was difficult to operate and repair, resulting in more confusion for users to adopt the technology.
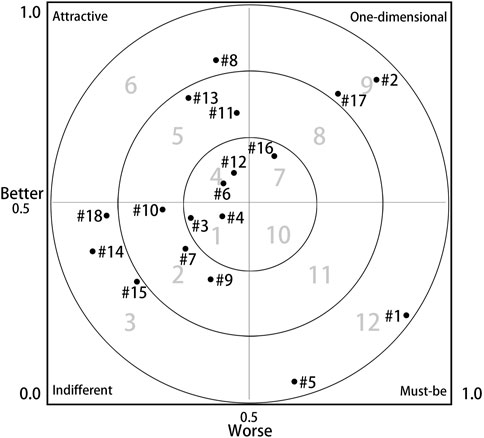
FIGURE 3. CSC satisfaction matrix of GBTs.
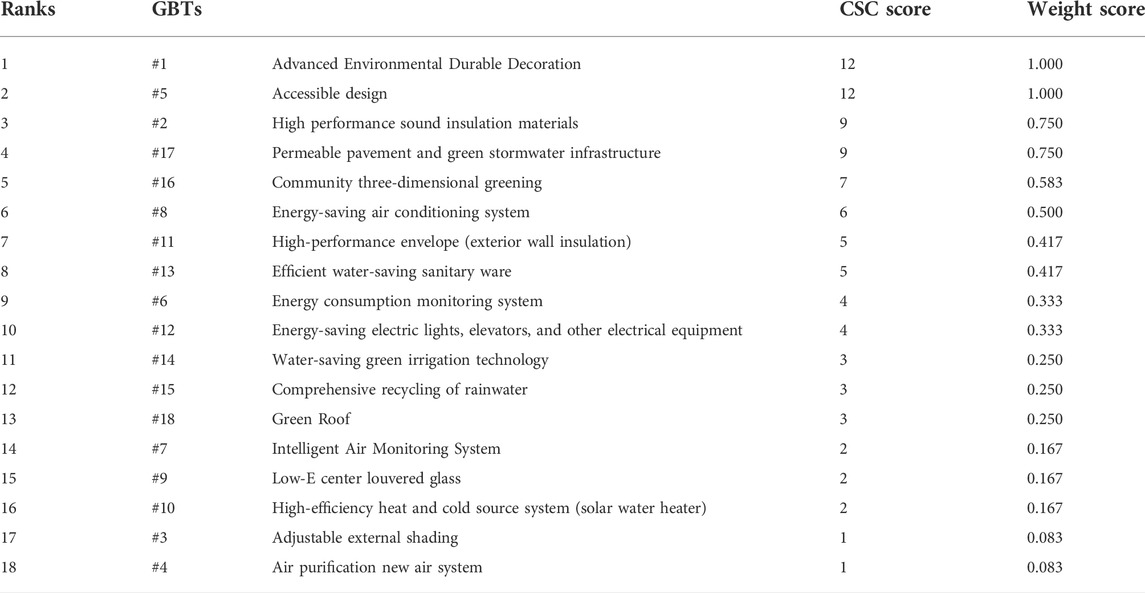
TABLE 3. User preference (CSC score) of GBTs.
Based on the user preference evaluation of the 18 GBTs provided by the CSC results, the research team invited experts and developers to explore the relationship between technology cost and user preference. In particular, four long-time residential architects (two of whom are working on this project), three university architecture academics, and two developers were invited to discuss and specify the incremental cost per unit area (m2) of each GBT, as shown in Table 4.
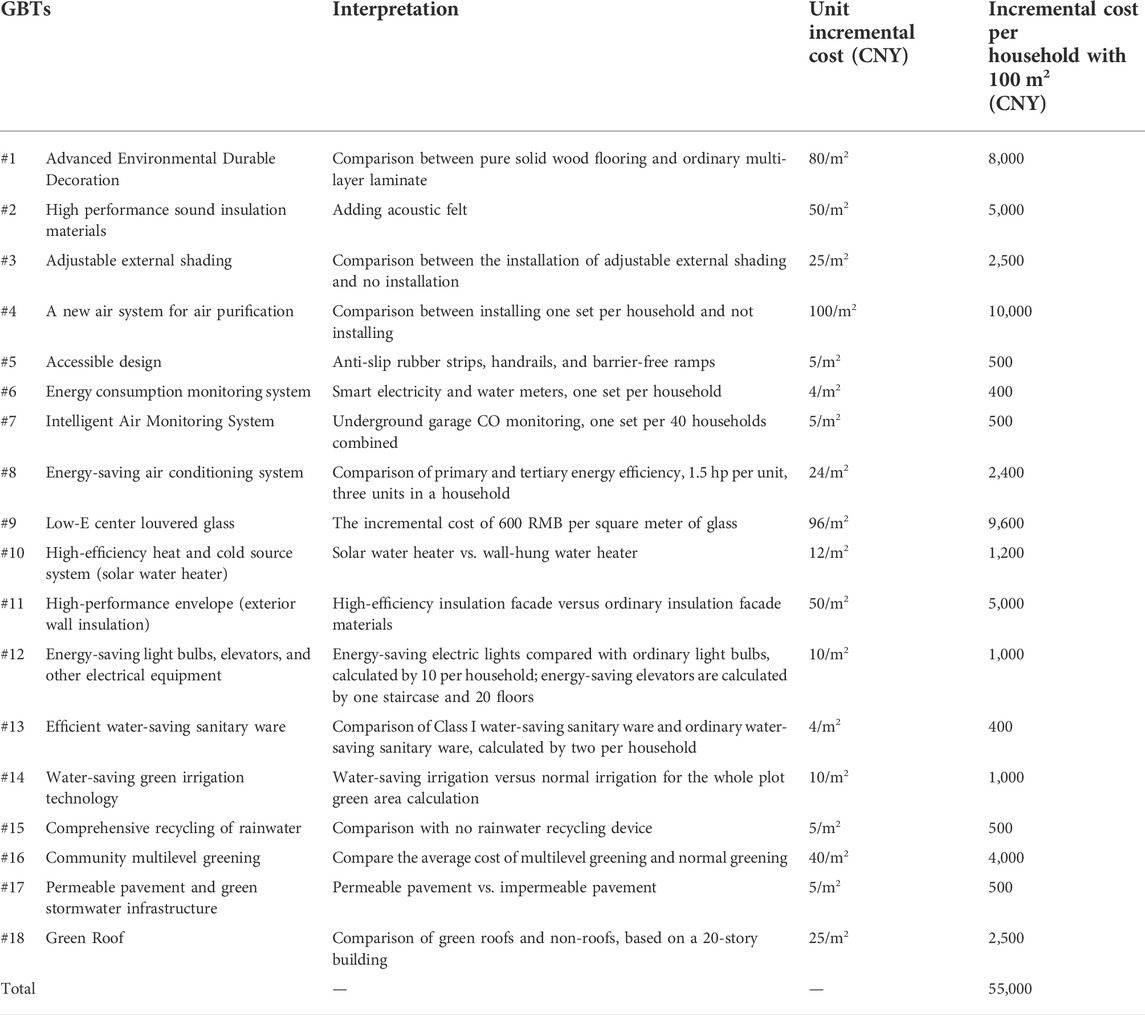
TABLE 4. The incremental cost information of GBTs.
In an open-ended interview, the research team asked the following questions and invited developers and architects to conduct in-depth interviews.
• Which part is your biggest difficulty in choosing GBTs?
• Which indicators will be assessed in the selection of GBTs?
• Will users’ acceptance or marketability be considered to adopt GBTs in the projects?
• Are you sensitive to the cost of different GBTs?
In the course of the interviews, this study found that deciding on the selection of GBTs is a critical and difficult issue for respondents. For example, they could not judge what investments were made to achieve the GB certification level within a limited budget and increase owner satisfaction. In addition, the most critical consideration for their choice of GBTs is cost and owner’s acceptance. If the cost is too high, market acceptance or demand is low, developers naturally have no incentive to adopt these GBTs. Therefore, calculating the incremental cost per unit of GBTs and the user preference scores through ZOIP will help developers reasonably select optimal technologies combined with higher user satisfaction at the expected costs.
For the developer in this project, the incremental cost of GBT is expected to be controlled at CNY 250 per square meter (the total budget for a unit is CNY 25,000) to meet the high standard of GB certification. As shown in Table 5, the result of the optimal decision-making revealed that the total CSC weight score could reach 6.33, and the actual cost of selected GBTs would be CNY 24,200. These technologies were not selected mainly because of their poor performance in terms of cost-effectiveness. This study further formulated strategies for evaluating the adoption of GBTs. The result is shown in Figure 4:
• Low-cost and high-scoring GBTs should be prioritized, such as “#5 Accessible design,” “#17 Permeable pavement and green stormwater infrastructure”, and “#2 High-performance sound insulation materials”, implying that the community residents generally had a high demand for the use of outdoor environments.
• High-cost and low-scoring GBTs, such as “#4 Air purification new air system” and “#9 Low-E center louvered glass,” will not be selected. In other words, if GBTs with high costs fail to make users aware of their value, it will also reduce the market acceptance of these GBTs.
• GBTs with high cost but also with high scores have a high chance of adoption, such as “#1 Advanced environmental durable decoration” and “#16 Community three-dimensional greening”, implying that users are willing to pay good GBTs with functionality or value, even if the cost was high.
• Low-cost and low-scoring GBTs still have a chance to be adopted, such as “#7 Intelligent Air Monitoring System”, “#8 Energy-saving air conditioning system,” “#12 Energy-saving electric lights, elevators, and other electrical equipment,” “#13 Efficient water-saving sanitary ware,” “#14 Water-saving green irrigation technology”, and “#15 Comprehensive recycling of rainwater.” This finding may have resulted from the fact that there was still room for low-cost GBTs to be included in the “package” with budget slack.

TABLE 5. ZOIP operations with a budget of 25,000 RMB.
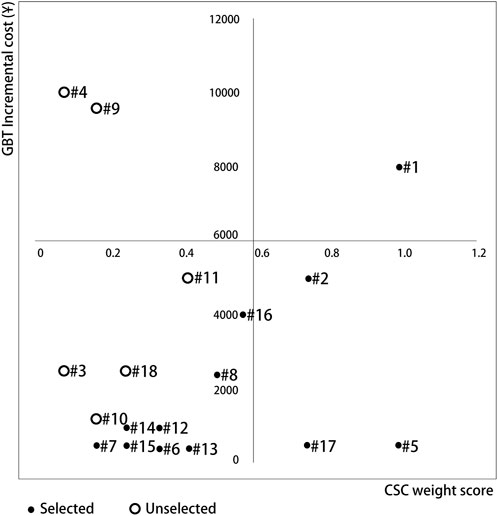
FIGURE 4. Score-cost analysis diagram of GBTs.
In order to verify the benefits of budget allocation, this study conducted a sensitivity analysis using ZOIP to explore the changes in user preference scores under different budget conditions. The result can be utilized as a reference for budget planning for housing developers.
The sensitivity analysis is a method that measures how the impact of uncertainties of one or more input variables can lead to uncertainties on the output variables (Pichery, 2014). Firstly, the input variable of the budget (X, maximum increase up to 30%, CNY 32,500; a minimum decrease of 30%, CNY 17,500) was determined step by step with a budget base of CNY 25,000 per household (100 square meters) in 5% increments. Secondly, ZOIP optimization was performed under different budget conditions to obtain the total CSC weight scores (output variable, Y). Lastly, the sensitivity of the analysis was conducted by plotting the relationship between budget and score changes, as shown in Table 6 and Figure 5. Sensitivity analysis is performed using the following formula: X = budget difference/baseline budget, and Y = score difference/baseline score, at ± 30% level in the changes.
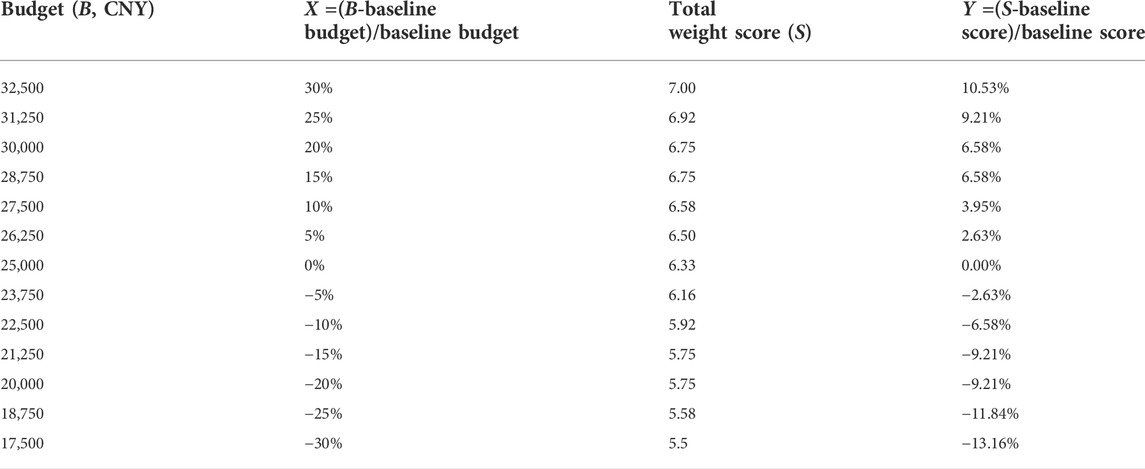
TABLE 6. Sensitivity analysis of budget and score changes.
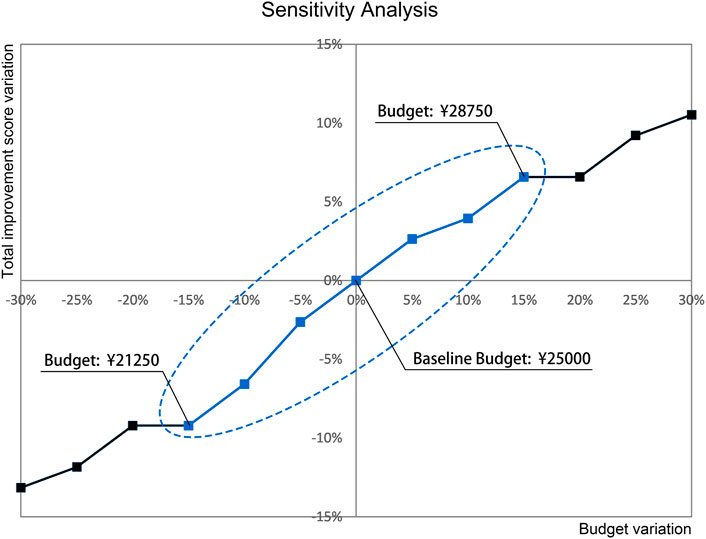
FIGURE 5. Results of sensitivity analysis.
As presented in Figure 5, if the developer increased the budget, more GBTs could be selected, and the score could also be higher. When the budget changes were between −15% and 15%, the overall line slope was large, indicating that increasing the budget investment in this range can effectively improve the score (user satisfaction). Outside the range, when the developer increased the budget by more than 15% (CNY 28,750), the score increased, and the slope of the score also decreased, indicating that despite the developer investing more money, the increase in user satisfaction was not significant. On the contrary, if the developer’s budget were reduced by 15%, user satisfaction would not decrease significantly.
The sensitivity analysis results indicate that if the developer can control the budget of GBTs adoption for each housing unit between CNY 21,250 and CNY 28,750, the company can acquire the optimal GBTs adoption solutions with acceptable user satisfaction. Furthermore, the results of this study can provide developers with a more effective and flexible budget allocation mechanism, thus reducing the waste of costs, technology, and human resources.
The results showed that the top five GBTs were directly related to indoor and outdoor environmental quality. Compared with energy-saving technologies, users were more willing to pay for the green premium of comfort, health, and productivity brought by GBTs. Although this conclusion differed from the emphasis on energy conservation research in developed countries, it seemed more consistent with the past research on GB in China. For instance, Hu et al. (2014) also conducted a survey on GB housing in Nanjing, China and found that residents considered healthy and environmentally friendly building materials the most important. This finding was also in accordance with the “#1 Advanced Environmental durable decoration” (ranked first) in this study. Similarly, Zhang et al. (2020) carried out a survey on green hotels in Beijing, China and found that customers had the highest willingness to pay for GB’s indoor environmental quality. The study of Kyu-in and Dong-woo (2011) on residential users of green buildings in South Korea found that residents paid much attention to non-toxic materials and the sound-absorbing performance of buildings, which was consistent with the top two results (#1 and #2) in this study.
Notably, the “#5 Accessible design” ranked second among the CSC scores, probably because many respondents believed barrier-free design is necessary for senior housing, in addition to the provisions of building regulations. This result may have a certain relationship with the aging of Chinese society and also reflects the public’s increasing attention to the fairness of use. Another interesting finding was that “#17 Permeable pavement and green stormwater Infrastructure” ranked fourth. Interviews revealed that residents were concerned about the increasing incidence of extreme rainstorms causing urban waterlogging. In particular, under the influence of extreme global weather, the frequent heavy rains and urban waterlogging in many of China’s megacities have drawn great attention from the Chinese government. In 2015, China launched the “Sponge City Plan” to continuously promote and strengthen the construction of urban groundwater permeability and green infrastructure. Its promotion and publicity have directly strengthened public awareness and residents’ attention.
However, “#9 Low-E center louvered glass” and “#4 Air purification new air system,” which have been widely promoted in recent years, were not popular among users. Although numerous studies have shown that households were highly concerned about clean air and temperature, the high cost may affect their willingness to adopt. This inclination might also be related to the humid and windy climate of the local Ningbo city under investigation. Some residents who have used the fresh air system believe that the natural ventilation of the building is better than the fresh air system. For instance, Tong et al. (2016) conducted a study on natural ventilation in 35 cities in China. They found that the natural ventilation conditions in Ningbo have a large energy-saving potential, which may explain why the respondents were more accustomed to natural ventilation.
According to the score-cost analysis diagram of GBTs in Figure 4, GBTs with low cost and high preference, high-cost and low-cost comfort, and low energy-saving should be adopted preferentially. This result was fully in line with the concept of differentiation strategy in the competitive strategy proposed by Porter (1985), which means that low-cost and high-benefit strategies should be given priority, and high-cost strategies need to consider the market value. In addition, users must also decide their adoption priority order. It is worth noting that between basic health and comfort and energy-saving, people usually pay more attention to health and comfort. However, with the mandatory promotion of China’s GB standards, the public’s awareness of energy conservation is increasing, maintaining the opportunity to increase the adoption of energy-efficient GBTs in the future.
In the next few years, China is expected to have 1 billion square meters of new residential floor areas per year. Facing emerging environmental issues such as global warming and energy consumption, the Chinese government continues to raise energy efficiency standards and requirements for the construction industry. GB certification for residential buildings has become an important guarantee for achieving carbon peaking and carbon-neutral targets in most regions of China. Thus, to meet China’s GB certification standards, developers blindly pile on all kinds of GBTs to obtain higher GB scores. However, occupants’ experience regarding GBTs benefits is often ignored—occupants often change the designs after moving in. This process has resulted in a lot of waste of money, materials, and manpower, causing unnecessary losses to developers and users.
The novelty and three main contributions of this study are described below. First, we construct a method based on the Kano model and CSC to effectively mine user needs, and apply it to the selection of GBTs, which can help developers and architects understand users’ preferences for GBTs. The results showed that occupants were interested in technologies that can directly improve the quality of indoor and outdoor space use, and they were more concerned about adopting energy-saving technologies with acceptable incremental costs. Second, we develop a cost-benefit decision-making model based on ZOIP, which can provide a systematic framework for developers to effectively control the incremental costs and benefits of GBs. Last and foremost, developers can pay more attention to users’ perceptions and evaluations of the GBTs in the pre-design stage while making delivery more attractive and cost-benefit housing products to improve their competitive advantages in housing markets; the government can also use this method to encourage developers to launch more GB projects in an efficient way after considering building regulations, market and technical aspects.
It is also worth noting that there are still some limitations in the practical application of this study. First, this study focused on greenhouses in China’s Yangtze River Delta region, which is unique and whose approach does not necessarily apply to the pre-design simulation analysis of greenhouses in different regions. The implementation of GB and the selection of GBTs are highly localized. Although this study uses this region as a case study, the proposed decision model might be adjusted and applicable according to different local standards, construction conditions, and climate characteristics in different regions. More cases can be selected in the future to verify the decision-making model proposed in this study. Second, this study focused on occupants, developers, and designers, not considering other stakeholders, such as government managers and property managers, who might also affect the success of the GB projects. Furthermore, about 55% cost savings can be achieved in GB design through a reasonable combination of active technology and passive design (Ahmad et al., 2016). However, considering that passive design (e.g., ventilation, orientation, lighting, and form of the building) is mostly dependent on the designers’ ability and tacit knowledge, it is difficult to measure the cost and benefits of passive design quantitatively. Therefore, in the future, it might be possible to incorporate passive technologies into the proposed system to develop a more thorough system Si et al., 2016, Wang et al., 2005.
The original contributions presented in the study are included in the article/supplementary material, further inquiries can be directed to the corresponding author.
HL contributed to investigation, data curation, validation, and writing-original draft preparation. Y-KJ contributed to the conception, methodology and design of the study, as well as writing-original draft preparation, and review and editing. All authors contributed to manuscript revision, read, and approved the submitted version.
The authors are grateful for the funding supported by the National Natural Science Foundation of China under Grant 42101339 and by the Zhejiang Provincial Education Department Scientific Research Program Foundation under Grant Y202043795.
The authors declare that the research was conducted in the absence of any commercial or financial relationships that could be construed as a potential conflict of interest.
All claims expressed in this article are solely those of the authors and do not necessarily represent those of their affiliated organizations, or those of the publisher, the editors and the reviewers. Any product that may be evaluated in this article, or claim that may be made by its manufacturer, is not guaranteed or endorsed by the publisher.
Ascione, F., Bianco, N., De Stasio, C., Mauro, G. M., and Vanoli, G. P. (2015). A new methodology for cost-optimal analysis by means of the multi-objective optimization of building energy performance. Energy Build. 88, 78–90. doi:10.1016/j.enbuild.2014.11.058
Dangana, Z., Pan, W., and Goodhew, S. (May 2013). Energy and the built environment proceedings. .Proceedings of the A decision making system for selecting sustainable technologies for retail buildings, Brisbane, Australia
Doan, D. T., Ghaffarianhoseini, A., Naismith, N., Zhang, T., Ghaffarianhoseini, A., and Tookey, J. (2017). A critical comparison of green building rating systems. Build. Environ. 123, 243–260. doi:10.1016/j.buildenv.2017.07.007
Feng, W., Huang, K., Levine, M., Zhou, N., and Zhang, S. (2014). Evaluation of energy savings of the new Chinese commercial building energy standard. Energy Technologies Area Berkeley, California.
Ge, J., Weng, J., Zhao, K., Gui, X., Li, P., and Lin, M. (2018). The development of green building in China and an analysis of the corresponding incremental cost: A case study of Zhejiang province. Lowl. Technol. Int. 20 (3), 321–330.
Ge, J., Zhao, Y., Luo, X., and Lin, M. (2020). Study on the suitability of green building technology for affordable housing: A case study on Zhejiang province, China. J. Clean. Prod. 275, 122685. doi:10.1016/j.jclepro.2020.122685
Gossard, D., Lartigue, B., and Thellier, F. (2013). Multi-objective optimization of a building envelope for thermal performance using genetic algorithms and artificial neural network. Energy Build. 67, 253–260. doi:10.1016/j.enbuild.2013.08.026
Hu, H., Geertman, S., and Hooimeijer, P. (2014). The willingness to pay for green apartments: The case of Nanjing, China. Urban Stud. 51 (16), 3459–3478. doi:10.1177/0042098013516686
Huang, B., Yang, H., Mauerhofer, V., and Guo, R. (2012). Sustainability assessment of low carbon technologies–case study of the building sector in China. J. Clean. Prod. 32, 244–250. doi:10.1016/j.jclepro.2012.03.031
Juan, Y. K., Chi, H. Y., and Chen, H. H. (2021). Virtual Reality-based decision support model for interior design and decoration of an office building. Eng. Constr. Archit. Manag. 28 (1), 229–245. doi:10.1108/ECAM-03-2019-0138
Juan, Y. K., Gao, P., and Wang, J. (2010). A hybrid decision support system for sustainable office building renovation and energy performance improvement. Energy Build. 42 (3), 290–297. doi:10.1016/j.enbuild.2009.09.006
Juan, Y. K., Hsing, N. P., and Hsu, Y. H. (2019). Applying the Kano two-dimensional model and quality function deployment to develop sustainable planning strategies for public housing in Taiwan. J. Hous. Built Environ. 34 (1), 265–282. doi:10.1007/s10901-018-9627-0
Juan, Y. K., Hsu, Y. H., and Xie, X. (2017). Identifying customer behavioral factors and price premiums of green building purchasing. Ind. Mark. Manag. 64, 36–43. doi:10.1016/j.indmarman.2017.03.004
Leaman, A., and Bordass, B. (2007). Are users more tolerant of ‘green’buildings? Build. Res. Inf. 35 (6), 662–673. doi:10.1080/09613210701529518
Lee, K. I., and Yeom, D. W. (2011). Comparative study for satisfaction level of green apartment residents. Build. Environ. 46 (9), 1765–1773. doi:10.1016/j.buildenv.2011.02.004
Li, Y., Rong, Y., Ahmad, U. M., Wang, X., Zuo, J., and Mao, G. (2021). A comprehensive review on green buildings research: Bibliometric analysis during 1998–2018. Environ. Sci. Pollut. Res. 28 (34), 46196–46214. doi:10.1007/s11356-021-12739-7
Lu, H., and Juan, Y. K. (2021). Applying the DQI-based Kano model and QFD to develop design strategies for visitor centers in national parks. Archit. Eng. Des. Manag., 1–18. doi:10.1080/17452007.2021.2015279
Lu, S., Fan, M., and Zhao, Y. (2018). A system to pre-evaluate the suitability of energy-saving technology for green buildings. Sustainability 10 (10), 3777. doi:10.3390/su10103777
Mapp, C., Nobe, M., and Dunbar, B. (2011). The cost of LEED—an analysis of the construction costs of LEED and non-LEED banks. J. Sustain. Real Estate 3 (1), 254–273. doi:10.1080/10835547.2011.12091824
Matzler, K., and Hinterhuber, H. H. (1998). How to make product development projects more successful by integrating Kano's model of customer satisfaction into quality function deployment. Technovation 18 (1), 25–38. doi:10.1016/S0166-4972(97)00072-2
Nguyen, H. D., Nguyen, L. D., Chih, Y.-Y., and Le-Hoai, L. (2017). Influence of participants’ characteristics on sustainable building practices in emerging economies: Empirical case study. J. Constr. Eng. Manag. 143 (8), 05017014. doi:10.1061/(ASCE)CO.1943-7862.0001321
Park, J., Han, S. H., Kim, H. K., Cho, Y., and Park, W. (2013). Developing elements of user experience for mobile phones and services: Survey, interview, and observation approaches. Hum. Factors Man. 23 (4), 279–293. doi:10.1002/hfm.20316
Porter, M. (1985). Competitive advantage: Creating and sustaining superior performance. New York: Free Press. doi:10.1590/S0034-75901985000200009
Seyedzadeh, S., Rahimian, F. P., Oliver, S., Glesk, I., and Kumar, B. (2020). Data driven model improved by multi-objective optimisation for prediction of building energy loads. Automation Constr. 116, 103188. doi:10.1016/j.autcon.2020.103188
Si, J., Marjanovic-Halburd, L., Nasiri, F., and Bell, S. (2016). Assessment of building-integrated green technologies: A review and case study on applications of multi-criteria decision making (mcdm) method. Sustain. Cities Soc. 27, 106–115. doi:10.1016/j.scs.2016.06.013
Siu, M.-F. F., Lu, M., and AbouRizk, S. (2016). Zero-one programming approach to determine optimum resource supply under time-dependent resource constraints. J. Comput. Civ. Eng. 30 (2), 04015028. doi:10.1061/(ASCE)CP.1943-5487.0000498
Tatari, O., and Kucukvar, M. (2011). Cost premium prediction of certified green buildings: A neural network approach. Build. Environ. 46 (5), 1081–1086. doi:10.1016/j.buildenv.2010.11.009
Tong, Z., Chen, Y., Malkawi, A., Liu, Z., and Freeman, R. B. (2016). Energy saving potential of natural ventilation in China: The impact of ambient air pollution. Appl. energy 179, 660–668. doi:10.1016/j.apenergy.2016.07.019
Unep, S. (2009). Buildings and climate change. United Nations Environment Programme. Nairobi, Kenyahttp://admin.indiaenvironmentportal.org.in/files/SBCI-BCCSummary.pdf.
Wang, W., Zmeureanu, R., and Rivard, H. (2005). Applying multi-objective genetic algorithms in green building design optimization. Build. Environ. 40 (11), 1512–1525. doi:10.1016/j.buildenv.2004.11.017
Wbcsd, (2008). Energy efficiency in buildings, business realities, and opportunities. The World Business Council for Sustainable Development.Geneva,Switzerland http://sustainca.org/sites/default/files/EEffPu-WBCSD.pdf.
Williams, J. C. (2002). A zero one programming model for contiguous land acquisition. Geogr. Anal. 34 (4), 330–349. doi:10.1111/j.1538-4632.2002.tb01093.x
Wu, W., Guo, J., Li, J., Hou, H., Meng, Q., and Wang, W. (2018). A multi-objective optimization design method in zero energy building study: A case study concerning small mass buildings in cold district of China. Energy Build. 158, 1613–1624. doi:10.1016/j.enbuild.2017.10.102
Xu, Y., and Juan, Y. K. (2021). Design strategies for multi-unit residential buildings during the post-pandemic era in China. Front. Public Health 1515, 761614. doi:10.3389/fpubh.2021.761614
Zhang, L., Wu, J., and Liu, H. (2018). Turning green into gold: A review on the economics of green buildings. J. Clean. Prod. 172, 2234–2245. doi:10.1016/j.jclepro.2017.11.188
Zhang, L., Wu, J., Liu, H., and Zhang, X. (2020). The value of going green in the hotel industry: Evidence from beijing. Real Estate Econ. 48 (1), 174–199. doi:10.1111/1540-6229.12225
Keywords: green building (GB), technology selection, kano model, customer satisfaction coefficient (CSC), zero-one integer programming (ZOIP)
Citation: Lu H and Juan Y-K (2022) Optimal decision-making model for selecting residential green building technologies in China. Front. Environ. Sci. 10:973334. doi: 10.3389/fenvs.2022.973334
Received: 20 June 2022; Accepted: 02 November 2022;
Published: 15 November 2022.
Edited by:
Guangdong Wu, Chongqing University, ChinaReviewed by:
Mário Nuno Mata, Instituto Politécnico de Lisboa, PortugalCopyright © 2022 Lu and Juan. This is an open-access article distributed under the terms of the Creative Commons Attribution License (CC BY). The use, distribution or reproduction in other forums is permitted, provided the original author(s) and the copyright owner(s) are credited and that the original publication in this journal is cited, in accordance with accepted academic practice. No use, distribution or reproduction is permitted which does not comply with these terms.
*Correspondence: Yi-Kai Juan, cmlrQG1haWwubnR1c3QuZWR1LnR3
Disclaimer: All claims expressed in this article are solely those of the authors and do not necessarily represent those of their affiliated organizations, or those of the publisher, the editors and the reviewers. Any product that may be evaluated in this article or claim that may be made by its manufacturer is not guaranteed or endorsed by the publisher.
Research integrity at Frontiers
Learn more about the work of our research integrity team to safeguard the quality of each article we publish.