 Xiumei Zhong
 Xiaowei Xu
 Wenkai Chen1
- 1Lanzhou Institute of Seismology, China Earthquake Administration, Lanzhou, China
- 2Key Laboratory of Loess Earthquake Engineering, China Earthquake Administration and Gansu Province, Lanzhou, China
- 3Department of Civil Engineering and Mechanics, Lanzhou University, Lanzhou, China
The 1927 Gulang Mw8.0 earthquake was one of the largest earthquakes in Gansu, China, which triggered lots of loess landslides. However, the loess of the study area is atypical and different from that of the Loess Plateau. Meanwhile, there are few systematic research studies on the characteristics of these seismic landslides. Combined with previous studies and field investigations, the landslide distribution has been revealed through the visual interpretation of remote sensing images of the study area. The relationships between landslides and various influencing factors have been explored through spatial analysis of geographic information science (GIS). Furthermore, comparisons have been made between the Gulang earthquake landslides and other seismic landslides in the Loess Plateau from macroscopic and microcosmic perspectives. A total of 807 earthquake landslides have been interpreted, with a total landslide area of 256.14 km2. The region with the seismic intensity of Ⅹ is the dominant area of landslide distribution. Also, most landslides are distributed at slope angles of (10° and 40°). The relative elevation difference of (100 m and 300 m) is the high-incidence range of landslides. Compared with seismic landslides in the Loess Plateau, the slope angle and the relative elevation difference of most landslides in the study area are larger. The strength of the loess structure in the study area is stronger than that in the Loess Plateau from the view of physical properties and microstructure.
Introduction
On 23 May 1927, an Mw8.0 earthquake occurred in Gulang County, Wuwei City, Gansu Province, China, with the epicenter located at 37.6°N, 102.6°E (Figures 1A,B). The epicenter seismic intensity reaches Ⅺ degrees and the earthquake hypocenters depth is 12 km (Gu, 1983). The Gulang earthquake is another devastating earthquake, which caused the death of 40,886 people and massive destruction of buildings (Xie et al., 2014), after the 1920 Ms8.5 Haiyuan earthquake in the northeastern margin of the Qinghai–Tibet Plateau (Hou, 1998). The earthquake caused a large number of geological disasters, such as landslides and collapses, some of which caused serious casualties and property loss. For example, the seismic landslide in the lower Huangyang River buried the Dengshan Village, killing 104 people in the village (Zou and Shao, 1994). Likewise, another earthquake landslide in the south of Wuwei blocked the Zamu River, which formed a barrier lake. Also 24 days after the earthquake, the barrier lake broke up, flooding the villages and farmhouses in the north of the Taer Village (Zou et al., 1994). The earthquake-induced landslide hazards, which were mainly located in the loess-covered areas near the epicenter, rippled to Sunan County and Gaotai County, 260 km northwest of the epicenter (Xie et al., 2014).
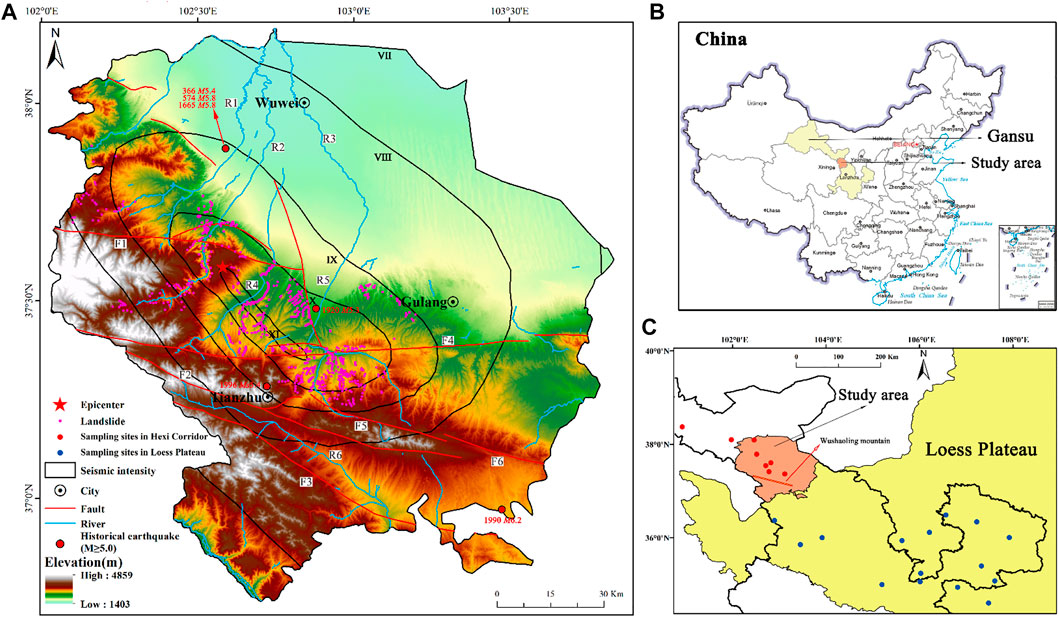
FIGURE 1. Location of the study area, sampling sites, and landslides: (A) Distribution map of landslides triggered by the 1927 Gulang earthquake; (B) location of the study area in China; and (C) the spatial distribution of sampling sites. F1: Huangcheng–Shuangta fault; F2: Jinqianghe fault; F3: Mayaxueshan fault; F4: Tianqiaogou–Huangyangchuan fault; F5: Maomaoshan fault; F6: Laohushan fault; R1: Xiying river; R2: Zamu river; R3: Hongshui river; R4: Huangyang river; R5: Gulang river; R6: Zhuanglang river.
After the earthquake, due to the realistic conditions, there were no professional investigations and only a few relevant records in newspapers, nonprofessional journals, and local county annals at that time. It was not until the late 1970s that some research institutions and scholars conducted detailed investigations and studies on the Gulang earthquake. Over these years, most research studies on the 1927 Gulang earthquake have focused on surface ruptures (Hou, 1998; Hou et al., 1998; Xu et al., 2010), fault structures (Zheng et al., 2004; Liu et al., 2015; Liu et al., 2018; Deng et al., 2020). and seismogenic mechanism (Hou et al., 1999; Dong and Liu, 2017; Guo et al., 2019; Guo et al., 2020; Sun et al., 2021). However, profound studies of the landslides triggered by the Gulang earthquake have not been conducted until about 70 years after the earthquake. Shao and Zou (1994) used the fuzzy comprehensive evaluation method to explore and predict the spatial distribution characteristics of seismic landslides in the Gulang earthquake area, which was consistent with the distribution of the known landslides in the study area in broad terms. Zou et al. (1994) and Zou and Shao (1994) analyzed the main characteristics and distribution of the Gulang earthquake landslides through aerial photograph interpretation and field investigations, and studied the relationship between seismic landslides and tectonic stress field and fault belt, finding that the Gulang earthquake landslides are evidently controlled by fault structures. Chen et al. (1999) studied the distribution characteristics of the Gulang earthquake landslides through field investigations and aerial photograph interpretation and found that the distribution of the seismic landslides is mainly controlled by seismic faults, seismic intensity, topographic slope, rock, and soil types. These studies mainly focused on the distribution of the landslides triggered by the 1927 Gulang earthquake and did make some contributions. However, due to the constraints of the research conditions at that time, the studies on the overall distribution of the Gulang earthquake landslides were relatively crude. Meanwhile, the Gulang earthquake area had complex terrain and landform, undulating topography, and inconvenient traffic, and sophisticated science and technology such as modern satellites were also empty, resulting in past research mainly focusing on a few typical seismic landslides in this area, which made the scope of the research small, and there was no systematic analysis and statistics on landslides. In recent years, in consideration of the lack of precision and breadth of previous studies, Xu J. et al. (2020) and Xu and Xu (2021) used Google Earth to complete the landslide interpretation in the Gulang earthquake area (Ⅷ–Ⅺ degree) and systematically analyzed the spatial distribution of seismic landslides and impact factors of these landslides. Also, the logistic regression model was used to obtain the probability of occurrence of coseismic landslide under different values of peak ground acceleration (PGA). The main contribution of Xu’s research is to explore the development regularities of landslides triggered by the 1927 Gulang earthquake. Nevertheless, Xu’s visual interpretation on Gulang earthquake landslides mainly relied on Google Earth. Also, few approximate locations of partial landslides were determined with the assistance of several historical data. But the vegetation coverage in the study area is low, and there are certain errors in identifying landslides by mainly using remote sensing images, rather than using a comprehensive method including field investigation, historical data analysis, and a combination of remote sensing images and 3D Terrain, which could reduce the errors during interpretation. The current research studies on seismic landslides indicate that only large earthquakes can trigger dense seismic landslides, and medium and large landslides can be preserved for a long time (Xu et al., 2020b). The landslides triggered by medium and small earthquakes are limited in scale, and the impact on the interpretation of seismic landslides triggered by large earthquakes could be basically negligible (Du et al., 2020). The overall spatial distribution of landslides triggered by the 1927 Gulang earthquake is generally clear. However, this earthquake area is covered by atypical loess, and loess is the material that is highly susceptible to earthquakes (Keefer, 1984). The loess in the study area is significantly different from that in the Loess Plateau. The huge differences might make the characteristics of the loess landslides triggered by the 1927 earthquake different from the typical loess seismic landslides. However, there is almost no relevant research on the difference between the characteristics of the loess landslides triggered by the 1927 earthquake and that of the typical loess seismic landslides. So, it is of great significance to study the difference between the 1927 Gulang earthquake landslides and the coseismic landslides in the Loess Plateau. In this study, the data of seismic landslides were obtained by visual interpretation of remote sensing images through historical records and field investigations to perform comparative work with the seismic landslides in the Loess Plateau.
The loess in the study area is atypical, and the loess seismic landslides of the study area are different from those in the Loess Plateau. For typical loess landslides, the monitoring and warning of loess landslides geological hazards (Wang et al., 2022) and the establishment of a landslide distribution database in the Loess Plateau (Xu et al., 2020c) have been mainly carried out, including the loess landslide hazard assessment (Zhuang et al., 2016), spatial distribution prediction of loess landslides (Huang et al., 2021), drawing landslide hazard distribution maps (Peng et al., 2019), and so on based on GIS (Li et al., 2021). The research results show that the loess landslides in the Loess Plateau are characterized by large scale, large quantity, gentle slope angle, and long sliding distance (Yan et al., 2021); particularly, the influence of soil is the key for loess landslides to have these characteristics. However, the loess landslides triggered by the Gulang earthquake are mainly distributed in the area of north Wushaoling mountain, where the genesis of the loess includes moraine influence, water transportation, and wind transportation. Therefore, its component, particle composition, and physical properties are very different from those of the typical loess in the Loess Plateau.
This study aims to analyze the characteristics of loess landslides triggered by the Gulang earthquake, study the influencing factors and mechanism of these landslides, and explore the differences between the loess landslides triggered by the Gulang earthquake and those triggered by earthquakes in the Loess Plateau. For this aim, the loess landslides triggered by the 1927 Gulang earthquake were taken as the research object, and the loess landslides data were obtained based on the visual interpretation of remote sensing images. Through the ArcGIS spatial analysis function, 807 loess landslides triggered by the Gulang earthquake were made statistics and the influencing factors such as seismic intensity, slope angle, elevation, slope aspect, fault belt, water system, and relative elevation difference were analyzed. The seismic intensity, slope angle, and relative elevation difference of the landslides triggered by the Gulang earthquake were compared with those of the loess landslides triggered by the 1718 Tongwei earthquake and the 1920 Haiyuan earthquake. In addition, the mechanism of loess landslide triggered by the Gulang earthquake with high slope angle and large relative elevation difference was studied based on the comparison of particle size, density, moisture content, and microstructure of loess between the two regions. This research results can provide basic theoretical bases for the scientific site selection and design of major projects in the loess region of the study area, and have important practical significance and scientific value for promoting community safety and sustainable development of urbanization and man–earth harmony in the loess region.
Background
The study area includes Gulang County, Liangzhou District, and Tianzhu County in Wuwei City, Gansu province, China. It is located in the eastern Hexi Corridor and the midwestern Gansu Province, with a total area of 16,511.92 km2. Located in the northeast margin of the Qinghai–Tibet Plateau, tectonic deformation caused by the collision between the Indian Plate and the Eurasian Plate is very strong in this region. Also, it is the region where two geomorphic units of the Qinghai–Tibet Plateau and the Loess Plateau intersect, with frequent seismic activity and some destructive earthquakes in history, such as the 1927 Gulang Mw8.0 earthquake and the 1990 Tianzhu Ms6.2 earthquake (Pei et al., 2015).
The terrain and landform of the study area are complex, with undulating topography. In general, the local elevation is high in the southwest, low in the northeast, and highest in the west. The lowest altitude is 1,403 m, the highest altitude is 4,859 m, and the average altitude is approximately 3,100 m. The northeast part of the study area mainly experiences temperate continental arid climate with long drought and little rain, sufficient sunshine, and a large temperature difference between day and night. The southwest part experiences a combination of continental plateau monsoon climate and continental semi-arid climate with cool in summer; large interannual variation in rainfall; and dry, cold, and sunny in winter. The whole study area is located in the hinterland of northwest China and far away from the water vapor source with long dry and little rain due to the barrier of the mountains of the Qinghai–Tibet Plateau. There are many rivers in the study area, including Xiying river, Jinta river, Zamu river, Huangyang river, Gulang river, Dajing river, and their tributaries.
Figure 1A shows the seismic intensity distribution of the Gulang earthquake. The intensity of the meizoseismal area is Ⅺ degree, with an area of 108.37 km2. The area of Ⅹ degree is 1,295.35 km2, and the landslides triggered by the Gulang earthquake are mainly distributed in it. The area of Ⅸ degree is 2,568.02 km2, and the area of Ⅷ degree is 8,127.22 km2.
Data and methods
In recent years, Google Earth has been widely used in geoscience studies, especially in landslide hazard studies (Gao et al., 2020; Xu et al., 2021; Chen et al., 2022; Li et al., 2022). The very high spatial resolution satellite images cover the whole study area and contain multiple time periods, which ensure enough satellite images for landslide interpretation. The remote sensing images used in this study are from the 19th level data of Google Earth in 2016, with 93 pixels, 72 dpi image resolution, 0.54 m spatial resolution, and 1500:1 scale. The DEM data used in this study are ASTER GDEM 30M, which is released in 2009. The data on seismic intensity refer to the previous study (Liu et al., 2015). The data on the water system come from National Cryosphere Desert Data Center (http://www.ncdc.ac.cn/portal/). The data on fault come from the Seismic Active Fault Survey Data Center (http://www.activefault-datacenter.cn/).
Before interpreting the landslides, the previous studies and field investigation data based on GIS had been referred to. The Lanzhou Institute of Seismology, China Earthquake Administration has conducted several systematic field investigations in the last century and made detailed records. A detailed review had been made of them in this research. On the one hand, the field investigations in the typical dense seismic landslide areas recorded in other research and other dense seismic landslide areas recorded in the historical data have been conducted. On the other hand, systematic field investigations, including investigations of seismic landslides, and engineering geological and hydrogeological conditions, had been conducted in the study area. After determining whether these landslides were caused by the 1927 earthquake, we then interpret them. Furthermore, we checked the interpreted results of seismic landslides in ArcGIS during later investigations.
The vegetation coverage in the study area is low, and most of the plants are short herbs. The study area has complex and diverse landform types with many mountains and hills in the southwest. In view of the abovementioned information, it is good for visual interpretation of seismic landslides. Most visual interpretations are focused on the dense seismic landslide areas. During the process of visual interpretation of seismic landslides on remote sensing images in ArcGIS, the 5 m contour map was generated from the DEM of the study area, which makes it easy to find the traces of the loess seismic landslides. In the contour map, the contour lines within the scope of a landslide usually show two characteristics: 1) The contour lines at the trailing edge of the landslide are dense and the contour lines of the landslide mass are loose; 2) The middle part of the contour lines is concave or convex, especially those at the trailing edge of the landslide. The seismic landslide shows armchair-shaped features and is presented in an arc shape in the remote sensing images (Li et al., 2015). At the same time, combined with the Google Earth 3D view, the special shapes and different hues can be easily identified, which makes it better to identify whether it is a seismic landslide and also makes the visual interpretation range of the landslide clearer. The correctness of the interpretation of seismic landslides was verified through field investigations during the interpretation. Figure 2 shows the flowchart of the visual interpretation of a landslide. After all the interpretation, the spatial analysis function of ArcGIS was used for statistical analysis of landslide number and landslide area to obtain the correlations between influencing factors (seismic intensity, slope angle, elevation, slope aspect, fault belt, water system, and relative elevation difference) and seismic landslides. In this study, the spatial distribution of seismic landslides is analyzed by using four indicators: landslide number (LN), landslide area (LA), landslide number density (LND), and landslide area density (LAD). LND, which means the identified landslide number divided by the total area of the corresponding influencing factor, can reflect the density of seismic landslide distribution. LAD, which means the identified landslide area divided by the total area of the corresponding influencing factor, can reflect the scale of seismic landslide.
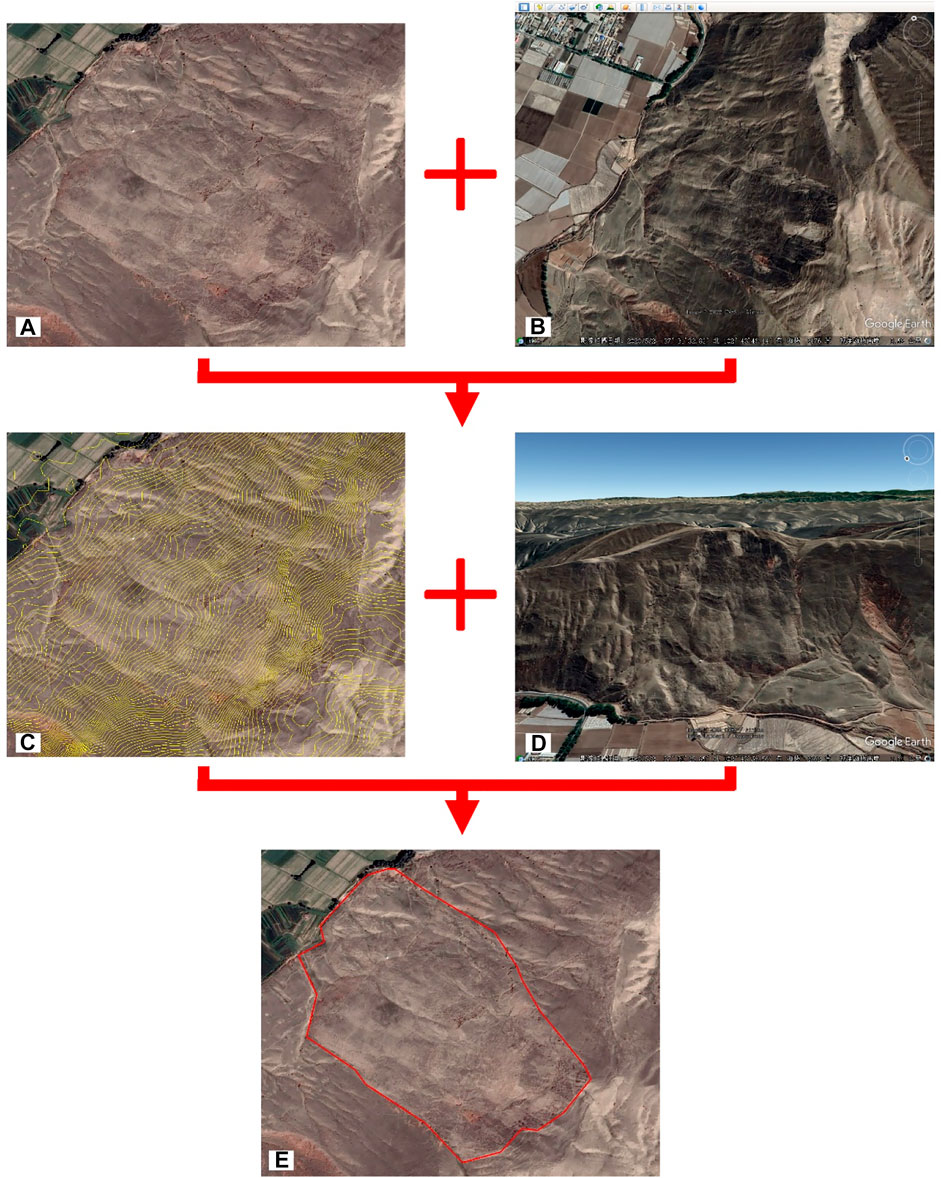
FIGURE 2. Visual interpretation on a landslide. (A) Remote sensing image in ArcGIS; (B) satellite image in Google Earth; (C) 5 m contour line map; (D) 3D view of Google Earth; and (E) the final interpreted landslide.
Results
There are 807 interpreted seismic landslides (Figure 1A), with a total area of 256.14 km2. Among them, the biggest area of a landslide is 5.22 km2, the smallest area of a landslide is 2.35 × 10⁻³ km2, and the average area of a landslide is 3.17 × 10⁻¹ km2. According to the statistical results, the seismic landslides in the study area are mostly medium and large landslides (the area of a landslide is between 104 m2 and 106 m2) (Li and Mo, 2019). The area of a landslide greater than 1 km2 is an extremely large landslide (Li and Mo, 2019), and there are only 61 such landslides, accounting for 7.56% of the total landslides. The number of landslides with an area of a landslide between 104 and 106 m2 is the largest, accounting for 91.82% of the total landslides. Among them, the number of landslides with an area of a landslide between 105 and 106 m2 is 399, accounting for 49.44% of the total landslides, and the number of landslides with an area of a landslide between 104 and 105 m2 is 342, accounting for 42.38% of the total landslides. If the area of a landslide is smaller than 104 m2, it is a small landslide (Li and Mo, 2019), and there are only five such landslides. The interpreted seismic landslides were taken to kernel density estimation. The system selected the optimal radius of 2,436 m as the search radius, and exported grid resolution was set as 30 m. Figure 3 shows the point density map of seismic landslides in the study area. The maximum point density reaches 3.399 pcs km−2. The point density of landslides is divided into six categories: <0.1 pcs km−2, 0.1–0.3 pcs km−2, 0.3–1 pcs km−2, 1–1.5 pcs km−2, 1.5–2 pcs km−2, and 2–3.399 pcs km−2. According to the abovementioned classification order, the area of each category is 14,393.87 km2, 804.52 km2, 945.54 km2, 223.55 km2, 96.23 km2, and 48.21 km2, respectively.
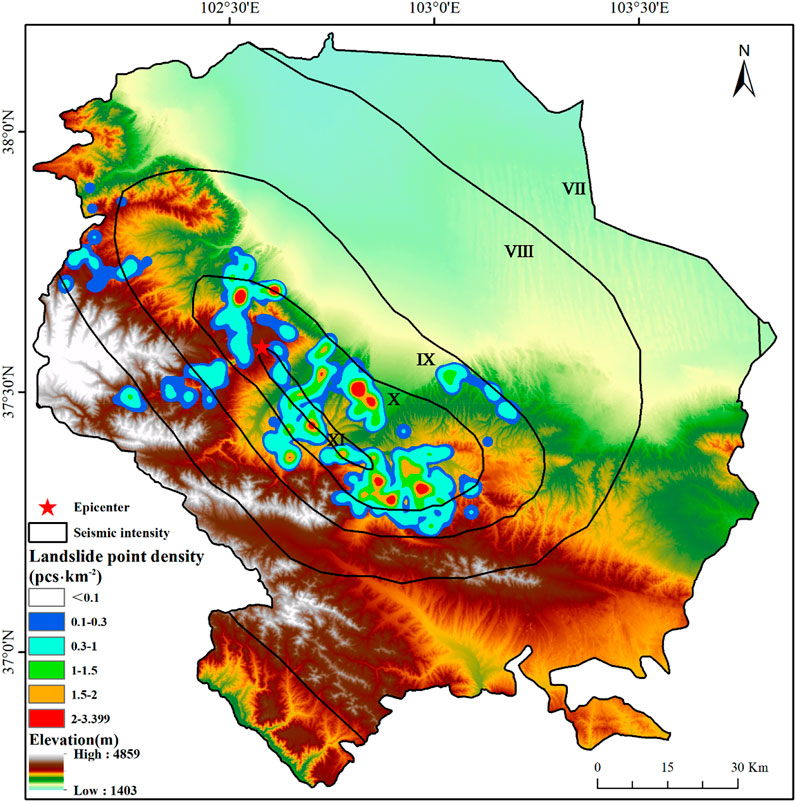
FIGURE 3. Point density map of landslides triggered by the 1927 Gulang earthquake.
The main factors affecting the occurrence of seismic landslides broadly include earthquakes, topography, and geology (Xu et al., 2018). It is only under certain conditions that the slope may be unstable and trigger the landslide during an earthquake. In order to study the relationship between the loess landslides triggered by the Gulang earthquake and the influencing factors, the factors such as seismic intensity, slope angle, elevation, slope aspect, fault belt, water system, and relative elevation difference were selected to analyze their influence on the scale and distribution of loess seismic landslides, which is of great significance to study the atypical loess seismic landslides.
Seismic intensity is one of the most important factors affecting seismic landslides. The seismic intensity of meizoseismal area in the Gulang earthquake is Ⅺ degree, and the study area in this research covers the regions (Ⅸ–Ⅺ degree) and part of the regions (Ⅶ–Ⅷ degree) (Figure 1A). Figure 4 shows the correlations between seismic intensity and landslide distribution. As shown in Figure 4, the LN increases with the increase of the seismic intensity except for seismic intensity Ⅺ, and the LN in Ⅹ degree is the largest, accounting for 65.68% of the total landslides. The LA in Ⅹ degree is also the largest, and the LAD reaches 9.85% (Figure 4B). LN and LA in Ⅺ degree are both small, but the LND reaches the maximum value of 0.510 pcs km−2. In combination with Figure 3, the high-incidence and high-density areas of the landslide distribution are mainly located in the southeast, northeast, and northwest of the region with a seismic intensity of Ⅹ, with the southeast accounting for the most landslides. There are not many dense landslides distributed in the area with the seismic intensity of Ⅹ, probably because loess hills and interfluvial basins are their major landform. Most areas are gentle slopes with small topographic relief, which cannot trigger a larger number of landslides in this topography (Xu, 2021). Unlike the area with a seismic intensity of Ⅺ, there are many active fault belts in the area with a seismic intensity of Ⅹ, resulting in dense seismic landslides. The overall performance of the distribution relationship between the Gulang earthquake landslides and the seismic intensity is that the seismic landslide number decreases with the decrease of seismic intensity.
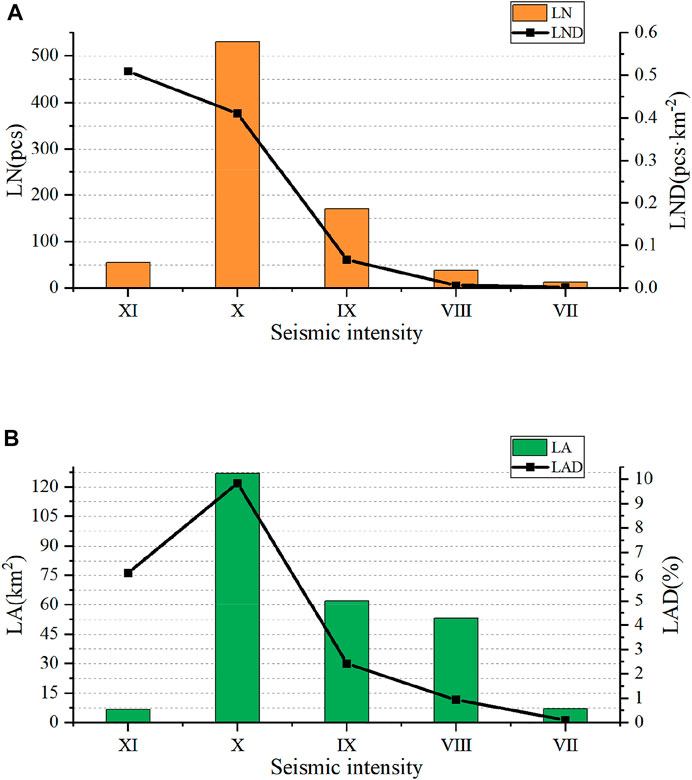
FIGURE 4. The correlations between seismic intensity and landslide distribution. (A) LN and LND; (B) LA and LAD.
The slope angle is a major factor affecting the occurrence of seismic landslides which has significant impacts on shear resistance, runoff modulus, and soil humidity (Dou et al., 2019). Under similar conditions, the higher the slope angle, the more likely the landslide will occur (Kritikos et al., 2015). The slope angle of the landslides in the study area ranges from 0° to 74.7°. The slope angle is divided into six categories (Figure 5): [(0°, 10°), (10°, 20°), (20°, 30°), (30°, 40°), (40°, 50°), and (50°, 90°)]. The area of each category becomes smaller with the increase of the slope angle. Figure 5 shows the correlations between slope angle and landslides distribution. It can be seen from Figure 5 that the LN generally shows a trend of more in the middle and fewer on both sides. The landslides in the study area are mainly distributed in the range of (10°, 40°), accounting for 84.01% of the total landslides and 78.46% of the total area of landslides. There are 281 landslides in the range of (20°, 30°), accounting for 34.82% of the total landslides, and the LA also accounts for more than 30% of the total area of landslides. The LN in the range of (10°, 20°) and the range of (30°, 40°) both account for more than 20% of the total landslides. The LN in the range of (10°, 20°) is slightly more than that in the range of (30°, 40°), while the LA in the range of (10°, 20°) is slightly fewer than that in the range of (30°, 40°). LND and LAD increase with the increase of the slope angle. The abovementioned results show that the loess landslides triggered by the Gulang earthquake have relatively high slope angles, which mainly concentrate in (20°, 30°), indicating that the slope angle has a strong impact on seismic landslides.
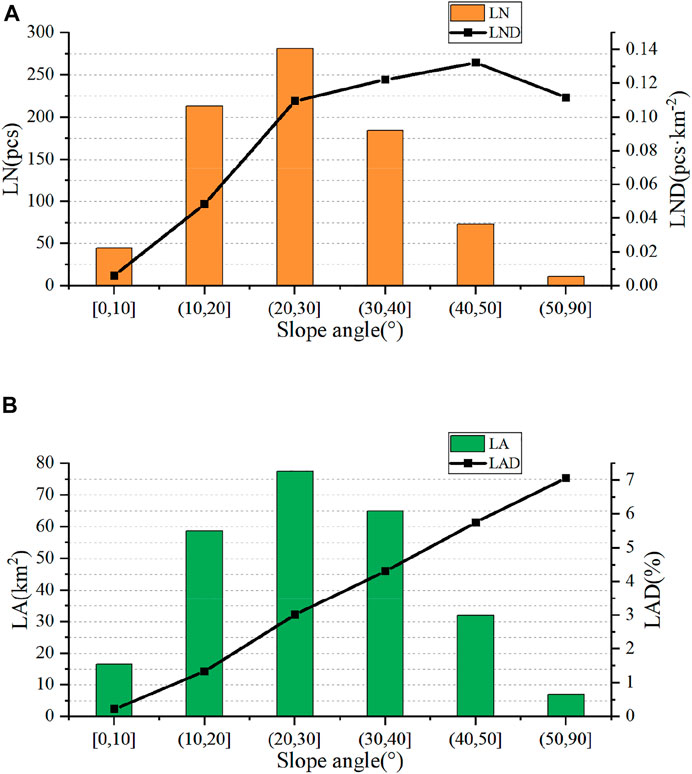
FIGURE 5. The correlations between slope angle and landslide distribution. (A) LN and LND; (B) LA and LAD.
The elevation range of the whole study area is from 1,403 to 4,859 m, and the elevation is divided into five categories (Figure 6): (1,403 m, 2,000 m), (2,000 m, 2500 m), (2,500 m, 3,000 m), (3,000 m, 3,500 m), and (>3,500 m). Figure 6 shows the correlations between elevation and landslide distribution. It can be seen from Figure 6A that landslides are mainly distributed in the range of (2,000 m, 2,500 m) and (2,500 m, 3,000 m), accounting for more than 90% of the total landslides. The LN in the range of (2,000 m, 2,500 m) accounts for more than 50% of the total landslides, reaching 50.31%, and the LND is also maximal, reaching 0.15 pcs km−2. The LN decreases sharply after the elevation is more than 3,000 m, and there are almost no seismic landslides existing after the elevation is more than 3,500 m. It can be seen from Figure 6B that the LA first increases and then decreases with the increase of the elevation. The LA in the range of (2,500 m, 3,000 m) accounts for 52.50% of the total area of landslides, reaching 134.48 km2. The LA in the range of (2,000 m, 2,500 m) is similar to that in the range of (3,000 m, 3,500 m). The former accounts for 22.54% of the total landslides area, reaching 57.73 km2, and the latter accounts for 21.85% of the total landslides area, reaching 55.97 km2. While the LN of the former is far more than that of the latter, indicating that the average area of each landslide in the range of (2,000 m, 2,500 m) is smaller than that in the range of (3,000 m, 3,500 m). The abovementioned results indicate that elevation has a certain influence on seismic landslides triggered by the Gulang earthquake.
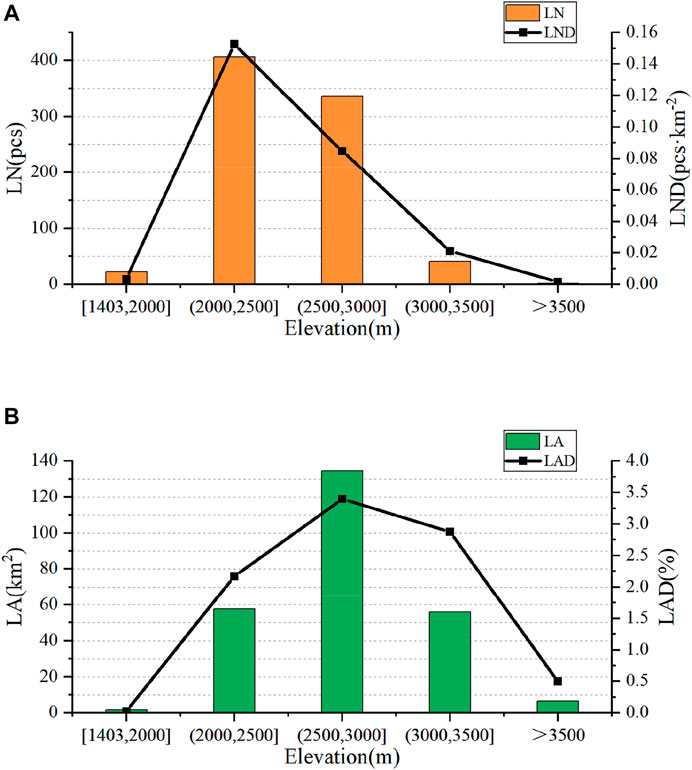
FIGURE 6. The correlations between elevation and landslide distribution. (A) LN and LND; (B) LA and LAD.
The slope aspect is one of the topographic factors that contribute to the occurrence of a seismic landslide. On the one hand, the different slope aspects of the mountain slope will affect the light intensity and precipitation intensity, thus affecting the vegetation coverage of the slope, which will affect the landslide susceptibility. In the study area, the light intensity is strong and the precipitation intensity is weak, and there are most short herbs covering the area. On the other hand, more importantly, the directions of seismic waves, the directions of fault rupture, and the slipping direction of a landslide also influence the development of seismic landslides. Fundamentally speaking, the spatial directional distribution and the dominant slipping direction of landslides are controlled by the regional tectonic stress field (Tang et al., 2000). The slope aspect of the study area is divided into four categories (Figure 7): N [(315°, 360°)∪(0°, 45°)], E [(45°, 135°)], S [(135°, 225°)], and W [(225°, 315°)]. Figure 7 shows the correlations between slope aspect and landslide distribution. It can be seen from Figure 7 that the dominant landslide direction of this earthquake is S, in which the LN accounts for 30.61% of the total landslides. The changing trend of the LND is the same as that of the LD, and the LND reaches the maximum in the S direction. On the contrary, the LN and the LND are both minimal in the N direction. According to the statistical results in ArcGIS, the area of each slope aspect in the study area is uneven, and the area of slope aspect in the N direction accounts for 30.53% of the whole study area, while it can be seen from Figure 7 that the LN and the LND in the S direction are both maximal, thus indicating that the slope aspect has a certain influence on the landslides triggered by the Gulang earthquake.
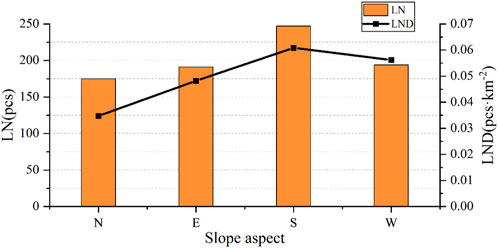
FIGURE 7. The correlations between slope aspect and landslide distribution.
The fault activity will directly trigger the collapse and slide during an earthquake, and the existence of a fault is a favorable location for collapse and slide (Zou and Shao, 1994). The distance from the fault in the study area is divided into eight categories (Figure 8): (0 km, 2 km), (2 km, 4 km), (4 km, 6 km), (6 km, 8 km), (8 km, 10 km), (10 km, 12 km), (12 km, 14 km), and (>14 km). Figure 8 shows the correlations between distance from the fault and landslides distribution. It can be seen from Figure 8A that the farther away from the fault, the fewer the LN and the LND become. Within 2 km away from the fault, the LN is the maximum, accounting for 27.39% of the total landslides, reaching 221 pcs. From Figure 8B, within 2 km away from the fault, the LA is also the maximum, accounting for 18.99% of the total landslide area, reaching 48.65 km2. The LA becomes fewer with the increase of the distance from the fault, while the change of LAD becomes relatively stagnant within a certain distance, indicating that within a certain distance, the decline rate of the area in each category is approximate to that of the area, which comprises the study area for each category. According to the statistical results, the Gulang earthquake landslides are strongly influenced by the fault, but after 12 km away from the fault, the influence of the fault gradually becomes weaker.
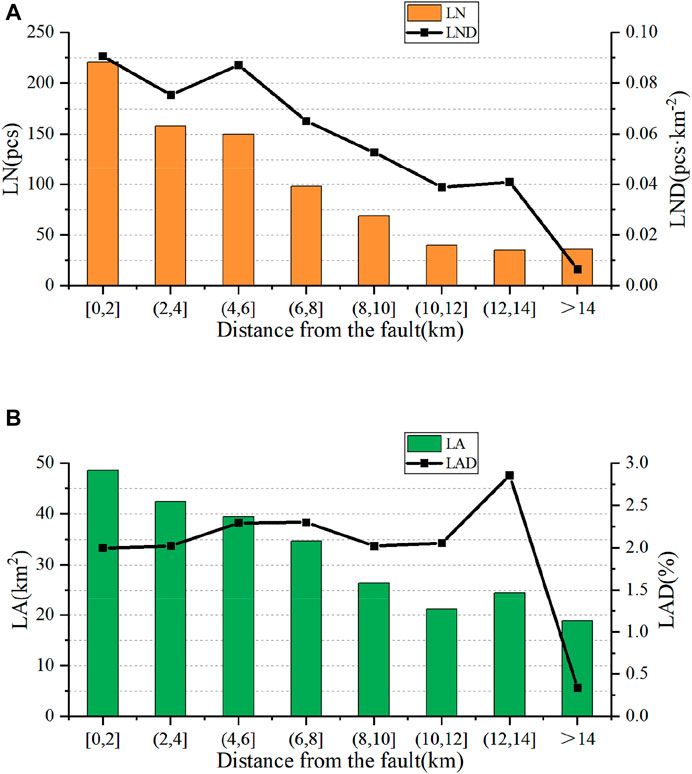
FIGURE 8. The correlations between distance from the fault and landslide distribution. (A) LN and LND; (B) LA and LAD.
The water system has a relatively large impact on seismic landslides. In the study area, there is less precipitation (Du et al., 2019) and the inland rivers come from glacial snowmelt. Loess is a water sensitivity material and its moisture state determines the shear strength and failure types (Li and Miao, 2006). Meanwhile, the river will continuously erode the slope, causing the toe and other key parts of the slope to collapse gradually. Eventually, the slope becomes unstable and slides during an earthquake (Yuan et al., 2018). The distance from the river in the study area is divided into six categories (Figure 9): (0 km, 1.5 km), (1.5 km, 3 km), (3 km, 4.5 km), (4.5 km, 6 km), (6 km, 7.5 km), and (>7.5 km). Figure 9 shows the correlations between distance from the river and landslide distribution. It can be seen from Figure 9A that the further away from the river, the fewer the LN and the LND become. Within 1.5 km from the river, it has a significant impact on Gulang earthquake landslides, and the LN is maximum in this range, accounting for 25.77% of the total landslides, reaching 208 pcs. Also, the LND is the maximum in this range. From Figure 9B, when moving far away from the river, the changing trend of the LA and LAD is approximately similar to that of the LN and LND. Within 1.5 km of the river, the LA and LAD are also maximal. The LA and LAD gradually decrease with the increase of the distance from the river, and the LND and LAD both change gently after a certain distance, indicating that the influence of the water system on the Gulang earthquake landslides becomes weaker after a certain distance.
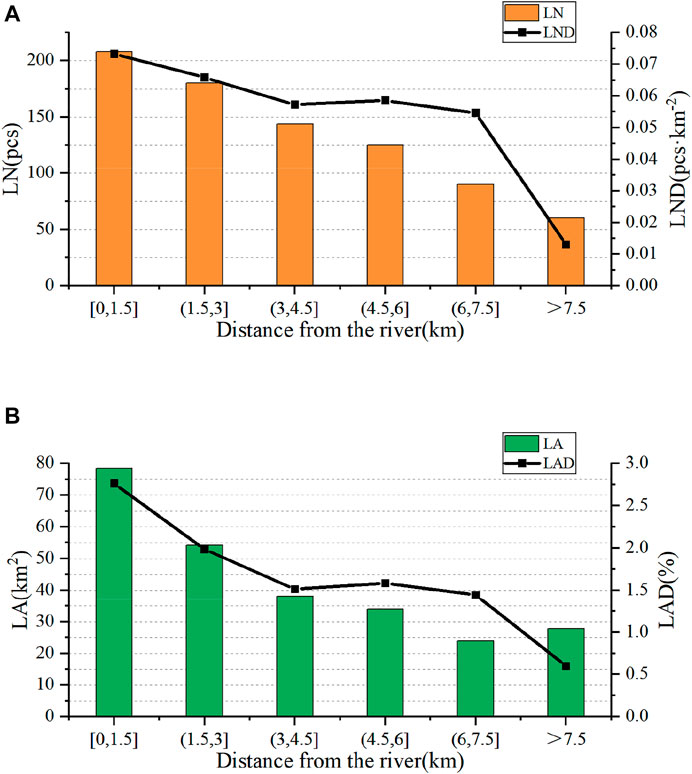
FIGURE 9. The correlations between distance from the river and landslide distribution. (A) LN and LND; (B) LA and LAD.
The large relative elevation difference is an adverse environmental factor influencing landslide stability (Yang et al., 2015). The relative elevation difference determines the potential energy. The larger the relative elevation difference becomes, the greater the potential energy will be, and the more sufficient the dynamic conditions for a landslide will be (Xiang et al., 2010), which makes it more easy to trigger a landslide (Yang et al., 2017). In this study, the relative elevation difference of a landslide is the absolute value of the difference between the highest elevation of the trailing edge of the landslide and the lowest elevation on the leading edge of the landslide (Hu et al., 2021). The relative elevation difference in the study area is divided into eight categories (Figure 10): (0 m, 100 m), (100 m, 200 m), (300 m, 400 m), (400 m, 500 m), (500 m, 600 m), (600 m, 700 m), and (700 m, 800 m). Figure 10 shows correlations between relative elevation difference and landslides distribution. It can be seen from Figure 10 that the Gulang earthquake landslides are mainly located in the range of (100 m, 300 m), accounting for 65.80% of the total landslides. In the range of (100 m, 200 m), the LN reaches maximum. After the peak, the larger the relative elevation difference is, the fewer the LN becomes. The LN in each following category is fewer when the relative elevation difference is larger than 400 m. The statistical results indicate that the relative elevation difference of the slope has a strong impact on the Gulang earthquake landslides, and the slope in the range of (100 m, 300 m) is the high-incidence region for seismic landslides in the study area.
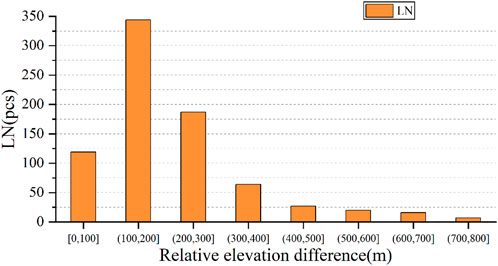
FIGURE 10. The correlations between relative elevation difference and landslide distribution.
Discussion
It can be seen from Figure 4 to Figure 10 that the loess landslides triggered by the Gulang earthquake are controlled by multiple factors. Also, the distribution of landslides is related to these multiple factors: seismic intensity, slope angle, elevation, slope aspect, fault belt, water system, and relative elevation difference (Xu, 2021). There are mostly earthquake landslides in the area with a seismic intensity of X, and the number and density of landslides are decreasing with the decrease of the seismic intensity. The LN in the slope angle of (10°, 40°) is the maximum, accounting for 84.01% of the total landslides and 78.46% of the total landslides area. Among the slope angle in the range of (10°, 40°), the range of (20°, 30°) is dominant, in which the LN and the LA both reach more than 30% of the total, respectively. The elevation of (2,000 m, 3,000 m) is the high-incidence region for seismic landslides, in which more than half of landslides occur in the range of (2,000 m, 2,500 m) and the area of the elevation in the range of (2,500 m, 3,000 m) accounts for more than half of the total landslide area. There are mostly seismic landslides in the area of slope aspect in the S direction compared to other directions, and the LND in this range is also the maximum. The LN and LA become larger when coming close to the fault belt. However, the influence of the fault gradually becomes weaker after 12 km away from the fault. Similar to the influence of faults on seismic landslides, the seismic landslides are significantly influenced by the water system within 1.5 km away from the river. The LN, LA, LND, and LAD gradually decrease when getting further away from the river. The relative elevation difference of (100 m, 300 m) is conducive to triggering seismic landslides. With the increase of the relative elevation difference, the LN decreases. Also, after the relative elevation difference is greater than 400 m, there are only a few landslides.
Loess landslides triggered by the 1718 Tongwei M7.5 earthquake and the 1920 Ms8.5 Haiyuan earthquake are typical loess seismic landslides. Figure 11A shows the comparison of landslide distribution under different seismic intensities between the loess landslides triggered by the Haiyuan earthquake and the loess landslides triggered by the Gulang earthquake. As the typical loess seismic landslides, it can be seen from Figure 11A that the most loess landslides triggered by the 1920 Haiyuan earthquake are distributed in the region with a seismic intensity of Ⅸ, reaching 3,324 pcs. Meanwhile, the region with the seismic intensity of Ⅸ is also the high-density area of the landslide distribution (Xu et al., 2018). From Ⅸ degree, the LN decreases with the increase of the seismic intensity. The seismic intensity of the meizoseismal area in the Haiyuan earthquake is Ⅺ degree, and there are fewest landslides in the region with the seismic intensity of Ⅺ, only reaching 734 pcs, accounting for 13.63% of the total landslides in the region (Ⅸ–Ⅺ degree). The landslide number in the Haiyuan earthquake decreased with the increase of seismic intensity. The loess landslides triggered by the Gulang earthquake are mainly distributed in the region with a seismic intensity of Ⅹ, and the seismic intensity of the meizoseismal area in the Gulang earthquake is also Ⅺ degree. But there are only 55 landslides in this region, accounting for 7.28% of the total landslides in the region (Ⅸ–Ⅺ degree). The LN and LND of the Gulang earthquake increase with the increase of the seismic intensity except for the seismic intensity of Ⅺ degree (Figure 4A). The main reason why there are only few seismic landslides distributed in the northeast region of Ⅹ degree and Ⅺ degree in the Haiyuan earthquake is that the semi-desert low hill is their major landform, which gradually transitions to flat semi-desert grassland, and the loess alluvial deposit is shallow (Lu et al., 2020). While the main reason why there are no large numbers of dense landslides distributed in the meizoseismal area in the Gulang earthquake is that loess hills and interfluvial basin are their major landform and most areas are gentle slopes with small topographic relief (Xu, 2021). The abovementioned results indicate that seismic landslides are not only influenced by seismic intensity, but also strongly influenced by topography, formation lithology, and other conditions.
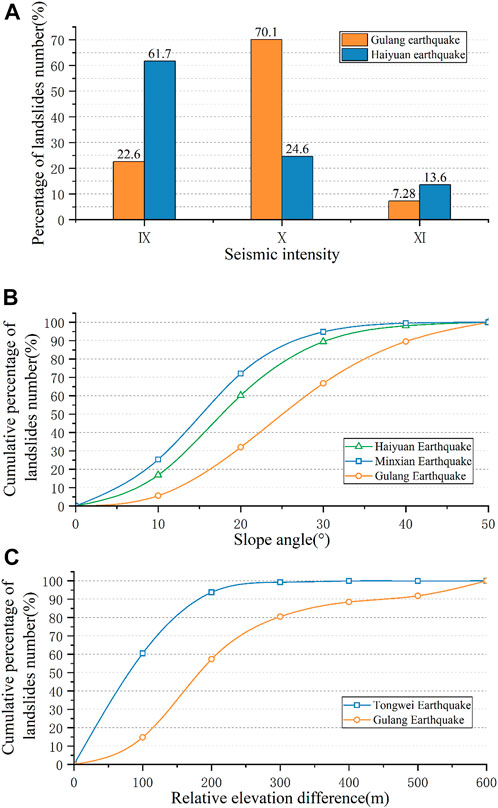
FIGURE 11. The comparison between seismic landslides in the Loess Plateau and Gulang seismic landslides. (A) Seismic intensity (Xu et al., 2018); (B) slope angle (Xu et al., 2014; Xu et al., 2018); and (C) relative elevation difference (Xu et al., 2020c).
Figure 11B shows the comparison of landslide distribution under different slope angles between the loess landslides triggered by the 1920 Haiyuan earthquake, the 2013 Minxian Ms6.6 earthquake, and the loess landslides triggered by the Gulang earthquake. The loess landslides triggered by the 1920 Haiyuan earthquake and the 2013 Minxian earthquake are the seismic landslides in the typical loess areas. It can be seen from Figure 11B that most landslides triggered by the Haiyuan earthquake are distributed in the range of (5°, 20°) (Li et al., 2013a). When the slope angle is low, such as 15°, the cumulative percentage of the landslide number of the Hiayuan earthquake has exceeded 35%, and the cumulative percentage of landslide number of the Minxian earthquake is even close to 50%, while the cumulative percentage of landslide number of the Gulang earthquake is only about 15%. The landslide number increases rapidly in the range of (10°, 20°) with the increase of the slope angle. When the slope angle reaches 30°, the cumulative percentage of landslide number of both the Minxian earthquake and the Haiyuan earthquake almost reach more than 90%, showing the typical characteristics of low-angle in loess seismic landslides. However, the landslides triggered by the Gulang earthquake are different from the typical loess seismic landslides. When the slope angle reaches 30°, the cumulative percentage of landslide number of the Gulang earthquake is only 66.79%, indicating that the slope angles of the most loess landslides triggered by the Gulang earthquake are relatively higher than that triggered by the typical loess earthquake.
Figure 11C shows the comparison of landslide distribution under different relative elevation differences between the loess landslides triggered by the Tongwei earthquake and the loess landslides triggered by the Gulang earthquake. It can be seen from Figure 11C that for the loess landslides triggered by the Tongwei earthquake, there are more than 60% landslides of total landslides distributed in the range of (0 m, 100 m) (Xu et al., 2020c). When the relative elevation difference reaches 200 m, the cumulative percentage of landslides number has reached 93.76%. While the relative elevation difference reaches the same 200 m, the cumulative percentage of landslide number of the Gulang earthquake is only 57.37%. When it comes to 300 m, the cumulative percentage of landslide number of the Gulang earthquake reaches 80.55%, which means there are still nearly 20% of the total landslides after the relative elevation difference is greater than 300 m. Meanwhile, the cumulative percentage of landslide number still increases slowly with the increase of the relative elevation difference after the relative elevation difference reaches 300 m. Thus, it can be seen that the relative elevation difference of most landslides triggered by the Gulang earthquake is relatively higher than that of the seismic landslides in typical loess areas.
Figure 12 shows the typical loess seismic landslides in the study area and the Loess Plateau. Among them, Figures 12A–C are the loess landslides triggered by the 1927 Gulang earthquake, and they are from Hejiazhuang, Leixiangzhuang, and Siyangwa, respectively. Figures 12D,E are the loess landslides triggered by the 1920 Haiyuan earthquake, and Figure 12F is the loess landslide triggered by the 1718 Tongwei earthquake. From a macroscopic point of view, compared with the loess seismic landslides in the Loess Plateau, the most loess seismic landslides in the study area have a smaller scale, but a larger slope angle and larger relative elevation difference. However, the most loess landslides triggered by the earthquakes in the Loess Plateau are characterized by low slope angle, large scale, and long distance, which is consistent with the comparison results in Figures 11B,C. Furthermore, it can be seen from Figure 12 that seismic landslides in the Loess Plateau have a clear trailing edge and a lateral edge. In general, in the Loess Plateau, there are few accumulations in the upper part of the landslide, while many accumulations in the lower part of the landslide, and the slope angle of the landslide tends to be steep in the upper part and gentle in the lower part. Nevertheless, in the study area, the overlying soil of the slope is relatively thin, and almost all of it slides off during a landslide. Thus, there are almost no more accumulations on the landslide. The trailing edge and lateral edge of the seismic landslides in the study area are not often as clear as that in the Loess Plateau. As shown in Figure 12C, the trailing edge of the landslide almost disappeared.
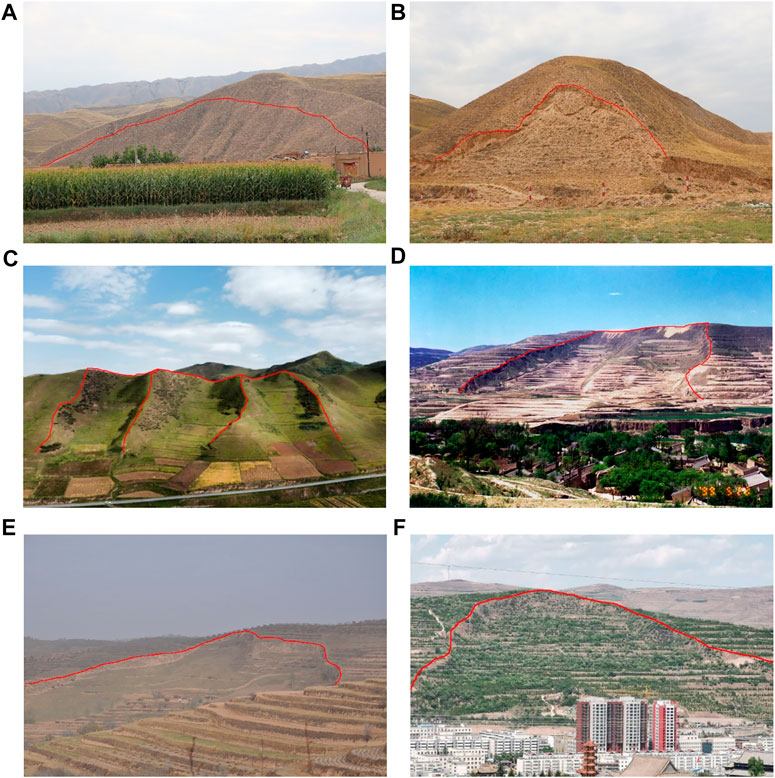
FIGURE 12. Typical loess seismic landslides in the study area and the Loess Plateau. (A) Landslide in Hejiazhuang; (B) landslide in Leixiangzhuang; (C) landslide in Siyangwa; (D) landslide in Sunjiagou, Jingning; (E) landslide in Huihuichuan, Xiji; and (F) landslide in Tongwei.
The physical properties of soil reflect the strength of soil structure. In order to find the reason why the slope angle and relative elevation difference of most loess seismic landslides in the study area are higher than those of loess seismic landslides in the Loess Plateau, the water content and density of 28 soil samples in the study area and 49 soil samples in the Loess Plateau were collected (Wang et al., 2019). Figure 1C shows the spatial distribution of these sampling sites. Figure 13 shows the comparison of soil samples’ physical properties between the study area and the Loess Plateau. It can be seen from Figure 13 that the average water content of the loess in the study area is 6.22% lower than that of the loess in the Loess Plateau, which is 11.63%, while the average density of the loess in the study area is 1.51 g cm−3 greater than that of the loess in the Loess Plateau, which is 1.44 g cm−3. The abovementioned comparison indicates that the porosity ratio of loess in the study area is smaller overall, which means that the loess in the study area is denser than the typical loess in the Loess Plateau. According to the relationship between strength parameters and density and water content in loess (Ayers, 1987), the strength of loess in the study area is stronger than that in the Loess Plateau, indicating that the loess slope in the study area is stabler than that in the Loess Plateau. Due to this, during a strong earthquake, the slope with a high slope angle and large relative elevation difference in the study area tends to be unstable, triggering a landslide, which is consistent with the results in Figures 11B,C.
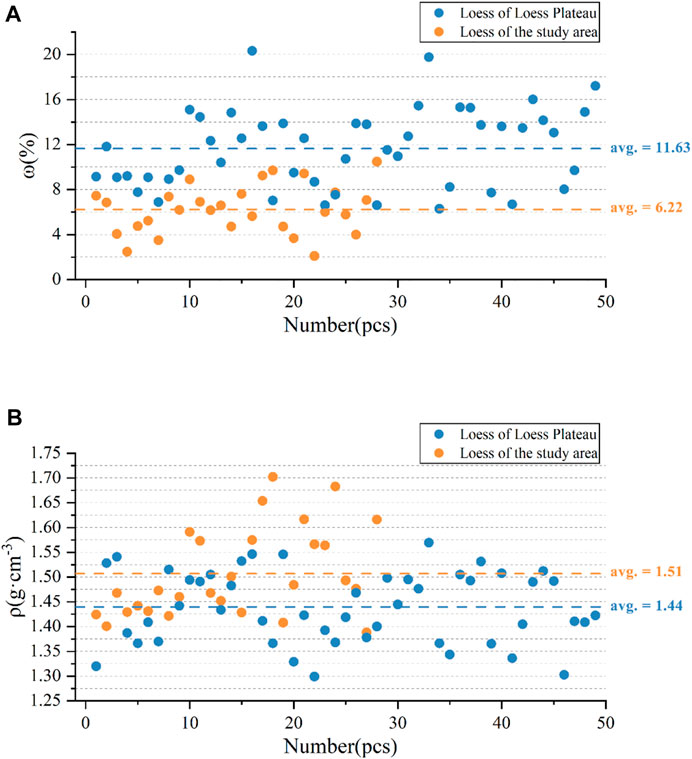
FIGURE 13. The comparison of soil sample's physical properties between the study area and the Loess Plateau. (A) Moisture content; (B) density.
The microstructure of soil determines the macro mechanical properties of soil. The microstructural properties of the loess samples, which were collected from the multiple typical areas from the study area and the Loess Plateau, were observed through the SEM images of 500 times magnification as shown in Figure 14. On the whole, the loess in the study area is denser, and most particles are small and dispersed. There are many flocculents and agglutinated cement among particles, and the surface contact is the main contact model among particles, indicating that the soil structure is strong and stable. The particle boundary of typical loess in the Loess Plateau is relatively evident. It can be seen from Figures 14C,D that there are many medium and large particles distributed, and few types of cement existed among the particles. The structure of soil aggregate is clearly visible, and the overhead pores formed by particle accumulations are also visible with clear edges and corners. Point contact and mosaic texture are the main contact models among medium and large particles, which makes the soil relatively loose, indicating that the strength of soil structure is relatively weak. Figure 15 shows the typical loess particle size distribution curve of the study area and the Loess Plateau. It can be seen from Figure 15 that the particle size of loess in the study area is distinctly different from that in the Loess Plateau. When the particle size is 0.01 mm, the cumulative percentage of loess particles in the study area is much higher than that in the Loess Plateau, indicating that the particle size of most loess in the study area is smaller than that in the Loess Plateau, which is consistent with the results of the microstructure of loess (Figure 14). Therefore, during a strong earthquake, compared with the loess slope in the Loess Plateau, the slope in the study area is harder to be unstable, which is consistent with the results in Figures 11B,C.
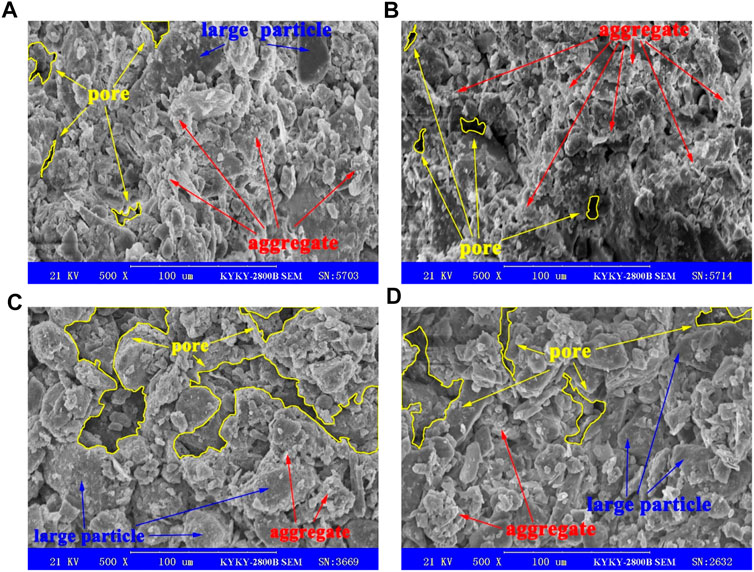
FIGURE 14. SEM image of the typical loess in the study area and the Loess Plateau. The study area: (A) Huangyagnchuan, Gulang; (B) Xiashancun, Gulang. Loess Plateau: (C) Guyuan; (D) Xiji.
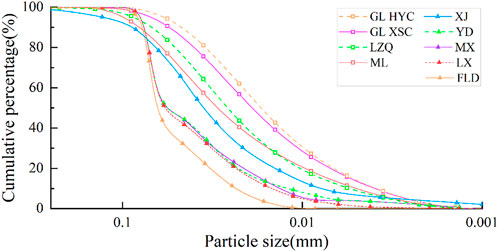
FIGURE 15. Typical loess particle size distribution curve of the study area and the Loess Plateau. The study area: Gulang Huangyangchuan (GL HYC), Gulang Xiashancun (GL XSC), Liangzhouqu (LZQ), Minle (ML); the Loess Plateau: Xiji (XJ), Yongdeng (YD), Minxian (MX), Linxia (LX), Fenglingdu (FLD).
Conclusion
Through the systematic remote sensing interpretation of the Gulang earthquake landslides, the loess landslides triggered by the Gulang earthquake were compared with the typical loess seismic landslides from the macroscopic and microcosmic perspectives, and the following conclusions were drawn:
1) Through interpretation, there exist 807 loess landslides triggered by the Gulang earthquake, with a total area of 256.14 km2. The maximum area of a landslide is 5.22 km2, the minimum area of a landslide is 2.35 × 10⁻³ km2, and the average area of a landslide is 3.17 × 10⁻¹ km2. The number of landslides (the area of a landslide is between 104 m2 and 106 m2) is the largest, accounting for 91.82% of the total landslides.
2) The loess landslides triggered by the Gulang earthquake are controlled by multiple factors. The distribution of landslides is related to these multiple factors: seismic intensity, slope angle, elevation, slope aspect, fault belt, water system, and relative elevation difference. The region with a seismic intensity of Ⅹ is the high-incidence and high-density areas of the seismic landslides. The dominant slope angle of seismic landslides is the range of (10°, 40°). The number of landslides in the elevation of (2000 m, 3000 m) accounts for more than 90% of the total landslides. The number and point density of seismic landslides are both the maximum in the slope aspect of the S direction. The closer to the fault belt, the more seismic landslides exist, and the larger the landslides area is. Within 1.5 km from the river, the seismic landslides are significantly affected by the water system. The relative elevation difference of (100 m, 300 m) is the dominant range of relative elevation difference for seismic landslides.
3) Compared with the typical loess seismic landslides, the loess landslides triggered by the Gulang earthquake have the characteristics of smaller scale, larger slope angle, and larger relative elevation difference. The comparison results of physical properties and microstructure show that the strength of loess structure in the study area is greater than that of typical loess in the loess region. In the event of an earthquake, most slopes in the study area are harder to be unstable, resulting in the loess seismic landslides that have a larger slope angle and larger relative elevation difference. The small thickness of the soil layer and strong strength of soil in the study area may be the main reasons for the morphological differences between the loess seismic landslides triggered by the Gulang earthquake and the typical loess landslides triggered by earthquakes in the Loess Plateau.
4) The study area is located in the Hexi Corridor, which is the gateway and land fortress of the Silk Road Economic Belt under the strategic planning of China’s “the Belt and Road.” With the further promotion of the national strategies of “the development of the western region in China,” “the rural revitalization strategy,” and “a country with a strong transportation network,” it is extremely important to prevent and control seismic landslide disasters in the Hexi Corridor. The most remarkable characteristic of loess seismic landslides in the Hexi Corridor is the large slope angle. For these large slope angle mountains, especially those close to fault belts and water systems, comprehensive countermeasures should be taken. Initiative must be taken to prevent and control historical seismic landslides to reduce the recurrence rate. Basic theoretical bases could be provided for the scientific site selection and design of major projects in the loess region of the Hexi Corridor according to the influencing factors.
Data availability statement
The raw data supporting the conclusion of this article will be made available by the authors, without undue reservation.
Author contributions
Conceptualization and methodology, XZ and XX; investigation, XZ, XX, and YL; data collection, WC, XZ, and XX; data process, XX and QS; data analysis, XX and XZ; writing—original draft preparation, XX; writing—review and editing, XZ and XX. All authors have read and agreed to the published version of the manuscript.
Funding
This research was funded by the Funding of Science for Earthquake Resilience, grant numbers XH21034 and XH20057; the Special Fund for Innovation Team, Gansu Earthquake Agency, grant No. 2020TD-01-01; the National Natural Science Foundation of China, grant numbers 51778590 and 51408567; and the grant of the Fundamental Research Funding for the Institute of Earthquake Forecasting, China Earthquake Agency, grant No. 2021IESLZ03.
Acknowledgments
The authors are grateful to Qian Wang for the support in calculating process of the data, as well as to Mohamed Elmujtaba and Peng Guo for their helpful comments in language of this work.
Conflict of interest
The authors declare that the research was conducted in the absence of any commercial or financial relationships that could be construed as a potential conflict of interest.
Publisher’s note
All claims expressed in this article are solely those of the authors and do not necessarily represent those of their affiliated organizations, or those of the publisher, the editors, and the reviewers. Any product that may be evaluated in this article, or claim that may be made by its manufacturer, is not guaranteed or endorsed by the publisher.
References
Ayers, P. D. (1987). Moisture and density effects on soil shear strength parameters for coarse grained soils. Trans. ASAE 30 (5), 1282–1287. doi:10.13031/2013.30559
Chen, Y., He, X., Xu, C., Huang, Y., Zhang, P., Luo, Z., et al. (2022). Development characteristics and causes of a fatal landslide occurred in shuicheng, guizhou province, China. ISPRS Int. J. Geoinf. 11 (2), 119. doi:10.3390/ijgi11020119
Chen, Y., Liu, H., Zeng, W., Liu, H., Zhang, W., and Dai, H. (1999). Geological disasters and destroying characteristics of the 1927 Gulang Ms8 earthquake. Northwest. Seismol. J. 3, 92–97.
Deng, Y., Peng, Z., and Liu-Zeng, J. (2020). Systematic search for repeating earthquakes along the haiyuan fault system in northeastern Tibet. J. Geophys. Res. Solid Earth 125 (7), e2020JB019583. doi:10.1029/2020JB019583
Dong, Z., and Liu, B. (2017). Discussion of small earthquake relocation in the area of the 1927 Gulang M8 earthquake. China Earthq. Eng. J. 39 (04), 692–697. doi:10.3969/j.issn.1000-0844.2017.04.0692
Dou, J., Yunus, A. P., Tien Bui, D., Sahana, M., Chen, C.-W., Zhu, Z., et al. (2019). Evaluating GIS-based multiple statistical models and data mining for earthquake and rainfall-induced landslide susceptibility using the LiDAR DEM. Remote Sens. 11 (6), 638. doi:10.3390/rs11060638
Du, J., Li, Z., Feng, Q., Wei, W., Li, Y., Lyu, Y., et al. (2019). Space-time characteristics and environmental significance of the stable isotopes in precipitation in the Gulang river basin. Environ. Sci. 40 (01), 149–156. doi:10.13227/j.hjkx.201804040
Du, P., Xu, Y., Tian, Q., Zhang, W., and Liu, S. (2020). The spatial distribution and attribute parameter statistics of landslides triggered by the may 12th, 2008, MW7.9 wenchuan earthquake. Earthq. Res. China 34 (1), 29–49. doi:10.19743/j.cnki.0891-4176.202001006
Gao, Y., Xu, C., Tian, Y., Ma, S., Shen, L., Lu, Y., et al. (2020). Distribution of landslides in baoshan city, yunnan province, China. Earthq. Res. China 34 (01), 50–63. doi:10.19743/j.cnki.0891-4176.202001009
Guo, P., Han, Z., Gao, F., Zhu, C., and Gai, H. (2020). A new tectonic model for the 1927 M8.0 Gulang earthquake on the NE Tibetan plateau. Tectonics 39 (9), e2020TC006064. doi:10.1029/2020TC006064
Guo, P., Han, Z., Mao, Z., Xie, Z., Dong, S., Gao, F., et al. (2019). Paleoearthquakes and rupture behavior of the lenglongling fault: Implications for seismic hazards of the northeastern margin of the Tibetan plateau. J. Geophys. Res. Solid Earth 124 (2), 1520–1543. doi:10.1029/2018JB016586
Hou, K. (1998). Characteristics of ground ruputures caused by 1927 Gulang M8 earthquake and their causative mechanisms. Seismol. Geol. 1, 20–27.
Hou, K., Deng, Q., Liu, B., and Han, Y. (1998). 3-D numerical simulation of surface rupture caused by the 1927 Gulang Ms8 earthquake. Northwest. Seismol. J. 3, 60–66.
Hou, K., Deng, Q., and Liu, B. (1999). Research on tectonic environment and seismogenic mechanism of 1927 Gulang great earthquake. Earthq. Res. China 4, 47–56.
Hu, S., Qiu, H., Wang, N., Cui, Y., Cao, M., Wang, J., et al. (2021). The influence of terrain on loess landslides in Loess Plateau. Acta Geogr. Sin. 76 (11), 2697–2709.
Huang, L., Hao, J., Li, W., Zhou, Z., and Jia, P. (2021). Landslide susceptibility assessment by the coupling method of rbf neural network and information value: A case study in min Xian,Gansu province. Chin. J. Geol. Hazard Control 32 (6), 116–126. doi:10.16031/j.cnki.issn.1003-8035.2021.06-14
Keefer, D. K. (1984). Landslides caused by earthquakes. Geol. Soc. Am. Bull. 95 (4), 406–421. doi:10.1130/0016-7606(1984)95<406:lcbe>2.0.co;2
Kritikos, T., Robinson, T. R., and Davies, T. R. H. (2015). Regional coseismic landslide hazard assessment without historical landslide inventories: A new approach. J. Geophys. Res. Earth Surf. 120 (4), 711–729. doi:10.1002/2014JF003224
Li, B., and Miao, T. (2006). Research on water sensitivity of loess shear strength. Chin. J. Rock Mech. Eng. 05, 1003–1008.
Li, L., Xu, C., Xu, X., Zhang, Z., and Cheng, J. (2022). Inventory and distribution characteristics of large-scale landslides in baoji city, shaanxi province, China. ISPRS Int. J. Geoinf. 11 (1), 10. doi:10.3390/ijgi11010010
Li, L., Xu, C., Zhang, Z., and Huang, Y. (2021). A review of researches on landslide disasters on Loess Plateau. J. Inst. Disaster Prev. 23 (04), 1–11.
Li, W., Huang, R., Pei, X., and Zhang, X. (2013a). “Historical co-seismic landslide inventory with Google Earth:A case study of 1920 Haiyuan Earthquake,China,” in International symposium and 9th asian regional conference of IAEG (Beijing): Springer International Publishing.
Li, W., Huang, R., Pei, X., and Zhang, X. (2015). “Historical Co-seismic landslides inventory and analysis using Google earth: A case study of 1920 M8.5 haiyuan earthquake, China,” in Engineering geology for society and territory - volume 2. Editors G. Lollino, D. Giordan, G. B. Crosta, J. Corominas, R. Azzam, J. Wasowskiet al. (Cham, Switzerland: Springer), 709–712.
Li, Y., and Mo, P. (2019). A unified landslide classification system for loess slopes: A critical review. Geomorphology 340, 67–83. doi:10.1016/j.geomorph.2019.04.020
Liu, B., Wang, X., Yin, Z., Wang, W., and Dong, Z. (2018). 3D P-wave crustal velocity structure of the 1927 Gulang M8 earthquake and its adjacent area. Chin. J. Geophys. 61 (10), 3980–3993. doi:10.6038/cjg2018K0582
Liu, B., Zeng, W., Yuan, D., Li, Q., and Chen, W. (2015). The research on fault parameter and sliding behavior of the 1927 Gulang M8.0 earthquake. Seismol. Geol. 37 (03), 818–828. doi:10.3969/j.issn.0253-4967.2015.03.012
Lu, Y., Wei, L., Liu, K., Li, T., Zheng, H., Wang, C., et al. (2020). Site effects of ground motions in landslide-concentrated area caused by the haiyuan earthquake in 1920. China Earthq. Eng. J. 42 (05), 1151–1158. doi:10.3969/j.issn.1000-0844.2020.05.1151
Pei, H., Zhou, Z., Sun, Y., and Chen, W. (2015). Spatiotemporal distribution feature of earthquake disaster in Gansu Province. J. Nat. Disasters 24 (03), 67–75. doi:10.13577/j.jnd.2015.0309
Peng, J., Wang, S., Wang, Q., Zhuang, J., Huang, W., Zhu, X., et al. (2019). Distribution and genetic types of loess landslides in China. J. Asian Earth Sci. 170, 329–350. doi:10.1016/j.jseaes.2018.11.015
Shao, S., and Zou, M. (1994). Fuzzy comprehensive assessment for distribution law of landslides in Gulanghaiyuan area. J. Seismol. 01, 1–6+78.
Sun, Q., Pei, S., Cui, Z., Chen, Y. J., Liu, Y., Xue, X., et al. (2021). Structure-controlled asperities of the 1920 Haiyuan M8.5 and 1927 Gulang M8 earthquakes, NE Tibet, China, revealed by high-resolution seismic tomography. Sci. Rep. 11 (1), 5090. doi:10.1038/s41598-021-84642-7
Tang, H., Chen, W., Zhu, X., and Gneg, D. (2000). Neotectonic stress field and its impact on macro-development of landslides in Chongqing area of the three gorges reservoir. Chin. J. Rock Mech. Eng. 3, 352–356.
Wang, H., Zhong, P., Xiu, D., Zhong, Y., Peng, D., and Xu, Q. (2022). Monitoring tilting angle of the slope surface to predict loess fall landslide: An on-site evidence from heifangtai loess fall landslide in Gansu province, China. Landslides 19 (3), 719–729. doi:10.1007/s10346-021-01727-0
Wang, Q., Ma, J., Ma, H., Wang, J., Wang, L., Gao, Z., et al. (2019). Dynamic shear modulus and damping ratio of saturated loess. Chin. J. Rock Mech. Eng. 38 (09), 1919–1927. doi:10.13722/j.cnki.jrme.2019.0249
Xiang, L., Cui, P., Zhang, J., Huang, D., Fang, H., and Zhou, X. (2010). Triggering factors susceptibility of earthquake-induced collapses and landslides in wenchuan county. J. Sichuan Univ. Sci. Ed. 42 (05), 105–112. doi:10.15961/j.jsuese.2010.05.009
Xie, H., Yuan, D., Lei, Z., Liu, B., and Su, Q. (2014). Seismic hazard characteristics of and lessons from Gulang Ms 8 earthquake in 1927. J. Lanzhou Univ. Nat. Sci. 50 (05), 622–627. doi:10.13885/j.issn.0455-2059.2014.05.007
Xu, C., Shyu, J. B. H., and Xu, X. (2014). Landslides triggered by the 22 July 2013 Minxian–Zhangxian, China, Mw 5.9 earthquake: Inventory compiling and spatial distribution analysis. J. Asian Earth Sci. 92, 125–142. doi:10.1016/j.jseaes.2014.06.014
Xu, C., Tian, Y., Ma, S., Xu, X., Zhou, B., Wu, X., et al. (2018). Inventory and spatial distribution of landslides in Ⅸ - Ⅺ high intensity areas of 1920 Haiyuan (China) M8.5 earthquake. J. Eng. Geol. 26 (05), 1188–1195. doi:10.13544/j.cnki.jeg.2018110
Xu, J. (2021). Spatial distribution of seismic landslides and risk assessment in the high impact areas of 1927 Gulang earthquake. Beijing: China University of Geoscience. Master Thesis.
Xu, J., Xu, C., He, X., Wen, B., Ge, K., and Bai, Y. (2020a). Spatial distribution of seismic landslides in the areas of 1927 Gulang M8. 0 earthquake. Earthq. Res. China 34 (01), 5–28. doi:10.19743/j.cnki.0891-4176.202001002
Xu, J., and Xu, C. (2021). The probability of coseismic landslides in different peak ground accelerations: A case of 1927 Gulang M8.0 event. IOP Conf. Ser. Earth Environ. Sci. 861 (5), 052041. doi:10.1088/1755-1315/861/5/052041
Xu, X., Yeats, R. S., and Yu, G. (2010). Five short historical earthquake surface ruptures near the Silk Road, Gansu province, China. Bull. Seismol. Soc. Am. 100 (2), 541–561. doi:10.1785/0120080282
Xu, Y., Allen, M. B., Zhang, W., Li, W., and He, H. (2020b). Landslide characteristics in the Loess Plateau, northern China. Geomorphology 359, 107150. doi:10.1016/j.geomorph.2020.107150
Xu, Y., Du, P., Li, W., Zhang, W., Tian, Q., Xiong, R., et al. (2020c). A case study on AD 1718 Tongwei M7.5 earthquake triggered landslides—application of landslide database triggered by historical strong earthquakes on the Loess Plateau. Chin. J. Geophys. 63 (03), 1235–1248. doi:10.6038/cjg2020N0146
Xu, Y., Jing, L., Allen, M. B., Zhang, W., and Du, P. (2021). Landslides of the 1920 Haiyuan earthquake, northern China. Landslides 18 (3), 935–953. doi:10.1007/s10346-020-01512-5
Yan, L., Li, X., and Ouyang, G. (2021). Research progress in formation mechanism of loess coseismic landslides. J. Inst. Disaster Prev. 23 (02), 46–53.
Yang, W., Qi, W., Wang, M., Zhang, J., and Zhang, Y. (2017). Spatial and temporal analyses of post-seismic landslide changes near the epicentre of the Wenchuan earthquake. Geomorphology 276, 8–15. doi:10.1016/j.geomorph.2016.10.010
Yang, Z.-h., Lan, H.-x., Gao, X., Li, L.-p., Meng, Y.-s., and Wu, Y.-m. (2015). Urgent landslide susceptibility assessment in the 2013 Lushan earthquake-impacted area, Sichuan Province, China. Nat. Hazards (Dordr). 75 (3), 2467–2487. doi:10.1007/s11069-014-1441-8
Yuan, X., Zhao, F., and Duan, Z. (2018). Mechanism of loess landslide induced by river action. Coal Geol. Explor. 46 (04), 154–160. doi:10.3969/j.issn.1001-1986.2018.04.025
Zheng, W., Yuan, D., Zhang, D., He, W., Guo, H., and Liu, B. (2004). Rupture property in the Gulang ms 8.0 earthquake, 1927 and numerical simulation of rupture mechanism. Earthq. Res. China 20 (4), 353–363. doi:10.3969/j.issn.1001-4683.2004.04.005
Zhuang, J., Peng, J., Zhu, X., Li, W., Ma, P., and Liu, T. (2016). Spatial distribution and susceptibility zoning of geohazards along the Silk Road, Xian-Lanzhou. Environ. Earth Sci. 75 (8), 711. doi:10.1007/s12665-016-5428-5
Zou, J., Shao, S., and Jiang, R. (1994). Distribution and tectonic implications on the Gulang seismic landslide. Earthq. Res. China 02, 168–174.
Keywords: Gulang earthquake, loess seismic landslide, spatial distribution, physical properties, microstructure
Citation: Zhong X, Xu X, Chen W, Liang Y and Sun Q (2022) Characteristics of loess landslides triggered by the 1927 Mw8.0 earthquake that occurred in Gulang County, Gansu Province, China. Front. Environ. Sci. 10:973262. doi: 10.3389/fenvs.2022.973262
Received: 20 June 2022; Accepted: 18 August 2022;
Published: 09 September 2022.
Edited by:
Changchun Huang, Nanjing Normal University, ChinaReviewed by:
Ling Yao, Institute of Geographic Sciences and Natural Resources Research (CAS), ChinaFayuan Li, Nanjing Normal University, China
Copyright © 2022 Zhong, Xu, Chen, Liang and Sun. This is an open-access article distributed under the terms of the Creative Commons Attribution License (CC BY). The use, distribution or reproduction in other forums is permitted, provided the original author(s) and the copyright owner(s) are credited and that the original publication in this journal is cited, in accordance with accepted academic practice. No use, distribution or reproduction is permitted which does not comply with these terms.
*Correspondence: Xiumei Zhong, xmzhong26@126.com; Xiaowei Xu, xuxiaowei20@mails.ucas.ac.cn
†These authors have contributed equally to this work and share first authorship