 Yanan Wei
 Yong Zhang2
 Hongyan Chen
- 1National Engineering Research Center for Efficient Utilization of Soil and Fertilizer Resources, College of Resources and Environment, Shandong Agricultural University, Taian, China
- 2Shandong Institute of Territorial and Spatial Planning, Jinan, China
- 3Department of Agronomy, Shandong Agricultural University, Taian, China
In the context of rapid social and economic development, it is important to clarify the evolution process of production–living–ecological space (PLES) and its eco-environmental effects on the sustainable utilization of land resources on industrial bases. Based on existing research, it is difficult to accurately measure the differences in eco-environment quality caused by conversions between land-use types in different years. This paper puts forward an improved area-weighted calculation method of the eco-environmental quality index (EQI), combining the land-use transfer matrix and ecological contribution rate to analyze eco-environmental effects on typical industrial bases. The results show that PLES transitions in Gangcheng District from 2009 to 2020 have been mainly from agricultural production and grassland ecology to forest ecology space, from urban living to industrial production space, and from grassland ecology to agricultural production space. This improved method can capture the environmental changes caused by conversions between land-use types in different years. The EQI of agricultural production space increased from 0.373 to 0.388, while the EQI of forest ecology space decreased from 0.810 to 0.739, and the comprehensive EQI increased from 0.441 to 0.470, showing that the eco-environment quality of the study area was improved overall. The conversions of agricultural production and grassland ecology space to forest ecology space were the main factors in improving eco-environment quality, and the conversions of grassland and forest ecology to agricultural production and of agricultural production to industrial production space were the main reasons for the deterioration of eco-environment quality. This paper may contribute to the scientific planning of land-use direction, support the coordination of regional economic and ecological development, and provide case references for similar regions.
1 Introduction
During rapid urbanization and industrialization, land-use transitions may directly or indirectly impact regional eco-environments, leading to derived eco-environmental effects (Foley et al., 2005; Lambin and Meyfroidt, 2011; Zhang et al., 2011; Haas and Ban, 2014; Hu et al., 2016; Quintas-Soriano et al., 2016; Allington et al., 2017; Hanaˇcek and Rodríguez-Labajos, 2018; Li et al., 2020; Long et al., 2020; Tian et al., 2020). The concept of production–living–ecological space (PLES) was first proposed in the report of the 18th National Congress of the Communist Party of China in 2012 (Hu, 2012), which stressed that “the production space should be intensive and highly efficient, the living space should be moderate and livable, and the ecological space should be unspoiled and beautiful” (Sun et al., 2020; Wang et al., 2020; Fu and Zhang, 2021). Research on land-use transitions and eco-environmental effects from the perspective of PLES is an important basis for optimizing the rational allocation of land resources and for constructing an ecological civilization, which has become a major topic in current research (Li et al., 2016; Liu et al., 2017; Asadolahi et al., 2018; Luo et al., 2018; Hu M. et al., 2019; Hu S. et al., 2019; Lou et al., 2019; Asabere et al., 2020; Tan et al., 2020; Xie et al., 2021; Wang et al., 2022). Eco-environmental quality index (EQI) can quantitatively describe the characteristics of eco-environmental quality and its spatial-temporal evolution, and it has been widely used since its proposal (Dong et al., 2021; Han et al., 2021; Wang Y. et al., 2021).
Research methods for quantitatively describing the relationship between land-use transitions and eco-environmental quality using EQI can be roughly divided into three types. The first method assigns each secondary land-use space a different weight as a unit. Li et al. assigned the secondary space to analyze the characteristics of land-use transitions and their impacts on the eco-environment in the central Guizhou region (Li et al., 2021). Wang et al. assigned the secondary space to explore the characteristics of land-use transitions and their impacts on eco-environmental quality in Yingtan City (Wang R. et al., 2021). This method is easy to assign and simple to construct, but it cannot capture the impacts of various land-use types on eco-environment quality. For example, the forest ecology space consists of woodland, shrubbery and other woodland, which have different impacts on the eco-environment. Therefore, this method cannot accurately quantify the impacts of different land-use types on eco-environment quality.
In the second method, each land-use type is assigned a different ecological weight according to its characteristics and their influence on the eco-environment. The EQI of secondary space is then calculated by the area-weighted method. For example, Hao et al. assigned different weights to each land-use type to explore the response characteristics of land-use change and eco-environment in the farming-pastoral ecotone of China (Hao and Ren, 2009). Gao et al. evaluated the relationship between land-use transition and eco-environment quality in Xining City, Qinghai Province by assigning a different weight to each land-use type and combining it with the transfer matrix (Gao et al., 2019). In contrast to the first method, the second can capture the relationship between land-use type and environmental quality and can meet the needs of a single-year environmental quality assessment. However, this eco-environment effect analysis requires a certain sequence of land use and environmental quality data from different years. The change in land-use area during a certain time series is usually large, and the impact on environmental quality in different years must be reflected.
The third method takes land-use types as assignment units and adopts the area-weighted method in different years to construct the index system. Each land-use type is given a different weight as a unit; taking the area of land-use types in each year into account, the EQI is calculated by an area-weighted method. For example, Kong et al. assigned different land-use types, calculated the average area in 1990, 2000, 2010, and 2018, and then calculated the EQI to measure PLES changes and their eco-environmental effects in China (Kong et al., 2021). To explore the eco-environmental effects of land-use transition in the Beijing–Tianjin–Hebei urban agglomeration, Yang et al. assigned different land-use types, calculated the EQIs for 1985, 1995, 2005, and 2018, and then calculated the average EQI to obtain the final index system (Yang et al., 2020a). Such methods not only reflect the relationships between different land-use types and environmental quality but also reflect the eco-environmental effect caused by land-use change in different years. However, in existing studies, the EQI of the secondary land-use space has been mostly determined by averaging the areas of land-use types in different years. This method can only represent the average impact degree of secondary land-use space on eco-environmental quality over a long time series and cannot accurately describe differences in secondary space in different years.
As the above analysis shows, the first method is simple and convenient but cannot describe the relationship between land-use types and eco-environment quality. The second considers eco-environment quality differences in different land-use types but cannot describe eco-environment quality differences caused by conversions between land-use types in different years. The third method considers eco-environment quality differences of land-use types in different years, combined with the area-weighted method, to meet the requirements of eco-environmental quality assessment in different years. However, in most existing studies, land-use types have been weighted according to the average area in different years, and the conversion of land-use types between different years has led to a change in the area proportion of land-use types in the secondary space. In the same secondary space, the area proportion of land-use types with high EQIs decreases, and the proportion with low EQIs increases, leading the EQI of the secondary space to decrease. Therefore, conversions of land-use types lead the EQI of the secondary space to change in different years. To more accurately and concretely reflect the impact of secondary space on eco-environmental quality in different years, it is necessary to calculate the EQIs of different years, taking the area of land-use types in different years into account.
As an area transforming from old to new, Gangcheng District has prioritized industrial transformation in recent years. The eco-environment effects caused by land-use transitions remain unexplored. Taking the Gangcheng District, a typical industrial base, as an example, this paper proposes an improved area-weighted method according to actual conversions between land-use types in different years and calculates the EQIs of 2009, 2015, and 2020, respectively, by taking land-use types as assignment units. Then, the land-use transfer matrix and ecological contribution rate are combined to quantitatively analyze the eco-environmental effects from 2009 to 2020. This analysis can provide data and decision-making support for the territorial space optimization of industrial bases and for regional sustainable development.
2 Materials and methods
2.1 Study area
Gangcheng District (117°40′56″-117°58′07″ E, 35°59′32″-36°17′16″ N) is located in the hinterland of Shandong Province, at the eastern foot of Mount Tai, and is under the jurisdiction of Jinan City (Figure 1). It has a total population of 330,000 and a total area of 507 km2. The study area is hilly, surrounded by mountains on three sides—east, west, and south—and is open in the middle and the north. The overall terrain from the east, west, and south is tilted toward the center. The area is rich in good-quality mineral resources. Its metal minerals are mainly iron, copper, zinc, aluminum, cobalt, and gold. Its non-metallic minerals are mainly coal, limestone, marble, quartz, and clay. Gangcheng District is an important steel and energy base in Shandong Province. As the only new industrial base named for steel, it is known as the “steel and coal capital.” Its steel output accounts for 15% of the province’s economy, and the proportion of medium and high quality steel reaches more than 70%.
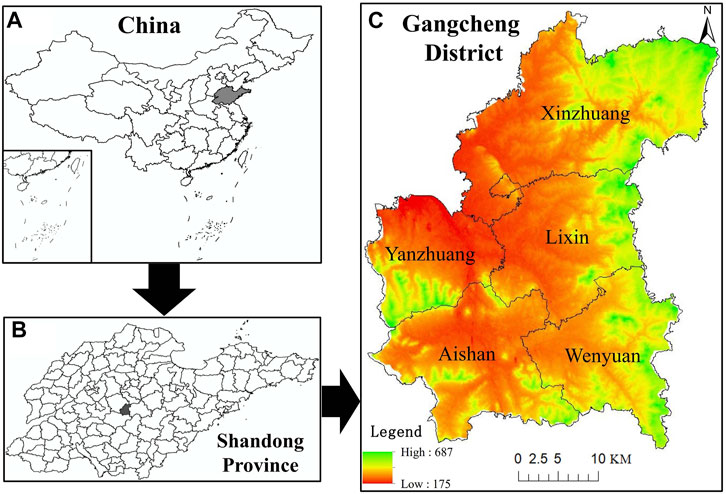
FIGURE 1. Location of the study area.
In recent years, according to its belief in prioritizing industrial transformation and upgrades, Gangcheng District has accelerated its transformation by focusing on the creation of high-quality steel, prefabricated green buildings, new materials, and auto parts, and on other industries. The district has been transformed from a heavy industrial base into a “green steel base.” With the important historical opportunity of the Yellow River basin’s ecological protection and high-quality development, Gangcheng District has strived to build a beautiful and modern high-quality steel base.
2.2 Data sources and preprocessing
The land-use status data in 2009, 2015, and 2020 comes from the investigation of land-use change. The image data used in the investigation has a resolution of greater than 2.5 m. According to the dominant function principle, referring to the existing commonly used classification criteria (Yu et al., 2017; Zhang et al., 2017), the PLES classification system was constructed by merging land-use types. The land-use types are divided into three main functions: production, living, and ecological spaces. Production space refers to land that provides material products for human beings, including the agricultural, industrial, and service production spaces. Ecological space refers to land that provides ecological services, including forest and grassland ecology space. Living space refers to land for people’s living, consumption, leisure, and entertainment, including urban and rural living spaces (Table 1). Referring to the existing research results (Yang et al., 2020b; Hu et al., 2021) and in combination with the actual situation of the study area, weights were assigned to each land-use type in the secondary space to establish the relationship between land-use type and eco-environment quality.
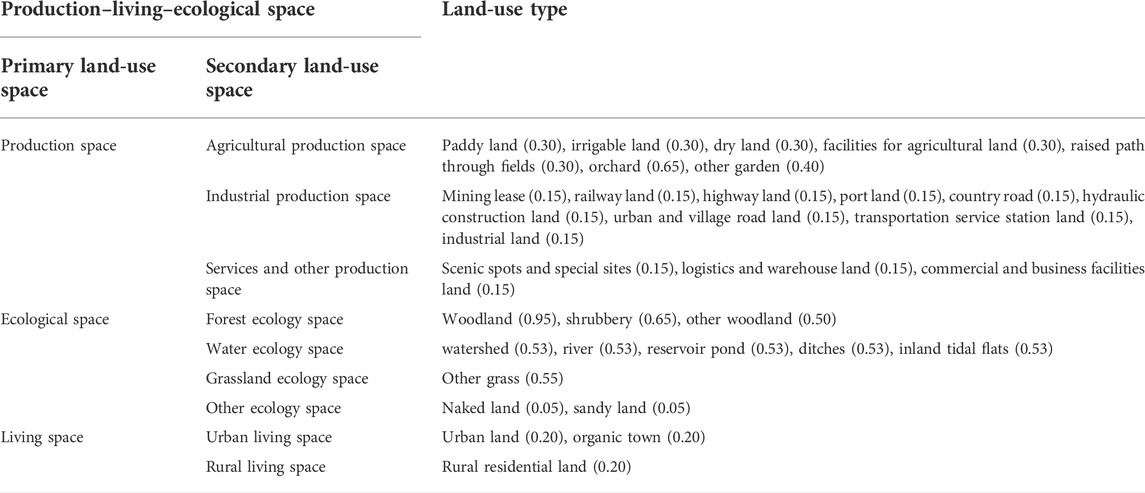
TABLE 1. Production–living–ecological space classification and ecological weight assignment.
2.3 Analysis of land-use characteristics
Based on the PLES classification system, the spatial distribution map of primary land-use space was obtained by merging land-use types in ArcGIS 10.2 software, and the PLES distribution characteristics for 2009, 2015, and 2020 were analyzed. Then, the quantitative changes in PLES were explored from 2009 to 2020.
2.4 Analysis of land-use transition mode
Overlay analyses were conducted on the spatial distribution map using ArcGIS 8 software to make land-use transfer matrixes, which were used to analyze the quantity and direction of land-use spatial transfer and to explore the transition characteristics of the land-use function (Wang and Bao, 1999). The formula is as follows:
where S is land-use area; n is the number of land-use types; and i and j represent land-use types at the beginning and end, respectively.
2.5 Analysis of the spatial-temporal pattern of land-use transition
To analyze the dynamic change characteristics of land-use space, based on the primary land-use spatial distribution maps, the change map of PLES distributions for 2009–2015, 2015–2020, and 2009–2020 was generated using the Erasing Tool in ArcGIS 10.2. Then, the spatial-temporal variation characteristics for different years were analyzed. The spatial distribution change maps were divided into three parts—constant area, increasing area, and decreasing area—based on the primary land-use space. Finally, the spatial-temporal patterns of land-use transition were obtained.
2.6 EQI calculation based on the improved area-weighted method
EQI was used to quantitatively describe the eco-environment quality of different land-use spaces in different years and to portray the overall situation according to the ecological quality and structure proportion in the study area. According to the ecological weight assignment of each land-use type, the EQIs for 2009, 2015, and 2020 were calculated by year using the area-weighted method with the following formula:
where EQI is the eco-environmental quality index of the period t in the region; LU and C are the area and ecological weight of the i land-use space in the region during the t period, respectively; TA is the total land area of the study region; and N is the amount of land-use space in the region.
The traditional average area-weighted formula is as follows:
where EQIaverage is the average eco-environmental quality index in the region; LU and C are the area and average ecological weights of the i land-use space in the region, respectively; TA is the total land area of the study region; and N is the amount of land-use space in the region.
In the average area-weighted formula, C is the average weight of several years, and this weight value can only represent the average impact of land-use type on the eco-environment in this period. In the improved area-weighted formula, C is the weight of a particular year, and this weight can specifically reflect the impact of a certain land-use type on eco-environmental quality in a particular year.
2.7 Analysis of spatial-temporal characteristics of eco-environmental quality
To analyze spatial-temporal quality characteristics, the EQI of each ecological unit was calculated by the grid method. Different research scales were selected due to the scale dependence of geospatial data, resulting in different conclusions. To obtain the optimal size, land patches were regarded for sampling points. After several tests, referring to the empirical formula (Sudhira et al., 2004), a 150 m × 150 m grid was selected for isometry sampling in the study area, and 24,700 sample areas were generated. The EQI was quantitatively analyzed by considering the land-use area and eco-environment status of each unit comprehensively. Its expression is:
where EV(x) is the eco-environmental quality index of the X ecological unit; Ri is the ecological weight of the ith land-use space; Sxi is the area of the ith land-use space in the x ecological unit; Sx is the area of the X ecological unit; and N is the amount of land-use space in the region.
Then, the results were divided into five levels (Yang et al., 2018) according to the actual situation of the study area: low-quality areas (0<EV ≤ 0.2), medium-low-quality areas (0.2<EV ≤ 0.35), medium-quality areas (0.35<EV ≤ 0.5), medium-high-quality areas (0.5<EV ≤ 0.65), and high-quality areas (0.65 < EV < 1).
2.8 Analysis of eco-environmental effects of land-use transition
The ecological contribution rate was used to analyze eco-environmental effects and to measure the impact of each land-use transition on the eco-environment. The ecological contribution rate of land-use transition refers to the change of regional eco-environment quality caused by the change of a certain land-use space. It quantifies the impact of each land-use space conversion on the regional eco-environment. Its calculation formula is as follows:
where LEI is the ecological contribution rate of land-use transitions; LE0 and LE1 are the EQIs of a certain land-use type in 2009 and 2020, respectively; LA is the area of the changed land-use type; and TA is the total land area of the study region.
3 Results
3.1 Land-use characteristics from the perspective of PLES
The distribution map of primary land-use space is shown in Figure 2. Production space accounted for the largest proportion and was widely distributed in the whole region. Ecological space was concentrated in the northeast and southwest of the study area. Living space was the least concentrated in the central and southern urban areas. In terms of the overall change from 2009 to 2020, ecological space increased significantly, from 35 to 41%; living space decreased significantly, from 16 to 8%; and production space remained stable at about 50%.
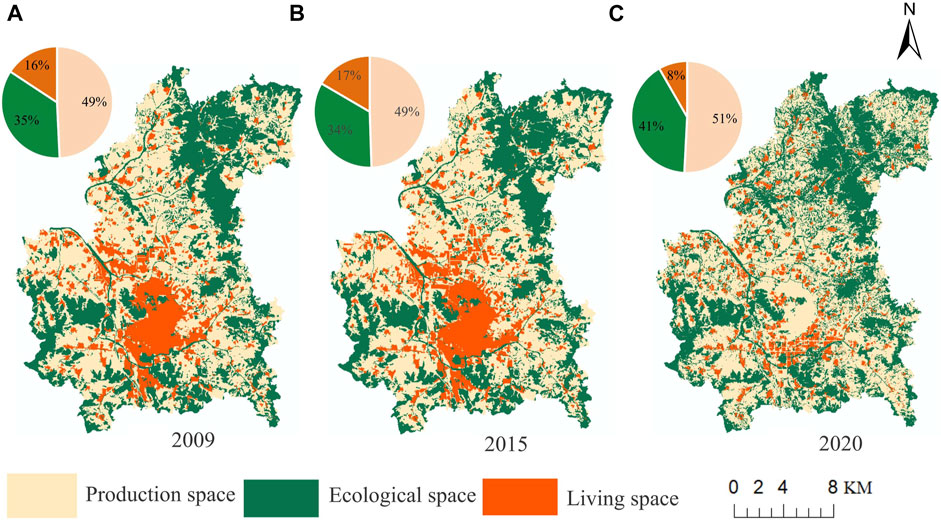
FIGURE 2. Distribution map of the primary land-use space.
3.2 Land-use transition mode
3.2.1 Land-use transition characteristics and causes from 2009 to 2015
Based on the transfer matrix of primary land-use space (Table 2), from 2009 to 2015, the area conversion from production space to living space was the largest, at 534.63 hm2, followed by the area conversion from ecological space to production space, at 489.09 hm2. The area of other land-use space transitions, such as living space to production space and ecological space to living space, was relatively small. Therefore, the land-use transitions from 2009 to 2015 were mainly from production space to living space and from ecological space to production space.
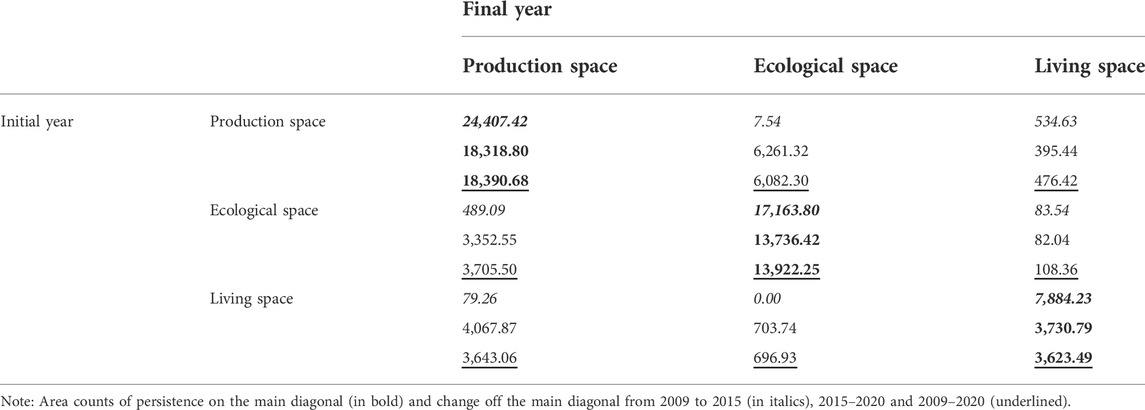
TABLE 2. Transfer matrix of the primary land-use space from 2009 to 2020 (hm2).
Based on the transfer matrix of secondary land-use space (Table 3), grassland ecology space was transformed into agricultural production space and agricultural production space into urban living space, which was the main transition from 2009 to 2015. Among them, grassland ecology space transferred to agricultural production space was the largest, with an area of 447.76 hm2. Grassland was developed and utilized for agricultural production space. In addition, agricultural production space was transformed into urban and rural living spaces, with areas of 211.63 hm2 and 320.86 hm2, respectively. This was mainly due to urban expansion and to the large-scale mining of mineral resources that occupy a large amount of space. Therefore, the direction of land-use transitions from 2009 to 2015 was mainly from grassland ecology space to agricultural production space and from agricultural production to urban and rural living space.
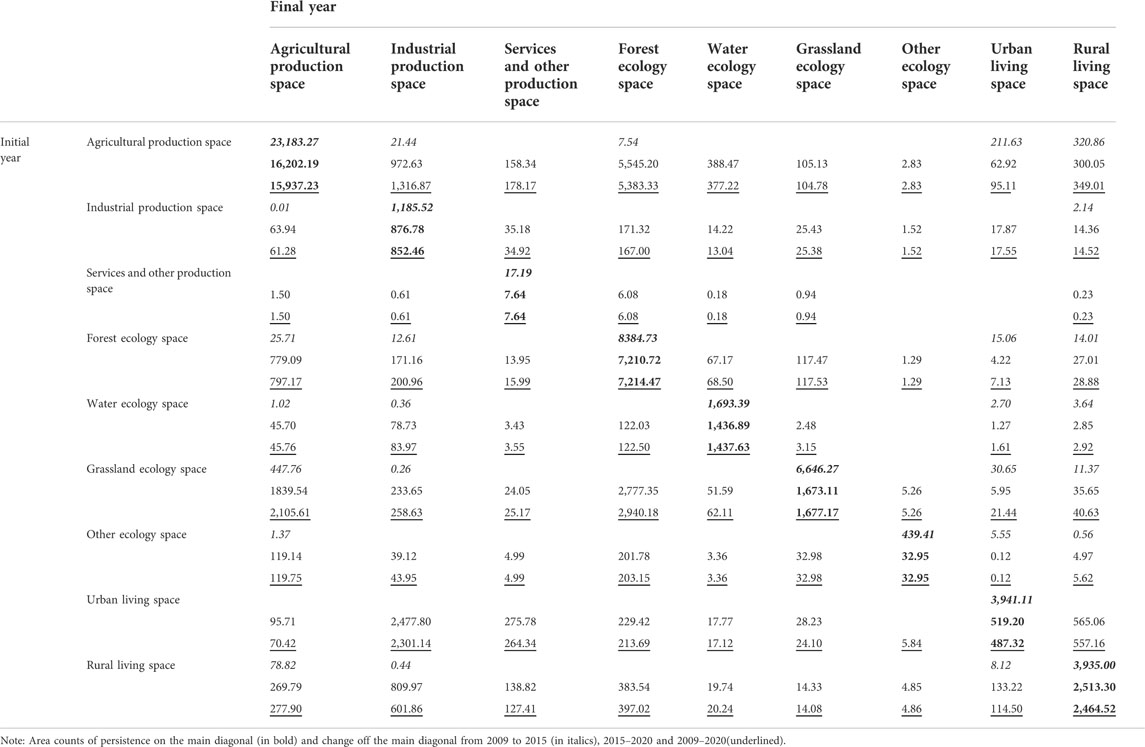
TABLE 3. Transfer matrix of the secondary land-use space from 2009 to 2020 (hm2).
3.2.2 Land-use transition characteristics and causes from 2015 to 2020
Based on the transfer matrix of primary land-use space (Table 2), from 2015 to 2020, the area conversion from production space to ecological space was the largest, at 6,261.32 hm2, followed by the conversion from living and ecological space to production space, at 4,067.87 hm2 and 3,352.55 hm2, respectively. In other land-use spaces, the conversion area from living to ecological space, from production to living space, and from ecological space to living space was relatively small. Therefore, land-use transitions from 2015 to 2020 were mainly from production to ecological space and from living and ecological space to production space.
The transfer matrix of secondary land-use space (Table 3) revealed many obvious changes. Agricultural production space and grassland ecology space transformed into forest ecology space had the largest areas, at 5,545.20 hm2, and 2,777.35 hm2, respectively. During this period, grassland was developed and utilized as forest land. The adjustment of agricultural structure turned the large area of agricultural production space into forest ecology space. The conversion area between urban living space and industrial production space was also large (2,477.80 hm2) because the land of the Laiwu Iron and Steel Group Co., Ltd. was reclassified from the original urban construction land to industrial land (that is, from living space to production space) in the third National Land Resource Survey. The areas of grassland and forest ecology space transformed into agricultural production space were 1839.54 hm2 and 779.09 hm2, respectively, while the areas of rural living and agricultural production space transformed into industrial production space were 809.97 hm2 and 972.63 hm2, respectively. The transitions from grassland and forest ecology space to agricultural production space, and from rural living and agricultural production to industrial production space, were also important directions. Therefore, the transitions from 2015 to 2020 were mainly from agricultural production and grassland ecology to forest ecology space, from urban living to industrial production space, and from grassland ecology to agricultural production space.
3.2.3 Land-use transition characteristics and causes from 2009 to 2020
Based on the transfer matrix of primary land-use space (Table 2), from 2009 to 2020, the area conversion from production space to ecological space was the largest, at 6,082.30 hm2, followed by the conversion from living and ecological space to production space, which was 3,643.06 hm2 and 3,705.50 hm2, respectively. In other land-use spaces, the conversion area from living to ecological space, from production to living space, and from ecological space to living space was relatively small. Therefore, land-use transitions from 2015 to 2020 were mainly from production to ecological space and from living and ecological space to production space.
Based on the transfer matrix of secondary land-use space (Table 3), the characteristics of land-use conversion between 2009 and 2020 were similar to those between 2015 and 2020. Agricultural production space and grassland ecology space transformed into forest ecology space had the largest area, 5,383.33 hm2, and 2,940.18 hm2, respectively. The conversion area between urban living space and industrial production space was also large, 2,301.14 hm2. The areas of grassland and forest ecology space transformed into agricultural production space were 2,105.61 hm2 and 797.17 hm2, while the areas of rural living and agricultural production space transformed into industrial production space were 601.86 hm2 and 1,316.87 hm2, respectively. The reasons for the transformation are analyzed in Section 3.2.2. Therefore, the direction of land-use transitions from 2009 to 2020 was mainly from agricultural production and grassland ecology to forest ecology space, from urban living to industrial production space, and from grassland ecology to agricultural production space.
3.3 Spatial-temporal patterns of land-use transition from 2009 to 2020
According to the land-use transition mode in Section 3.2, the land-use changes in 2009–2015 were not significant compared to 2015–2020. Therefore, this study mainly analyzed the spatial-temporal patterns of land-use transition in 2009–2020. Figure 3 shows the changes in the distribution of PLES in the study area from 2009 to 2020. Overall, living space decreased while production and ecological space increased.
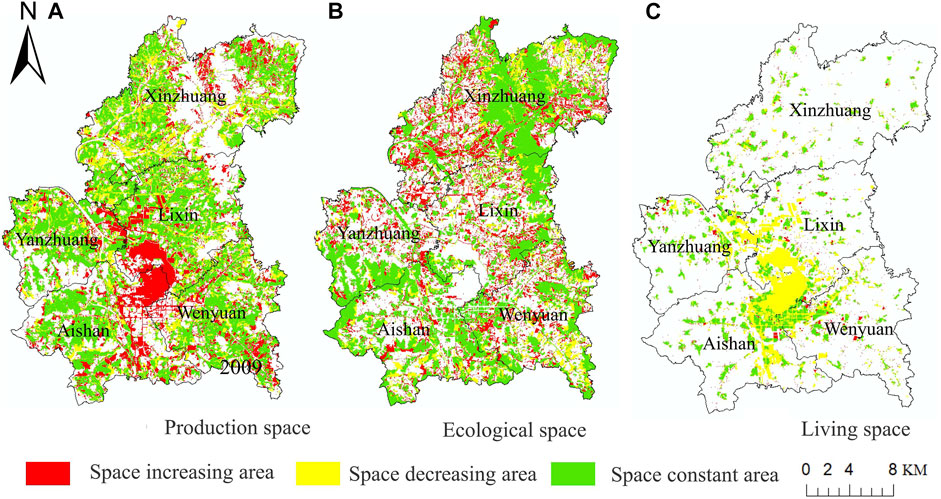
FIGURE 3. Change map of production–living–ecological space in distribution.
The increasing area of production space was mainly distributed in Xinzhuang Town, on Lixin Street and Aishan Street, which were as follows. 1) West of Lixin Street and east of Aishan Street were the transitions from living space to production space. The reason was that the above-mentioned third National Land Resource Survey reclassified Laiwu Iron and Steel Group Co., Ltd. as industrial land rather than the original urban construction land, that is, from the original living space to production space. 2) Northeast of Xinzhuang Town and southeast of Wenyuan Street, the ecological space was transformed into production space. This was a transition from grassland and forest ecology space to agricultural production space, as defined by the transition characteristics and cause analysis of secondary space in Section 3.2.3.
The increasing area of ecological space was widely distributed in all streets and towns of Gangcheng District, especially in Xinzhuang Town, and was mainly a transition from production to ecological space. As the previous analysis shows, it was a transition from agricultural production to forest ecology space.
3.4 EQI
Table 4 shows the EQI calculated by the improved area-weighted method based on the actual conversions between land-use types in different years. The EQI of forest ecology space was the highest, above 0.7. This was followed by watershed ecology space, grassland ecology space, and agricultural production space, with EQIs ranging from 0.3 to 0.6. The lowest were industrial and mining production space, service and other production spaces, other ecology spaces, urban living space, and rural living space, with EQIs of less than 0.2.
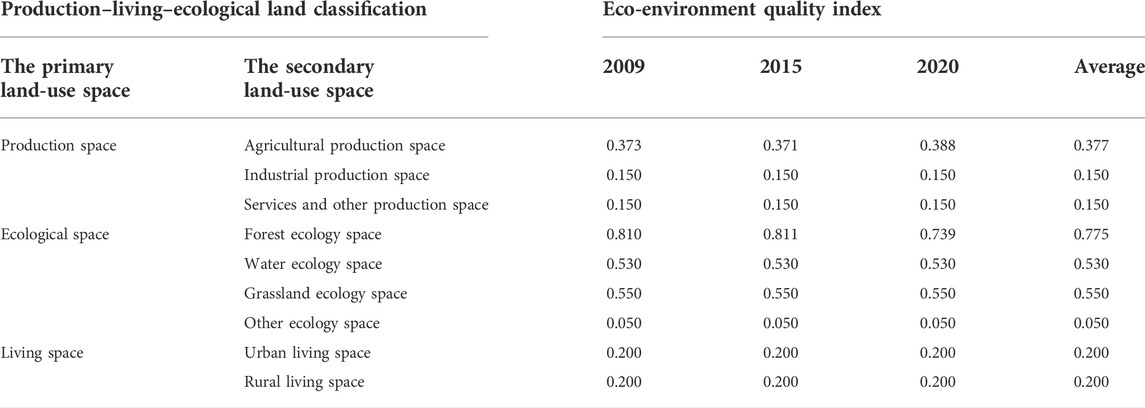
TABLE 4. Eco-environment quality index.
In 2009, 2015, and 2020, the EQI of secondary land-use space changed little, and only the agricultural production space and forest ecology space changed. From 2009 to 2020, the EQI of agricultural production space increased slightly from 0.373 to 0.388, while the forest ecology space decreased from 0.810 to 0.739, a relatively large decrease. Taking agricultural production space as an example, the reasons for the change of EQI were analyzed. Agricultural production space included irrigated land, dry land, orchards, and other gardens. The change in land-use area led to a change in area proportion. From 2009 to 2020, the decrease in the cultivated land area caused the area proportion of orchards and other gardens in agricultural production space to increase. In other words, the proportion of cultivated land with relatively low EQI (0.3) decreased, and the proportion of orchards (0.65) and other gardens (0.40) with high EQIs increased. Finally, the EQI of the agricultural production space increased.
Based on the annual comprehensive EQI, the variation trend was obtained (Figure 4). The results show that the comprehensive EQI of the study area decreased from 0.441 in 2009 to 0.436 in 2015 and then increased to 0.470 in 2020, showing an initial slight decline and then a sharp rise. The improvement was especially significant from 2015 to 2020. The analysis of land-use transition from 2009 to 2015, in Section 3.2 and Section 3.3, shows that the land-use transition direction was mainly from grassland ecology space into agricultural production and from agricultural production into urban and rural living space. Additionally, the EQI of grassland ecology space was higher than that of agricultural production space and higher than that of urban and rural living space. Although the development and utilization of grassland supplement cultivated land, they had a slight impact on the eco-environment. Although the occupation of cultivated land for construction promoted the development of economy, it had a drastic impact on the eco-environment. The rapid improvement of the comprehensive EQI from 2015 to 2020 was attributed to the main land-use transition direction during this period, which was agricultural production and grassland ecology space transformed into forest ecology space, with a large increase in woodlands and improved eco-environment quality.
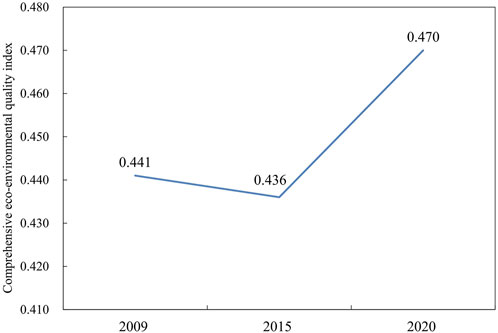
FIGURE 4. Changing trend of comprehensive eco-environment quality index.
The weight only represents the contribution degree of land-use space to the eco-environment. Comprehensive EQI is related not only to the weight of secondary ecological space but also to its area. The EQI of agricultural production space increased slightly, from 0.373 to 0.388, from 2009 to 2020, and the area of agricultural production space decreased. Similarly, the EQI of forest ecology space decreased from 0.810 to 0.739, and the area of forest ecology space increased greatly. Therefore, according to the formula in Section 2.6, the comprehensive EQI increased from 0.441 to 0.470.
Overall, the EQI increased significantly from 2009 to 2020, indicating that the study area had the strength to drive breakthroughs in ecological protection, environmental quality improvement, and the adjustment of land-use patterns. But this process also involved the problems of “non-food” and “non-agriculture.”
3.5 Spatial-temporal characteristics of eco-environment comprehensive quality
The grade tables in 2009 and 2020 (Table 5) show that the overall eco-environment quality of the two periods was relatively consistent, with the medium-quality area taking the highest proportion, about 40%, followed by the high-quality area, about 20%, and the medium-high-quality area and low-quality areas, both about 15%. The medium-low-quality area took the lowest proportion, at 7.52%. However, the proportion of each grade in the two years was different. The spatial distribution map of eco-environment quality levels (Figure 5) shows that the overall distribution was relatively consistent. The medium-high-quality and high-quality areas were mainly distributed east of Xinzhuang Town, Lixin Street, and Wenyuan Street, as well as southwest of Yanzhuang Town. The medium-quality area was mainly distributed in west of Xinzhuang Town, Lixin Street, Aishan Street, and Wenyuan Street, as well as north of Yanzhuang Town. The low-quality and medium-low-quality areas were mainly distributed west of Lixin Street, northeast of Aishan Street, and north of Yanzhuang Town. The spatial distribution was as follows: the eco-environmental quality of Gangcheng District had significant spatial differentiation, presenting an overall distribution pattern that was high in the periphery and low in the middle.
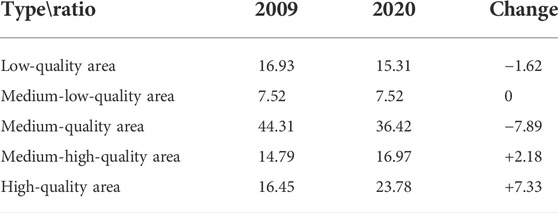
TABLE 5. Eco-environment quality grades (%).
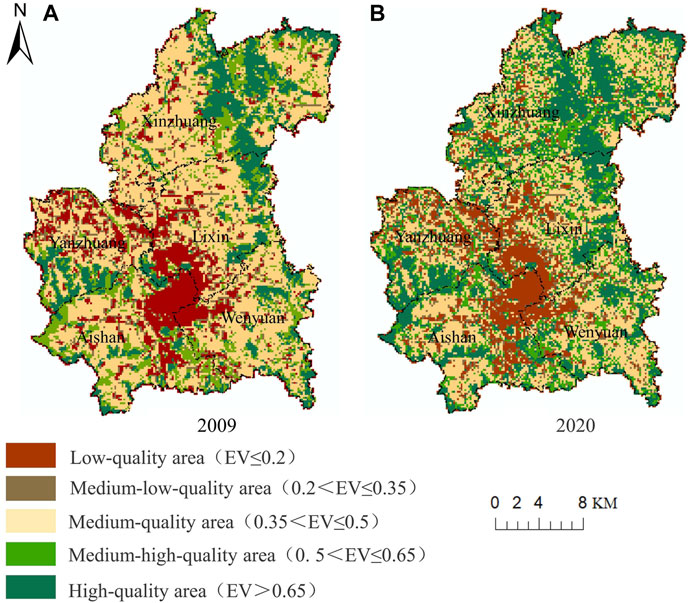
FIGURE 5. Spatial distribution of the eco-environment quality levels. Note: EV is the eco-environmental quality index of each ecological unit.
Comparing the quantity changes in two periods, the proportions of low-quality area, medium-low-quality area, and high-quality area from 2009 to 2020 were essentially the same. The proportion of medium-quality area and high-quality area changed greatly, with the medium-quality area decreasing by 7.89% and the high-quality area increasing by 7.33%. In general, the changes in eco-environmental quality grades from 2009 to 2020 were mainly the decrease in middle-quality area and the increase in high-quality area.
3.6 Eco-environmental effects of land-use transition
Based on the ecological contribution rate from 2009 to 2020 (Table 6), the land-use transitions that affected eco-environment improvement included agricultural production, grassland ecology, rural living, other ecology, urban living, and industrial production, which were all transformed into forest ecology space. Among these, the transitions from agricultural production and grassland ecology into forest ecology space were the main factors, and their ecological contribution proportions were 58.30 and 16.35%, respectively. Therefore, the adjustment of agricultural structure, the development and utilization of grassland, and the conversion from cultivated land and grassland into woodland can greatly improve the eco-environment quality.
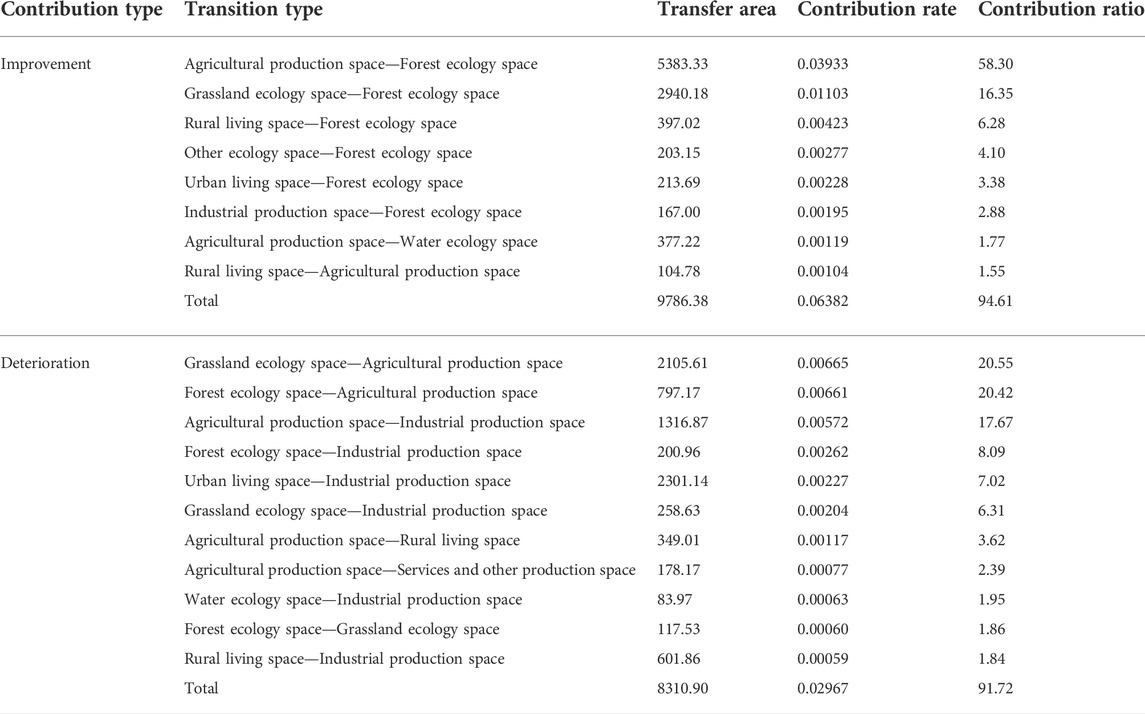
TABLE 6. Main land-use transitions and their eco-environmental contribution rate (hm2, %).
From 2009 to 2020, the land-use transitions affecting eco-environment deterioration included the transitions of grassland ecology space and forest ecology space into agricultural production space, and the transitions of agricultural production space, grassland ecology space, forest ecology space and urban living space into industrial production space. Among these, the transitions from grassland and forest ecology space to agricultural production space, and from agricultural production to industrial production space were the main factors, with the ecological contribution proportion of the three at about 20% each, totaling 58.64%. In addition, the transitions from the forest ecology, urban living, and grassland ecology spaces to industrial production space were secondary factors, with the ecological contribution proportions of the three at about 7% each, or 21.42% in total. Therefore, Gangcheng District should take this as a reference and avoid the occupation of ecological and living space by production space while guaranteeing production.
In general, the changes in ecological quality from 2009 to 2020 were mainly due to transitions from agricultural and industrial production to grassland and forest ecology space. In addition, the positive contribution rate of agricultural production and grassland ecology space to forest ecology space was greater than was the negative contribution rate of forest and grassland ecology space to agricultural production and agricultural production to industrial production space. Overall, the eco-environment improved from 2009 to 2020. In strengthening its ecological civilization concept under the guidance of a new round of national space planning, Gangcheng District should continue strengthening territorial space control and adjusting land use structure in order to realize the harmonious development of eco-environment protection and social economy.
4 Discussion
4.1 Effectiveness of the improved method
To verify the effectiveness, the improved area-weighted method was compared with the average area-weighted method, with forest ecology space as an example. The relevant results are shown in Table 8.
Forest ecology space consists of woodland, shrubbery, and other woodland. From 2009 to 2020, the dramatic increase of forest ecology space was due to transitions from agricultural production and grassland ecology space in 2009 into undeveloped forest land in 2020, which belongs to the other woodland category. To assess the actual conversions between land-use types in different years, the improved method was adopted to calculate the EQI. When the area of other woodland increased, the area proportion of other woodland increased while that of woodland and shrubbery decreased in forest ecology space. In other words, the area proportion of other woodland (EQI of 0.50) with relatively low EQI increased, while the area proportions of woodland (EQI of 0.95) and shrubbery (EQI of 0.65) with high EQI decreased. Therefore, the EQI of forest ecology space decreased from 0.81 to 0.77, which indicates that the EQI of forest ecology space in 2020 was lower than in 2009 and 2015.
The average area-weighted method was used to calculate the EQI by taking the mean area of land-use type in different years. The results show that the mean EQI of forest ecology space from 2009 to 2020 was 0.77, indicating that the EQI of forest ecology space was unchanged during this period. Therefore, the average area-weighted method cannot reflect the impact of land-use type conversion on environmental quality in different years, but the improved area-weighted method can describe this difference.
4.2 Accuracy of EQI in the study area
According to the actual situation of typical industrial bases and by consulting local experts, this study assigned weights to each land-use type and constructed an index system that conforms to the characteristics of the study area. At the same time, the area-weighted method was improved to calculate the comprehensive EQI of Gangcheng District according to the actual land-use type conversion. The comprehensive EQI decreased from 0.441 in 2009 to 0.436 in 2015, and then increased to 0.470 in 2020, which is consistent with the actual development of the Gangcheng District in the past 10 years. Before 2015, Gangcheng District had vigorously developed steel and other heavy industries to comprehensively promote economic development, but the environment suffered to a certain extent. Since the Central Committee of the Communist Party of China and the State Council issued the Overall Plan for Ecological Civilization System Reform in September 2015, Gangcheng District has actively implemented ecological protection policies and promoted ecological civilization construction. In 2018, a greening campaign was launched to protect and restore mountains, rivers, forests, farmland, lakes, and grasses; focus on industrial transformation; accelerate the shift from old to new drivers of growth; and actively improve the eco-environment. Therefore, the results obtained using the improved area-weighted method proposed in this paper align with the actual situation of the study area. The paper provides specific data references for future land-use structure change and industrial transformation in Gangcheng District and provide technical and case references for exploring the eco-environmental effects of future land-use transformation in other industrial bases.
4.3 Applicability of the study
Eco-environmental effect analysis involves complicated factors, and the distribution of ecological resources varies considerably in different regions (Chen et al., 2020; Hu et al., 2021). Different regions are assigned different values, so their comprehensive EQIs are also different from each other. For example, Dong et al. assessed the environmental condition of Gansu Province and found that its comprehensive EQI decreased from 0.2662 in 1980 to 0.2653 in 2000 and then rose to 0.2682 in 2018. The eco-environment of Gansu Province is fragile, and soil erosion and desertification are serious. The final calculated index was relatively low, which reflects the actual situation (Dong et al., 2021). Xiang et al. assessed the environmental quality of Pingshan County in Shijiazhuang City and found that the regional comprehensive EQIs in 2005, 2010, and 2015 were 0.4504, 0.5719, and 0.5800, respectively. Pingshan County is an important water conservation base and an important region for environmental protection and construction. Consequently, the index was relatively high and consistent with reality (Xiang et al., 2021). As a typical industrial base, the comprehensive EQI in Gangcheng District is higher than that of a typical ecologically fragile area and lower than that of a water conservation base, which is consistent with its macro-regional distribution characteristics and its actual situation. Thus, the comprehensive EQI determined from the analysis well reflects the regional eco-environment level according to the actual situation of the study area.
4.4 Shortcomings of the study
Referring to the existing literature and the dominant function principle, this paper constructed the PLES classification system and analyzed land-use transition and its eco-environmental effects from 2009 to 2020. The results were consistent with the actual situation. This classification system is simple, convenient, clear, and easy to understand. A particular land-use type may have multifunctional properties, including both its main and additional functions. For example, arable land has both productive and ecological functions; however, the production function is its main function, and its ecological function is only incidental. Considering the multifunctional properties of the land can be more complicated and may produce slightly different results. With future research, the multi-functionality of land will be considered for classification.
5 Conclusion
Based on the spatial-temporal pattern analysis of land-use transition in the study area, this paper put forward an improved area-weighted calculation method for EQI to analyze eco-environmental effects. The results show that the improved method can more specifically describe the impact of conversion between land-use types on environmental quality in different years.
1) From 2009 to 2020, the comprehensive EQI first decreased from 0.441 to 0.436 and then increased significantly to 0.470.
2) On the whole, the eco-environment quality of the study area was improved, mainly because the positive ecological contribution rate of land-use transition was greater than the negative ecological contribution rate. The positive ecological contribution rate was mainly caused by transitions from agricultural production and grassland ecology into forest ecology space; the negative ecological contribution rate was caused by transitions from forest and grassland ecology space into agricultural production space and from agricultural production into industrial production space.
3) Therefore, it is suggested to continue implementing ecological protection policies; protecting the arable land; controlling effectively the expansion of residential, industrial, and mining land area; and expanding the ecological land area to ensure food security.
The study not only enriches the case of industrial city eco-environmental effect analysis but also provides a reference for future territorial spatial planning and for the high-quality development of industrial bases.
Data availability statement
The original contributions presented in the study are included in the article/supplementary materials, and further inquiries can be directed to the corresponding author.
Author contributions
YW: conceptualization, methodology, data analysis, writing of original draft. YZ: investigation, supervision. LC: visualization, investigation. HC: conceptualization, methodology, writing of original draft, funding acquisition. XZ: validation, investigation. PL: funding acquisition.
Funding
This research was funded by the Key Research and Development Project of Shandong Province, grant number LJNY202103, and the Natural Science Foundation of Shandong Province of China, grant number ZR2019MD039.
Conflict of interest
The authors declare that the research was conducted in the absence of any commercial or financial relationships that could be construed as a potential conflict of interest.
Publisher’s note
All claims expressed in this article are solely those of the authors and do not necessarily represent those of their affiliated organizations, or those of the publisher, the editors and the reviewers. Any product that may be evaluated in this article, or claim that may be made by its manufacturer, is not guaranteed or endorsed by the publisher.
References
Allington, G. R., Li, W., and Brown, D. G. (2017). Urbanization and environmental policy effects on the future availability of grazing resources on the Mongolian Plateau: Modeling socio-environmental system dynamics. Environ. Sci. Policy 68, 35–46. doi:10.1016/j.envsci.2016.11.005
Asabere, S. B., Acheampong, R. A., Ashiagbor, G., Beckers, S. C., Keck, M., Erasmi, S., et al. (2020). Urbanization, land use transformation and spatio-environmental impacts: analyses of trends and implications in major metropolitan regions of Ghana. Land Use Policy 96, 104707. doi:10.1016/j.landusepol.2020.104707
Asadolahi, Z., Salmanmahiny, A., Sakieh, Y., Mirkarimi, S. H., Baral, H., and Azimi, M. (2018). Dynamic trade-off analysis of multiple ecosystem services under land use change scenarios: Towards putting ecosystem services into planning in Iran. Ecol. Complex. 36, 250–260. doi:10.1016/j.ecocom.2018.09.003
Chen, W., Zhao, H., Li, J., Zhu, L., Wang, Z., and Zeng, J. (2020). Land use transitions and the associated impacts on ecosystem services in the Middle Reaches of the Yangtze River Economic Belt in China based on the geo-informatic Tupu method. Sci. Total Environ. 701, 134690. doi:10.1016/j.scitotenv.2019.134690
Dong, J., Zhang, Z., Da, X., Zhang, W., and Feng, X. (2021). Eco-environmental effects of land use transformation and its driving forces from the perspective of "production-living-ecological" spaces: a case study of Gansu province. Acta eco. Sin. 41 (15), 5919–5928. doi:10.5846/stxb201909201969
Foley, J. A., DeFries, R., Asner, G. P., Barford, C., Bonan, G., Carpenter, S. R., et al. (2005). Global consequences of land use. Science 309, 570–574. doi:10.1126/science.1111772
Fu, J., and Zhang, S. (2021). Functional assessment and coordination characteristics of production, living, ecological function—a case study of henan province, China. Int. J. Environ. Res. Public Health 18 (15), 8051. doi:10.3390/ijerph18158051
Gao, Z., Zhang, H., Yang, X., and Song, Z. Y. (2019). Assessing the impacts of ecological-living-productive land changes on eco-environmental quality in Xining City on Qinghai-Tibet Plateau, China. Sci. Cold Arid Reg. 11 (3), 194–207. doi:10.3724/SP.J.1226.2019.00194
Haas, J., and Ban, Y. (2014). Urban growth and environmental impacts in jing-jin-ji, the yangtze, river delta and the pearl river delta. Int. J. Appl. Earth Obs. Geoinf. 30, 42–55. doi:10.1016/j.jag.2013.12.012
Han, M., Kong, X., Li, Y., Wei, F., Kong, F., and Huang, S. (2021). Eco-environmental effects and its spatial heterogeneity of ‘ecological-production-living’ land use transformation in the Yellow River delta. Sci. Geogr. Sin. 41 (06), 1009–1018. doi:10.13249/j.cnki.sgs.2021.06.010
Hanaˇcek, K., and Rodríguez-Labajos, B. (2018). Impacts of land-use and management changes on cultural agroecosystem services and environmental conflicts—a global review. Glob. Environ. Change 50, 41–59. doi:10.1016/j.gloenvcha.2018.02.016
Hao, H., and Ren, Z. (2009). Land use/land cover change (LUCC) and eco-environment response to LUCC in farming-pastoral zone, China. Agric. Sci. China 8 (1), 91–97. doi:10.1016/s1671-2927(09)60013-4
Hu, F., An, Y., and Zhao, H. (2016). Research on characteristics of ecological environment effect on a “semi-karst” region based on land use transition: A case in central Guizhou province, China. Earth Environ. 44 (4), 447–454. doi:10.14050/j.cnki.1672-9250.2016.04.009
Hu, P., Li, F., Sun, X., Liu, Y., Chen, X., and Hu, D. (2021). Assessment of land-use/cover changes and its ecological effect in rapidly urbanized areas—taking pearl river delta urban agglomeration as a case. Sustainability 13 (9), 5075. doi:10.3390/su13095075
Hu, M., Li, Z., Wang, Y., Jiao, M., Li, M., and Xia, B. (2019). Spatio-temporal changes in ecosystem service value in response to land-use/cover changes in the Pearl River Delta. Resour. Conserv. Recycl. 149, 106–114. doi:10.1016/j.resconrec.2019.05.032
Hu, S., Chen, L., Li, L., Wang, B., Yuan, L., Cheng, L., et al. (2019). Spatiotemporal dynamics of ecosystem service value determined by land-use changes in the urbanization of anhui province, China. Int. J. Environ. Res. Public Health 16 (24), 5104. doi:10.3390/ijerph16245104
Hu, J. (2012). A compilation of documents of the 18th national congress of the communist party of China. Beijing: People's Publishing House.
Kong, D., Chen, H., and Wu, K. (2021). The evolution of "Production-Living-Ecological" space, eco-environmental effects and its influencing factors in China. J. Nat. Resour. 36 (05), 1116–1135. doi:10.31497/zrzyxb.20210503
Lambin, E. F., and Meyfroidt, P. (2011). Global land use change, economic globalization, and the looming land scarcity. Proc. Natl. Acad. Sci. U. S. A. 108, 3465–3472. doi:10.1073/pnas.1100480108
Li, C., Xin, G., Yang, C., and Cheng, X. (2016). Land Use and Land Cover Change (LUCC)and its environmental effects of traditional farm area. J. Southwest Univ. Nat. Sci. Ed. 38 (5), 139–145. doi:10.13718/j.cnki.xdzk.2016.05.023
Li, Z., Li, M., and Xia, B. (2020). Spatio-temporal dynamics of ecological security pattern of the Pearl River Delta urban agglomeration based on LUCC simulation. Ecol. Indic. 114, 106319. doi:10.1016/j.ecolind.2020.106319
Li, L., Yang, L., and Zheng, M. (2021). Study on land use transformation and ecological environment effect in central Guizhou. Territ. Nat. Resour. Study 2021 (03), 38–42. doi:10.16202/j.cnki.tnrs.2021.03.010
Liu, J., Liu, Y., and Li, Y. (2017). Classification evaluation and spatial-temporal analysis of ‘production-living-ecological’ spaces in China. Geogr. Sci. 72 (7), 1290–1304. doi:10.11821/dlxb201707013
Long, H., Qu, Y., Tu, S., Zhang, Y., and Jiang, Y. (2020). Development of land use transitions research in China. J. Geogr. Sci. 30 (07), 1195–1214. doi:10.1007/s11442-020-1777-9
Lou, P., Fu, B., Lin, X., Bi, L., Ma, R., and Tang, T. (2019). Influence of land use change on ecosystem service value based on GEE in the beijing-tianjin-hebei region from 1998 to 2018. Environ. Sci. 40 (12), 5473–5483. doi:10.13227/j.hjkx.201905079
Luo, G., Liao, H., Li, Q., Liao, L., Li, Y., and Fang, A. (2018). A study of land use function transformation based on ecological-production-living spaces and associated eco-environment response: a case study of banan district. J. Southwest Univ. Nat. Sci. Ed. 40 (4), 105–113. doi:10.13718/j.cnki.xdzk.2018.04.015
Quintas-Soriano, C., Castro, A. J., Castro, H., and García-Llorente, M. (2016). Impacts of land use change on ecosystem services and implications for human well-being in Spanish drylands. Land Use Policy 54, 534–548. doi:10.1016/j.landusepol.2016.03.011
Sudhira, H. S., Ramachandra, T. V., and Jagadish, K. S. (2004). Urban sprawl: metrics, dynamics and modelling using GIS. Int. J. Appl. Earth Obs. Geoinf. 5 (1), 29–39. doi:10.1016/j.jag.2003.08.002
Sun, X., Yu, C., Wang, J., and Wang, M. (2020). The intensity analysis of production living ecological land in Shandong province, China. Sustainability 12 (20), 8326. doi:10.3390/su12208326
Tan, Z., Guan, Q., Lin, J., Yang, L., Luo, H., Ma, Y., et al. (2020). The response and simulation of ecosystem services value to land use/land cover in an oasis, Northwest China. Ecol. Indic. 118, 106711. doi:10.1016/j.ecolind.2020.106711
Tian, F., Li, M., Han, X., Liu, H., and Mo, B. (2020). A production–living–ecological space model for land-use optimisation: a case study of the core tumen river region in China. Ecol. Modell. 437, 109310. doi:10.1016/j.ecolmodel.2020.109310
Wang, X., and Bao, Y. (1999). Study on the methods of land use dynamic change research. Prog. Geogr. 18, 81–87.
Wang, D., Jiang, D., Fu, J., Lin, G., and Zhang, J. (2020). Comprehensive assessment of production–living–ecological space based on the coupling coordination degree model. Sustainability 12 (5), 2009. doi:10.3390/su12052009
Wang, A., Liao, X., Tong, Z., Du, W., Zhang, J., Liu, X., et al. (2022). Spatial-temporal dynamic evaluation of the ecosystem service value from the perspective of “production-living-ecological” spaces: A case study in dongliao River basin, China. J. Clean. Prod. 333, 130218. doi:10.1016/j.jclepro.2021.130218
Wang, R., Zhao, X., Guo, X., Ye, Y., Li, Y., and Zhou, Y. (2021). A study on land use transformation and ecological environment effects from the perspective of “production-living-ecological space”: a case study of yingtan city, jiangxi province. Acta Agric. Univ. Jiangxiensis 43 (3), 681–693. doi:10.13836/j.jjau.2021075
Wang, Y., Wang, Y., Zhang, J., and Wang, Q. (2021). Land use transition and its associated eco- environmental effect: A case study of coastal area in fujian province. Acta Sci. Circumstantiae 41 (10), 3927–3937. doi:10.13671/j.hjkxxb.2021.0294
Xiang, X., Li, F., Ouyang, X., Shang, J., and Shao, H. (2021). The production-life-ecological space transformation and ecological effect analysis of Pingshan County. Hubei Agric. Sci. 60 (10), 60–63. doi:10.14088/j.cnki.issn0439-8114.2021.10.011
Xie, Z., Li, X., Chi, Y., Jiang, D., Zhang, Y., Ma, Y., et al. (2021). Ecosystem service value decreases more rapidly under the dual pressures of land use change and ecological vulnerability: a case study in zhujiajian island. Ocean. Coast. Manag. 201, 105493. doi:10.1016/j.ocecoaman.2020.105493
Yang, Q. K., Duan, X. J., and Wang, L. (2018). Land use transformation based on ecological-production-living spaces and associated eco-environment effects: A case study in the yangtze river delta. Sci. Geogr. Sin. 38 (1), 97–106.
Yang, Y., Bao, W., and Liu, Y. (2020a). Coupling coordination analysis of rural production-living-ecological space in the Beijing-Tianjin-Hebei region. Ecol. Indic. 117, 106512. doi:10.1016/j.ecolind.2020.106512
Yang, Y., Bao, W., Li, Y., Wang, Y., and Chen, Z. (2020b). Land use transition and its eco-environmental effects in the beijing–tianjin–hebei urban agglomeration: a production–living–ecological perspective. Land 9 (9), 285. doi:10.3390/land9090285
Yu, L., Song, A., Zheng, Y., Jian, Q., and Zhang, P. (2017). The ecological-living-industrial land classification system and the analysis of its spatial distribution: case of changli county. Chin. J. Agric. Resour. Regional Plan. 38 (2), 89–96. doi:10.7621/cjarrp.1005-9121.20170213
Zhang, Y., Liu, Y., Gu, J., and Ding, Q. (2011). Land use/land cover change and its environmental effects in Wuhan city. Sci. Geogr. Sin. 31 (10), 1280–1285. doi:10.13249/j.cnki.sgs.2011.10.016
Keywords: production–living–ecological space, land-use transition, eco-environmental effect, eco-environmental quality index, area-weighted method, industrial base
Citation: Wei Y, Zhang Y, Chen L, Chen H, Zhang X and Liu P (2022) Production–living–ecological space transition and its eco-environmental effects based on an improved area-weighted method: A case study of Gangcheng District, a typical industrial base in China. Front. Environ. Sci. 10:972786. doi: 10.3389/fenvs.2022.972786
Received: 19 June 2022; Accepted: 12 July 2022;
Published: 08 September 2022.
Edited by:
Jinlong Gao, Nanjing Institute of Geography and Limnology (CAS), ChinaReviewed by:
Xiaowei Chuai, Nanjing University, ChinaXue Zhou, University of Florida, United States
Hui Zhang, Northeast Agricultural University, China
Copyright © 2022 Wei, Zhang, Chen, Chen, Zhang and Liu. This is an open-access article distributed under the terms of the Creative Commons Attribution License (CC BY). The use, distribution or reproduction in other forums is permitted, provided the original author(s) and the copyright owner(s) are credited and that the original publication in this journal is cited, in accordance with accepted academic practice. No use, distribution or reproduction is permitted which does not comply with these terms.
*Correspondence: Hongyan Chen, Y2hlbmh5QHNkYXUuZWR1LmNu