 Rabia Shahid
 Li Shijie
 Ning Yifan2
- 1Management School of Hainan University, Haikou, China
- 2School of Economics, Hainan University, Haikou, China
- 3College of Management and Economics, Tianjin University, Tianjin, China
Since the opening up of China, its manufacturing sector contributed significantly toward economic development on one hand and caused elevated environmental pollution and heavy resource consumption problems on the other hand. Green productivity is an essential means of addressing environmental problems and promoting sustainable environmental performance and long-term economic growth. When the factors affecting the green total factor energy productivity (GTFEP) are studied in recent years, the hitherto literature lacks the relationship between GTFEP, environmental regulations, and global value chain (GVC) participation. Using GTFEP as a proxy of environmental upgrading for the Chinese manufacturing industry, this study investigates the nexus between the GTFEP, environmental regulation index (ERI), and total production length index (TPLI). Based on panel data 18 industries from 2000 to 2014, the current study employed the panel pool mean group estimators for the auto-regressive distributed lag model (ARDL) and estimated the long-run relationship between variables. Findings revealed the positive effect of ERI and GVC participation (TPLI) on the GTFEP of the Chinese manufacturing industry. Furthermore, pairwise panel causativeness analysis indicated unidirectional causality between GTFEP and ERI, running from GTFEP to ERI. Based on research findings, some conclusions and policy implications are derived, such as strict enforcement of environmental regulations, industry-specific policies, promotion of clean energy resources, and acceleration of the country’s further opening-up and reforms. All of these will help promulgate the GTFEP and environmental upgrading of the Chinese manufacturing sector, thus leading to sustainable economic development decoupled from environmental pollution.
1 Introduction
Globalization leads to higher international trade amid economies, which, on the one hand, gives rise to complex global value chains (GVCs) and on the other hand, increases the environmental pressure due to enhanced global resource use (Plank et al., 2018). It is rationally consented that a series of environmental issues is normally accentuated with rapid economic development (Shang et al., 2018; Qin et al., 2021). Since the implementation of the reform and opening-up policy in 1978, China has achieved eminent economic growth targets through rapid industrialization (Song et al., 2019), but the country has paid a very high price in the form of environmental pollution and excessive energy consumption, which is hindering the high-speed development of the country’s economy (Su and Liang, 2021). Government regulation policies are very crucial for overcoming environment-related issues as these problems cannot be solved through a free-market mechanism (Qin et al., 2021). Through some form of regional joint governance and environmental regulations, China has tried to overcome environmental pollution and related issues (Zhang et al., 2020). Environmental regulations are basically the government interventions for reducing the public risk of environmental changes (Moosa, 2016). In accordance with the local environment, the Chinese government always tried to develop environmental protection measures via various environmental regulation policies which are in line with sustainable economic development goals (Qin et al., 2021). The emission mitigation and environmental protection are based on the regulatory policy measures. Since 2004, nigh on 1,100 environmental regulation policies for environmental protection and control has been promulgated by the Chinese government (Zhang et al., 2020).
The international environmental concerns are not confined to a country’s boundaries, yet the relationship amid GVC and environmental sustainability is still vivid in the empirical literature. Since the very first article in the 1990s, GVC scholars have been concerned regarding the preferment of economic development, as well as the sustainable social and environmental development (Humphrey, 2014). The GVC participation of the Chinese manufacturing industry is an eminent feature of globalization. The GVC participation is based on the concept that international production networks are formed via the specialization of various economies in certain production stages (Wang et al., 2019). Although the Chinese manufacturing industry has made a remarkable success through GVC participation, it is also accompanied by restricted economic development caused by accelerating environmental damage. According to Qu et al. (2020), on the one hand, the manufacturing sector of China is the driving engine of economic development; but contrarily, it is also a projecting source of CO2 emissions and energy consumption. The effect of GVC participation on environmental sustainability is profound for both emerging and developed economies (Sun et al., 2019). Due to its position at the lower ends of GVC and international industry transfer, China’s energy consumption keeps rising in recent decades. Furthermore, GVC positioning can encourage emissions reduction and energy conservation (Wang et al., 2020), thus leading to environmental upgrading.
Environmental upgrading may be perceived as the mechanism through which economic players shift toward a manufacturing structure that prevents or decreases environmental issues (De Marchi et al., 2013). The promotion of green strategies by the firms for improving the environmental performance and transformation of environmental problems into a competitive advantage has been recently focused by scholars. Scholars and practitioners are studying on how corporations can overcome their environmental consequences through various strategies (Lucas, 2010). At the international level, the need for industrial environmental agenda is also highlighted in recent years. In this perspective, green productivity is an important indicator of a country’s ability to handle environmental issues, promote environment protection performance, and support long-term economic growth. The term green productivity, first proposed by the Asian Productivity Organization, explains a dynamic strategy promoting the productivity by incorporating environmental performance. In the course of environmental upgrading through green environmental protection measures, green total factor energy productivity (GTFEP) is considered a major breakthrough. Thus, the growth of the GTFEP is the indication of environmental upgrading and is important for research and environment-related policy making. The degree of connection between the environment and economy can be reflected through GTFEP, which is a comprehensive indicator that integrates consumption of energy and environmental problems in a traditional total factor productivity analysis (Wang et al., 2022). Since its reforms and opening up to the world, China’s economic progress and achievement are remarkable. But the dramatic increase in environmental pollution due to extensive energy use is also accentuated along with rapid industrialization and economic growth. The accelerating energy consumption and CO2 emissions by the Chinese manufacturing industry from 2000 to 2014 are shown in Figure 1. Such statistics clearly exhibit immense environmental challenges faced by China in recent years, which is of great concern to the world. Thus, there is an alarming need for enhancing the growth of GTFEP of China’s manufacturing sector, with the aim of energy consumption reduction, environment protection, and sustainable economic development, which would ultimately lead toward environmental upgrading. In this regard, a detailed analysis of determinants of GTFEP is essential for exploring the environmental upgrading of the Chinese manufacturing industry.
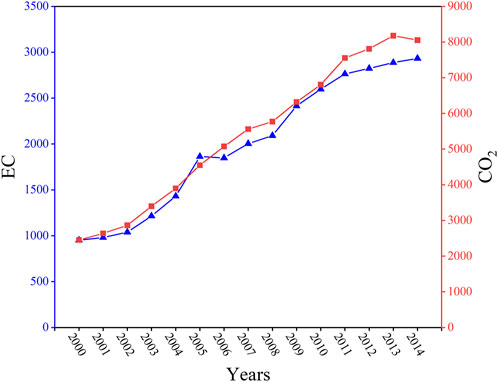
FIGURE 1. Energy consumption and CO2 emissions of the Chinese manufacturing industry (2000–2014).
The environmental effects of environmental regulation policies and GVC participation are widely studied in the literature. The pollution control activities by rational polluting enterprises are dependent on the implementation of environmental regulation by the government. Due to escalated economic growth of the Chinese manufacturing industry, the environmental pollution pressures are increasing day by day, especially due to excessive energy consumption. With the deepening of GVCs, advanced green technologies introduced due to process upgrading can lead to efficient input to output transformation (Hu et al., 2021), which will help promote GTFEP. The GTFEP improves if the desirable output increases, utilization efficiency of energy and resources is improved, and undesirable outputs (such as emission of CO2, SO2) are reduced. The environmental regulations and GVC participation affect GTFEP in various ways. Thus, in order to explore the sustainable environmental development along with economic growth, it is crucial to investigate the nexus between GTFEP, environmental regulations, and GVC participation. Currently, the extant literature lacks such a comprehensive study that simultaneously explores the causal relationship between these three factors. Furthermore, it is important to consider other factors which have an effect on GTFEP, such as research and development (R&D), foreign direct investment (FDI), industrial scale, and export intensity. By taking this research need into account, the current study aimed to develop the nexus between GTFEP, environmental regulations, and GVC participation and contributes to the literature in the following ways: 1) the effect of environmental regulations and GVC participation on GTFEP are mainly studied for the Chinese manufacturing industry; 2) for recognition of both short and long-run relationship amid variables of interest, we established a panel autoregressive distributed lag (Panel-ARDL) model; 3) other covariates including FDI, R&D, industrial scale, and export intensity are also accounted; 4) the empirical methodology is based on the error correction model rather than usual cointegration analysis; and 5) the causality test established by Dumitrescu and Hurlin (2012) is used for causality analysis between variables. The research framework of the current study is shown in Figure 2.
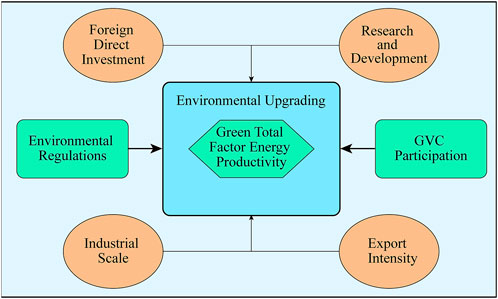
FIGURE 2. Main research framework.
Our findings revealed that environmental regulations and GVC participation increase the GTFEP in the long run. Moreover, the addition of FDI, R&D, industrial scale, and exports of the manufacturing industry in the model would aid to identify any environmental impacts of these variables. For developing future strategies with the aim of sustainable environmental development, the causality analysis between variables of interest would be beneficial for researchers and policy makers. Following research questions are tried to answer through empirical investigation: 1) Does long-run relationship exist amid GTFEP, environmental regulations, and GVC participation? 2) What is the long-run impact of environmental regulations and GVC participation on GTFEP? 3) Does any causality exist amid variables of interest? If yes, what is the direction of causality? The rest of the study comprises four sections. Section 2 describes the empirical methodology and model development. Section 3 explains the results and discussion of our analysis. Finally, Section 4 suggests some policy implications along with a derivation of the conclusion.
2 Methodology
2.1 Data sources and industry classification
The current study basically employs two datasets including World Input-Output Database (WIOD) 2016-version and Statistical Yearbooks of China. The manufacturing sector of China has been classified into 18 industries, by the merger of WIOD industry classification and national economy industry classification (GB/T4754-2011) on the principal of no omission and no repetition (Supplementary Table S1). For calculation of GTFEP, the CEADS (Carbon emission accounts and datasets) database is used for getting data on CO2 emissions. The remaining data are obtained from the National Bureau of Statistics and various yearbooks of China including energy statistics, industrial statistics, science and technology statistics, environmental, and labor statistics. All statistical data for industries are merged into 18 industries as described previously, and interpolation and extrapolation methods are used to fill any missing data. The data are collected for a period of 2000–2014 and 18 industries, making a total panel of 270 observations. Moreover, the perpetual inventory method is used to convert all flow data into stock data, and price indices are adjusted on the constant price of 2000. Table 1 elaborates the description of the main variables and their source of data collection.
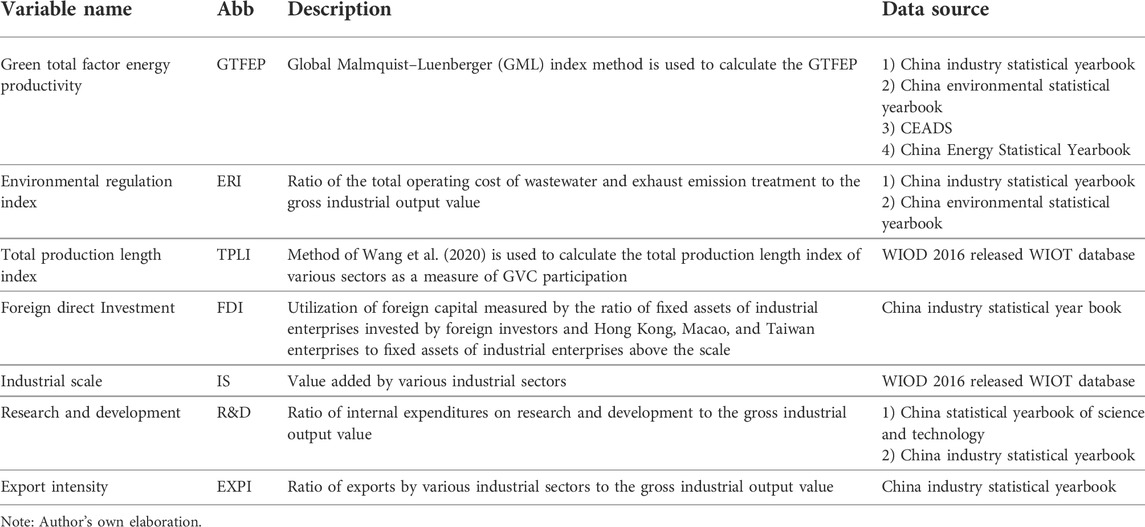
TABLE 1. Variables’ definitions and data sources.
2.2 Calculation of variables
2.2.1 Measuring environmental upgrading
The environmental upgrading, in terms of process upgrading, refers to improved efficiency of the production system via green strategies (Marchi et al., 2013). Thus, the green total factor of energy productivity can be used as a proxy for environmental upgrading. The higher the industrial GTFEP is, the more effective will be the environmental upgrading for the particular industry. According to Hu et al. (2021), total factor productivity calculation is modified through several stages in the literature, including the Solow residual value, estimation through random production function, non-parametric data envelopment analysis, and finally, the directional distance function incorporating undesirable output for measuring the total factor productivity. As discussed by Piao et al. (2019), one of the main methods for calculating green growth is the data envelopment analysis. For capturing green productivity, it is essential to incorporate energy inputs and the negative environmental impact associated with energy inputs, along with consideration of regular factors and output. But the traditional radial data envelopment analysis (DEA) and slack-based measures are unable to capture the actual efficiency and productivity as the former lacks undesirable output and the latter ignores radial relaxation while taking undesirable output. So the directional distance function (DDF) is further improved by using an epsilon-based measure, having both radial and non-radial relaxations. For comparing different industries across time, the Global Malmquist–Luenberger (GML) index was constructed by Oh (2010), which avoids the possible phenomenon of technology retrogression.
By following the method of Hu et al. (2021) and taking the gross industrial output value as desirable output; energy consumption, employment number, and capital stock as input factors; and COD (chemical oxygen demand) discharge, and CO2 and SO2 emissions as undesirable output; the GML index was measured for 18 industries by MaxDEA 8 Ultra Software. The perpetual inventory method was employed to calculate capital stock. Finally, to achieve inter-temporal comparability, the GML index was converted into GTFEP as the GML index calculated previously only denotes recent years’ growth rates. For converting the GML index into GTFEP, the actual GTFEP of 2000 is calculated by assuming the value of GTFEP as 1 in 1999. To get GTFEP of 2000, the GTFEP of 1999 is multiplied by the GML index value of 2000. Similarly, the actual GTFEP of 2001 is equal to the GTFEP of 2000 multiplied by the GML index of 2001. Following this method, the actual GTFEP of all 18 industries is obtained for the whole sample period.
2.2.2 Measuring the environmental regulation index
The extent of pollution control and environmental protection is reflected by the environmental regulation policies. There are two schools of thoughts describing the impact of environmental regulation on enterprise pollution control and growth. On the one hand, it is perceived that the competitiveness of enterprises is reduced due to increased burden and extra costs under environmental regulations, thus leading to a crowding out effect on further investments (Qu et al., 2020). Contrarily, the environmental regulations are associated with higher trade of intermediate goods (Hu et al., 2021). In the long run, the environmental upgrading is caused by environmental regulations due to the stimulation of innovation compensation effect and technological innovation under reasonable environmental regulations (Porter, 1996). The current study measured the environmental regulation index by dividing the gross operating cost of emission treatment (both wastewater and exhaust emissions) to the gross industrial output value (Qu et al., 2020).
2.2.3 Measuring global value chain participation
The total production lengths of the Chinese manufacturing industry are calculated to represent GVC participation (Wang et al., 2020). The total average production length of GVC activity represents the mean of processing stages involved in transforming the one country’s industrial inputs into another country’s final product (Wang et al., 2017), and it can be written as follows:
Following the method of Wang et al. (2020), the following formula is obtained by using the value-added weights of
Using matrix notation for Eq. 2, we get the following:
where
where
In Eq. 7, TPL represents the total production length, whereas
2.2.4 Other control variables
In the light of extant literature and getting robust estimation results, other variables are included in the main panel ARDL model including the research and development (R&D), foreign direct investment (FDI), industrial scale (IS), and export intensity (EXPI). 1) Research and development (R&D): as described by Qu et al. (2020), technological progress is the key element for better promotion of green growth. The endogenous economic growth theory explains that R&D is the key driver of technological advancement. Thus, the investment on R&D is considered to have a positive influence on environmental upgrading as well. We took the investment on R&D as a control variable, which is calculated by dividing the R&D internal expenditures to the gross industrial output of manufacturing industries. 2) Foreign direct investment (FDI): the FDI is indicated by the utilization of foreign capital measured by the ratio of fixed assets of industrial enterprises invested by foreign investors and Hong Kong, Macao, and Taiwan enterprises to fixed assets of industrial enterprises above the scale. 3) Industrial scale (IS): an industry requires higher levels of social and state supervision under increased industrial scales. In this case, GTFEP is expected to elevate due to less energy intensity. The current study takes the industrial value added to represent the industrial-scale variable. 4) Export intensity (EXPI): the ratio of exports by various industrial sectors to gross industrial output value is used to denote the export intensity of the Chinese manufacturing sector.
2.3 Model specification
The panel co-integration is applied for developing a nexus among GTFEP, ERI, and TPLI for 18 manufacturing industries of China between 2000 and 2014. Furthermore, research and development (R&D), foreign direct investment (FDI), industrial scale (IS), and export intensity (EXPI) are integrated into the main model as explanatory variables. The main econometric model is as follows:
Equation 8 describes that the environmental upgrading (GTFEP) is a function of the environmental regulation index (ERI), total production length index (TPLI), research and development (R&D), foreign direct investment (FDI), industrial scale (IS), and export intensity (EXPI). As the aforementioned model is not in linear form, it may lead to inconsistent and insufficient results for decision-making (Shafique et al., 2021). For overcoming this shortage and achieving consistent and reliable outcomes, the natural logarithmic form of all variables is used for developing nexus among GTFEP, ERI, and TPLI. The log-linear econometric model is as follows:
In Eq. 9,
where industry classification is represented by
2.4 Preliminary tests
The current study finds the impact of environmental regulations and GVC participation on environmental upgrading. For achieving our objective, a three-step methodology is carried out before application of the final model: 1) Pearson correlation analysis is carried out to check the presence of correlation among any variable. 2) The stationarity of all variables is checked by employing two main unit root tests, viz, Fisher-ADF (Augmented Dickey-Fuller) and Fisher-PP. 3) To check the presence of short and long-run association amid all variables and GTFEP, the co-integration technique and advanced auto-regressive distributed lag model (ARDL model) by Pesaran et al. (1999) are used. The ARDL model is considered good due to its applicability with both stationarity of variables at I (0) and I (1), or a combination of both (i.e., I (0) and I (1). At the same time, it is necessary that none of the variable is I (2). Moreover, in the case of small and infinite datasets, this method provides stable and consistent results (Shafique et al., 2021). 4) Finally, the Dumitrescu–Hurlin causality analysis is carried out to check the presence of causality amid all variables and GTFEP.
Following the method of Shafique et al. (2021), the final ARDL model can be expressed as follows:
In Eq. 11,
3 Results
3.1 Descriptive statistics
As shown in Figure 3, growth rates of green total factor energy productivity, environmental regulation index, and total production length index vary greatly across industries. The growth rates of all three variables from 2000 to 2014 are shown in Supplementary Table S2. The ERI growth rate is highest for the printing and reproduction of recording media industry (73.48%), followed by manufacturing of paper and paper products (67.78%), manufacturing of medicines (62%), and manufacture of non-metallic mineral products (57.48%). These results indicate that these industries are focusing greatly on the implementation of environmental regulations. The ERI reflects the industrial behavior related to the implementation of environmental regulations. The role of environmental regulation in controlling water pollution has been proved in the United States (Langpap and Shimshack, 2010). The TPLI shows the highest increment for manufacture of food products, beverages and tobacco products (38.14%), manufacture of computers, communication, and other electronic equipment (35.89%), and manufacture of textiles, wearing apparel, and leather products (33.96%). The TPLI for I16 and I17 show a decline from 2000 to 2014, which is consistent with the extant literature (Wang et al., 2020). These findings suggest the shifting of the comparative advantage of the Chinese manufacturing industry from the traditional final product to various segments of the GVCs (Wang et al., 2020) as the country’s imports of intermediate products also depict an upsurge in recent years (Wang et al., 2018).
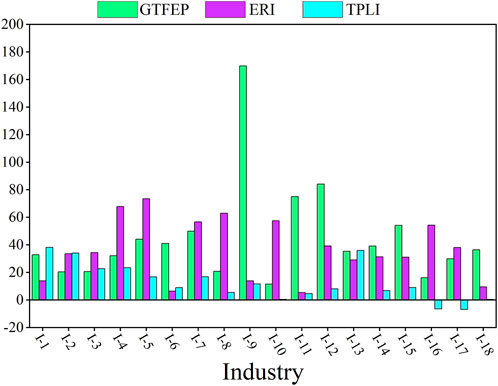
FIGURE 3. Growth rates of the green total factor energy productivity, environmental regulation index, and total production length index for the Chinese manufacturing industry (2000–2014).
The highest growth of GTFEP from 2000 to 2014 is recorded for the manufacture of rubber and plastic (169.81%), followed by the manufacture of metal products (84.07%), manufacture of basic metals (75.02%), and manufacture of machinery and equipment (54.09%). These higher growth rates of GTFEP in these industries indicate that these industries are upgrading in their environmental sides and causing green growth of the Chinese manufacturing industry, thus participating toward the green economy. The GTFEP of individual industries across the whole sample period is shown in Figure 4.
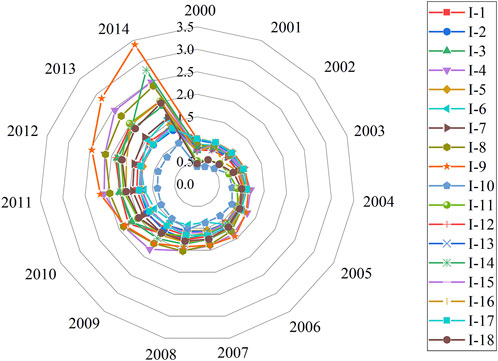
FIGURE 4. Changing trend of the GTFEP of the Chinese manufacturing industry (2000–2014).
The descriptive statistics for variables used in the panel ARDL model are given in Table 2. All variables are used in log form, by taking the natural logarithm of them. For taking the logarithm of variables having some negative value, a constant value was added to that particular variable before taking the natural logarithm (Mert et al., 2019). The results of the Pearson correlation analysis are given in Table 3. As the value of all coefficients is less than 0.7, there exists no strong correlation amid factors of GTFEP which are used in the current study.
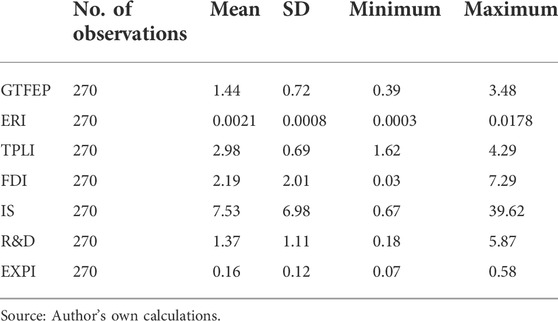
TABLE 2. Descriptive statistics of variables.
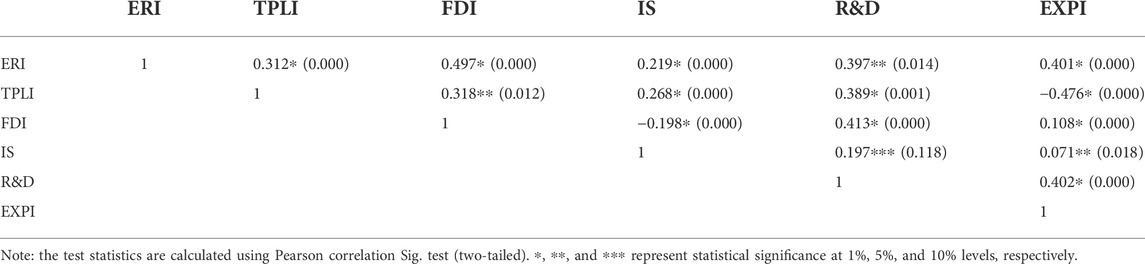
TABLE 3. Pearson correlation analysis.
3.2 Panel unit root test
For avoiding the problem of spurious regression, econometric analysis of panel data relies on the panel unit root test (Levin et al., 2002; Shafique et al., 2021). Various unit root tests are found in the literature (Shafique et al., 2021; Shahid et al., 2021; Shijie et al., 2021) for verifying the stationarity of a series. According to Dickey and Fuller (1979), the stationarity of data series can be checked through ADF unit root analysis. Phillips Peron (PP) tests are also used for testing the stationarity of data (Shahid et al., 2021). Moreover, the optimal lag selection is also a pre-requisite for the ARDL model. Different criteria are found in the literature for checking the optimal lag for a series such as SBC (Schwarz Bayesian criterion), HQ (Hannan Quinn), and/or AIC (Akaike information criterion) (Shahid et al., 2021). The current study used AIC for selecting the optimal lag length of 2. After lag length selection, the co-integration was assessed by employing the ARDL bound testing approach. Furthermore, we applied two types of unit root tests for checking the stationarity of our variables including ADF-Fisher chi-squared and PP-Fisher chi-squared test (Table 4). The results of unit root tests depict that GTFEP, ERI, FDI, IS, and EXPI are stationary at the first difference, i.e., I (1); while TPLI and R&D are stationary at level, i.e., I (0). Thus, the order of integration is a mixture of I (0) and I (1), indicating the ARDL model as the best option for further analysis.
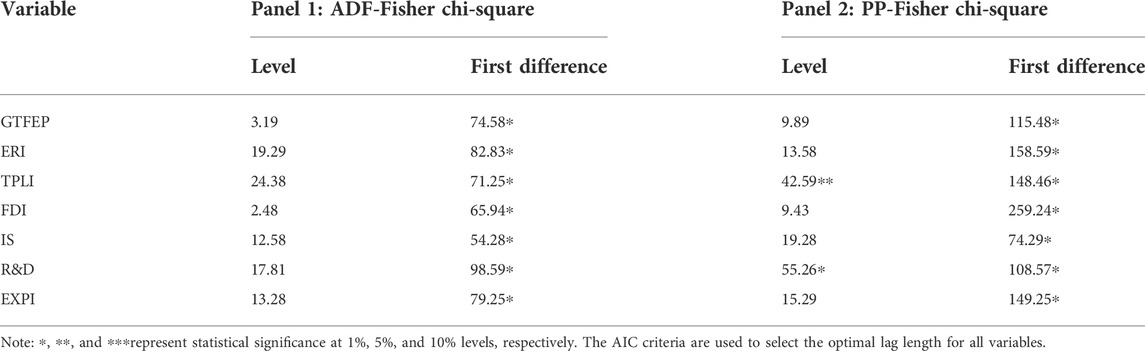
TABLE 4. Fisher chi-squared panel unit root test.
3.3 Panel co-integration test
Before applying the panel ARDL model to our data, the Hausman test was carried out to find the best estimator among the mean group (MG) and pooled mean group (PMG) estimators (Hongxing et al., 2021). The PMG estimator was found best as a result of confirmation of long-run homogeneity. The results of the pooled mean group ARDL model (PMG-ARDL) for long and short-run estimates are given in Table 5. The value of the error correction term (ECT) is significant and negative, indicating the convergence of the model over a long period of time. The speed of adjustment from short to long run is highly depicted by ECT (Shahid et al., 2021). The ECT shows that any shock to GTFEP of the Chinese manufacturing industry bears a yearly adjustment capacity of 47%. The long-run coefficients of PMG-ARDL model indicate a positive and significant connection between GTFEP and ERI, TPLI, and R&D at 1%, 5%, and 1%, respectively. The GTFEP increases by 0.089% with a 1% increase in ERI. This is in line with the hitherto investigations, where the environmental regulations are proved to lead to improved efficiency (Qin et al., 2021). Similarly, a 1% increase in TPLI and R&D leads to 0.776% and 0.068% increase in GTFEP, respectively. It depicts that increased TPLI is a sign of industrial upgrading, which ultimately affects the energy intensity of the manufacturing industry (Wang et al., 2020). Moreover, increased participation in GVCs leads to higher technological progress, thus resulting in the growth of total factor energy productivity (Feng et al., 2020). The effect of IS on GTFEP is also positive, but insignificant. Moreover, the impact of FDI and EXPI is also significant, but negative. This indicates a decline in GTFEP with increasing FDI and EXPI. The growth of GTFEP may be inhibited with higher levels of FDI as the technology spillover effect on the environment caused by increased FDI leads to deteriorating the environment and elevates the pollution control costs (Hu et al., 2021). The short-run estimator also shows a similar pattern but with insignificant estimators, except for FDI, which is significant in the short run as well.
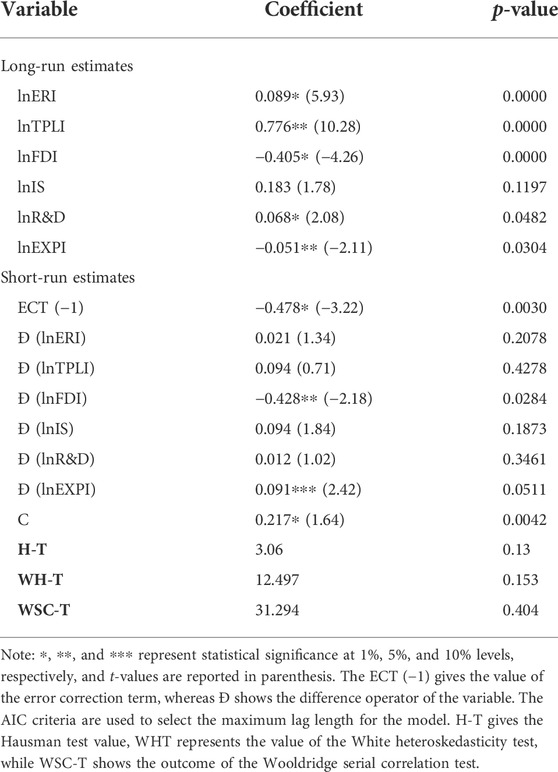
TABLE 5. Results of long-run and short run estimates of the PMG-ARDL model (1,1,1,1,1,1).
3.4 Causality analysis
To observe the direction of causality amid variables of the ARDL model, Dumitrescu and Hurlin (2012) causality test was employed. As described by Ahmed and Shimada (2019), this test is appropriate for panel data as it is based on the assumption of the diversity of all coefficients across various cross sections. Two test statistics are calculated for the Dumitrescu and Hurlin causality test, including Wbar and Zbar statistics. An average of test statistics is taken for calculating Wbar stat, while a standard normal distribution is designated for the calculation of the Zbar stat (Shafique et al., 2021).
The results of pairwise Dumitrescu and Hurlin panel causativeness analysis are given in Table 6. The findings show that unidirectional causality exists between GTFEP and ERI, running from GTFEP to ERI; and GTFEP and R&D, running from R&D to GTFEP. Moreover, bidirectional causality exists between GTFEP and other variables including TPLI, FDI, IS, and EXPI. Figure 5 shows the direction of short-run causalities amid all variables.
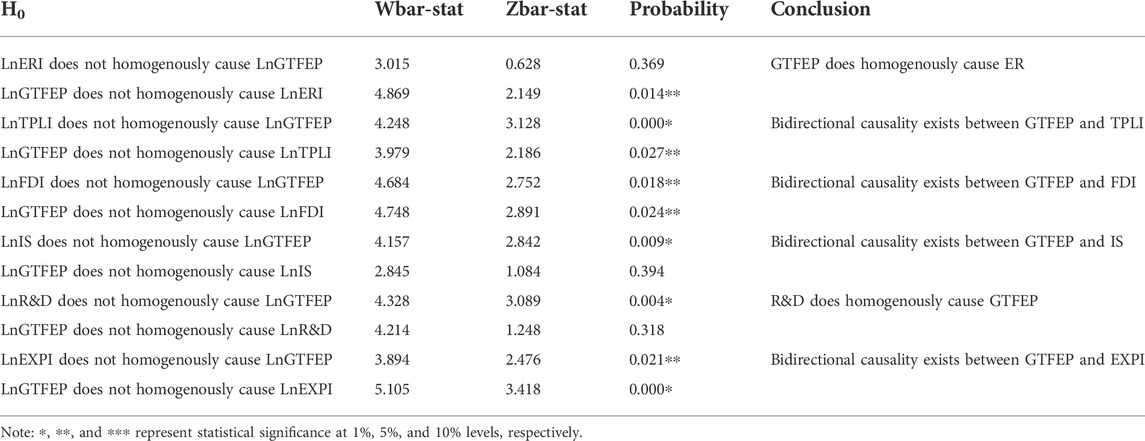
TABLE 6. Results of pairwise Dumitrescu and Hurlin panel causativeness analysis.
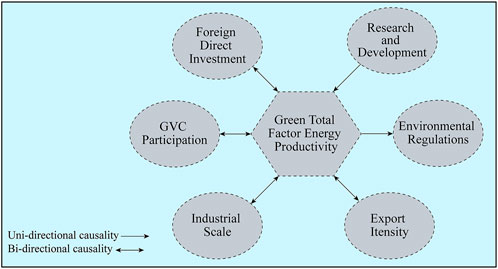
FIGURE 5. Short-run causalities between variables.
4 Conclusion and policy implications
The industrial green transformation and upgrading have been remained a key target for many countries to solve the problem of decoupling economic development from environmental pollution. Since its opening up in the last four decades, the manufacturing industry of China contributed greatly toward economic growth and development. Such an immense growth also brought with it environmental pollution and heavy resource consumption problems. Based on the panel data on manufacturing industries of China, the current study aimed to investigate the nexus between environmental upgrading, environmental regulations, and GVC participation. The green total factor productivity (GTFEP), environmental regulation index (ERI), and total production length index (TPLI) were calculated for 18 manufacturing industries to represent environmental upgrading, environmental regulations, and GVC participation, respectively. The Global Malmquist–Luenberger (GML) index method was used to calculate the GTFEP. The panel auto-regressive distributed lag model was applied for developing a nexus among GTFEP, ERI, and TPLI for 18 manufacturing industries of China between 2000 and 2014. The empirical methodology comprised descriptive statistics of all variables, Pearson correlation analysis, Fisher-ADF and Fisher-PP unit root tests, co-integration technique and advanced auto-regressive distributed lag model (ARDL model), and Dumitrescu–Hurlin causality analysis. The following main conclusions are drawn from research findings: 1) environmental regulation policies are the basis for overcoming environment-related issues as these problems cannot be solved through free-market mechanisms. The increase in GTFEP with an increase in ERI is the indication of environmental upgrading and is important for research and environment-related policy making. Improved environmental regulations will lead toward higher green energy productivity, thus causing process upgrading related to the environment. 2) The GTFEP is also reported to be increased with increased TPLI. This may indicate that with the deepening of GVCs, advance green technologies introduced due to process upgrading can lead to efficient input to output transformation, which in turn helps promote GTFEP and environmental upgrading. 3) The impact of foreign direct investment (FDI) was negative and significant for GTFEP, indicating a decline in GTFEP with increasing FDI. The growth of GTFEP may be inhibited with higher levels of FDI as the technology spillover effect on the environment caused by increased FDI leads to deteriorating the environment and elevates the pollution control costs.
Based on the above-derived conclusions, the following policy implications are made:
(1) The environmental regulatory laws should be enforced strictly, along with the pollution control methods and techniques. Moreover, promulgation of such regulations should be in line with the local and industrial conditions. Relatively pollution-causing industries should be focused with clarified government interventions and strict laws and regulations. The government should focus on making the industries to take their environmental preservation responsibility, in order to achieve environmental upgrading and sustainable development.
(2) Chinese manufacturing industries should focus on the impact of GVC participation and ERI for improving the green total factor energy productivity further. The green transformation and upgrading and clean production technology should be accelerated through the use of clean energy, such as wind energy.
(3) The opening up of the country should be actively promoted and accelerated by the government for increasing the GVC participation and thus leading to higher green total factor energy productivity of industries. Furthermore, research and development should be strengthened for accelerating the green growth and productivity.
Data availability statement
The original contributions presented in the study are included in the article/Supplementary Material; further inquiries can be directed to the corresponding author.
Author contributions
RS: conceptualization, methodology, software, formal analysis, and writing—original draft; LS: resources, review and editing, supervision, and funding acquisition; NY and GJ: resources and review and editing.
Funding
This work is financially supported by the National Natural Science Foundation of China (Grant Nos. 71963012 and 71663014); the Natural Science Foundation of Hainan (Grant No. 2019RC040); and Major Projects in Social Sciences of Hainan Province (Grant No. HNSK (ZD) 19-107).
Conflict of interest
The authors declare that the research was conducted in the absence of any commercial or financial relationships that could be construed as a potential conflict of interest.
Publisher’s note
All claims expressed in this article are solely those of the authors and do not necessarily represent those of their affiliated organizations, or those of the publisher, the editors, and the reviewers. Any product that may be evaluated in this article, or claim that may be made by its manufacturer, is not guaranteed or endorsed by the publisher.
Supplementary material
The Supplementary Material for this article can be found online at: https://www.frontiersin.org/articles/10.3389/fenvs.2022.972412/full#supplementary-material
References
Ahmed, M. M., and Shimada, K. (2019). The effect of renewable energy consumption on sustainable economic development: evidence from emerging and developing economies. Energies 12, 2954. doi:10.3390/en12152954
De Marchi, V., Di Maria, E., and Ponte, S. (2013). The greening of global value chains: insights from the furniture industry. Compet. Change 17, 299–318. doi:10.1179/1024529413Z.00000000040
Dickey, D. A., and Fuller, W. A. (1979). Distribution of the estimators for autoregressive time series with a unit root. J. Am. Stat. Assoc. 74, 427–431. doi:10.1080/01621459.1979.10482531
Dumitrescu, E. I., and Hurlin, C. (2012). Testing for granger non-causality in heterogeneous panels. Econ. Model. 29, 1450–1460. doi:10.1016/j.econmod.2012.02.014
Feng, X., Xin, M., and Cui, X. (2020). Impact of global value chain embedding on total-factor energy productivity of Chinese industrial sectors. J. Renew. Energy 2020, 1–12. doi:10.1155/2020/6239640
Hongxing, Y., Abban, O. J., Boadi, A. D., and Ankomah-Asare, E. T. (2021). Exploring the relationship between economic growth, energy consumption, urbanization, trade, and CO2 emissions: A PMG-ARDL panel data analysis on regional classification along 81 BRI economies. Environ. Sci. Pollut. Res. 28, 66366–66388. doi:10.1007/s11356-021-15660-1
Hu, D., Jiao, J., Tang, Y., Han, X., and Sun, H. (2021). The effect of global value chain position on green technology innovation efficiency: from the perspective of environmental regulation. Ecol. Indic. 121, 107195. doi:10.1016/j.ecolind.2020.107195
Humphrey, J. (2014). “Internalisation theory, global value chain theory and sustainability standards,” in International business and sustainable development (Bingley, United Kingdom: Emerald Group Publishing Limited), Vol. 8, 91–114. doi:10.1108/S1745-8862(2013)0000008010
Langpap, C., and Shimshack, J. P. (2010). Private citizen suits and public enforcement: substitutes or complements? J. Environ. Econ. Manage. 59, 235–249. doi:10.1016/j.jeem.2010.01.001
Levin, A., Lin, C. F., and Chu, C. S. J. (2002). Unit root tests in panel data: asymptotic and finite-sample properties. J. Econom. 108 (1), 1–24. doi:10.1016/S0304-4076(01)00098-7
Lucas, M. T. (2010). Understanding environmental management practices: integrating views from strategic management and ecological economics. Bus. Strategy Environ. 19, 543–556. doi:10.1002/bse.662
Marchi, V. D., Maria, E. D., and Micelli, S. (2013). Environmental strategies, upgrading and competitive advantage in global value chains. Bus. Strategy Environ. 22, 62–72. doi:10.1002/bse.1738
Mert, M., Bölük, G., and Çağlar, A. E. (2019). Interrelationships among foreign direct investments, renewable energy, and CO2 emissions for different European country groups: a panel ARDL approach. Environ. Sci. Pollut. Res. 26, 21495–21510. doi:10.1007/s11356-019-05415-4
Moosa, I. A. (2016). “The economic and financial effects of environmental regulation,” in Handbook of environmental and sustainable finance (Academic Press), Chap. 13, 265–292. doi:10.1016/B978-0-12-803615-0.00013-3
Oh, D. H. (2010). A global Malmquist-Luenberger productivity index. J. Product. Anal. 34, 183–197. doi:10.1007/s11123-010-0178-y
Pesaran, M. H., Shin, Y., and Smith, R. P. (1999). Pooled mean group estimation of dynamic heterogeneous panels. J. Am. Stat. Assoc. 94, 621–634. doi:10.1080/01621459.1999.10474156
Piao, S. R., Li, J., and Ting, C. J. (2019). Assessing regional environmental efficiency in China with distinguishing weak and strong disposability of undesirable outputs. J. Clean. Prod. 227, 748–759. doi:10.1016/j.jclepro.2019.04.207
Plank, B., Eisenmenger, N., Schaffartzik, A., and Wiedenhofer, D. (2018). International trade drives global resource use: a structural decomposition analysis of raw material consumption from 1990–2010. Environ. Sci. Technol. 52, 4190–4198. doi:10.1021/acs.est.7b06133
Qin, M., Sun, M., and Li, J. (2021). Impact of environmental regulation policy on ecological efficiency in four major urban agglomerations in eastern China. Ecol. Indic. 130, 108002. doi:10.1016/j.ecolind.2021.108002
Qu, C., Shao, J., and Cheng, Z. (2020). Can embedding in global value chain drive green growth in China’s manufacturing industry? J. Clean. Prod. 268, 121962. doi:10.1016/j.jclepro.2020.121962
Shafique, M., Azam, A., Rafiq, M., and Luo, X. (2021). Investigating the nexus among transport, economic growth and environmental degradation: evidence from panel ARDL approach. Transp. Policy (Oxf). 109, 61–71. doi:10.1016/j.tranpol.2021.04.014
Shahid, R., Shijie, L., and Shah, A. H. (2021). Developing long- and short-run nexus between industrial growth, economic growth, and trade balance of China. Environ. Sci. Pollut. Res. 29, 17772–17786. doi:10.1007/s11356-021-17104-2
Shang, W., Gong, Y., Wang, Z., and Stewardson, M. J. (2018). Eco-compensation in China: theory, practices and suggestions for the future. J. Environ. Manage. 210, 162–170. doi:10.1016/j.jenvman.2017.12.077
Shijie, L., Hou, D., Jin, W., and Shahid, R. (2021). Impact of industrial agglomeration on environmental pollution from perspective of foreign direct investment—A panel threshold analysis for Chinese provinces. Environ. Sci. Pollut. Res. 1, 58592–58605. doi:10.1007/s11356-021-14823-4
Song, Y., Yang, T., and Zhang, M. (2019). Research on the impact of environmental regulation on enterprise technology innovation—An empirical analysis based on Chinese provincial panel data. Environ. Sci. Pollut. Res. 26, 21835–21848. doi:10.1007/s11356-019-05532-0
Su, H., and Liang, B. (2021). The impact of regional market integration and economic opening up on environmental total factor energy productivity in Chinese provinces. Energy Policy 148, 111943. doi:10.1016/j.enpol.2020.111943
Sun, C., Li, Z., Ma, T., and He, R. (2019). Carbon efficiency and international specialization position: evidence from global value chain position index of manufacture. Energy Policy 128, 235–242. doi:10.1016/j.enpol.2018.12.058
Wang, J., Hu, M., and Rodrigues, J. F. (2018). The evolution and driving forces of industrial aggregate energy intensity in China: an extended decomposition analysis. Appl. Energy 228, 2195–2206. doi:10.1016/j.apenergy.2018.07.039
Wang, J., Wan, G., and Wang, C. (2019). Participation in GVCs and CO2 emissions. Energy Econ. 84, 104561. doi:10.1016/j.eneco.2019.104561
Wang, K. L., Pang, S. Q., Zhang, F. Q., Miao, Z., and Sun, H. P. (2022). The impact assessment of smart city policy on urban green total-factor productivity: evidence from China. Environ. Impact Assess. Rev. 94, 106756. doi:10.1016/j.eiar.2022.106756
Wang, L., Yue, Y., Xie, R., and Wang, S. (2020). How global value chain participation affects China's energy intensity. J. Environ. Manage. 260, 110041. doi:10.1016/j.jenvman.2019.110041
Wang, Z., Wei, S. J., Yu, X., and Zhu, K. (2017). Characterizing global value chains: production length and upstreamness. National Bureau of Economic Research, Working paper 23261. doi:10.3386/w23261
Keywords: cleaner production, sustainable environment, energy efficiency, industrial upgrading, environmental policy
Citation: Shahid R, Shijie L, Yifan N and Jian G (2022) Pathway to green growth: A panel-ARDL model of environmental upgrading, environmental regulations, and GVC participation for the Chinese manufacturing industry. Front. Environ. Sci. 10:972412. doi: 10.3389/fenvs.2022.972412
Received: 18 June 2022; Accepted: 05 July 2022;
Published: 25 August 2022.
Edited by:
Magdalena Radulescu, University of Pitesti, RomaniaReviewed by:
Faisal Zulfiqar, The Islamia University of Bahawalpur, PakistanPriyanka Lal, Lovely Professional University, India
Copyright © 2022 Shahid, Shijie, Yifan and Jian. This is an open-access article distributed under the terms of the Creative Commons Attribution License (CC BY). The use, distribution or reproduction in other forums is permitted, provided the original author(s) and the copyright owner(s) are credited and that the original publication in this journal is cited, in accordance with accepted academic practice. No use, distribution or reproduction is permitted which does not comply with these terms.
*Correspondence: Li Shijie, bHNoaWppZUBmb3htYWlsLmNvbQ==