 Zhi Li1
 Jie Wu
94% of researchers rate our articles as excellent or good
Learn more about the work of our research integrity team to safeguard the quality of each article we publish.
Find out more
ORIGINAL RESEARCH article
Front. Environ. Sci., 18 November 2022
Sec. Environmental Economics and Management
Volume 10 - 2022 | https://doi.org/10.3389/fenvs.2022.971508
This article is part of the Research TopicResource Efficiency and Environmental Impact AssessmentView all 21 articles
The high-quality development of society needs the support of resource and environmental carrying capacity, and the improvement of resource and environmental carrying capacity is driven by the process of high-quality development. Therefore, how to realize the dynamic coordination of the two is an urgent problem to be solved. Different from previous studies which mainly focused on economic development and the environment, this paper considers all aspects of society and analyzes the interactive relationship between high-quality development and resource and environmental carrying capacity for the first time. Based on the panel data of 30 provinces in China from 2005 to 2020, a comprehensive evaluation index system is constructed, and the information entropy method, coupling coordination degree, and kernel density estimation model are applied to explore the coupling coordination relationship and spatial-temporal characteristics between resource and environmental carrying capacity and high-quality development. The results show that there are four nonlinear relationships between the resource and environmental carrying capacity and high-quality development, including simultaneous increase, first increase and then decrease, first decrease and then increase, and alternating fluctuation; Water resources per capita and the green coverage rate of the built-up area contributed the most to the resource and environmental carrying capacity subsystem, and GDP per capita and urbanization rate contributed the most to the high-quality development subsystem. From the time series, the coupling relationship between the two shows an upward trend over time. From the spatial series, the coupling relationship between the two is in a state of spatial aggregation. This paper discusses the results and puts forward policy recommendations, hoping to provide a reference for the coordinated development of the region. Moreover, this study provides a new perspective for the scientific construction of the relationship between resource and environmental carrying capacity and high-quality development on a global level.
With the rapid development of global urbanization and industrialization, the contradiction between social-economic development and resources and the environment is gradually prominent (Bao et al., 2020; Zou and Ma, 2021). The cities and regions are facing major challenges related to the environment and resources due to the development of urbanization and industrialization, including increased energy consumption, pollution, resource consumption, and other issues (Bibri et al., 2020). These have created enormous pressure on the environment and great demand for natural resources. Resource and environmental carrying capacity is not only a regional issue, but a global issue (Fu et al., 2020; Zou and Ma, 2021).
Since the reform and opening up, China’s economy has been developing rapidly. However, in pursuit of rapid economic growth, many regions have paid the price of ecological damage. In some fast-developing areas in China, there is a huge conflict between the needs for social and economic development and the carrying capacity of the resource and environment system (Cheng et al., 2016). In these areas, a large number of environmental resources are exploited, and economic growth is driven by enterprises with high pollution, high energy consumption, low quality, and low output. Due to the lack of awareness of sustainability, these behaviors promote the development of extensive growth models and put enormous pressure on natural resources and the ecological environment. Excessive grazing and unreasonable mining of arid land in northwest China have accelerated the expansion of desertification and eventually made water resources scarcer. Many studies have pointed out that China’s current economic growth rate is unbalanced with the resource and environmental carrying capacity (RECC), and green development is insufficient (Huang et al., 2020). Due to the lack of experience in resource development in China and the unreasonable utilization of resources, the climate is gradually warming and the coverage of grassland has decreased linearly, the problems of environmental pollution and soil erosion are very prominent, and resource constraints are becoming increasingly tense. Therefore, changing the mode of economic development and improving the quality of development have become the inevitable choice for China’s future development (Guan and Zhang, 2022). Under this circumstance, China put forward the expression of high-quality development (HQD) for the first time in 2017, not only focusing on economic growth but also achieving sustainable growth under the condition of low consumption and high efficiency, avoiding blind expansion and extensive methods.
High-quality development requires the support of resource and environmental carrying capacity, and only development that meets the requirements of resource and environmental carrying capacity can be sustained. The carrying capacity of various natural resources and environment, including water, land, energy, and air, in the process of urbanization and industrialization is called RECC (Liao et al., 2020). Resources are the “food” and “blood” of development and the foundation of social development. The coordination between the social economy, resources, and the environment can promote the sustainable development of the economy (Sun et al., 2018). From the perspective of the economic growth model, economic development is inseparable from the input of supply factors such as land, energy, and the environment, as well as the investment of innovative factors such as technological progress (J. K. Wang et al., 2022). Efficient use of resources and high-level environmental protection is conducive to promoting high-quality development (Liao et al., 2020). If the quality and efficiency of the supply of elements such as resources and the environment are effectively improved, the effect of technological progress will be difficult to show in the short term, but it is in line with the eternal concept of long-term sustainable development, and is consistent with the “low energy consumption, low environmental pollution, and high economic benefits” model required for high-quality development (Xiao and Wen, 2021). If a region has prominent resource and environmental problems and blindly increases resource input and environmental pollution output, economic growth in the short term may be at a relatively high level (Wu et al., 2022). However, with the excessive consumption of resources and the environment, it is bound to bring resource constraints, and the RECC reaches the upper limit, which makes it difficult to withstand rapid economic growth. Some scholars have researched the constraints of resources and the environment on economic growth (Andersen et al., 2013; Barbier, 1999; Eriksson, 2018). The continuous reduction of resources will cause their prices to rise, attracting a flood of investment. These investments have a “crowding-out effect” on human and physical capital investments, hindering long-term economic growth in the region (Kang et al., 2021). Environmental hazards such as acid rain, land desertification, and the greenhouse effect have led to less and less available arable land and resources, increasing the disposal costs of the government and enterprises, and reducing economic benefits. Once the pollution that exceeds the environmental capacity continues to increase, it will have side effects on economic development and reduce the sustainability of economic development (Chen et al., 2022).
To solve these resource and environmental problems and reduce the constraints of resources and the environment on society and the economy, it is necessary to promote high-quality development (Zhu et al., 2020; Song et al., 2022). Rational planning under the requirements of high-quality development can ensure the effective use of environmental resources (Jia et al., 2019). High-quality development puts forward the goals of improving the RECC, such as land reclamation, mine geological environment management, land remediation, and coastal zone protection (Song et al., 2022). To achieve these goals, China’s high-quality development has adopted the means of industrial structure optimization and adjustment, technological progress, and green development (Wang and Li, 2019). After analyzing the “short plank” of RECC through the degree of coupling coordination, Wang et al. (2017) pointed out that due to the mobility of resources, under the conditions of limited resources, the formulation of economic development plans should consider transforming traditional technologies and optimizing the industrial layout. However, the unreasonable industrial structure and production layout will also make the existing problems of resources and the environment increasingly prominent (Meng, 2021). It can be seen that HQD and RECC are not only complementary but also infiltrate and interact with each other. Coordination involves benign interactions between multiple elements in a subsystem and can describe the sustainable development of interactions (Sun et al., 2018). Therefore, analyzing the coordination between RECC and HQD is of great significance for regional planning and development. The goal of the coordinated development of the two is to create a sustainable city with a solid economic foundation, ecological livability, and abundant natural resources (Song et al., 2022).
The existing literature on HQD and RECC focuses on two aspects, including their assessment and the interplay of social, economic, resource, and environmental impacts. On the one hand, many scholars have evaluated the high-quality economic development level and RECC of the region. Scholars evaluate the city’s high-quality economic development level on topics such as mining (Xu et al., 2022), ocean (Li et al., 2020), and urbanization (Cheng, 2022). Some scholars also analyze HQD from the perspective of carbon emissions (Liu and Hu, 2021; Zhang et al., 2021). The means of high-quality development, such as industrial structure upgrading, can achieve energy conservation and emission reduction, thereby improving environmental quality. Different from the traditional concept of economic development, high-quality development pays more attention to the comprehensive development of politics, economy, society, culture, and ecology. To achieve this comprehensive development, the government and its measures play a key role. Yang et al. (2019) discussed the role of the government in high-quality innovation development, and pointed out that government governance needs to be adapted to local conditions. In the case of environmental governance, the impact of environmental regulations varies for different regions (Ma and Xu, 2022). Appropriate environmental regulations can promote high-quality and sustainable economic development (L. Chen et al., 2022a), but overly stringent regulatory measures can be counterproductive (Yang et al., 2022).
Meanwhile, the evaluation of RECC has always been a hot topic of research. The existing literature has adopted frameworks such as the Pressure-State-Response model (Zou and Ma, 2021), the Driver-Pressure-State-Impact-Response model (A. Y. Wang et al., 2022), and Planetary Boundaries (Fang et al., 2015), etc. to study RECC. To cope with the disturbance of ecosystems caused by resource and environmental pressure, scholars use the results of RECC measurements to plan and manage the carrying capacity of regional ecosystems in advance. By assessing the water-carrying capacity of water-scarce countries, Ait-Aoudia and Berezowska-Azzag (2016) identified the population that can be sustained based on water resources and domestic consumption patterns. After evaluating the RECC of China’s mining economic zones, Wang et al. (2017) found that most economic zones lack water resources and need some policy leadership. Zhang et al. (2019) constructed the support-pressure index to assess the RECC level of cities, and pointed out that the pressure of human activities on resources and environment is gradually increasing, but the growth rate is slowing down. These scholars have studied the level of urban quality development and the status of the resource environment from different perspectives. HQD and RECC, as two independent subsystems, have their own connotations and focus. But the interaction between the two has a coupling and coordination relationship, which enables them to form a brand-new system. Therefore, it is necessary to study the coupling relationship between them.
On the other hand, the coupling between HQD and RECC subsystems can be distilled into interactions between society, economy, resources, and environment. Scholars have studied the economic-resource (Chen and Chen, 2019), economic-environmental (Li et al., 2022), economic-ecological (Liao et al., 2019), economic-energy-environmental (Wang et al., 2020), economic-resource-environmental (Zhu et al., 2020), socio-economic-environmental (Yang et al., 2015), and socio-economic-ecological (Wan et al., 2021; Bao et al., 2022) perspectives. Most of the studies on these issues are empirical studies covering multiple countries and provinces, and they all demonstrate the interconnectedness of subsystems. In other words, social and economic development and the natural resource environment are mutually influential and interactive. In addition to the study of cities, scholars from different fields are also studying the marine economy (Yu and Di, 2020), industrial economy (J. K. Wang et al., 2022), and mineral resources (X. H. Chen X. H. et al., 2022b). The coordination evaluation was achieved by using models such as coupling models (Li et al., 2022), system dynamics (Bao et al., 2022), and structural equation models (Chen and Chen, 2019). However, no scholars have carried out research from the level of HQD and RECC. As the goal of regional development, HQD includes not only the economic dimension but also the social and cultural level of the region. RECC is the ability of resources and the environment to sustain human socio-economic activities. Exploring the coupling relationship between HQD and RECC can not only fully reflect the interconnection between society, economy, resources and environment, but also synergistically promote HQD of human society and high-level protection of the ecological environment.
After reviewing the existing literature, we found that the research on the relationship between RECC and HQD in recent years mostly focuses on economic development and the environment, and rarely considers other dimensions of “high-quality development”. The connotation of high-quality development needs to jump out of the economic field and expand to all aspects of society, to better promote overall social progress. At present, no scholars have analyzed the interaction relationship and interaction mechanism between RECC and HQD. This paper provides a new idea for coordinated development. Therefore, this paper uses the coupling coordination degree and kernel density estimation model to measure the coupling degree and coordination degree of RECC and HQD systems in 30 provinces in China from 2005 to 2020, and identify the temporal and spatial evolution characteristics of the coupling relationship between RECC and HQD. The contributions of this paper are as follows: (1) The interactive relationship between HQD and RECC is analyzed, which opens up a new way for coordinated development; (2) Based on the existing theoretical framework, a comprehensive evaluation index system of RECC and HQD is constructed; (3) Through the information entropy method, coupling and kernel density estimation model, the spatial-temporal evolution characteristics of the coupling relationship between RECC and HQD are analyzed, and corresponding suggestions are put forward. The other parts of this paper are: the second part introduces the methods and data sources in detail; the third part analyzes the obtained results in detail; the fourth part discusses the results, and the last part concludes.
To study the coupling relationship between RECC and HQD coupling degree subsystems, a set of evaluation indicators should be established first. Through the literature search, expert interviews, and reference to relevant indices used in China’s national planning, 24 indices were identified, as shown in Tables 1, 2. This paper establishes an index system for RECC from two aspects: resource carrying capacity and environmental carrying capacity (Tan et al., 2022), and analyzes HQD from six aspects: economy, coordination, green, innovation, openness, and sharing.
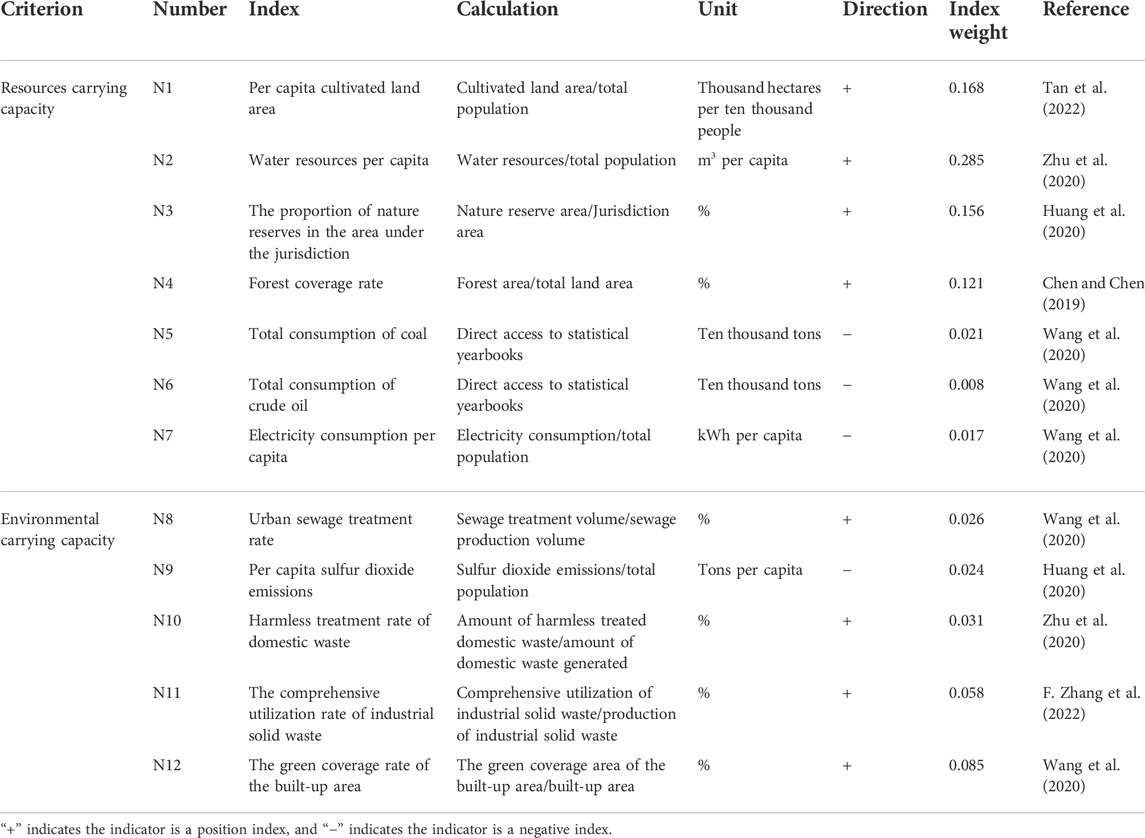
TABLE 1. The index system of resource and environmental carrying capacity (RECC).
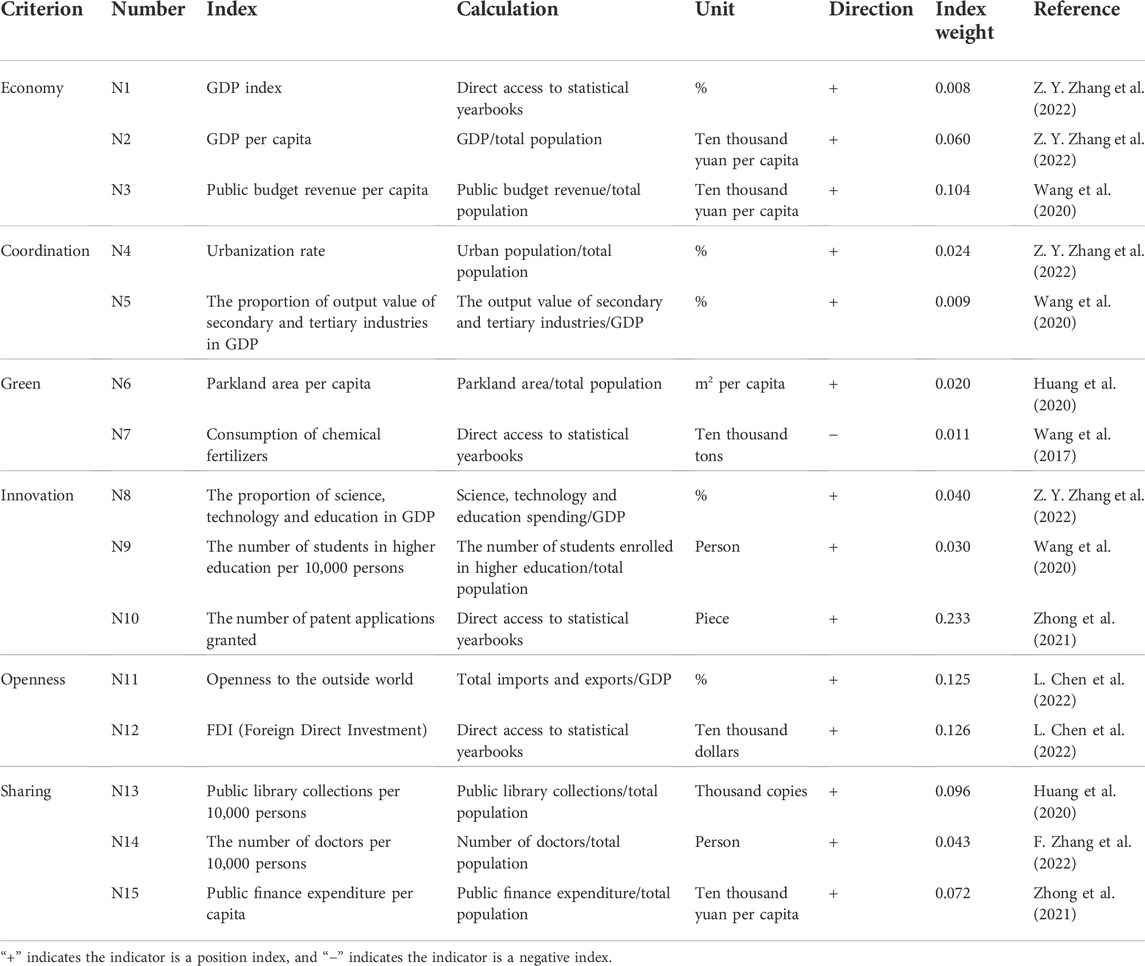
TABLE 2. The index system of high-quality development (HQD).
The data in this study include urban data, environmental data, and resource data. The data comes from relevant statistical yearbooks, including the China Statistical Yearbook (2006–2021), China Statistical Yearbook on Environment (2006–2021), China City Statistical Yearbook (2006–2021), and statistical yearbooks of various provinces. The missing data were filled by interpolation, and the data from Tibet, Hong Kong, Macau, and Taiwan were not included due to the difficulty of data availability. The drawing software is ArcGIS10.8.
Since different evaluation indices have different measurement units and dimension levels, it is difficult to compare with each other, so Eqs. 1, 2 are used to standardize the index data to eliminate the influence of dimensions and positive and negative directions (Liao et al., 2020):
where
This paper uses the information entropy method (Tan et al., 2022) to calculate the weights of different indicators, and objectively reflects the importance of the indicators according to the difference between the observed values of the indicators, to obtain a comprehensive index of RECC and HQD in each province. The specific calculation steps are as follows:
The calculation for the ratio of each indicator value to the total number of standard values in the sample year:
The calculation for the information entropy weight of the index
The calculation for the final weights of indicator
Calculation for the HQD development index and RECC development index for the sample:
where
According to the coupling degree model of multiple subsystems, the coupling model of the two subsystems used in this paper is Eq. 7 (Nasrollahi et al., 2020), where
where
The coupling degree can only express the degree of interaction between the two subsystems, and cannot express the quality of coordination. Therefore, this paper constructs a coupling coordination degree model (J. K. Wang et al., 2022) based on coupling degree to reflect the virtuous cycle relationship between HQD and RECC. The formula is shown below:
where
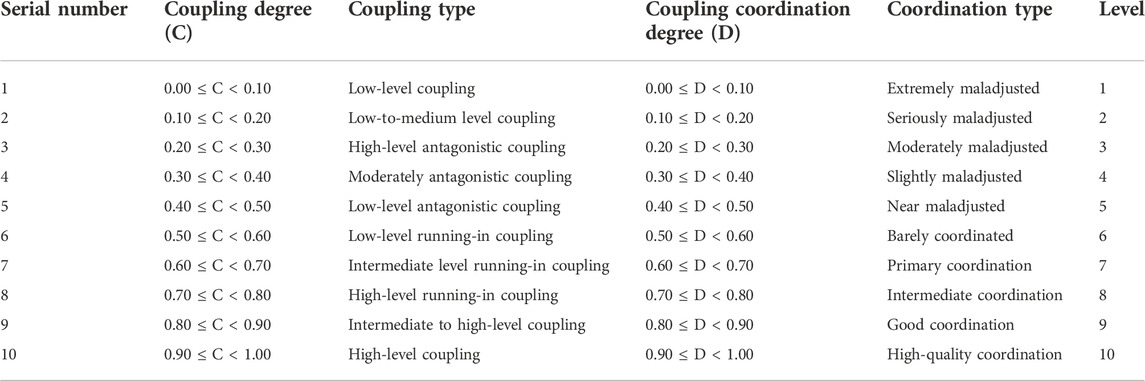
TABLE 3. Level division of the coupling degree and coupling coordination degree between RECC and HQD.
The kernel density estimation model can use the density curve to reflect the distribution of the observed variables. In this paper, the development and distribution of the coordination degree and coordination coupling degree of HQD and RECC in 30 provinces in China are described and analyzed by the kernel density curve. The weight function is obtained based on the results of the index weight calculation, and then the obtained results are compared with 0 to analyze the Gaussian function kernel function density values. Assuming that the random variable
where
Each indicator weight and dominant factor in the HQD and RECC subsystems (Table 1) can be determined. The factors that contribute the most to resource carrying capacity and environmental carrying capacity are water resources per capita and the green coverage rate of the built-up area, respectively. The factors that contribute the most to the economy, coordination, green, innovation, openness, and sharing are public budget revenue per capita, urbanization rate, parkland area per capita, number of patent applications granted, FDI (Foreign Direct Investment), and public library collections per 10,000 persons. In the HQD subsystem, the index weights are sorted as follows: the number of patent applications granted > FDI > openness to the outside world > public budget revenue per capita > public library collections per 10,000 persons > public finance expenditure per capita > GDP per capita > the number of doctors per 10,000 persons > the proportion of science, technology and education in GDP > the number of students in higher education per 10,000 persons > urbanization rate > parkland area per capita > consumption of chemical fertilizers > the proportion of output value of secondary and tertiary industries in GDP > GDP index. In the RECC subsystem, the indicator weights are sorted as follows: water resources per capita > per capita cultivated land area > proportion of nature reserve in the area under jurisdiction > forest coverage rate > the green coverage rate of the built-up area > comprehensive utilization rate of industrial solid waste > harmless treatment rate of domestic waste > urban sewage treatment rate > per capita sulfur dioxide emissions > electricity consumption per capita > total consumption of coal>total consumption of crude oil. The number of patent applications granted and water resources per capita contribute the most to HQD and RECC. The possible reason is that the number of patent applications granted can reflect the technical capabilities of a province, and advanced technologies are more conducive to high-quality development; It has an irreplaceable important position in social development.
According to the formulas and index systems above, this paper calculates the changes in the comprehensive development index of RECC and HQD in the 30 provinces from 2005 to 2020, respectively (Figures 1, 2). In recent years, the improvement of resource utilization efficiency and the level of production technology has made the RECC and HQD indices of most provinces show an upward trend. While the upward trend of RECC is not as obvious as that of HQD. The possible reasons are: China has intensified efforts to build infrastructure and open to the outside world in recent years, and established coastal economic open areas (Li et al., 2021). The implementation of some policies, such as the Belt and Road, has effectively promoted the improvement of RQD in coastal regions, while the development of RECC in various coastal regions is relatively underpowered.

FIGURE 1. RECC temporal line chart of 30 provinces.
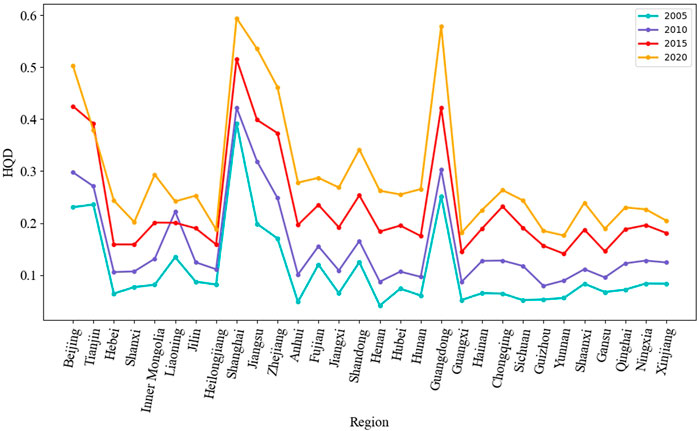
FIGURE 2. HQD temporal line chart of 30 provinces.
There is a large gap in the RECC of each province (Figure 1). Inland cities such as Inner Mongolia, Heilongjiang, Yunnan, and Qinghai stand out. In the western region, through the establishment of ecological compensation mechanisms, environmental problems such as grasslands, wetlands, and desertification have been repaired, and the resources and environment have been gradually restored. This, coupled with the unique resources and regional location of these provinces, has driven their RECC development. In comparison, coastal cities such as Tianjin, Shanghai, and Shandong have a lower RECC composite index. Generally speaking, coastal cities have many types of resources and abundant reserves, and their RECC values should perform well. This result shows that their social and economic structure during this period is not reasonable enough, which affects the effective allocation of resources and the effective protection of the environment.
The HQD composite index of all provinces increased steadily during this period, which is inseparable from the achievements of China’s new development concept leading to economic development. The development trend of HQD in various regions is uneven to a certain extent. The best-performing provinces are Beijing, Tianjin, Shanghai, Zhejiang, and Guangdong. It can be seen that, except for the capital Beijing, all other provinces are coastal cities. Compared with the results of the RECC index, it shows that the objective level of economic development in China’s coastal areas is better, but the regional linkage effect is not strong, and the development between regions is not balanced.
The HQD and RECC fitting curves of 30 provinces in China from 2005 to 2020 are nonlinear. To explore the nonlinear relationship between them, this paper chooses different functions for fitting, and finally finds that the polynomial function has the best effect on fitting the nonlinear relationship. The results show that there are 4 nonlinear relationships between HQD and RECC in 30 provinces (Figure 3).
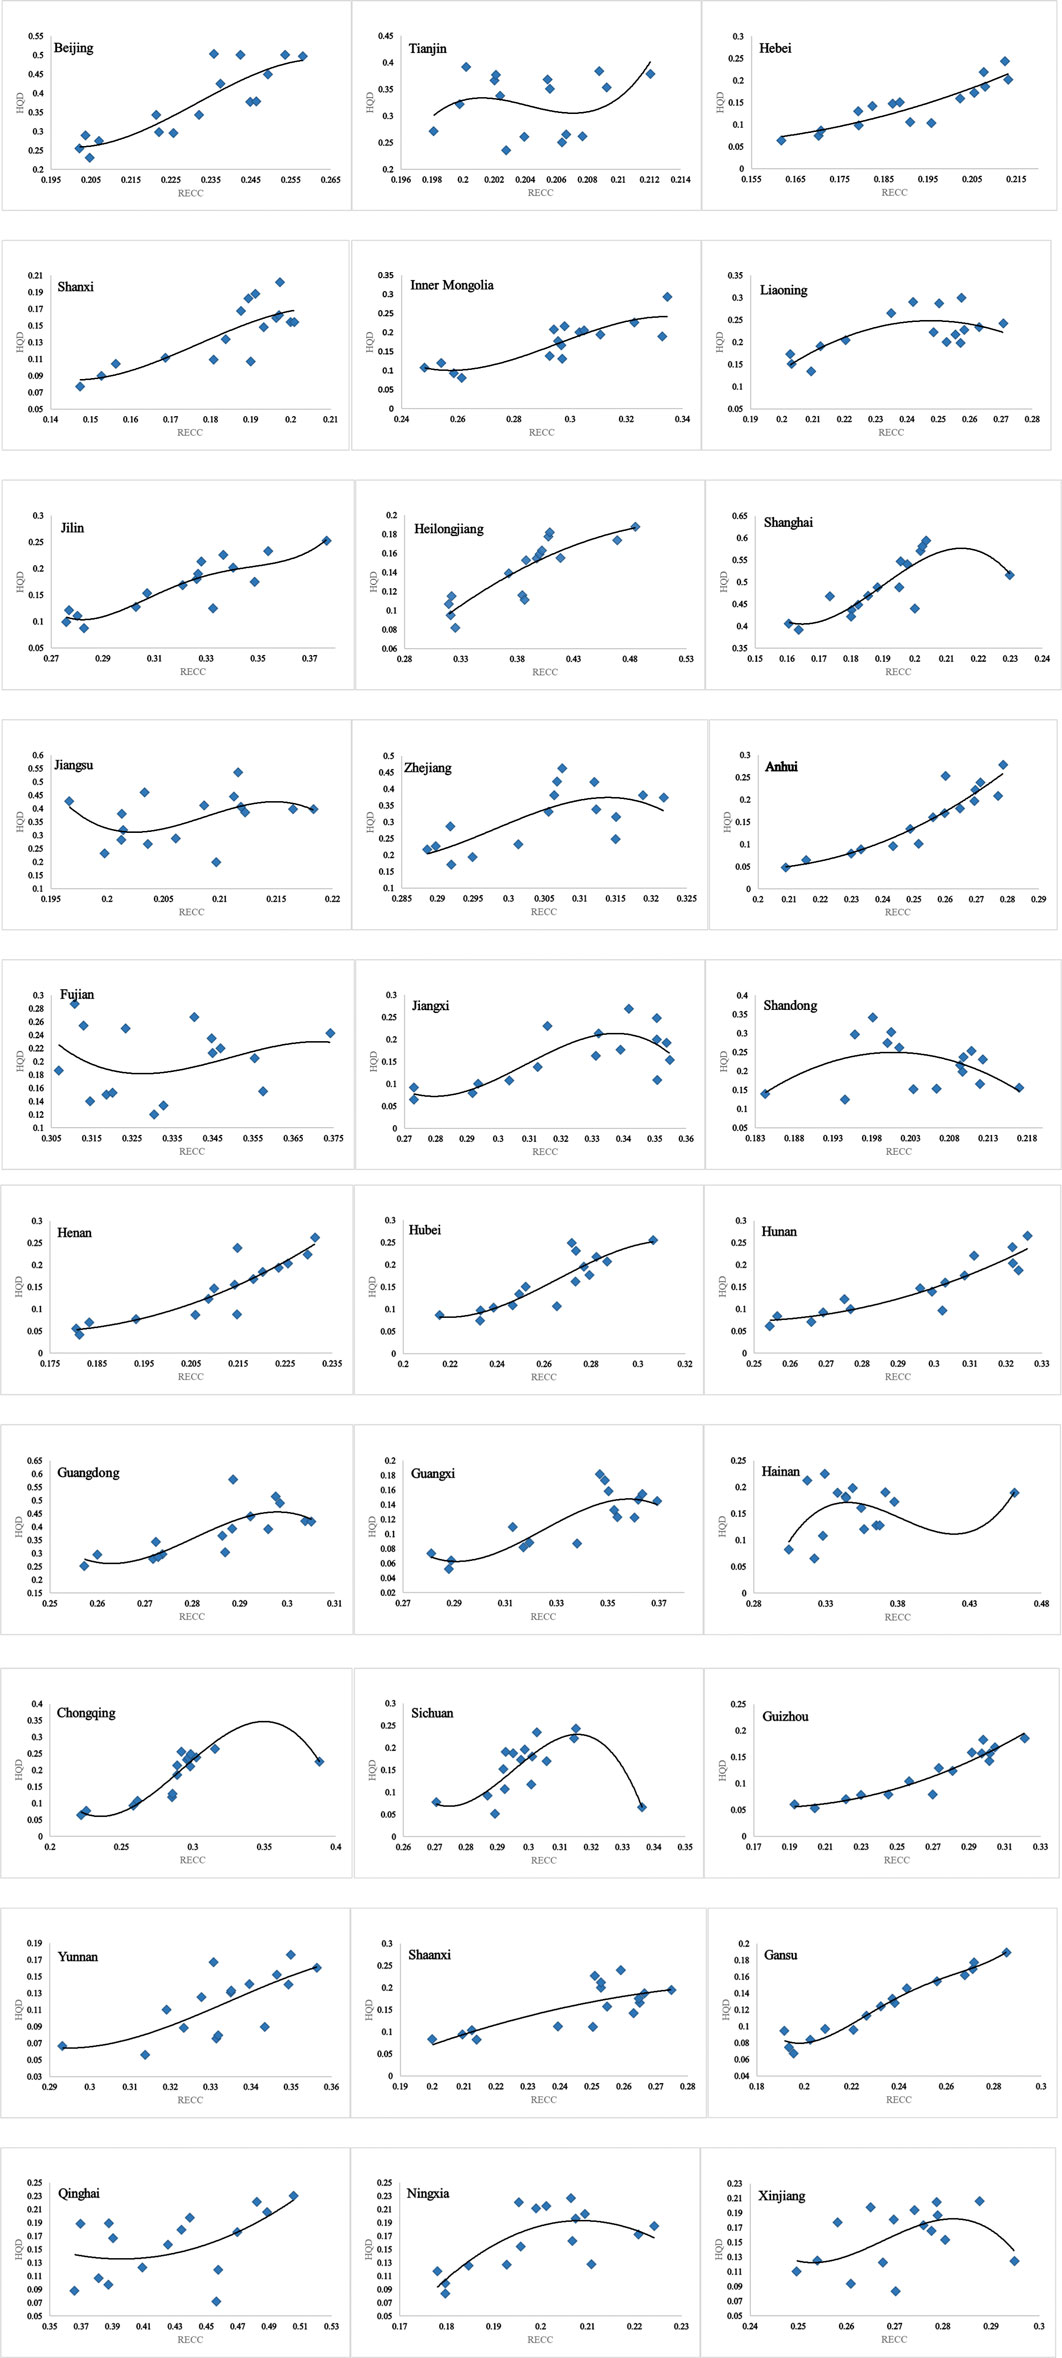
FIGURE 3. The fitting curve of HQD and RECC in 30 provinces.
The first type is that HQD increases with the increase of RECC, including 12 provinces of Beijing, Hebei, Shanxi, Jilin, Heilongjiang, Anhui, Henan, Hubei, Hunan, Guizhou, Yunnan, and Shaanxi. The second type is that HQD first decreases and then increases with the increase of RECC, including 4 provinces of Inner Mongolia, Fujian, Gansu, and Qinghai. The third type is that HQD first increases and then decreases with the increase of RECC, including Liaoning, Shandong, Zhejiang, and Ningxia. The fourth type is that HQD fluctuates between increasing and decreasing with the increase of RECC, including Tianjin, Shanghai, Jiangsu, Guangdong, Guangxi, Jiangxi, Hainan, Chongqing, Sichuan, and Xinjiang, a total of 10 provinces. Different provinces have different degrees of development in various aspects, and the factors that their development depends on are also different. Except for Beijing, most of the provinces in which HQD and RECC have developed steadily together are those with relatively backward economies. These provinces have had slower economic growth, but they are not overly dependent on resources for development. The economic growth of some western provinces depends on infrastructure construction and resource output, such as Chongqing, Sichuan, Guangxi, etc. Therefore, the relationship between their HQD and RECC is not simply a simultaneous growth.
The result (Figure 4) shows the kernel density curves of the coupling degree and coupling coordination degree of the HQD and RECC subsystems changing with time. As far as the coupling degree is concerned, the overall kernel density curve shows a right-shifting trend, but there is no obvious right-shifting from 2015 to 2020, indicating that from 2005 to 2015, the overall coupling degree of HQD and RECC in China has increased, while the level of coupling did not change much in 2015; The kernel density curve in 2005 has a weak double peak, indicating that the coupling degree of HQD and RECC has a certain polarization phenomenon at this time. The peak value of the curve gradually increases, and the width of the wave peak gradually decreases, indicating that the coupling degree gap between regions is decreasing, until the curve has an obvious peak form. In terms of coupling coordination degree, the peak value of the nuclear density curve does not change significantly, but the overall curve shifts to the right year by year, indicating that the overall HQD and RECC coupling coordination degree in China has gradually increased from 2005 to 2020. The gradual improvement of China’s economic development structure is conducive to the utilization of resources, and the economical use of environmental resources will also promote economic development. The crest width did not change significantly, indicating that the difference in the coordination degree between regions did not change much, but the crest width increased to a certain extent from 2005 to 2010, that is, the regional disparity in the coordination degree in 2010 widened slightly. There is no double peak in the kernel density curve of coordination degree, indicating that the phenomenon of polarization does not exist.
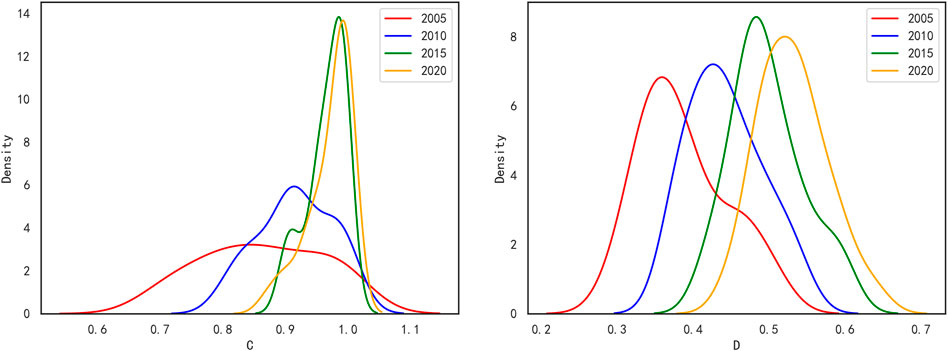
FIGURE 4. Kernel density curves of coupling and coordination degrees of HQD and RECC in 30 provinces.
The result (Figure 5) shows the process of the spatial evolution of coupling degree between HQD and RECC in 30 provinces in China. The proportion of spaces with high coupling degree levels gradually increased, and the spatial distribution of coupling degree types gradually gathered, that is, the degree of interaction between HQD and RECC in adjacent areas did not differ much, and eventually maintained stable development.
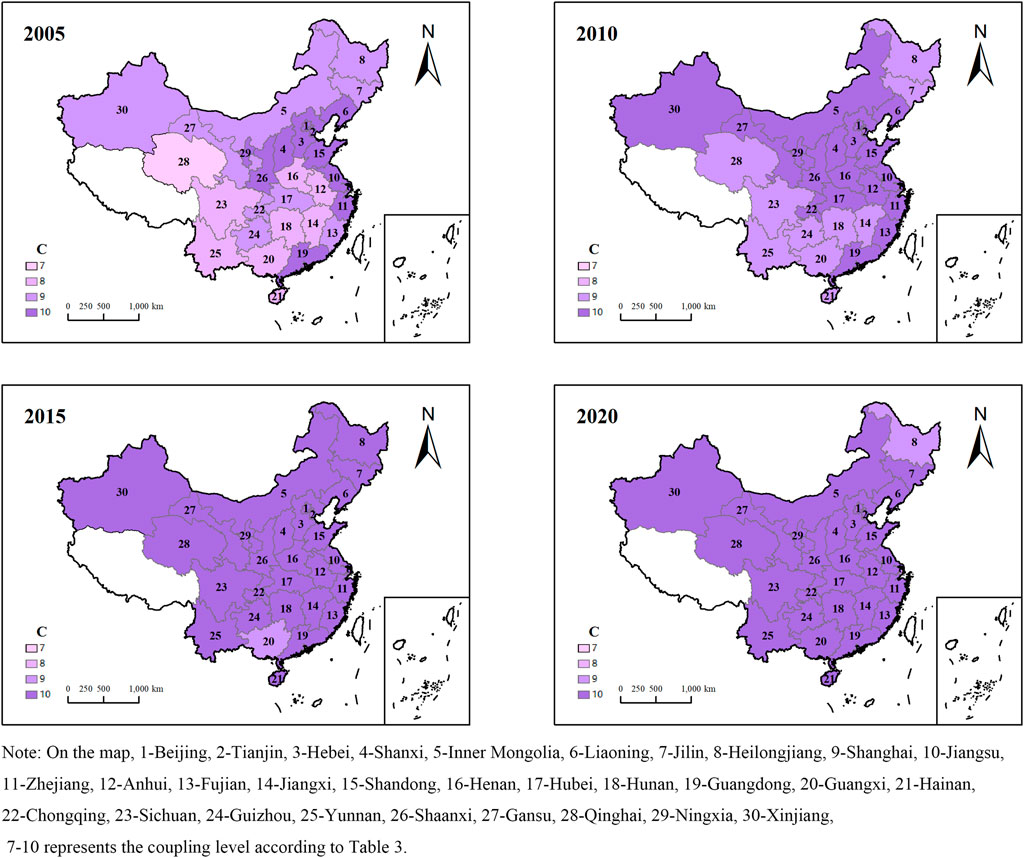
FIGURE 5. Spatial evolution of coupling level between HQD and RECC of 30 provinces.
In 2005, Qinghai belonged to the intermediate level running-in coupling area [0.6, 0.7], accounting for 3.33%. The high-level running-in coupling area [0.7, 0.8] includes 8 provinces including Sichuan, Guangxi, and Hainan, accounting for 26.67%. The intermediate to high-level coupling area [0.8, 0.9] includes 9 provinces including Guizhou, Fujian, Jilin, Xinjiang, and Chongqing, accounting for 30%. The high-level coupling area [0.9, 1.0] includes 12 provinces including Guangdong, Jiangsu, Beijing, Tianjin, and Liaoning, accounting for 40%. At this time, the resource advantages of western regions such as Yunnan, Qinghai, and Sichuan, and northeastern regions such as Jilin and Heilongjiang have not yet been transformed into economic advantages. The coastal provinces, such as Guangdong and Jiangsu, took advantage of the reform and opening-up policy and other policies to give full play to their advantages in resources and geographical location, and turned them into economic advantages.
In 2010, no provinces belonged to the intermediate level running-in coupling area [0.6, 0.7] and the high-level running-in coupling area [0.7, 0.8]. The intermediate to high-level coupling area [0.8, 0.9] includes 10 provinces including Sichuan, Jilin, Hainan, and Hunan, accounting for 33.33%. The high-level coupling area [0.9, 1.0] includes the remaining 20 provinces such as Hubei, Fujian, Shaanxi, and Henan, accounting for 66.67%. Compared with 2005, Qinghai changed from the intermediate level running-in coupling area to the intermediate to high-level coupling area. Sichuan, Hainan, Hunan, Jiangxi, Yunnan, and Guangxi became the intermediate to high-level coupling areas. Chongqing, Inner Mongolia, Fujian, Gansu, Xinjiang, Henan, Hubei, and Anhui became the high-level coupling area. The remaining 15 provinces maintained the same coupling type as in 2005. At this time, the spatial distribution and aggregation of coupling degree types began to be obvious. Most of the western regions and parts of northern regions were in the intermediate to high-level coupling area, and most of the coastal areas and central areas were in the high-level coupling area.
In 2015, only Guangxi was in the intermediate to high-level coupling area [0.8, 0.9], accounting for 3.33%. Guangxi’s advantage lies in the coastal area, but from 2010 to 2015, Guangxi’s RECC increased significantly more than HQD. In this period, Guangxi has not given full play to its geographical advantages and needs to increase its economic development efforts. The remaining 29 provinces were all in the high-level coupling area [0.9, 1.0], accounting for 96.67%, indicating that the development during this period is less dependent on the large supply of natural resources.
In 2020, only Shanghai and Heilongjiang were reduced to the intermediate to high-level coupling area [0.8, 0.9]. The remaining 28 provinces were all in the high-level coupling area [0.9, 1.0], accounting for 93.33%. As a province with rapid economic development, Shanghai has played a leading role in China’s economic development. Therefore, it is difficult to avoid increasing resource consumption and causing certain impacts on ecology and the environment. The growth rate of HQD in Heilongjiang is not as fast as that of RECC, indicating that Heilongjiang needs to pay more attention to social and economic development, and can take advantage of resources and the environment at an appropriate time.
The result (Figure 6) shows the process of the spatial evolution of coupling coordination degree between HQD and RECC in 30 provinces in China. The proportion of regions with a high degree of coordination is an upward trend, showing spatial aggregation. However, there is still a certain gap in the overall state of high-quality coordination.
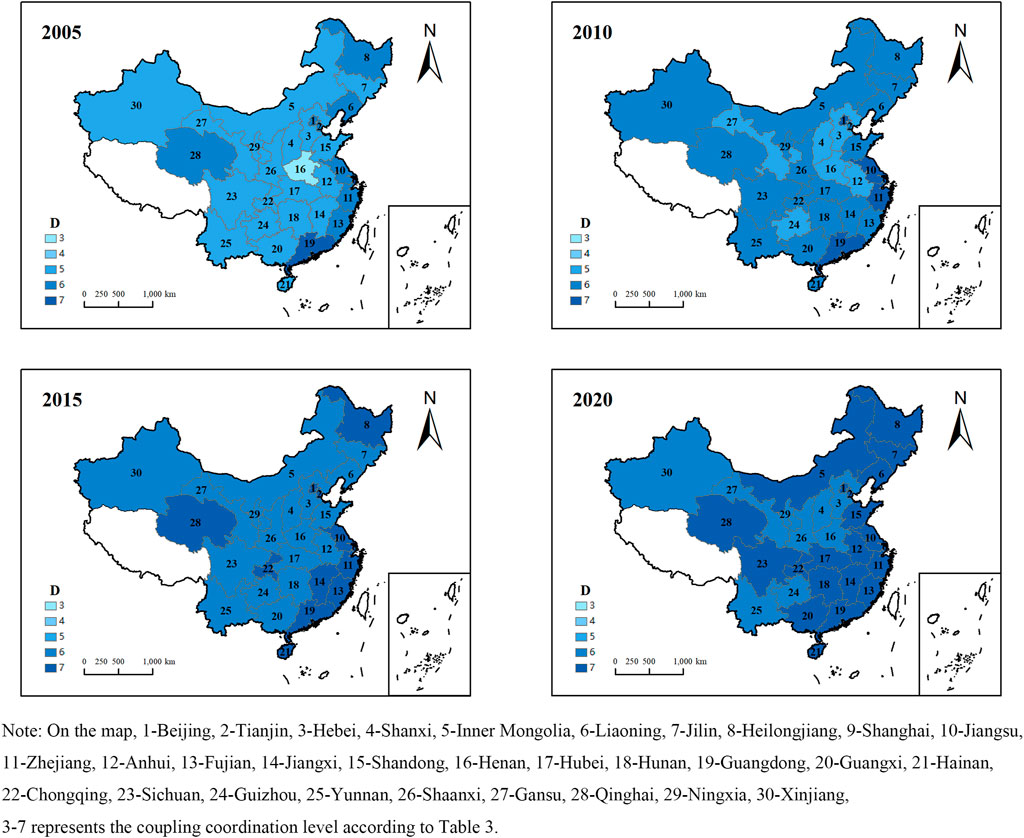
FIGURE 6. Spatial evolution of coupling coordination level between HQD and RECC of 30 provinces.
In 2005, Henan was moderately maladjusted [0.2, 0.3], accounting for 3.33%. 19 provinces including Guizhou, Chongqing, Ningxia, and Gansu were slightly maladjusted [0.3, 0.4], accounting for 63.33%. 8 provinces including Beijing, Qinghai, Fujian, Zhejiang, and Liaoning were near maladjusted [0.4, 0.5], accounting for 26.67%. Guangdong and Shanghai were near maladjusted areas [0.4, 0.5], accounting for 6.67%. The coordination degree in the central region was relatively low, showing a trend of gradually increasing coordination degree from the central region to the coast. The natural resources in central China are not as good as those in coastal cities and western regions, so it is difficult to convert resources into economic advantages. The overall quality of their development is lower, and the level of their coordinated development is also relatively low.
In 2010, Henan became a slightly maladjusted area [0.3, 0.4]. Jilin, Hainan, Jiangxi, Xinjiang, Chongqing, and other 14 provinces became near maladjusted areas [0.4, 0.5]. Beijing, Zhejiang, and Jiangsu became barely coordinated [0.5, 0.6]. The remaining 12 provinces maintained the same coordination level as in 2005. The northern and central regions saw the most significant increases in coordination degree, with little change in the western and southern provinces. Overall, 6 provinces including Anhui, Guizhou, Gansu, and Shanxi were slightly maladjusted [0.3, 0.4], accounting for 20%. 19 provinces including Fujian, Liaoning, Tianjin, and Qinghai were near maladjusted [0.4,0.5], accounting for 63.33%. The remaining 5 provinces were barely coordinated, accounting for 16.67%.
In 2015, 18 provinces including Sichuan, Shandong, Yunnan, and Guangxi were near maladjusted [0.4, 0.5], accounting for 60%. Twelve provinces including Jilin, Jiangxi, Heilongjiang, and Jiangsu were at the level of barely coordinated [0.5, 0.6], accounting for 40%. Anhui, Guizhou, Henan, Gansu, Hebei, and Shanxi became near maladjusted areas. Hainan, Fujian, Tianjin, Qinghai, Chongqing, Jiangxi, and Heilongjiang became barely coordinated regions. The remaining 17 provinces maintained the same level of coordination as in 2010. It can be seen that the overall coordination degree in China has an obvious upward trend, and the coordination degree of many provinces has increased by one level. This also shows the determination and measures of the Chinese government to enhance the resource and environmental carrying capacity in the process of high-quality development, to ensure the coordinated development of regional environmental development and regional economy.
In 2020, 9 provinces including Guizhou, Tianjin, Shandong, and Shaanxi were near maladjusted [0.4, 0.5], accounting for 30%. 19 provinces including Liaoning, Anhui, Henan, and Hubei were at the level of barely coordinated [0.5, 0.6], accounting for 63.33%. Guangdong and Zhejiang were at the level of primary coordination [0.6, 0.7], accounting for 6.67%. Inner Mongolia, Jilin, Hunan, Hubei, and the other 9 provinces became barely coordinated regions. Guangdong and Zhejiang became the primary coordination area. The remaining 19 provinces maintained the same coordination level as in 2015. Compared with 2015, the improvement of coordination in 2020 is not outstanding, but the overall development is more coordinated and orderly, and the differences between regions are narrowed.
Based on the above analysis, it can be found that the spatiotemporal evolution of the coupling coordination of HQD and RECC in each province had the following characteristics. The overall level of development of coupling coordination was on the rise, but there was still a certain gap from high-quality coordination. This also reflected China’s efforts to promote urban economic development and ecological protection. From a regional perspective, the coordination level of HQD and RECC showed a downward trend from the eastern region to the central and western regions, and the coordination level of the southeastern provinces was generally higher. This was related to more active economic development and richer natural resources in coastal provinces. Since 2010, the coordination level in the northern region was also better. Many cities in the north take the road of green and high-quality development, relying on the advantages of resources and the environment. This choice not only strengthened the ecological environment protection but also developed the characteristic economy, which gradually improved the coupling and coordination of HQD and RECC in the northern region in recent years.
The coordinated development between HQD and RECC will help cities improve the sustainable utilization of resources in the process of high-quality development. This paper provides a reference for the scientific formulation of resource planning and environmental management policies in different regions.
The number of patent applications granted, FDI, and openness to the outside world are the most crucial factors for HQD, and the possible reason is that the important positions the number of patent applications granted, FDI, and openness to the outside world hold for social and economic development. The number of patents granted is used to measure the level of innovative development, driving high-quality development. FDI and openness to the outside world play a significant positive role in high-quality development (Li et al., 2021). We should adhere to the policy of opening up to the outside world. Moreover, the results of this study show that indicators such as per capita cultivated land area, the proportion of nature reserves in the area under the jurisdiction, and forest coverage rate are relatively important determinants in the RECC subsystems. Among them, water resources per capita contributes the most to RECC, which is similar to the argument of most research (Bian et al., 2019; Tan et al., 2022). Therefore, while attaching importance to economic development, relevant managers and policymakers need to pay attention to the utilization of cultivated land and water resources, and strengthen the protection of nature and forests, achieving coordinated development (Long et al., 2019; Yang et al., 2021).
The results of the HQD and RECC composite indices reflect the variability among Chinese provinces. The RECC performance of inland provinces is better, and the HQD index of coastal provinces is generally higher than that of inland cities. Contrary to the expected results (Zhang et al., 2019), the RECC performance of the resource-rich coastal region was inferior to that of the interior. The possible reasons are as follows. The western inland areas have complex landform types and climates, and the ecological environment is fragile and changeable. Therefore, China has been focusing on the environmental quality of the western region for a long time. At the same time, the public’s awareness of environmental protection has increased, which has promoted the improvement of its RECC. However, due to the constraints of natural conditions in inland areas, the performance of its HQD did not reach the level of RECC. Coastal areas pay too much attention to economic development, and lose their original resource advantages. This may be due to the unreasonable social and economic structure during this period. To promote the improvement of the economy and comprehensive level, the developed regions have to pay the cost of the destruction of resources and the environment, leading to prominent ecological problems, and the performance of RECC is not as good as expected.
This phenomenon also leads to a certain gap between China’s overall coordination level and high-quality coordination. In the time dimension, the overall coupling level and coordination level of the 30 provinces are gradually improving. Spatially, the spatial distribution of coupling degree types gradually gathered, and the differences in coupling coordination types between regions gradually decreased. These basic features of this study are similar to the findings of (Zhu et al., 2020; Zhong et al., 2021; Ding et al., 2022) in Guangxi province, southwest China and urban agglomeration in middle reaches of the Yangtze River. So far, the vast majority of China’s poor population is still distributed in the western region, and the western region still faces severe challenges from the imbalance of resources, environment, and social and economic development. In developed areas such as coastal provinces, despite their rapid economic development, they are densely populated and have limited terrain. The fundamental reason is that China’s social and economic structure is not rational enough, the regional linkage effect is not strong, and the development between regions is not balanced. Therefore, the coordinated development of HQD and RECC is an urgent problem that China needs to solve at present. The optimization of industrial structure, technological progress, and green development under the connotation of high-quality development can offset the damage to resources and the environment caused by the increase in economic scale (Wang and Li, 2019). The government needs to “prescribe the right medicine”. For inland backward areas, the government should promote technological progress and talent attraction to achieve strong social and economic development. For developed areas, the government should increase the implementation of environmental protection policies, adhere to sustainable development, and ultimately achieve coordinated regional development.
It has always been the focus of people to realize the win-win between social and economic development and resource protection. Extensive economic development needs to pay the price of resource depletion and environmental degradation. Therefore, the realization of sustainable HQD has become an inevitable path for future development. Under China’s sustainable development goal, coordinated development is the ultimate pursuit. In this context, this study analyzed the interaction between HQD and RECC for the first time, opening up a new path for synergistic development. Based on the existing theoretical framework, this paper constructs the evaluation index system of RECC and HQD. Relevant researchers can evaluate and analyze the coupling characteristics of different regions based on this system. In this paper, the coupling degree, coupling coordination degree, and nuclear density model are used to analyze the temporal and spatial evolution characteristics between them, and the interaction relationship between HQD and RECC is confirmed. This study measures the coupling coordination level of HQD and RECC from the provincial spatial scale, and finds the regional differentiation law of high coupling coordination degree in developed areas and low coordination degree in backward areas. The obtained results provide a theoretical and empirical basis for the coordinated development of resources, environment, and social economy, and have great policy implications for the sustainable development of developing countries such as China. The main conclusions can be summarized as follows:
1. Among the subsystems of RECC, water resources per capita and the green coverage rate of the built-up area contribute the most to RECC. Among the subsystems of HQD, GDP per capita, urbanization rate, parkland area per capita, number of patent applications granted, FDI, and public library collections per 10,000 persons contribute the most to HQD. Over time, the comprehensive development indices of RECC and HQD in most provinces have shown an upward trend, but the upward trend of RECC is not as obvious as that of HQD. The RECC performance of inland regions is generally better than that of coastal provinces, but the HQD development index is not as good as that of coastal provinces. There are four nonlinear relationships between RECC and HQD, including simultaneous increase, first decrease and then increase, first increase and then decrease, and alternating fluctuation. During this period, the social and economic structure is not reasonable enough, which affects the effective allocation of resources and the effective protection of the environment.
2. From the perspective of time series, the coupling relationship between RECC and HQD shows an overall upward trend over time. The coupling degree and coupling coordination degree between them are gradually improving, gradually evolving to high-level coupling types, and low-level coupling types gradually decreasing or even disappearing. The coupling degree between RECC and HQD has reached the highest level, but the coupling coordination degree between them is still a certain gap from the state of high-quality coordination. This reflects the role of China’s resource and environmental policies and departments in achieving coordinated development.
3. From the perspective of spatial sequence, the coupling relationship between RECC and HQD is in a state of spatial aggregation as a whole. The distribution range of the high coupling area and high coordination area gradually expanded. There is a certain gap in the coupling level between coastal and inland regions, but the overall spatial gap between adjacent regions is narrowing. The polarization of the coupling degree changes from weak to insignificant, and there is no polarization phenomenon in the coordination degree. Overall, the coupling stage of the interaction between HQD and RECC in Chinese provinces is consistent with their social and economic development level.
Under the goal of high-quality development, the harmonious coexistence of nature and humans requires more effort. Therefore, from the research in this paper, the following policy recommendations can be put forward. First, the government needs to improve the environmental protection system. By increasing the cost burden of the production environment of enterprises, local enterprises are forced to improve their technical level. High-quality development is not overly dependent on resources, but on technological progress (Pan et al., 2021). The government should strictly carry out environmental protection supervision and promote the implementation of industrial greening in various places. Localities can accelerate the elimination of industries with high emissions, high pollution, and low efficiency, and reduce unnecessary consumption of resources. Second, the government should promote the differentiation mechanism of environmental policies and promote high-quality and balanced development among regions. When local governments carry out urban planning and construction, they need to consider the pressure and carrying capacity of local resources and the environment. After the national overall strategic policy is formulated, regional urban factors will lead to differences in effects. The government can formulate corresponding green development strategies based on the resource endowments and industrial bases of various regions. For the damaged environment, it is necessary to implement a zonal and classified ecological protection and restoration system. Finally, the government can pay attention to the developmental strengths of various places, define characteristic resources and technologies, and form complementary advantages. Although natural resources such as land and protected areas are difficult to flow, talents and technologies can be shared in many places. Therefore, the government should focus on promoting the flow of advantageous elements in various regions, amplifying comparative advantages, and promoting the transformation of resource advantages into development advantages. Focusing on pillar industries, all regions continue to improve the level of corresponding resource reserves and factor guarantees, and gather advantages to form a surging development momentum.
However, this paper also has certain limitations. The indicators of this study refer to the existing literature and relevant indicators mentioned in China’s national planning, but there are still some indicators that are not considered due to unavailability. The socio-economic development among regions in China is unbalanced, and the evaluation indicators cannot be one-size-fits-all. Future researchers can further refine and modify the indicators. In addition, this paper studies and analyzes the time and space sequences of RECC and HQD, but does not study the driving mechanism, which still needs to be further explored in the future [Wang et al., 2022].
The original contributions presented in the study are included in the article/Supplementary Material; further inquiries can be directed to the corresponding author.
LZ designed the study, played the guiding role in the study, and completed the writing of the manuscript; YC were responsible for data collection and processing, and mainly took charge of the revision of the manuscript; LZ completed the analysis of the results and the writing; WW contributed to the data processing and the revision of the manuscript; JW contributed to the analysis of the results and the writing of the manuscript.
This research was funded by Sichuan Science and Technology Program, grant number No. 2021JDR0224.
The authors declare that the research was conducted in the absence of any commercial or financial relationships that could be construed as a potential conflict of interest.
All claims expressed in this article are solely those of the authors and do not necessarily represent those of their affiliated organizations, or those of the publisher, the editors and the reviewers. Any product that may be evaluated in this article, or claim that may be made by its manufacturer, is not guaranteed or endorsed by the publisher.
The Supplementary Material for this article can be found online at: https://www.frontiersin.org/articles/10.3389/fenvs.2022.971508/full#supplementary-material
Ait-Aoudia, M. N., and Berezowska-Azzag, E. (2016). Water resources carrying capacity assessment: The case of Algeria's capital city. Habitat Int. 58, 51–58. doi:10.1016/j.habitatint.2016.09.006
Andersen, T. B., and Dalgaard, C. J. (2013). Power outages and economic growth in Africa. Energy Econ. 38, 19–23. doi:10.1016/j.eneco.2013.02.016
Bao, C., Wang, H. J., and Sun, S. A. (2022). Comprehensive simulation of resources and environment carrying capacity for urban agglomeration: A system dynamics approach. Ecol. Indic. 138, 108874. doi:10.1016/j.ecolind.2022.108874
Bao, H. J., Wang, C. C., Han, L., Wu, S. H., Lou, L. M., Xu, B. G., et al. (2020). Resources and environmental pressure, carrying capacity, and governance: A case study of Yangtze river economic Belt. Sustainability 12 (4), 1576. doi:10.3390/su12041576
Barbier, E. B. (1999). Endogenous growth and natural resource scarcity. Environ. Resour. Econ. 14 (1), 51–74. doi:10.1023/a:1008389422019
Bian, J. M., Sun, X. Q., Zhang, B. J., Zhang, Z. Z., Ding, F., and Wang, Y. (2019). Study on the natural mineral water resource bearing capacity and its driving factors in fusong county, changbai mountain area, Jilin province of China. Water Resour. 46 (3), 332–343. doi:10.1134/s0097807819030096
Bibri, S. E., Krogstie, J., and Karrholm, M. (2020). Compact city planning and development: Emerging practices and strategies for achieving the goals of sustainability. Dev. Built Environ. 4, 100021. doi:10.1016/j.dibe.2020.100021
Bond, J. W., and Hui, S. F. (1996). Implicit models of Gaussian mixture densities and locally optimum detectors. J. Frankl. Inst. 333B (5), 647–658. doi:10.1016/0016-0032(96)00047-6
Chen, L., Wang, N., Li, Q. Y., and Zhou, W. J. (2022a). Environmental regulation, foreign direct investment and China's economic development under the new normal: Restrain or promote? Environ. Dev. Sustain. doi:10.1007/s10668-022-02239-0
Chen, M., and Chen, H. Q. (2019). Study on the coupling relationship between economic system And water environmental system in beijing based on structural equation model. Appl. Ecol. Environ. Res. 17 (1), 617–632. doi:10.15666/aeer/1701_617632
Chen, X. H., Zhou, F. Y., Hu, D. B., Yi, G. D., and Cao, W. Z. (2022b). An improved evaluation method to assess the coordination between mineral resource exploitation, economic development, and environmental protection. Ecol. Indic. 138, 108808. doi:10.1016/j.ecolind.2022.108808
Cheng, J. Y., Zhou, K., Chen, D., and Fan, J. (2016). Evaluation and analysis of provincial differences in resources and environment carrying capacity in China. Chin. Geogr. Sci. 26 (4), 539–549. doi:10.1007/s11769-015-0794-6
Cheng, H. R. (2022). Evaluation and analysis of high-quality development of new urbanization based on intelligent computing. Math. Problems Eng. 2022, 1–8. doi:10.1155/2022/6428970
Ding, Y., Zhang, L., and Ma, X. (2022). Temporal and spatial evolution of coupling coordination of mountainous urbanization and its resource and environment carrying capacity. Res. Environ. Sci. 35 (02), 592–600. doi:10.13198/j.issn.1001-6929.2021.11.27
Eriksson, C. (2018). Phasing out a polluting input in a growth model with directed technological change. Econ. Model. 68, 461–474. doi:10.1016/j.econmod.2017.08.022
Fang, K., Heijungs, R., and De Snoo, G. R. (2015). Understanding the complementary linkages between environmental footprints and planetary boundaries in a footprint-boundary environmental sustainability assessment framework. Ecol. Econ. 114, 218–226. doi:10.1016/j.ecolecon.2015.04.008
Fu, J. Y., Zang, C. F., and Zhang, J. M. (2020). Economic and resource and environmental carrying capacity trade-off analysis in the Haihe River basin in China. J. Clean. Prod. 270, 122271. doi:10.1016/j.jclepro.2020.122271
Guan, H., and Zhang, Y. (2022). Measurement and evaluation of the coupling coordination of environmental regulation and high-quality economic development. Ecol. Econ. 38 (5), 169–176.
Huang, X. H., Cai, B. Q., and Li, Y. L. (2020). Evaluation index system and measurement of high-quality development in China. Rev. De. Cercet. Si Interv. Sociala 68, 163–178. doi:10.33788/rcis.68.11
Jia, Z., Chen, X. P., and Wang, H. C. (2019). Development of regional eco-environment and economy based on environmental bearing capacity model. J. Environ. Prot. Ecol. 20, S432–S437.
Kang, A. -x., Hao, F., and Song, X. -y. (2021). Is Non-renewable natural resources a blessing or a curse to economic growth?. J. Stat. Inf. 36 (11), 95–106.
Li, B., Tian, C., Shi, Z. Y., and Han, Z. L. (2020 2020). Evolution and differentiation of high-quality development of marine economy: A case study from China. 5624961. doi:10.1155/2020/5624961Complexity.
Li, Q., Guo, Q., Zhou, M., Xia, Q., and Quan, M. Q. (2022). Analysis on the mechanism and influencing factors of the coordinated development of economy and environment in China's resource-based cities. Sustainability 14 (5), 2929. doi:10.3390/su14052929
Li, X. S., Lu, Y. L., and Huang, R. T. (2021). Whether foreign direct investment can promote high-quality economic development under environmental regulation: Evidence from the Yangtze river economic Belt, China. Environ. Sci. Pollut. Res. 28 (17), 21674–21683. doi:10.1007/s11356-020-12032-z
Liao, M. L., Chen, Y., Wang, Y. J., and Lin, M. S. (2019). Study on the coupling and coordination degree of high-quality economic development and ecological environmet in beijing-tianjin-hebei region. Appl. Ecol. Environ. Res. 17 (5), 11069–11083. doi:10.15666/aeer/1705_1106911083
Liao, S. J., Wu, Y., Wong, S. W., and Shen, L. Y. (2020). Provincial perspective analysis on the coordination between urbanization growth and resource environment carrying capacity (RECC) in China. Sci. Total Environ. 730, 138964. doi:10.1016/j.scitotenv.2020.138964
Liu, M., and Hu, H. H. (2021). Carbon emissions, consumption structure upgrading, and high-quality economic development: Empirical evidence from China. J. Asia Pac. Econ., 1–23. doi:10.1080/13547860.2021.2008099
Long, H. Y., Lin, B. Q., Ou, Y. T., and Chen, Q. (2019). Spatio-temporal analysis of driving factors of water resources consumption in China. Sci. Total Environ. 690, 1321–1330. doi:10.1016/j.scitotenv.2019.06.311
Ma, X. W., and Xu, J. W. (2022). Impact of environmental regulation on high-quality economic development. Front. Environ. Sci. 10. doi:10.3389/fenvs.2022.896892
Meng, F. (2021). The impact of water resources and environmental improvement on the development of sustainable ecotourism. Desalin. Water Treat. 219, 40–50. doi:10.5004/dwt.2021.26840
Nasrollahi, Z., Hashemi, M. S., Bameri, S., and Taghvaee, V. M. (2020). Environmental pollution, economic growth, population, industrialization, and technology in weak and strong sustainability: Using STIRPAT model. Environ. Dev. Sustain. 22 (2), 1105–1122. doi:10.1007/s10668-018-0237-5
Pan, Y. C., Li, M., Tang, H., Wu, Y. W., and Yang, Z. J. (2021). Land use transitions under rapid urbanization in chengdu-chongqing region: A perspective of coupling water and land resources. Land 10 (8), 812. doi:10.3390/land10080812
Song, M., Hao, X. G., Zhang, L. Y., Song, M. R., Cheng, J. R., Li, D. D., et al. (2022). Transformation performance and subsystem coupling of resource-based cities in China: An analysis based on the support-pressure framework. Integr. Environ. Assess. Manag. 18 (3), 770–783. doi:10.1002/ieam.4502
Sun, Q., Zhang, X. H., Zhang, H. W., and Niu, H. P. (2018). Coordinated development of a coupled social economy and resource environment system: A case study in Henan Province, China. Environ. Dev. and Sustain. 20 (3), 1385–1404. doi:10.1007/s10668-017-9926-8
Tan, S. K., Liu, Q., and Han, S. Y. (2022). Spatial-temporal evolution of coupling relationship between land development intensity and resources environment carrying capacity in China. J. Environ. Manag. 301, 113778. doi:10.1016/j.jenvman.2021.113778
Wan, J. J., Li, Y. X., Ma, C. C., Jiang, T., Su, Y., Zhang, L. Q., et al. (2021). Measurement of coupling coordination degree and spatio-temporal characteristics of the social economy and ecological environment in the chengdu-chongqing urban agglomeration under high-quality development. Int. J. Environ. Res. Public Health 18 (21), 11629. doi:10.3390/ijerph182111629
Wang, A. Y., Liao, X. Y., Tong, Z. J., Du, W. L., Zhang, J. Q., Liu, X. P., et al. (2022a 108548). Spatiotemporal variation of ecological carrying capacity in Dongliao River Basin, China. Ecol. Indic. 135, 108548. doi:10.1016/j.ecolind.2022.108548
Wang, J. K., Han, Q., Wu, K. X., Xu, Z. T., and Liu, P. (2022b). Spatial-temporal patterns and evolution characteristics of the coordinated development of industrial economy, natural resources and environment in China. Resour. Policy 75, 102463. doi:10.1016/j.resourpol.2021.102463
Wang, Q. S., Xu, Z. P., Yuan, Q., Yuan, X. L., Zuo, J., Song, Y. Z., et al. (2020). Evaluation and countermeasures of sustainable development for urbanenergy-economy-environmentsystem: A case study of jinan in China. Sustain. Dev. 28 (6), 1663–1677. doi:10.1002/sd.2115
Wang, R., Cheng, J. H., Zhu, Y. L., and Lu, P. X. (2017). Evaluation on the coupling coordination of resources and environment carrying capacity in Chinese mining economic zones. Resour. Policy 53, 20–25. doi:10.1016/j.resourpol.2017.05.012
Wang, X., and Li, F. (2019). National food security, high-quality economic development and water resources bearing capacity. Price theory Pract. 1, 22–26. doi:10.19851/j.cnki.cn11-1010/f.2019.01.006
Wu, Y., Zong, T., Shuai, C. Y., Liao, S. J., Jiao, L. D., and Shen, L. Y. (2022). Does resource environment carrying capacity have a coercive effect on urbanization quality? Evidence from the Yangtze river economic Belt, China. J. Clean. Prod. 365, 132612. doi:10.1016/j.jclepro.2022.132612
Xiao, H., and Wen, Z. (2021). Logical connotation of high-quality coordinated development of economy, energy and environment in the new ear. China Price 6, 9–11.
Xu, W., Yi, J. H., and Cheng, J. H. (2022). The heterogeneity of high-quality economic development in China's mining cities: A meta frontier function. Int. J. Environ. Res. Public Health 19 (11), 6374. doi:10.3390/ijerph19116374
Yang, B., Wang, Z. Q., Zou, L., Zou, L. L., and Zhang, H. W. (2021). Exploring the eco-efficiency of cultivated land utilization and its influencing factors in China's Yangtze River Economic Belt, 2001-2018. J. Environ. Manag. 294, 112939. doi:10.1016/j.jenvman.2021.112939
Yang, J. F., Lei, K., Khu, S., Meng, W., and Qiao, F. (2015). Assessment of water environmental carrying capacity for sustainable development using a coupled system dynamics approach applied to the Tieling of the Liao River Basin, China. Environ. Earth Sci. 73 (9), 5173–5183. doi:10.1007/s12665-015-4230-0
Yang, S. P., Chen, Z. L., Umar, M., and Khursheed, A. (2022). Environmental regulation and high-quality sustainable development of China's economy - an empirical study based on a spatial durbin model and threshold model. Econ. Research-Ekonomska Istraz. 35, 5699–5718. doi:10.1080/1331677x.2022.2035243
Yang, X. Z., Zhang, Z. F., Luo, W., Tang, Z., Gao, X., Wan, Z. C., et al. (2019). The impact of government role on high-quality innovation development in mainland China. Sustainability 11 (20), 5780. doi:10.3390/su11205780
Yu, Z., and Di, Q. (2020 109192). The coordination between maritime economies and marine carrying capacity and their spatiotemporal evolution in the cities of the bohai rim in China. Ecol. Model. 438, 109192. doi:10.1016/j.ecolmodel.2020.109192
Zhang, F., Ju, S. B., Chan, N. W., Ariken, M., Tan, M. L., Yushanjiang, A., et al. (2022a). Coupled analysis of new urbanization quality (NUQ) and eco-environmental carrying capacity (EECC) of prefecture-level and above cities in China during 2003-2016. Environ. Dev. Sustain. 24 (6), 8008–8038. doi:10.1007/s10668-021-01771-9
Zhang, F., Wang, Y., Ma, X. J., Wang, Y., Yang, G. C., and Zhu, L. (2019). Evaluation of resources and environmental carrying capacity of 36 large cities in China based on a support-pressure coupling mechanism. Sci. Total Environ. 688, 838–854. doi:10.1016/j.scitotenv.2019.06.247
Zhang, J. X., Zhang, N., and Bai, S. X. (2021). Assessing the carbon emission changing for sustainability and high-quality economic development, 22. Environmental Technology & Innovation. 101464. doi:10.1016/j.eti.2021.101464
Zhang, Z. Y., Hu, Z. N., Zhong, F. L., Cheng, Q. P., and Wu, M. Z. (2022b). Spatio-temporal evolution and influencing factors of high quality development in the yunnan-guizhou, region based on the perspective of a beautiful China and SDGs. Land 11 (6), 821. doi:10.3390/land11060821
Zhong, J., Zhou, X., and Li, W. (2021). Coupling and coordination between high quality development and sustainable land resource utilization in Guangxi Zhuang autonomus region. Bull. Soil Water Conservation 41 (3), 247–257. doi:10.13961/j.cnki.stbctb.2021.03.033
Zhu, H., Zhu, J. S., and Zou, Q. (2020). Comprehensive analysis of coordination relationship between water resources environment and high-quality economic development in urban agglomeration in the middle reaches of Yangtze river. Water 12 (5), 1301. doi:10.3390/w12051301
Keywords: resource and environmental carrying capability, high-quality development, coupling degree, kernel density estimation, spatial-temporal characteristics
Citation: Li Z, Chen Y, Zhang L, Wang W and Wu J (2022) Coupling coordination and spatial-temporal characteristics of resource and environmental carrying capacity and high-quality development. Front. Environ. Sci. 10:971508. doi: 10.3389/fenvs.2022.971508
Received: 17 June 2022; Accepted: 03 November 2022;
Published: 18 November 2022.
Edited by:
Jiashuo Li, Shandong University, ChinaReviewed by:
Liang Yuan, China Three Gorges University, ChinaCopyright © 2022 Li, Chen, Zhang, Wang and Wu. This is an open-access article distributed under the terms of the Creative Commons Attribution License (CC BY). The use, distribution or reproduction in other forums is permitted, provided the original author(s) and the copyright owner(s) are credited and that the original publication in this journal is cited, in accordance with accepted academic practice. No use, distribution or reproduction is permitted which does not comply with these terms.
*Correspondence: Jie Wu, d2pfNzEzQDEyNi5jb20=
Disclaimer: All claims expressed in this article are solely those of the authors and do not necessarily represent those of their affiliated organizations, or those of the publisher, the editors and the reviewers. Any product that may be evaluated in this article or claim that may be made by its manufacturer is not guaranteed or endorsed by the publisher.
Research integrity at Frontiers
Learn more about the work of our research integrity team to safeguard the quality of each article we publish.