 Aaron E. Lee
 Cherry Chiu
 Aurelne Thian
 Brittany Suann
 Shelley Gorman
94% of researchers rate our articles as excellent or good
Learn more about the work of our research integrity team to safeguard the quality of each article we publish.
Find out more
BRIEF RESEARCH REPORT article
Front. Environ. Sci., 09 November 2022
Sec. Atmosphere and Climate
Volume 10 - 2022 | https://doi.org/10.3389/fenvs.2022.970658
Type-2 diabetes is a leading cause of death and disability. Emerging evidence suggests that ultraviolet radiation or sun exposure may limit its development. We used freely available online datasets to evaluate the associations between solar radiation and type-2 diabetes prevalence across Australia. We extracted prevalence data for 1822 postcodes from the Australian Diabetes Map on 25 January 2020. Daily solar radiation data averaged over 30-years (1990–2019) were collated from online databases (Australian Bureau of Meteorology). Population-weighted linear regression models were adjusted for covariates at the postcode level including socioeconomic status (IRSAD), remoteness, mean age, gender, Aboriginal and Torres Strait Islander status, as well as mean annual ambient temperature (1961–1990) and rainfall (1981–2010). A consistent inverse correlation was observed between type-2 diabetes prevalence and solar radiation, after adjusting for these covariates (ß (coefficient of regression) = −0.045; 95% CI: −0.086, −0.0051; p = 0.027). However, the relative contribution of solar radiation towards type-2 diabetes prevalence was small (2.1%) in this model. Other significant correlations between type-2 diabetes prevalence and covariates included: socioeconomic status (ß = −0.017; 95% CI: −0.017, −0.016; p < 0.001), mean age (ß = 0.041; 95% CI: 0.028, 0.054; p < 0.015), remoteness (ß = −0.05; 95% CI: −0.088, −0.011; p < 0.001) and rainfall (ß = −0.0008; 95% CI: −0.00097, −0.00067; p < 0.001). In conclusion, in Australian postcodes, higher levels of solar radiation and rainfall was associated with reduced type-2 diabetes prevalence. Further studies are needed that consider lifestyle covariates such as physical activity.
Type-2 diabetes is characterized by an inability of the body to make and use insulin, resulting in elevated blood glucose levels and potentially microvascular (e.g., retinopathy) and macrovascular (e.g., heart disease) complications (Chatterjee et al., 2017). In 2017, type-2 diabetes afflicted 6.3% of the world’s population and was the ninth leading cause of death (Khan et al., 2020). The economic burden of this disease is estimated to rise from 1.8% (in 2015) to 2.2% of global GDP by 2030 (Bommer et al., 2018). Environmental, lifestyle and genetic factors contribute towards the development of type-2 diabetes (Grarup et al., 2014; Ley et al., 2014; Hu et al., 2018; Lao et al., 2019). Current interventions include a focus on diet and physical activity, and anti-diabetic medications (Buse et al., 2020). While these medications are often effective, over-reliance causes concerning side effects (Chaudhury et al., 2017). Therefore, new non-pharmacological methods of preventing and treating type-2 diabetes, that complement current approaches, could be highly beneficial.
There is some evidence that exposure to ultraviolet radiation (UVR) or sunlight may limit the development of type-2 diabetes, potentially through beneficial mediators such as vitamin D (Pilz et al., 2013; Gorman, 2020). In human observational studies, higher serum 25-hydroxyvitamin D levels are associated with reduced incidence of type-2 diabetes (Pittas et al., 2020). Similarly, vitamin D supplementation may reduce the incidence of type-2 diabetes in prediabetic patients (Dawson-Hughes et al., 2020). However, findings are likely limited to specific subgroups including people who do not have obesity, or participants supplemented with specific doses of vitamin D (Barbarawi et al., 2020; Zhang et al., 2020). In addition to vitamin D, there are other beneficial mediators produced by sun exposure that could limit the development of type-2 diabetes, such as nitric oxide (Gorman, 2020).
In animal modelling studies in which mice were fed a high fat diet, ongoing exposure to low (non-burning) doses of UVR slowed the development of type-2 diabetes through nitric oxide-mediated pathways (Geldenhuys et al., 2014; Fleury et al., 2017; Dhamrait et al., 2020). However, there have been mixed findings from human observational studies and clinical trials investigating the effects of exposure to UVR on clinical biomarkers of type-2 diabetes (Gorman et al., 2019). In an 11-year prospective cohort study (n = 24,098), the prevalence of type-2 diabetes was ∼30% lower in Swedish women with active sun exposure habits, after adjusting for physical activity levels (Lindqvist et al., 2010). Conversely, in a cross-sectional study (n = 17,476), older Korean adults with >5 h of daily sun exposure were more likely to develop type-2 diabetes than adults with <2 h of daily sun exposure (Ohn et al., 2014). These studies have used self-reported sun behavior data, and not more objective measurements of sun exposure such as measurement of local ambient levels of UVR via ground or satellite instrumentation. In addition, it may be important to adjust for other environmental covariates, such as temperature, which may adversely affect type-2 diabetes incidence/prevalence (Blauw et al., 2017; Beulens et al., 2022).
In this study, we used freely available online data to investigate the relationship between solar radiation and type-2 diabetes in Australia, adjusting for demographic, socioeconomic, and environmental factors (i.e., temperature and rainfall). Using data-scraping methods, we obtained type-2 prevalence data from the Australian Diabetes Map (coordinated by the National Diabetes Services Scheme, NDSS) for Australian postcodes in January 2020. We hypothesized that the prevalence of type-2 diabetes would decrease with increasing solar radiation, after adjusting for important covariates (including, socioeconomic status, remoteness, and temperature).
In this cross-sectional study, we used data-scraping methods to collect data from the Australian Diabetes Map, specifically type-2 diabetes prevalence in Australian postcodes (NDSS, 2022). These are geographical areas used for mail-sorting purposes with median population of 7291 persons, and area of 125 km2. Data-scraping is the use of a computer program to automate extraction of data. It is commonly achieved through accessing online sources (Glez-Peña et al., 2014). Deidentified diabetes prevalence is reported in the Australian Diabetes Map via data imputed from the NDSS Registrant Database at up to the postcode level and can be freely accessed online (NDSS, 2022). This database is an Australian Government initiative, has collected information since 1987, and is estimated to capture 80–90% of Australians with diabetes (Australian Institute of Health and Welfare, 2009). Approximately 1.18 million Australians with type-2 diabetes were registered with the NDSS at the time of this study (NDSS, 2020).
Type-2 diabetes prevalence (the outcome variable) was collected from the Australian Diabetes Map webpage (NDSS, 2022) for each postcode via data-scraping methods on 25 January 2020 (prior to declaration of the COVID-19 pandemic). Other linked covariate data were also collected from the Australian Diabetes Map by postcode, including mean age, percentage of people of male gender, percentage of Aboriginal and Torres Strait Islander people and the Index of Relative Socioeconomic Advantage and Disadvantage (IRSAD). This was done using a script written in R that collected data for individuals with type-2 diabetes only (and not other types of diabetes), compiled into a data frame for each Australian postcode. For privacy reasons, postcodes are omitted from the Australian Diabetes Map by the NDSS that have small population sizes (n < 100) or few individuals with type-2 diabetes (n < 20). Registrant counts are also rounded to the nearest 10. Postcodes were excluded from our analyses if type-2 diabetes prevalence or other covariate data were missing. The total population size of each postcode was collected to allow for population-weighted analysis. Prevalence data are reported as percentages of the total population for each postcode.
Daily solar radiation levels are the amount of solar energy (including ultraviolet, visible, and infrared forms) that is detected on a horizontal surface over 1 day (measured in megajoules per square meter, MJ/m2). Solar radiation is representative of the total solar energy to which individuals are exposed to in natural settings and generally increases with proximity to the equator. Australian postcodes encompass regions across a range of latitudes (∼33°; from 10˚41′ to 43˚38′ S) which receive varying levels of solar radiation. Solar radiation data was derived from satellite imagery processed by the Australian Bureau of Meteorology (ABM) collected from a sequence of satellites (i.e., GMS-4, GMS-5, GOES-9, MTSAT-1R, MTSAT-2, and Himawari-8), from which irradiance is calculated and converted into daily solar radiation (ABM, 2022). This model has a horizontal resolution of 0.05° in longitude and latitude (approximately 5 km), and readings are routinely validated by ground instrumentation, and so this model accounts for atmospheric and meteorological influences on terrestrial levels of solar radiation (e.g., cloud cover, water vapour). For this study, mean daily solar radiation levels were averaged over a 30-year period from 1990 to 2019 for central geographical coordinate of each postcode (Australian Bureau of Statistics, 2016a). This 30-year period was selected because: 1) diagnosis of type-2 diabetes commonly occurs later in life (i.e., median age is 58.3 years in Australia (Huo et al., 2018); 2) our animal modelling studies suggest that ongoing exposure to UVR over a period of time is required to limit development of type-2 diabetes (Geldenhuys et al., 2014; Fleury et al., 2017; Dhamrait et al., 2020); and 3) the earliest year for which the ABM has collected these solar radiation data was 1990.
Solar radiation levels are significantly correlated with other weather variables, particularly mean ambient temperature (Shrestha et al., 2019) and rainfall (Díaz-Torres et al., 2017). To isolate the relationship between solar radiation and type-2 diabetes from these covariates, mean yearly data for ambient temperature (in degrees, 1961–1990) and rainfall (in millimeters, 1981–2010) were obtained (ABM, 2021) for 30-year periods across Australian postcodes. Ambient temperature and rainfall datasets contain data that correspond to geographical coordinates spaced at 0.025° per 2.5 km and 0.01° per 1 km intervals, respectively. As for solar radiation, mean daily temperature or rainfall data for the central geographical coordinate of each postcode were averaged over each 30-year period. The ambient temperature dataset of Australian postcodes (1961–1990) was used, as this is the current standard reference period used to compare weather between different countries and is internationally recognized by the World Meteorological Organization as the standard reference period for temperature (ABM, 2009).
We also attempted to obtain temperature and rainfall data that aligned with the same time periods as for solar radiation (1990–2019). However, these were not available at the postcode level from the ABM website, with other previously constructed postcode-level online datasets no longer accessible (Hanigan, 2018). There was no missing data for weather variables for any postcode. However, an important assumption of these analyses was that we could not control for movement of individuals to new residences in postcodes with differing environmental conditions.
Demographic data for each postcode was obtained on 25 January 2020, from the Australian Diabetes Map (i.e., mean age, percentage of people of male gender, percentage of Aboriginal and Torres Strait Islander people and IRSAD) during download of type-2 diabetes prevalence data. These data were constructed by the NDSS based on projections of data acquired during the 2016 Australian Bureau of Statistics Census of Population and Housing (Australian Bureau of Statistics, 2016b). IRSAD ranges in values from 400 to 1239 and is an ordinal score/rank used to compare socioeconomic status (SES) based on principal component analysis of 31 variables assessing income, education, employment, occupation, housing and other (Pink, 2013). Postcodes with higher IRSAD are more socioeconomically advantaged. For remoteness (distance from major population centers), the Modified Monash Model (MMM) score was used to categorize postcodes ranging from 1 to 7 (with 7 being the most remote areas) (Australian Government Department of Health, 2019). The MMM score is specific to Australia and closely reflects access to healthcare (Versace et al., 2021). These demographic covariates were selected as they all have previously been implicated as important modulatory factors in the development of type-2 diabetes (Anderson et al., 2015; Ding et al., 2015; Morton et al., 2021).
All statistical analyses were performed using R (Foundation for Statistical Computing, Vienna, Austria; version 4.0.3; 10 October 2020). To assess the nature of missing data from the Australian Diabetes Map, variables collected for all Australian postcodes (n = 2467) were compared with postcodes which had no missing data (i.e., with complete entries, n = 1822) using Welch’s t-test (data are shown as mean ± SD). Three linear regression models were then performed using the dataset with complete entries (i.e., for n = 1822 postcodes). Simple linear regression with Pearson’s correlation coefficient was performed between type-2 diabetes prevalence and solar radiation as well as with each covariate for model 1 (unadjusted for covariates). Two multiple linear regression models were then used to determine the nature of the associations between solar radiation and type-2 diabetes prevalence in Australian postcodes with adjustment for covariates. Model 2 included adjustments for demographic covariates specifically: age, male gender, Aboriginal and Torres Strait Islander status, SES (IRSAD) and remoteness (MMM score). Model 3 included adjustments for demographic covariates of model 2, and weather covariates (temperature and rainfall). All models included further weighting adjustments to account for the variation in postcode population sizes. Relative weights analyses were done to estimate the likely contributions of each variable towards the regression models (Tonidandel et al., 2009). p values were considered significant if less than 0.05: ß (beta) denotes regression coefficients, while 95% CI refers to 95% confidence intervals.
During assessment of multicollinearity, a strong association was detected between solar radiation and temperature (r = 0.79). However, collinearity was deemed to not to be an issue as the calculated variance inflation factor between solar radiation and temperature was 2.64, below an acceptable “cutoff” value of 5 (Salmerón Gómez et al., 2016). Each model was accessed for homoscedasticity by inspection of Residuals vs. Fitted value plots, and Scale-Location plots. A normal distribution of residuals was confirmed by inspection of QQ-plots. Both models 2 and 3 satisfied these assumptions of multivariable linear models and no influential outlier postcodes were detected (see Supplementary Figures S1, S2 in Supplementary Materials).
In a sensitivity analysis, postcodes were evenly divided into 2 groups according to IRSAD, with one group containing postcodes with the top 50% of IRSAD values and the second group containing postcodes with the bottom 50% of IRSAD values. Model 3 was fitted and compared for each group to assess whether the associations observed with the complete dataset could be reproduced. Ad-hoc adjustments such as the Bonferroni correction were not performed due to the risk of increasing type-2 errors and because these are not necessary in multivariate models in which there has been careful selection of predictor variables, and where a universal null hypothesis is not of interest (as was this case in this study) (Armstrong, 2014; Dmitrienko and D’Agostino, 2018; Perneger, 1998; Perrett et al., 2006; Rothman, 1990).
Data for a total of 2467 postcodes were scraped from the Australian Diabetes Map (NDSS) on 25 January 2020. After postcodes with incomplete data were removed, 1822 postcodes remained. These postcodes were composed of ∼51% men, with a mean age of 40.6 years (Table 1). The prevalence of type-2 diabetes was 5.6 ± 2.0% (mean ± SD). Across the 1822 postcodes with no missing data, daily solar radiation levels were 20.7 ± 2.4 MJ/m2 (mean ± SD, Table 1). Mean daily solar radiation levels are generally highest in north-western Australia and lowest in southern Tasmania (Figure 1). There was no statistically significant effect of removing postcodes with incomplete data on population size, percentage of people with Aboriginal and Torres Strait Islander status, SES (IRSAD), remoteness (MMM score), solar radiation, temperature, and rainfall (Table 1); however, there were small but statistically significant reductions in the percentage of males (−0.3%, p < 0.001) and mean age (−0.3 years, p = 0.01).
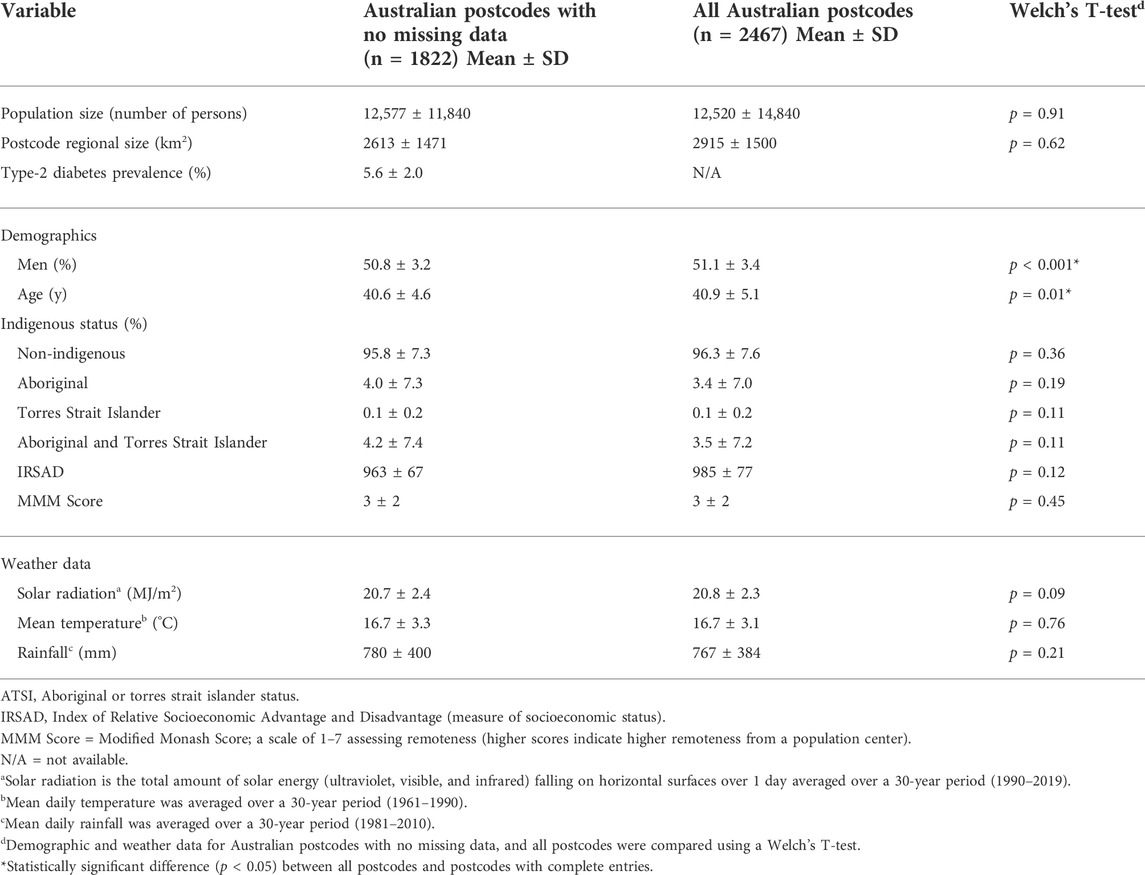
TABLE 1. Summary of population demographic and weather data across Australian postcodes. Data were scraped from the Australian Diabetes Map (National Diabetes Services Scheme) on the 25 January 2020. These were supplemented with data downloaded from Australian Bureau of Statistics and Bureau of Meteorology. The total number of Australian postcodes was 2467, and after removal of postcodes with missing data this reduced to 1822.
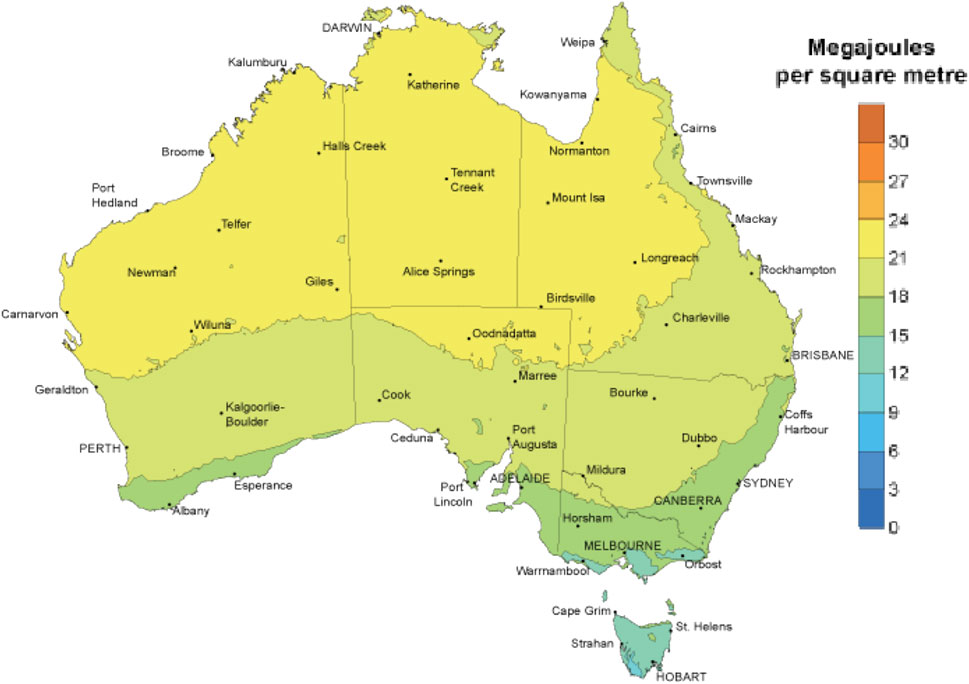
FIGURE 1. Geographical variation in mean daily solar radiation (MJ/m2) across Australia. The colour scale shows areas of lowest solar radiation in dark blue, highest in red and in between in green. This map was obtained from the Australian Bureau of Meteorology website (ABM, 2021), with modification. This image is licenced under the Creative Commons Attribution Australia.
Outcomes of the three fitted linear models for solar radiation are depicted in Table 2. In model 1 (unadjusted), type-2 diabetes prevalence positively associated with solar radiation (ß = 0.071; 95% CI: 0.04, 0.10; p < 0.001). However, this association was reversed when demographic covariates were included in model 2, such that type-2 diabetes prevalence was lower with higher levels of solar radiation (ß = −0.029; 95% CI: −0.052, −0.0054; p = 0.016). Similar inverse associations of solar radiation and type-2 diabetes prevalence (ß = −0.045; 95% CI: −0.086, −0.0051; p = 0.027) persisted when temperature and rainfall were included in model 3 (Table 2) and in sensitivity analyses (Table 3) in which postcodes of higher IRSAD (i.e., top 50%, group 1, ß = −0.085; 95% CI: −0.15, −0.019, p = 0.011), and lower IRSAD (i.e., bottom 50%, group 2, ß = −0.21; 95% CI: −0.32, −0.10, p < 0.001) were examined separately.
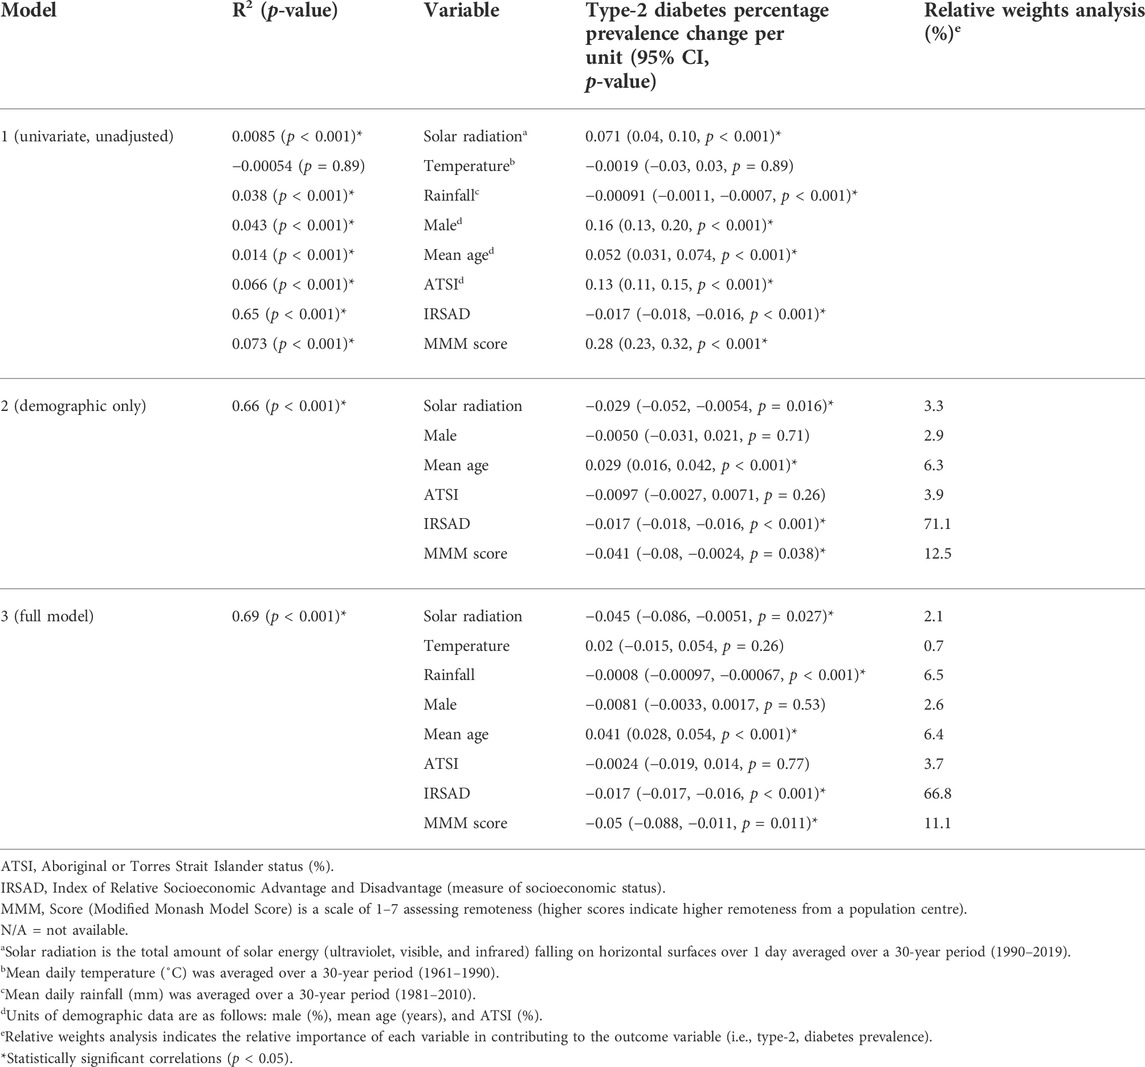
TABLE 2. Relationship between type-2 diabetes prevalence and solar radiation across three linear models for data scraped from the Australian Diabetes Map (National Diabetes Services Scheme) on 25 January 2020 for 1822 postcodes. In model 1, simple linear regressions between each covariate and type-2 diabetes prevalence with no adjustment for confounding variables is reported. Models 2 and 3 are multivariable linear regressions. In model 2, there was adjustment for demographic variables (age, gender, Aboriginal and Torres Strait Islander status, socioeconomic status, and remoteness). In model 3, additional adjustments were made for ambient temperature and rainfall, along with demographic variables (of model 2).
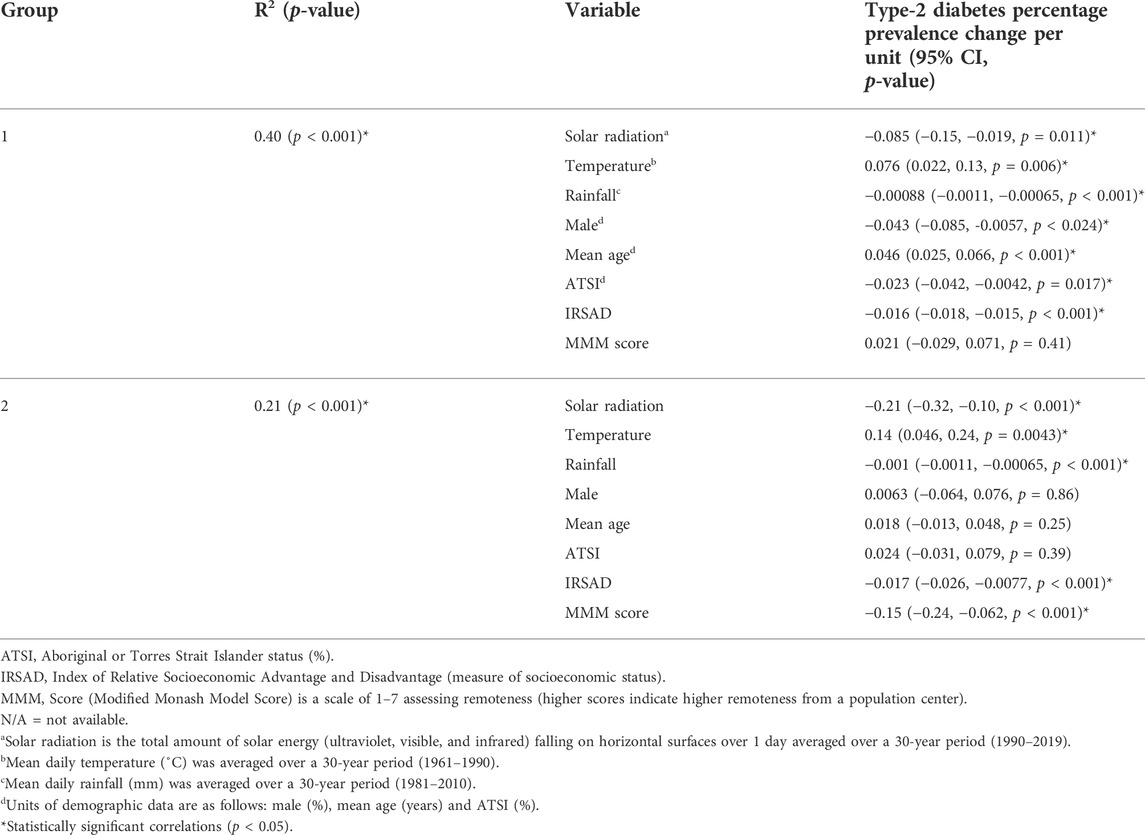
TABLE 3. Sensitivity analysis of multivariable regression between type-2 diabetes prevalence and solar radiation with adjustment for demographic and weather covariates (temperature, rainfall, gender, mean age, Aboriginal or Torres Strait Islander status, socioeconomic status, and remoteness) for data scraped from the Australian Diabetes Map (National Diabetes Services Scheme) on 25 January 2020, for 1822 postcodes. Group 1 includes postcodes with higher IRSAD scores (i.e., top 50%, n = 911 postcodes), while group 2 with lower IRSAD scores (i.e., bottom 50%, n = 911 postcodes).
As expected, significant inverse associations for IRSAD and type-2 diabetes prevalence were observed, with minimal variation in the regression coefficient across all models (i.e., Model 1 and 2 ß = −0.017; 95% CI: −0.018, −0.016; model 3 ß = −0.017; 95% CI: −0.017, −0.016). This was also reproduced in the sensitivity analysis (Table 3). Similarly, mean age was positively associated with type-2 diabetes prevalence in all models. Both rainfall (ß = −0.0008; 95% CI: −0.00097, −0.00067; p < 0.001), and MMM scores (remoteness, ß = −0.05; 95% CI: −0.088, −0.011; p < 0.011) were negatively associated with type-2 diabetes prevalence in model 3. However, no significant associations of Aboriginal and Torres Strait Islander status nor temperature, and type-2 diabetes prevalence were observed in model 3 (Table 2). R2 values for Models 1, 2, and 3 were 0.0085, 0.66, and 0.69, respectively. Hence 31% of variability in model 3 was still unaccounted for by the included covariates. A relative weights analysis of model 3 identified that the SES measure, IRSAD to be of greatest relative importance (66.8%), followed by remoteness (MMM score, 11.1%), rainfall (6.5%) and mean age (6.4%), while solar radiation contributed towards only 2.1% of this model.
We observed an inverse correlation between solar radiation and type-2 diabetes prevalence in 1822 Australian postcodes, after accounting for selected demographic and weather covariates. There was a −0.045% change in type-2 diabetes population prevalence per 1 MJ/m2 increase in daily solar radiation, suggesting that residents of postcodes with higher solar radiation have a decreased risk of developing type-2 diabetes. This translates to a 0.62% absolute decrease in type-2 diabetes prevalence when comparing the postcode with the highest solar radiation (27.4 MJ/m2) to the postcode with the lowest solar radiation (13.7 MJ/m2). Sensitivity analyses reproduced this association. As solar radiation includes visible, ultraviolet, and infrared radiation, we could not isolate the relationship between UVR and type-2 diabetes prevalence. Solar radiation contributed a modest amount (i.e., 2.1%) of the variability in type-2 diabetes prevalence, while the relative contributions of SES (IRSAD), remoteness (MMM score) and rainfall were 67%, 11%, and 6.5%, respectively. Approximately 31% of the variability in type-2 diabetes prevalence was unaccounted for in our modelling. Therefore, the significant inverse association observed between solar radiation and type-2 diabetes prevalence could be due to unaccounted factors, such as physical activity levels or dietary habits.
Various biological mechanisms have been proposed to explain any potential benefits of sun exposure in preventing type-2 diabetes. The active form of vitamin D, calcitriol, may have a role in pancreatic beta cell physiology and exhibits anti-inflammatory effects through calcium-mediated pathways (Pilz et al., 2013). Findings of our animal modelling studies suggest that ongoing exposure to low-doses of UVR prevented signs of type-2 diabetes and tissue fat accumulation in mice fed a high-fat diet through the release of nitric oxide from skin (Geldenhuys et al., 2014; Fleury et al., 2017; Dhamrait et al., 2020). Other possible beneficial mediators could include α-melanocyte-stimulating hormone, which increases in the blood of mice exposed to UVA radiation (Skobowiat and Slominski, 2016), and can suppress appetite, and enhance catabolism (Wardlaw, 2011).
We also observed significant inverse associations between mean annual rainfall and type-2 diabetes prevalence. There have been few studies investigating how rainfall may modulate the development of type-2 diabetes, although higher “diabetes hospitalization admission rates” were observed during the rainy season in Cameroon (Lontchi-Yimagou et al., 2016). It is tempting to speculate that the protective effects of rainfall (and solar radiation) suggested in our findings may be linked with local production of fruit and vegetables or the availability of green space for physical activity. There could also be underlying climate factors that determine rainfall patterns, which might explain the significant inverse association observed between rainfall and type-2 diabetes. Further research is warranted. The non-significant association between ambient temperature and type-2 diabetes prevalence we observed is not consistent with findings of other researchers, who have observed positive associations (Speakman and Heidari-Bakavoli, 2016; Blauw et al., 2017). Notably, there were substantial differences in the approaches of these studies to our own, including: a consideration of obesity (Speakman and Heidari-Bakavoli, 2016); or the examination of associations at a state and country level (Blauw et al., 2017).
We identified the SES measure IRSAD as the most important variable in determining type-2 diabetes prevalence across Australian postcodes. A −0.017% change in type-2 diabetes prevalence per unit change in IRSAD would translate into an 8.7% decrease in absolute type-2 diabetes prevalence from the postcode with the lowest to the postcode with the highest IRSAD score. These finding are like other findings of type-2 diabetes prevalence in Australia related to SES (2011–12), with rates in the lowest SES group three times that of the highest SES group (Australian Institute of Health and Welfare, 2014). Similar findings have also been observed in multiple studies done in other countries (Maier et al., 2013; Hwang and Shon, 2014; Stringhini et al., 2016). We also observed negative associations between remoteness (MMM score) and type-2 diabetes in adjusted models. Other researchers have hypothesized that when the effects of SES are removed, certain factors in remote areas might be protective for type-2 diabetes (e.g., more active lifestyles and healthier diets) (Juul et al., 2018). However, whether these findings are relevant in Australian settings is uncertain, as remote geographical and SES disadvantaged areas of Australia are more likely to have less supportive food and physical activity environments (Darcy et al., 2022).
Strengths of our study include the novel data-scraping approach, large sample size of Australian postcodes, and inclusion of demographic and weather covariates to examine the associations between solar radiation and type-2 diabetes prevalence. Limitations include the issues around sourcing weather data across the same 30-year time increments, and the necessary assumption that residents had continuously lived in postcodes which defined their prior 30 years of sun exposure. We were also unable to consider how personal sun exposure behaviors varied between postcodes. Sun exposure (particularly summer “time-in-the-sun”) remains relatively constant over time for individuals living in different parts of Australia, although it decreases with age (Lucas et al., 2013). In addition, variations in physical inactivity levels were not considered in our modelling. While physical activity levels may be modulated by weather conditions (Aspvik et al., 2018), these are complex relationships which may also be dependent on age, air quality, fitness level, gender, green space, latitude, and other determinants of physical activity within varying exposomes (Brandon et al., 2009; Donaire-Gonzalez et al., 2019; Gorman et al., 2021). Findings of a recent systematic review likely reflect the complexity of these relationships, with only 3 of 5 identified studies reporting higher physical activity levels with longer sunlight duration (Zheng et al., 2021). A further limitation of our study includes how we were not able to account for undiagnosed type-2 diabetes, which is particularly high in remote Australian communities (Ngan et al., 2015) and may have resulted in an under-estimation of the effects of remoteness and Aboriginal and Torres Strait Islander status on type-2 diabetes prevalence.
In conclusion, we observed that living in areas with higher solar radiation was associated with a modest reduction in type-2 diabetes prevalence in Australia. As the medication burden on patients with type-2 diabetes is large, a multimodal approach to treatment that considers safe sun exposure could be beneficial. Even though the potential benefits of solar radiation on type-2 diabetes were relatively small, sun exposure could have important public health implications considering the expanding pre-diabetes population. Our findings point towards the need for further research on the associations between various weather variables and the development of type-2 diabetes, and consideration of possible confounding by lifestyle factors such as physical activity.
The datasets presented in the study can be found at: https://doi.org/10.6084/m9.figshare.20113856.v1.
Conceptualization, SG, AL, CC, AT, and BS; methodology, SG, AL, CC, AT, and BS; formal analysis, AL, CC; data curation, AL, CC, AT, and BS; writing—original draft preparation, AL, CC; writing—review and editing, SG, AL, CC, AT, and BS; supervision, SG; project administration, SG All authors have read and agreed to the published version of the manuscript.
SG was funded by an Al and Val Rosenstrauss Research Fellowship from the Rebecca L. Cooper Foundation. This funder was not involved in the design of the study; the collection, analysis, and interpretation of data; the writing of the report; or the decision to submit the report for publication.
Thank-you to Paul Stevenson (Biostatistics, Telethon Kids Institute) for providing advice on statistical analyses.
The authors declare that the research was conducted in the absence of any commercial or financial relationships that could be construed as a potential conflict of interest.
The reviewer RW declared a past co-authorship with the author SG to the handling editor.
All claims expressed in this article are solely those of the authors and do not necessarily represent those of their affiliated organizations, or those of the publisher, the editors and the reviewers. Any product that may be evaluated in this article, or claim that may be made by its manufacturer, is not guaranteed or endorsed by the publisher.
The Supplementary Material for this article can be found online at: https://www.frontiersin.org/articles/10.3389/fenvs.2022.970658/full#supplementary-material
ABM, Australian Bureau of Meteorology; IRSAD, Index of Socioeconomic Advantage and Disadvantage; MMM, Modified Monash Model; NDSS, National Diabetes Services Scheme; SES, socioeconomic status; UVR, ultraviolet radiation.
Anderson, D., Cordell, H. J., Fakiola, M., Francis, R. W., Syn, G., Scaman, E. S. H., et al. (2015). First genome-wide association study in an Australian Aboriginal population provides insights into genetic risk factors for body mass index and type 2 diabetes. Plos One 10 (3), e0119333. doi:10.1371/journal.pone.0119333
Armstrong, R. (2014). When to use the Bonferroni correction. Ophthalmic Physiol. Opt. 34 (5), 502–508. doi:10.1111/opo.12131
Aspvik, N. P., Viken, H., Ingebrigtsen, J. E., Zisko, N., Mehus, I., Wisløff, U., et al. (2018). Do weather changes influence physical activity level among older adults? - the generation 100 study. Plos One 13 (7), e0199463. doi:10.1371/journal.pone.0199463
Australian Bureau of Meterology (ABM) (2009). Periods used in climate maps and statistics. Available at: http://www.bom.gov.au/climate/how/newproducts/map-periods.shtml (Accessed June 16, 2022).
Australian Bureau of Meterology (ABM) (2021). Maps of average conditions. Available at: http://www.bom.gov.au/climate/averages/maps.shtml (Accessed June 16, 2022).
Australian Bureau of Meterology (ABM) (2022). Daily solar radiation model. Available at: http://www.bom.gov.au/climate/austmaps/about-solar-maps.shtml (Accessed June 16, 2022).
Australian Bureau of Statistics (2016a). Australian statistical geography standard. Geographic statistics. Available at: https://www.abs.gov.au/geography (Accessed June 16, 2022).
Australian Bureau of Statistics (2016b). 2071.0-Census of population and housing: Reflecting Australia-Stories from the census, 2016. Available at: https://www.abs.gov.au/ausstats/abs@.nsf/Lookup/by%20Subject/2071.0∼2016∼Main%20Features∼In%20this%20Issue∼1 (Accessed June 16, 2022).
Australian Government Department of Health (2019). Modified Monash model. Available at: https://www.health.gov.au/health-topics/rural-health-workforce/classifications/mmm (Accessed June 16, 2022).
Australian Institute of Health and Welfare (2009). Diabetes prevalence in Australia: An assessment of national data sources (CVD46). Available at: https://www.aihw.gov.au/reports/diabetes/diabetes-prevalence-australia-assessment/summary (Accessed June 16, 2022).
Australian Institute of Health and Welfare (2014). Australian facts: Prevalence and incidence. Series no. 2 CDK 2. (Canberra). Available at: https://www.aihw.gov.au/getmedia/0ce5f234-0abf-41b9-a392-be5dd1e94c54/17034.pdf.aspx?inline=true (Accessed June 16, 2022). Cardiovascular disease, diabetes and chronic kidney disease.
Barbarawi, M., Zayed, Y., Barbarawi, O., Bala, A., Alabdouh, A., Gakhal, I., et al. (2020). Effect of vitamin D supplementation on the incidence of diabetes mellitus. J. Clin. Endocrinol. Metab. 105 (8), 2857–2868. doi:10.1210/clinem/dgaa335
Beulens, J. W. J., Pinho, M. G. M., Abreu, T. C., den Braver, N. R., Lam, T. M., Huss, A., et al. (2022). Environmental risk factors of type 2 diabetes: An exposome approach. Diabetologia 65 (2), 263–274. doi:10.1007/s00125-021-05618-w
Blauw, L. L., Aziz, N. A., Tannemaat, M. R., Blauw, C. A., de Craen, A. J., Pijl, H., et al. (2017). Diabetes incidence and glucose intolerance prevalence increase with higher outdoor temperature. BMJ Open Diabetes Res. Care 5 (1), e000317. doi:10.1136/bmjdrc-2016-000317
Bommer, C., Sagalova, V., Heesemann, E., Manne-Goehler, J., Atun, R., Barnighausen, T., et al. (2018). Global economic burden of diabetes in adults: Projections from 2015 to 2030. Diabetes Care 41 (5), 963–970. doi:10.2337/dc17-1962
Brandon, C. A., Gill, D. P., Speechley, M., Gilliland, J., and Jones, G. R. (2009). Physical activity levels of older community-dwelling adults are influenced by summer weather variables. Appl. Physiol. Nutr. Metab. 34 (2), 182–190. doi:10.1139/h09-004
Buse, J. B., Wexler, D. J., Tsapas, A., Rossing, P., Mingrone, G., Mathieu, C., et al. (2020). 2019 update to: Management of hyperglycemia in type 2 diabetes, 2018. A consensus report by the American diabetes association (ada) and the European association for the study of diabetes (easd). Diabetes Care 63 (2), 487–493. doi:10.2337/dci19-0066
Chatterjee, S., Khunti, K., and Davies, M. J. (2017). Type 2 diabetes. Lancet 389 (10085), 2239–2251. doi:10.1016/S0140-6736(17)30058-2
Chaudhury, A., Duvoor, C., Reddy Dendi, V. S., Kraleti, S., Chada, A., Ravilla, R., et al. (2017). Clinical review of antidiabetic drugs: Implications for type 2 diabetes mellitus management. Front. Endocrinol. (Lausanne) 8, 6. doi:10.3389/fendo.2017.00006
Darcy, M., Parkinson, J., McDonald, N., Moriarty, S., Kadariya, S., and Sapkota, D. (2022). Geographic remoteness and socioeconomic disadvantage reduce the supportiveness of food and physical activity environments in Australia. Aust. N. Z. J. Public Health 46 (3), 346–353. doi:10.1111/1753-6405.13227
Dawson-Hughes, B., Staten, M., Knowler, W., Nelson, J., Vickery, E., LeBlanc, E., et al. (2020). Intratrial exposure to vitamin D and new-onset diabetes among adults with prediabetes: A secondary analysis from the vitamin D and type 2 diabetes (D2d) study. Diabetes Care 43 (12), 2916–2922. doi:10.2337/dc20-1765
Dhamrait, G. K., Panchal, K., Fleury, N. J., Abel, T. N., Ancliffe, M. K., Crew, R. C., et al. (2020). Characterising nitric oxide-mediated metabolic benefits of low-dose ultraviolet radiation in the mouse: A focus on Brown adipose tissue. Diabetologia 63 (1), 179–193. doi:10.1007/s00125-019-05022-5
Díaz‐Torres, J., Hernández‐Mena, L., Murillo‐Tovar, M., León‐Becerril, E., López‐López, A., Suárez‐Plascencia, C., et al. (2017). Assessment of the modulation effect of rainfall on solar radiation availability at the Earth’s surface. Metall. Apps. 24 (2), 180–190. doi:10.1002/met.1616
Ding, D., Chong, S., Jalaludin, B., Comino, E., and Bauman, A. E. (2015). Risk factors of incident type 2-diabetes mellitus over a 3-year follow-up: Results from a large Australian sample. Diabetes Res. Clin. Pract. 108 (2), 306–315. doi:10.1016/j.diabres.2015.02.002
Dmitrienko, A., and D’Agostino Sr, R. (2018). Multiplicity considerations in clinical trials. N. Engl. J. Med. Overseas. Ed. 378 (22), 2115–2122. doi:10.1056/nejmra1709701
Donaire-Gonzalez, D., Curto, A., Valentín, A., Andrusaityte, S., Basagaña, X., Casas, M., et al. (2019). Personal assessment of the external exposome during pregnancy and childhood in Europe. Environ. Res. 174, 95–104. doi:10.1016/j.envres.2019.04.015
Fleury, N., Feelisch, M., Hart, P. H., Weller, R. B., Smoothy, J., Matthews, V. B., et al. (2017). Sub-erythemal ultraviolet radiation reduces metabolic dysfunction in already overweight mice. J. Endocrinol. 233 (1), 81–92. doi:10.1530/joe-16-0616
Geldenhuys, S., Hart, P. H., Endersby, R., Jacoby, P., Feelisch, M., Weller, R. B., et al. (2014). Ultraviolet radiation suppresses obesity and symptoms of metabolic syndrome independently of vitamin D in mice fed a high-fat diet. Diabetes 63 (11), 3759–3769. doi:10.2337/db13-1675
Glez-Peña, S., Lourenço, A., López-Fernández, H., Reboiro-Jato, M., and Fdez-Riverola, M. (2014). Web scraping technologies in an API world. Brief. Bioinform. 15 (5), 788–797. doi:10.1093/bib/bbt026
Gorman, S., de Courten, B., and Lucas, R. M. (2019). Systematic review of the effects of ultraviolet radiation on markers of metabolic dysfunction. Clin. Biochem. Rev. 40 (3), 147–162. doi:10.33176/aacb-19-00026
Gorman, S., Larcombe, A. N., and Christian, H. E. (2021). Exposomes and metabolic health through a physical activity lens: A narrative review. J. Endocr. 249 (1), R25–R41. doi:10.1530/JOE-20-0487
Gorman, S. (2020). Sun exposure: An environmental preventer of metabolic dysfunction? Curr. Opin. Endocr. Metab. Res. 11, 1–8. doi:10.1016/j.coemr.2019.11.001
Grarup, N., Sandholt, C. H., Hansen, T., and Pedersen, O. (2014). Genetic susceptibility to type 2 diabetes and obesity: From genome-wide association studies to rare variants and beyond. Diabetologia 57 (8), 1528–1541. doi:10.1007/s00125-014-3270-4
Hanigan, I. (2018). Meteorological data for Australian postal areas. (anudc:2651) Available at: https://datacommons.anu.edu.au/DataCommons/rest/display/anudc:2651 (Accessed June 16, 2022).
Hu, Y., Zong, G., Liu, G., Wang, M., Rosner, B., Pan, A., et al. (2018). Smoking cessation, weight change, type 2 diabetes, and mortality. N. Engl. J. Med. 379 (7), 623–632. doi:10.1056/NEJMoa1803626
Huo, L., Magliano, D. J., Rancière, F., Harding, J. L., Nanayakkara, N., Shaw, J. E., et al. (2018). Impact of age at diagnosis and duration of type 2 diabetes on mortality in Australia 1997-2011. Diabetologia 61 (5), 1055–1063. doi:10.1007/s00125-018-4544-z
Hwang, J., and Shon, C. (2014). Relationship between socioeconomic status and type 2 diabetes: Results from korea national health and nutrition examination survey (KNHANES) 2010-2012. BMJ Open 4 (8), e005710. doi:10.1136/bmjopen-2014-005710
Juul, S. S., Sodemann, M., Schramm, S., and La Brot, B. B. (2018). Remoteness and demographic distribution of diabetes, hypertension and common medical conditions among indigenous Panamanian communities. Columbia Univ. J. Glob. Health 8 (1), 1–11. doi:10.7916/thejgh.v8i1.4955
Khan, M. A. B., Hashim, M. J., King, J. K., Govender, R. D., Mustafa, H., and Al Kaabi, J. (2020). Epidemiology of type 2 diabetes - global burden of disease and forecasted trends. J. Epidemiol. Glob. Health 10 (1), 107–111. doi:10.2991/jegh.k.191028.001
Lao, X. Q., Deng, H. B., Liu, X., Chan, T. C., Zhang, Z., Chang, L. Y., et al. (2019). Increased leisure-time physical activity associated with lower onset of diabetes in 44828 adults with impaired fasting glucose: A population-based prospective cohort study. Br. J. Sports Med. 53 (14), 895–900. doi:10.1136/bjsports-2017-098199
Ley, S. H., Hamdy, O., Mohan, V., and Hu, F. B. (2014). Prevention and management of type 2 diabetes: Dietary components and nutritional strategies. Lancet 383 (9933), 1999–2007. doi:10.1016/s0140-6736(14)60613-9
Lindqvist, P. G., Olsson, H., and Landin-Olsson, M. (2010). Are active sun exposure habits related to lowering risk of type 2 diabetes mellitus in women, a prospective cohort study? Diabetes Res. Clin. Pract. 90 (1), 109–114. doi:10.1016/j.diabres.2010.06.007
Lontchi-Yimagou, E., Tsalefac, M., Tapinmene, L. M. T., Noubiap, J. J. N., Balti, E. V., Nguewa, J.-L., et al. (2016). Seasonality in diabetes in yaounde, Cameroon: A relation with precipitation and temperature. BMC Public Health 16 (1), 470. doi:10.1186/s12889-016-3090-1
Maier, W., Holle, R., Hunger, M., Peters, A., Meisinger, C., Greiser, K. H., et al. (2013). The impact of regional deprivation and individual socio-economic status on the prevalence of Type 2 diabetes in Germany. A pooled analysis of five population-based studies. Diabet. Med. 30 (3), e78–e86. doi:10.1111/dme.12062
Morton, J. I., Ilomӓki, J., Magliano, D. J., and Shaw, J. E. (2021). The association of socioeconomic disadvantage and remoteness with receipt of type 2 diabetes medications in Australia: A nationwide registry study. Diabetologia 64 (2), 349–360. doi:10.1007/s00125-020-05304-3
National Diabetes Services Scheme (NDSS) (2020). Type-2 diabetes as at 31 march 2020. Available at: https://www.ndss.com.au/wp-content/uploads/snapshots/2020/ndss-data-snapshot-202003-type2-diabetes.pdf (Accessed June 16, 2022).
National Diabetes Services Scheme (NDSS) (2022). Australian diabetes map. Available at: https://map.ndss.com.au/#!/ (Accessed June 16, 2022).
Ohn, J. H., Kwon, I. H., Park, J., Ryu, O. H., Lee, S. J., Kim, D. M., et al. (2014). Unprotected daily sun exposure is differently associated with central adiposity and β-cell dysfunction by gender: The Korean national health and nutrition examination survey (KNHANES) V. Environ. Res. 133, 253–259. doi:10.1016/j.envres.2014.05.033
Perneger, T. (1998). What's wrong with Bonferroni adjustments. Brit. Med. J. 316 (7139), 1236–1238. doi:10.1136/bmj.316.7139.1236
Perrett, D., Schaffer, J., Piccone, A., and Roozeboom, M. (2006). Bonferroni adjustments in tests for regression coefficients. Mult. Linear Regres. Viewpoints 32 (1), 1–6.
Pilz, S., Kienreich, K., Rutters, F., de Jongh, R., van Ballegooijen, A. J., Grübler, M., et al. (2013). Role of vitamin D in the development of insulin resistance and type 2 diabetes. Curr. Diab. Rep. 13 (2), 261–270. doi:10.1007/s11892-012-0358-4
Pink, B. (2013). Socio-economic indexes for areas (SEIFA) 2011. Canberra: Australian Bureau of Statistics. (technical paper 2033.0.55.001).
Pittas, A. G., Jorde, R., Kawahara, T., and Dawson-Hughes, B. (2020). Vitamin D supplementation for prevention of type 2 diabetes mellitus: To D or not to D? J. Clin. Endocrinol. Metab. 105 (12), 3721–3733. doi:10.1210/clinem/dgaa594
Rothman, K. (1990). No adjustments are needed for multiple comparisons. Epidemiol. (Fairfax). 1 (1), 43–46. doi:10.1097/00001648-199001000-00010
Salmerón Gómez, R., García Pérez, J., López Martín, M. D. M., and García, C. G. (2016). Collinearity diagnostic applied in ridge estimation through the variance inflation factor. J. Appl. Stat. 43 (10), 1831–1849. doi:10.1080/02664763.2015.1120712
Shrestha, A. K., Thapa, A., and Gautam, H. (2019). Solar radiation, air temperature, relative humidity, and dew point study: Damak, Jhapa, Nepal. Int. J. Photoenergy 2019, 8369231–8369237. doi:10.1155/2019/8369231
Skobowiat, C., and Slominski, A. T. (2016). Ultraviolet B stimulates proopiomelanocortin signalling in the arcuate nucleus of the hypothalamus in mice. Exp. Dermatol. 25 (2), 120–123. doi:10.1111/exd.12890
Speakman, J. R., and Heidari-Bakavoli, S. (2016). Type 2 diabetes, but not obesity, prevalence is positively associated with ambient temperature. Sci. Rep. 6 (1), 30409. doi:10.1038/srep30409
Stringhini, S., Zaninotto, P., Kumari, M., Kivimäki, M., and Batty, G. D. (2016). Lifecourse socioeconomic status and type 2 diabetes: The role of chronic inflammation in the English longitudinal study of ageing. Sci. Rep. 6 (1), 24780. doi:10.1038/srep24780
Tonidandel, S., Lebreton, J. M., and Johnson, J. W. (2009). Determining the statistical significance of relative weights. Psychol. Methods 14 (4), 387–399. doi:10.1037/a0017735
Versace, V., Skinner, T., Bourke, L., Harvey, P., and Barnett, T. (2021). National analysis of the Modified Monash Model, population distribution and a socio‐economic index to inform rural health workforce planning. Aust. J. Rural. Health 29 (5), 801–810. doi:10.1111/ajr.12805
Wardlaw, S. L. (2011). Hypothalamic proopiomelanocortin processing and the regulation of energy balance. Eur. J. Pharmacol. 660 (1), 213–219. doi:10.1016/j.ejphar.2010.10.107
Zhang, Y., Tan, H., Tang, J., Li, J., Chong, W., Hai, Y., et al. (2020). Effects of vitamin D supplementation on prevention of type 2 diabetes in patients with prediabetes: A systematic review and meta-analysis. Diabetes Care 43 (7), 1650–1658. doi:10.2337/dc19-1708
Keywords: australian postcodes, data-scraping, solar radiation, type-2 diabetes prevalence, ultraviolet radiation
Citation: Lee AE, Chiu C, Thian A, Suann B and Gorman S (2022) Increased levels of solar radiation are associated with reduced type-2 diabetes prevalence: A cross-sectional study of Australian postcodes. Front. Environ. Sci. 10:970658. doi: 10.3389/fenvs.2022.970658
Received: 16 June 2022; Accepted: 24 October 2022;
Published: 09 November 2022.
Edited by:
Eli Hershkovitz, Soroka Medical Center, IsraelReviewed by:
William B. Grant, Sunlight Nutrition and Health Research Center, United StatesCopyright © 2022 Lee, Chiu, Thian, Suann and Gorman. This is an open-access article distributed under the terms of the Creative Commons Attribution License (CC BY). The use, distribution or reproduction in other forums is permitted, provided the original author(s) and the copyright owner(s) are credited and that the original publication in this journal is cited, in accordance with accepted academic practice. No use, distribution or reproduction is permitted which does not comply with these terms.
*Correspondence: Shelley Gorman, c2hlbGxleS5nb3JtYW5AdGVsZXRob25raWRzLm9yZy5hdQ==
†These authors have contributed equally to this work and share first authorship
Disclaimer: All claims expressed in this article are solely those of the authors and do not necessarily represent those of their affiliated organizations, or those of the publisher, the editors and the reviewers. Any product that may be evaluated in this article or claim that may be made by its manufacturer is not guaranteed or endorsed by the publisher.
Research integrity at Frontiers
Learn more about the work of our research integrity team to safeguard the quality of each article we publish.