- 1Department of Geography and Urban Planning, University of Tabriz, Tabriz, Iran
- 2Department of Climatology, University of Tabriz, Tabriz, Iran
- 3Urban Planning Department, Urmia University, Urmia, Iran
- 4Institute of Information Engineering, Automation and Mathematics, Slovak University of Technology in Bratislava, Bratislava, Slovakia
- 5John von Neumann Faculty of Informatics, Obuda University, Budapest, Hungary
Landscape fragmentation and the elimination of urban green spaces are the results of human activities which put significant pressure on urban sustainability. The planning and developing of urban ecological networks and corridors as an effective approach is a response to rapid urbanization and fragmentation of natural areas. The Tabriz metropolitan as the fourth-largest city in Iran was selected as a case study that has grown rapidly over the past few decades. This study presents a practical approach and framework for assessing and enhancing ecological connectivity of landscape. The framework was developed based on the landscape metrics, graph theory, least-cost modeling, and geographic information system tools during three different periods (1984-2000-2020). The results using the values of landscape metrics such as CA, Edge Distance, Mean Patch Size, Mean Shape Index, large patch index, NP, Landscape shape index, and COHESION indicate that the urban landscape of Tabriz has been more fragmented over the past 3 decades and has lost its connectivity. To reduce the effects of fragmentation and enhance landscape connectivity in study area, we proposed a network of ecological corridors that passes through the core ecological patches. Our results also indicate that the core patches and the least-cost created corridors are mainly located in the suburbs of Tabriz and the central part of the city cannot be suitable for ecological development. Therefore, using the above-mentioned methods could be an effective approach to develop ecological networks and improve landscape connectivity that can encourage urban planners and managers to protect and develop green networks.
1 Introduction
Urban green spaces are the most important natural and cultural sources in cities (Tian et al., 2014). They have a significant role in sustainable urban development and provide substantial environmental, economic, aesthetic, recreational and social ecosystem service benefits (Li et al., 2015), (Xu et al., 2011). However, Over recent decades, urban areas around the world have expanded rapidly (Braaker et al., 2017). The reports published by the UN show that 55% of the world’s population live in cities and urban areas and the proportion of that will be expected to surpass 68% by 2050 (Nations, 2018). This rapid population growth and urbanization around the world can lead to significant pressure on the natural environment and cause many problems (Girma et al., 2019). Some of the negative effects of urban expansion on the natural and ecological environment include: decreasing natural areas and habitat fragmentation (van Bohemen, 1998; Haddad et al., 2015; May et al., 2019); threats to biodiversity (Seto et al., 2012; De Baan et al., 2013; Joly et al., 2019); deforestation (Jorgenson and Burns, 2007), (Sathler et al., 2019); pollution (Xu et al., 2011), (Grimm et al., 2008; Cui and Shi, 2012; Sun et al., 2019); disturbing natural and wildlife (Brown, 2019), (Mutuga, 2009); regional and global warming of climate (Grimmond, 2007; McCarthy et al., 2010; Wang et al., 2019). These problems directly affect urban sustainability and the ecological pattern of its areas (Wanghe et al., 2020).
As a result, most of the environmental impacts of urbanization are related to green spaces (Zhou and Wang, 2011), which can lead to landscape fragmentation and the elimination of green patches (Nor et al., 2017). Therefore, fragmentation of habitats is one of the major impacts of human activities (Loro et al., 2015) and a dynamic process over time (Bennett, 1999), that significantly affects landscape structure and reduces landscape connectivity (Vergnes et al., 2012). The term ‘fragmentation’ describes the processes of subdivision by which large, connected areas of vegetation are partially removed, leaving several smaller patches that are separated from each other and less connected (Bennet, 2003), (Soons, 2003). Therefore, fragmentation of urban green space as one of the serious environmental problems and greatest threats to biodiversity, decreases the health of urbanized ecosystems and also threatens residents’ quality of life (Tian et al., 2014), (Qi et al., 2017).
As the opposite of fragmentation, connectivity is a necessity (Giardino and Houser, 2015), (Kong et al., 2010) that plays a critical role in the health of the ecosystem and resilience to environmental change (Thompson and Gonzalez, 2017). Improving landscape connectivity can counteract the adverse effects of fragmentation by reduce isolation (Bennet, 2003). To enhance landscape ecological connectivity and ecosystem services, urban green spaces ought to be connected through corridors, forming a network that allows dispersion and movement (Bennett, 1999), (Zhang et al., 2019). Hence, creating ecological networks is an effective way to solve many environmental problems and fragmentation issues (Jongman, 2008) and it is considered as a type of effective approach for improving the ecological value of urban green spaces (Li et al., 2015), (Kong et al., 2010), (Wang et al., 2021), (Cook, 2002). Accordingly, when fragmentation occurs, linking the patches through ecological corridors, in addition to facilitating their ecological functions, provides many opportunities for human services (Hepcan et al., 2009). The development of ecological networks generally involves preserving existing green spaces, restoring, designing new spatial ecological forms, and maintaining connectivity between ecological patches (Kong et al., 2010). However, the development planning of ecological networks requires a more strategic, comprehensive approach because urban planners are frequently faced with competing priorities and limited resources (Zhang et al., 2019). Hereafter, the establishment of these networks is often difficult and may lead to unrealistic results.
In the past decades, various methods of landscape ecology have been applied to assessing landscape connectivity and planning ecological networks (Li et al., 2015), (Zhang and Wang, 2006), such as landscape metrics to detect and monitor ecological changes (Narumalani et al., 2004; Su et al., 2010; Tian et al., 2011; Pan et al., 2019), circuit theory, gravity modelling, least-cost approach and graph theory to identify ecological corridors, develop green space networks, and also evaluate landscape connectivity (Kong et al., 2010), (Zhang et al., 2019), (Hofman et al., 2018), (Suksavate et al., 2019). In this paper, first, we evaluated land use changes and their ecological connectivity using landscape metrics, and then least-cost ecological corridors were identified to create green space networks based on graph theory and least-cost modelling. Thereby, the goals of our research were to: 1) detect landscape changes; 2) assess landscape connectivity; 3) identify the ecological core patches; and 4) model potential corridors and ecological networks. We aimed to explore conceptually and empirically how the landscape ecology are used in combination with graph theory, least-cost modelling, and GIS tools to the understanding of landscape fragmentation and their potential application in improving landscape connectivity in the city of Tabriz.
2 Materials and methods
2.1 Casestudy
Tabriz the centre of East Azerbaijan Province is located at the northwest of Iran (Figure 1). The study area has an urban area of about 133 km2, and it is bounded between the lats. 38°1′ N to 38°9′ N and longs. 46°11′ E to 46°23′ E. The population of Tabriz has been growing gradually from 289,996 in 1956 to 1,773,033 in 2020 (Statistical Center of Iran, 2020) and it is the fourth-largest city in Iran (Feizizadeh et al., 2021). Population increase in this city has caused many environmental and physical changes and based on multi-temporal satellite images residential, industrial and commercial land uses have expanded over the gardens and agricultural lands due to impacts of immigrants in recent years. The mentioned reasons have caused unbalanced development of the city, destruction, and fragmentation of green lands and the reduction of the quality of ecological networks. The land use status shows that the current green space area is about 2.4% of the total area of the city and its per capita is about 3.8 m2 that has a lot of differences with national and international standards. The area of unoccupied and barren lands of Tabriz is 6880 ha that covers about 28% of the city’s area (Naghsh Moheet engineering consultant co, 2014). These lands are often abandoned on the city’s surface and have a high capability for expanding green spaces and ecological networks. Other environmental characteristic of Tabriz is passing two waterways through the city that are originated from surrounding high lands and play an effective role in improving the city’s environmental situation, as well as adjusting urban climate. Therefore, considering the importance of unoccupied lands and existing green spaces beside urban streams, we used them for extending the ecological network of Tabriz and improving its ecological situation.
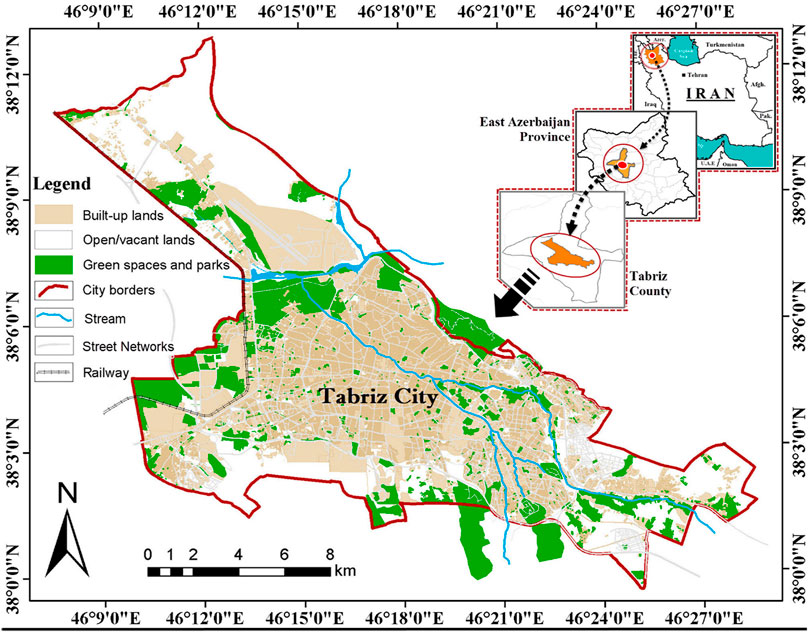
FIGURE 1. Location of the study area in the metropolitan region of Tabriz, NW Iran, and its land use map.
2.2 Methodology
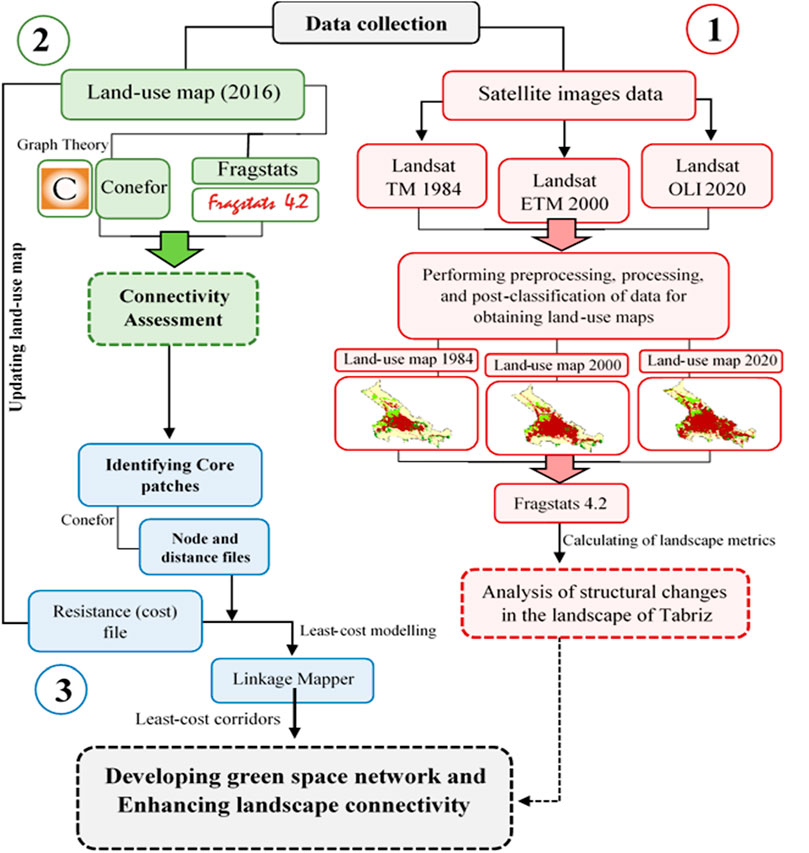
We proposed our methodological framework based on recent studies in the field of landscape ecology that consist of three main stages (Figure 2): First, land use changes were investigated during three different periods (1984-2000-2020) using classified images and landscape metrics. The selected images had the most time matching with the official demographic data of Tabriz metropolitan. Throughout this stage, we demonstrated how the landscape of Tabriz has changed over the past decades, and how its ecological spaces have been fragmented and subdivided. At the second stage, the landscape ecological connectivity was evaluated, and then the most important green space patches (core patches) were identified. Finally, based on the findings of the previous steps, the graph theory and least-cost modelling were applied for the creation of the ecological networks of green spaces.
2.1.1 Evaluation of land use changes
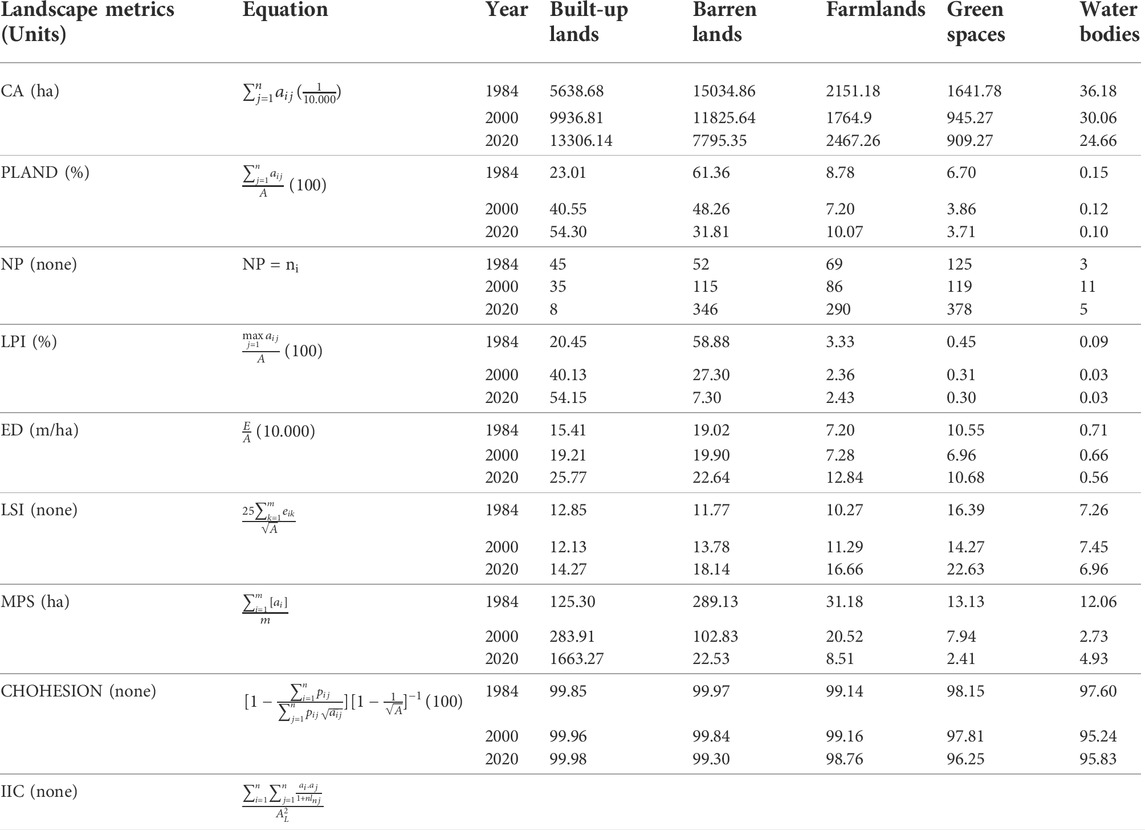
One of the most important steps for improving the ecological status of landscape is analysing of land use trend change. We can provide some basic solutions for improving the existing situation and controlling the city’s growth with knowledge of the process of changes and directions of city expansion. In this step, land use maps and landscape metrics for the years 1984, 2000 and 2020 were extracted using ArcGIS (version 10.5), ENVI (version 5.1), and RAGSTATS (version 4.2), see (Figure 2). Therefore, in this part, while assessing land use changes, we also evaluated landscape ecological connectivity and its fragmentation changes using landscape metrics. A review of the main sources shows that there are many researches that use landscape metrics to evaluate land use change (Narumalani et al., 2004), (Pan et al., 2019), (He et al., 2011; Liu and Yang, 2015; Liang et al., 2017; Magidi and Ahmed, 2019). Also there are a variety of indices to measure the changing of landscape structure (Magidi and Ahmed, 2019). Some of the most imperative landscape metrics that we applied to the analysis of land use detection include: CA or TA (Class area or Total area), Edge Distance (ED), Mean Patch Size (MPS), Mean Shape Index (MSI), LPI (large patch index), NP (Number of patches), LSI (Landscape shape index), COHESION (Patch cohesion index) and so on (Inkoom et al., 2018), (McGarigal, 2015), see (Table 3). Landscape metrics are often used to determine landscape dynamics in developing countries (Magidi and Ahmed, 2019), (Abebe, 2013) and just few researches have been done for the analysis of landscape structure in Iran especially in city of Tabriz.
2.1.2 Assessment of ecological connectivity and identifying core patches
First, we updated the latest land use map of the Tabriz metropolis area (2016) using satellite images and Google Earth images and field surveying, and then the connectivity indices to assess landscape connectivity were measured. Graph theory and least-cost modelling are two common tools for analysing connectivity and fragmentation among the various methods available (Braaker et al., 2017), (Minor and Urban, 2008), (Wimberly et al., 2018). Graph theory simulates the relationships between network nodes (Nogués and Cabarga-Varona, 2014) and it is the most common and straightforward used method for measuring and assessing various aspects of habitat connectivity (Minor and Urban, 2008), (Zhang, 2017). The least-cost theory generally refers to easiest and least-cost route or path to travel from one patch to another (Sun et al., 2019). These techniques are also used for developing green space networks and improving landscape connectivity by modelling ecological corridors (Kong et al., 2010), (Hofman et al., 2018), (Adriaensen et al., 2003; Lechner et al., 2015; Chiesura, 2004; Liu et al., 2015; ming Zhao et al., 2019). To measure landscape connectivity indices based on mentioned methods, we used Fragstats and Conefor Sensinode 2.6 software (McGarigal and Marks, 1995), (Saura and Pascual-Hortal, 2007). Of all kinds of connectivity indices based on graph theory and least-cost modelling, the Integral Index of Connectivity (IIC) and COHESION are two of the most popular and suitable indices to evaluate landscape connectivity (Zhang et al., 2019), (Saura and Pascual-Hortal, 2007) which we applied at the class and patch level in this study (Table 3). The Cohesion index measures the structural (physical) connectivity of the landscape (Zhang, 2017) and, the IIC index is one of the best binary indices for functional connectivity analysis (Saura Santiago and lucía, 2008).
A high values of these indexes shows that they are more connected and demonstrates the importance of green patches in the landscape. Various researchers based on the scale and research subject have considered different areas and criteria to identify core patches; some of which propose to use perimeter area index and some suggest to use utilized patch size (Zhang, 2017). For example, several studies considered 12 ha as the standard for identifying major areas (Kong et al., 2010), (Zhang et al., 2019), (Xun et al., 2014), some suggested 40 ha (Firehock, 2015), some considered >25 ha (Minor and Urban, 2008) and some of them proposed 1 ha (Nogués and Cabarga-Varona, 2014). However, in our case study, we decided to apply patches bigger than 5 ha as criteria for identifying core patches. It means, if a patch has an overall size equal to or bigger than 5 ha, it can be a core patch.
2.1.3 Enhancing landscape connectivity by modelling corridors network
By showing the landscape as a cost-surface, both least-cost modelling and graph theory are used to measure the connectivity and find the best route between two patches (Xiu, 2017), which are particularly proper for planners in landscape planning and land use management (Qi et al., 2017), (Clauzel et al., 2018). There are several ways and tools to analyze and identify ecological corridors (Riggio and Caro, 2017). One of the practical tools in this field is Linkage Mapper software, which is mainly used in analysis, creation, and prioritization of habitats corridors (McRae and Kavanagh, 2011; Doğan and Şahin, 2017; González-Saucedo et al., 2021). Actually, Linkage Mapper is an extension to the ArcGIS software that works based on graph concepts and least-cost theory that assist planners to identify and create the potential paths of the ecological network and removing higher cost routes. Furthermore, we considered a resistance layer with the values of weights between 0–100 for each land use layer (Table 1). The resistance or cost layer is determined by landcover type and vegetation coverage, and the resistance against displacement and networking as suggested by McRae and Kavanagh (McRae and Kavanagh, 2011); Wanghe et al. (Wanghe et al., 2020);; Zhang et al. (Zhang et al., 2019).
3 Results
3.1 Analysis of land use changes using landscape metrics
According to the research purposes, land use maps for 1984, 2000, and 2020 were created with five classes using ENVI software and the Maximum likelihood method: built-up lands, barren/unoccupied lands, farmlands, gardens and green spaces and water bodies (Figure 3).
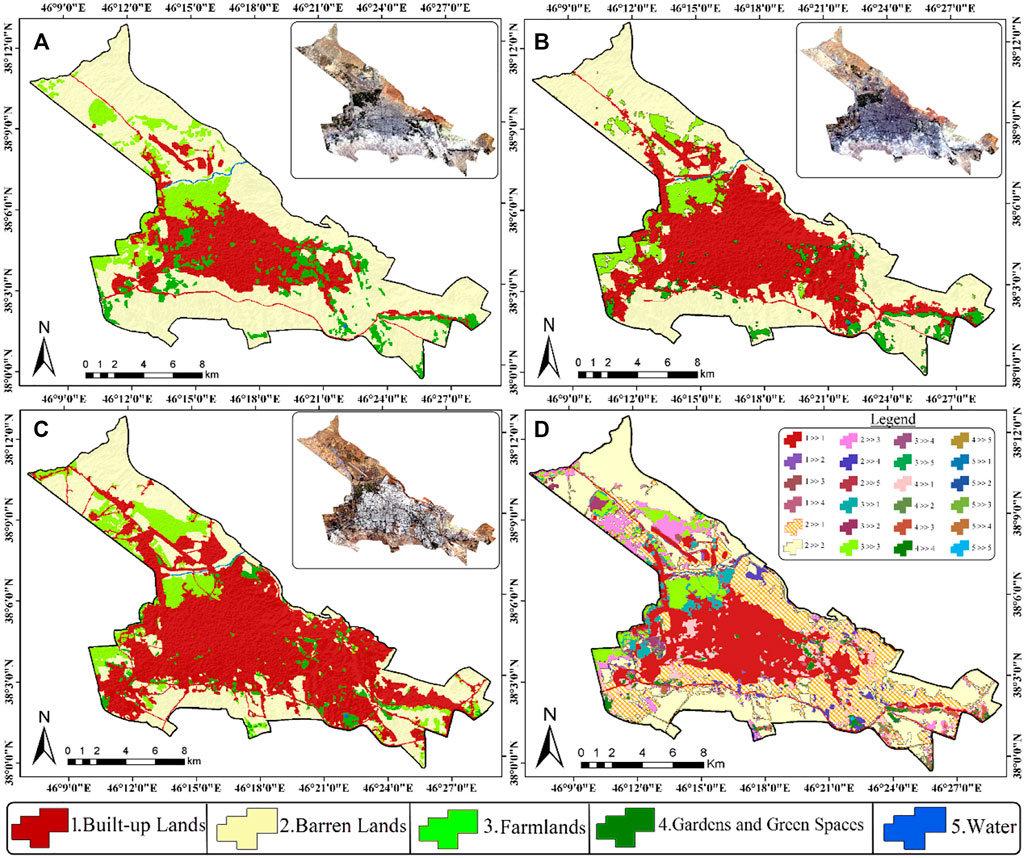
FIGURE 3. Land use map of Tabriz metropolis for 1984 (A), 2000 (B) and 2020 (C); and change detection map from 1984 to 2020 (D).
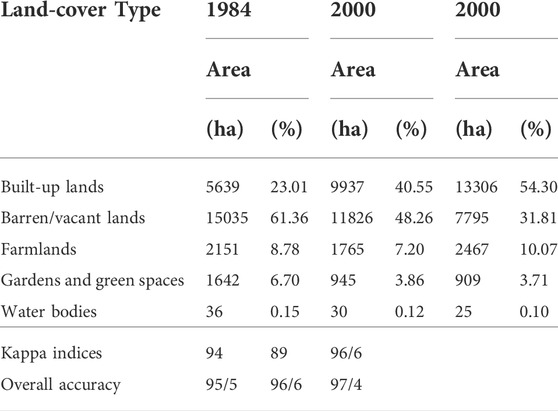
The classified images show that many of the urban green spaces of Tabriz have been destroyed by urban development and have been replaced with impenetrable surfaces (Table 2).
Reviewing of land use maps (Figure 3) and land use changes table (Table 2) during the periods of 1984–2000–2020 indicate that built-up lands from 1984 to 2020 have increased by 7667 ha (136%). Also, farmlands increased from 2151 in 1984–2467 in 2020 (15%). But total gardens and green spaces area have been decreased from 1642 ha in 1984 to 909 ha in 2020 (-45%) and barren lands have been reduced by more than 48% (−7240 ha). Furthermore, we calculated the accuracy of the produced land use maps by using error matrix and Statistical parameters (Kappa indices and Overall accuracy). The values of Kappa indices (89%–97%) and Overall accuracy (95%–98%) shows that based on allowable statistics (above 70%), our maps and data were acceptable (See Darvishi et al. (Darvishi et al., 2020)).
Generally, we selected eight metrics, which had the highest significance for describing landscape pattern changes (Table 3). The values of CA and PLAND metrics indicate an increase in the area of built-up land and farmlands and the decrease of other land uses from 1984 to 2020. Based on the results during 1984–2020, urban areas (built-up lands) increased by 7667.46 (136%) and a rate of 4% per year. Subsequently, the farmlands totally increased by 316.08 ha (14.7%) from 1984 to 2020 and it is because of constructions and population increase by this period. Furthermore, gardens and green spaces were decreased from 1641.78 ha in 1984 to 909.27 ha in 2020 (totally 732.51 ha or 44.6%). The NP metric shows the number of isolated patches and it can indicate connectivity or fragmentation in the landscape (Magidi and Ahmed, 2019). Based on the results, the value of NP for built-up land decreased from 45 in 1984 to eight in 2020. This means that in this period, urban areas (built-up lands) got more connected. An important point in this analysis is that values of the number of green space patches decreased from 1984 to 2000 and then increased between 2000 and 2020. But, totally the values of NP for all land covers (except built-up lands) were increased from 1984 to 2020 which means they became more fragmented.
The larger values of LSI show the patches are dispersed and fragmented (McGarigal, 2015). From 1984 to 2020, the values of the LSI metric for all land uses (excluding water bodies) were increased, which means that the landscape of Tabriz has seen negative changes and is becoming more complex and geometrically disordered. Values of the LPI in the urban area (built-up lands) have shown an increasing trend and for other land covers (barren lands, farmlands, and green spaces) a reduction trend which indicates the convergence and fragmentation of these types of lands especially gardens and green spaces. In other words, the built-up patches have become larger and more connected during this time, but the other land use patches have become smaller and fragmented. The ED metric refers to the disintegration of spaces and its increase leads to the decrease of connectivity and continuity of the landscape. Therefore, this metric can measure the fragmentation process, and it can also determine habitat quality (Liu et al., 2016). Based on the results, all land use classes have lost their connectivity and converted into smaller segments. The MPS metric shows the average size of the patches and the increase in its values in building land use represents more connectivity in the landscape. COHESION is an index that measures the physical connectivity between patches, and a higher rate of that indicates patches are physically more connected (Zhang, 2017). According to the results, the COHESION for built-up lands has increased from 99.85 in 1984 to 99.98 in 2000, but it has been decreased for other land uses. In other words, Tabriz landscape has become increasingly fragmented, as other metrics also demonstrate.
Therefore, the results of the analysis of land use maps and landscape metrics clearly showed the effect of population increases and demand for lands in the urban landscape of Tabriz that can be seen in the fragmentation of green spaces under the upsurge of urban construction.
(McGarigal, 2015), (McGarigal and Marks, 1995), (Saura Santiago and lucía, 2008).
3.2 Ecological connectivity assessment and identification of the core patches
The results of analyzing the values of the Cohesion index for all land classes (in landscape level) indicate that built-up land with a value of 99.751 having the highest Cohesion values and ecological spaces (farmlands and green spaces) have the least cohesion among Tabriz landscape land uses (Table 4).
Furthermore, the values of this index for the gardens and green spaces (class level) indicate that some of the green patches are more connected, and some have low cohesion (Figure 4).
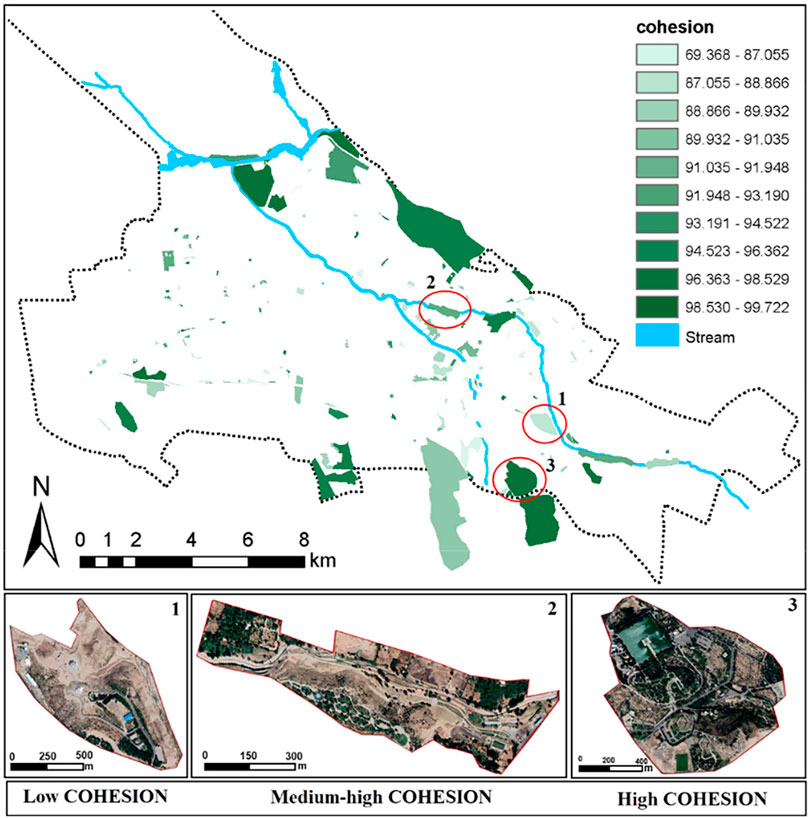
FIGURE 4. The Cohesion index values for the green spaces of the Tabriz metropolis at the level of classes (Darker patches have high connectivity and brighter have less connectivity).
The results of the IIC index illuminate that patches number 32, 33, 29, 4, and 9 are the most significant patches in Tabriz landscape and are more connected (Figure 5). As shown in Figure 6, these patches mainly located on the edge of the city are less affected by the changes.
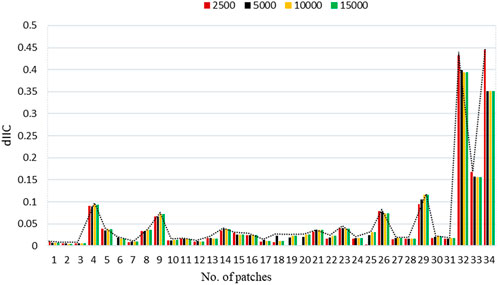
FIGURE 5. IIC values for green patches bigger than 5 ha at different distances (2500, 5000, 10000, and 15000 m).
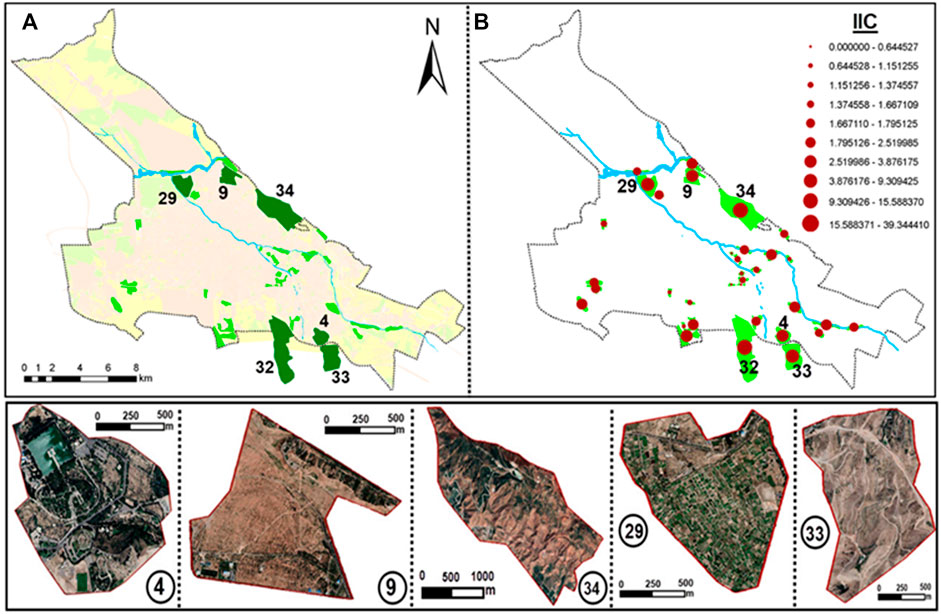
FIGURE 6. The IIC index values for the green spaces of Tabriz city (A), and the core green patches of the city based on the results of connectivity indices (B).
By investigating the results of the analysis of the connectivity indices in previous sections (IIC and Cohesion) as well as using Google earth imageries, the most significant patches of green spaces (core patches) were identified (Figure 6), and also areas less than 5 ha were eliminated (to increase the accuracy of the results and reduce the processing time). These main patches are important from this point of view in that they are used to increase the connectivity of ecological spaces and create continuous green networks.
3.3 Modelling corridors network based on graph and least-cost theory
In the meantime, Built-up lands and streets had the higher resistance against creating ecological corridors and were almost impenetrable. But, green lands (farmlands, water bodies, and green spaces) and unoccupied and barren lands that cause the least resistance are the most suitable areas for the development of urban ecological corridors. Therefore, based on the weight distances and the cost layer (resistance layer), the network of corridors passes only through the area that has the least resistance. Figure 7 shows the least-cost corridors between core patches that designed by Linkage Mapper.
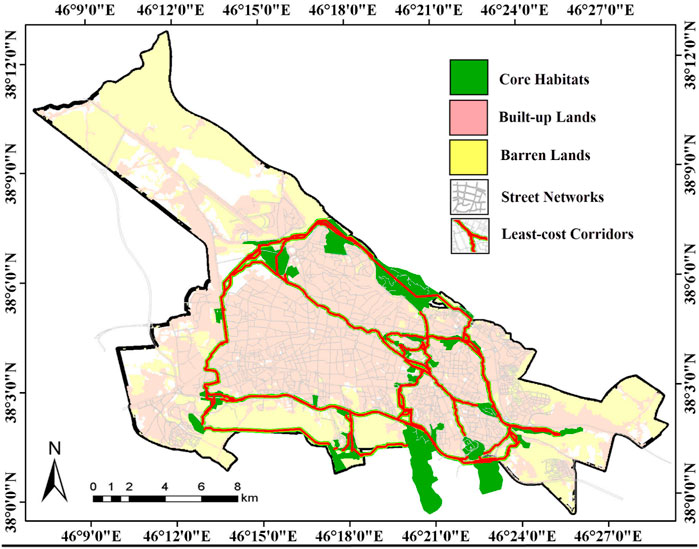
FIGURE 7. Least-cost corridors between core patches in the city of Tabriz (these corridors are the least-cost corridors between core patches based on Figure 6 and the higher-cost corridors were eliminated).
These least-cost corridors based on a resistance layer can be practical for connecting the most important green patches of Tabriz by the characteristic of the land cover condition and along with unoccupied and barren lands can provide an abundance ecosystem and social services for residents and improve the quality of the urban environment.
As shown in Figure 7, most of the created corridors are drawn like a green belt around the city the main reason of which is the geographical position of main habitats located in the suburbs. The central part of the city is also highly resilient and it is not possible to create ecological corridors in this area.
However, by developing the corridor networks among the remaining green spaces and the use of potential facilities in the city with combining effective decisions we can promote the ecological connectivity of these spaces while preventing the destruction of ecological spaces.
4 Discussion
The framework proposed in this research covers the past and current trends between 1984 and 2020 to assess landscape fragmentation and provide operational solutions for enhancing landscape connectivity.
As a first point, our research clearly indicates that land use changes which occurred in the city of Tabriz between 1984 and 2020 have led to unbalanced city development and reduced gardens area, agricultural lands, green spaces, biodiversity, and ecological connections. While in 1984, the city was mainly a mosaic of gardens, farmlands, and barren lands, currently it has become more urbanized and has lost many of its ecological spaces. These results are similar to the findings of other studies such as by Mahmoudzadeh (Mahmoudzadeh, 2007), Rahimi (Rahimi, 2016), and Taheri et al. (Taheri et al., 2014). The difference is that we used landscape metrics to evaluate landscape changes that is a more efficient way to quantify landscape changes in spatial complexity (Boisramé et al., 2017). But, none of the other studies have examined the landscape metrics and the ecological connectivity to detecting landscape changes. Furthermore, a variety of indices have been currently used to evaluate landscape ecological patterns (Tian et al., 2014), (Magidi and Ahmed, 2019). According to research objectives, we selected several of the most significant metrics, such as: CA or TA, ED, MPS, MSI, LPI, NP, LSI, COHESION.
Our study also reveals the significance of landscape ecological connectivity in biodiversity and the health of the ecosystem. Thus, it is important to always consider this factor when planning development to avoid increasing fragmentation and decreasing cohesion of green spaces. As we mentioned in section (2.2.2.), we used graph theory and least-cost modelling to assess landscape connectivity. These tools are one of the most common and efficient tools for exploring connectivity and fragmentation among the various methods available (Braaker et al., 2017), (Minor and Urban, 2008), (Wimberly et al., 2018), (Zhang, 2017), (Adriaensen et al., 2003), (Clauzel et al., 2018). The evaluating the values of the connectivity indices indicated that in the current situation, the ecological lands are more fragmented and built-up lands have the highest connectivity values (see Table 3). These findings highlight the necessity of landscape connectivity and encourage managers and planners to protect and develop green networks.
To create least-cost corridors, we suggested using graph and least-cost theory. According to other authors (Nor et al., 2017), (Kong et al., 2010), (Nogués and Cabarga-Varona, 2014), (Heintzman and McIntyre, 2019) and based on the results of this study, using the landscape ecology, the graph theory, and the least-cost cost approach, we can simulate and analyse ecological networks and finally provide operational solutions and optimal development of urban ecological networks. In other words, the comparison of the corridors generated by the proposed methods indicates that the proposed framework can effectively help urban planners and designers to identify core patches and create optimal ecological networks. Generally, three types of ecological space can be identified in the city of Tabriz based on the results: 1) farmlands and gardens that are located mainly in the western part of the city, 2) promenades and urban forests located in the suburbs (north and south part), and 3) green spaces and parks that are scattered throughout the city. These ecological spaces with urban streams are certainly an important part of the mosaic of the Tabriz landscape, and urban planning should facilitate maintaining or enhancing them.
However, we have considered only some of the effective environmental criteria in designing ecological corridors. Other researchers can evaluate and design ecological networks more realistic and rational by considering various other criteria such as economic and social. Furthermore, the suggested framework can be applied to assess the landscape connectivity and develop an ecological network in other cities that have been fragmented and damaged by its effects, and acceptable results have been achieved.
5 Conclusion
We have presented a framework based on the studying of the trend of changes in the past 3 decades applying classified multi-temporal satellite images and landscape metrics, then the ecological connectivity of the study area in the present condition was evaluated and finally for improving ecological connectivity, optimal corridors as solutions were provided by the use of minimum cost designed corridors. The proposed framework consisted of a set of well-known and accessible methods and models that have been used in similar researches.
This study by its own is considered to be one of the first researches investigating ecological connectivity in Tabriz landscape. In the first part of the study, land use changes between 1984–2020 were analysed by using land use maps derived from multi-temporal satellite images and landscape metrics. The results indicated the growth of built-up lands as a result of urbanization and the reduction of ecological land uses (farmlands, gardens, and green spaces) and other land uses like unoccupied areas. This means that the landscape of Tabriz has been fragmented over the past 3 decades and has lost its cohesion. In the other part of this study, the ecological connectivity of Tabriz landscape was evaluated using Cohesion and IIC indices. The results showed the greater uniformity of the building land and the fragmentation of the ecological spaces. The results of these two parts indicated that over time, building the lands have been gradually becoming more contiguous and dominant land use in Tabriz, but the green and ecological lands have been shrunk and interrupted day by day.
Also, based on the results of the connectivity indices, the most important ecological patches were identified and prioritized that could play a vital role in the ecological in the future. These patches are important, especially in the central regions of the city, which have a high population and residential density and the impossibility of placing large habitats in these areas. The creation of green networks and ecological development in Tabriz metropolis, regardless of these patches, is practically impossible. In the last part of the research, the least-cost corridors were calculated based on the graph theory and the least-cost approach for linking between the main patches. To achieve this goal, ecological spaces (farmlands, green spaces, and water bodies) and unoccupied lands in the city were considered as a potential possibility to play an essential role in the ecological future of Tabriz; thereby protecting these lands have great prominence. However, our study mainly focused on the past and current situation of the city. Consequently, the results may face some limitations and uncertainties, and require further investigation.
In conclusion, the destruction of habitats and their convergence in Tabriz city is the result of years of ineffective land management planning, which, if continued, would make the situation even more complex. The results of this research can be used to maintain and improve existing corridors or to create ecological networks in the future planning of the city of Tabriz. Through the multistage suggested framework of this study, other researchers will be able to identify the least-cost corridors in urban areas.
Data availability statement
The original contributions presented in the study are included in the article/Supplementary Material, further inquiries can be directed to the corresponding author.
Author contributions
HMAH, HMAS, and FJ contributed to conception and design of the study. AK organized the database. AA and AM performed the statistical analysis. HMAH, HMAS, and FJ wrote the first draft of the manuscript. AK, AA, and AM wrote sections of the manuscript. All authors contributed to manuscript revision, read, and approved the submitted version.
Conflict of interest
The authors declare that the research was conducted in the absence of any commercial or financial relationships that could be construed as a potential conflict of interest.
The handling editor [FA] declared a past co-authorship with the author [AM].
Publisher’s note
All claims expressed in this article are solely those of the authors and do not necessarily represent those of their affiliated organizations, or those of the publisher, the editors and the reviewers. Any product that may be evaluated in this article, or claim that may be made by its manufacturer, is not guaranteed or endorsed by the publisher.
References
Abebe, G. A. (2013). Quantifying urban growth pattern in developing countries using remote sensing and spatial metrics: A case study in kampala. Uganda: University of Twente. Available from: http://purl.utwente.nl/essays/84729.
Adriaensen, F., Chardon, J., De Blust, G., Swinnen, E., Villalba, S., Gulinck, H., et al. (2003). The application of ‘least-cost’ modelling as a functional landscape model. Landsc. Urban Plan. 64 (4), 233–247. doi:10.1016/S0169-2046(02)00242-6
Bennett, A. F. (1999). Linkages in the landscape: The role of corridors and connectivity in wildlife conservation, no. 1. Gland, Switzerland and Cambridge, United Kingdom: Iucn.
Boisramé, G. F. S., Thompson, S. E., Kelly, M., Cavalli, J., Wilkin, K. M., Stephens, S. L., et al. (2017). Vegetation change during 40 years of repeated managed wildfires in the Sierra Nevada, California. For. Ecol. Manage. 402, 241–252. doi:10.1016/j.foreco.2017.07.034
Braaker, S., Kormann, U., Bontadina, F., and Obrist, M. K. (2017). Prediction of genetic connectivity in urban ecosystems by combining detailed movement data, genetic data and multi-path modelling. Landsc. Urban Plan. 160, 107–114. doi:10.1016/j.landurbplan.2016.12.011
Brown, J. A. (2019). The influence of urbanization and surrounding landscape on wildlife in natural areas. in Rutgers the state university of New Jersey (New Jersey: School of Graduate Studies). doi:10.7282/t3-cb73-ez76
Chiesura, A. (2004). The role of urban parks for the sustainable city. Landsc. Urban Plan. 68 (1), 129–138. doi:10.1016/j.landurbplan.2003.08.003
Clauzel, C., Jeliazkov, A., and Mimet, A. (2018). Coupling a landscape-based approach and graph theory to maximize multispecific connectivity in bird communities. Landsc. Urban Plan. 179, 1–16. doi:10.1016/j.landurbplan.2018.07.002
Cook, E. A. (2002). Landscape structure indices for assessing urban ecological networks. Landsc. Urban Plan. 58 (2–4), 269–280. doi:10.1016/S0169-2046(01)00226-2
Cui, L., and Shi, J. (2012). Urbanization and its environmental effects in Shanghai, China. Urban Clim. 2, 1–15. doi:10.1016/j.uclim.2012.10.008
Doğan, D., and Şahin, Ş. (2017). Identification of ecological connectivity for Brown bears: Example of malatya Province. Eurasian J. Agric. Res. 1 (2), 111–119. Available from: https://dergipark.org.tr/en/pub/ejar/issue/37295/430725.
Darvishi, A., Yousefi, M., and Marull, J. (2020). Modelling landscape ecological assessments of land use and cover change scenarios. Application to the Bojnourd Metropolitan Area (NE Iran). Land use policy 99, 105098. doi:10.1016/j.landusepol.2020.105098
De Baan, L., Alkemade, R., and Koellner, T. (2013). Land use impacts on biodiversity in LCA: A global approach. Int. J. Life Cycle Assess. 18 (6), 1216–1230. [Online]. doi:10.1007/s11367-012-0412-0
Feizizadeh, B., Omarzadeh, D., Ronagh, Z., Sharifi, A., Blaschke, T., Lakes, T., et al. (2021). A scenario-based approach for urban water management in the context of the COVID-19 pandemic and a case study for the Tabriz metropolitan area, Iran. Sci. Total Environ. 790, 148272. doi:10.1016/j.scitotenv.2021.148272
Firehock, K. (2015). Strategic green infrastructure planning: A multi-scale approach. Washington, United States: Island Press.
Girma, Y., Terefe, H., and Pauleit, S. (2019). Urban green spaces use and management in rapidly urbanizing countries:-The case of emerging towns of Oromia special zone surrounding Finfinne, Ethiopia. Urban For. Urban Green. 43, 126357. doi:10.1016/j.ufug.2019.05.019
González-Saucedo, Z. Y., González-Bernal, A., and Martínez-Meyer, E. (2021). Identifying priority areas for landscape connectivity for three large carnivores in northwestern Mexico and southwestern United States. Landsc. Ecol. 36 (3), 877–896. doi:10.1007/s10980-020-01185-4
Grimm, N. B., Foster, D., Groffman, P., Grove, J. M., Hopkinson, C. S., Nadelhoffer, K. J., et al. (2008). The changing landscape: Ecosystem responses to urbanization and pollution across climatic and societal gradients. Front. Ecol. Environ. 6 (5), 264–272. doi:10.1890/070147
Grimmond, S. (2007). Urbanization and global environmental change: Local effects of urban warming. Geogr. J. 173 (1), 83–88. doi:10.1111/j.1475-4959.2007.232_3.x
Haddad, N. M., Brudvig, L. A., Clobert, J., Davies, K. F., Gonzalez, A., Holt, R. D., et al. (2015). Habitat fragmentation and its lasting impact on Earth’s ecosystems. Sci. Adv. 1 (2), e1500052. doi:10.1126/sciadv.1500052
He, X., Gao, Y., Niu, J., and Zhao, Y. (2011). Landscape pattern changes under the impacts of urbanization in the yellow river wetland––king zhengzhou as an example. Procedia Environ. Sci. 10, 2165–2169. doi:10.1016/j.proenv.2011.09.339
Heintzman, L. J., and McIntyre, N. E. (2019). Quantifying the effects of projected urban growth on connectivity among wetlands in the Great Plains (USA). Landsc. Urban Plan. 186, 1–12. doi:10.1016/j.landurbplan.2019.02.007
Hepcan, Ş., Hepcan, Ç. C., Bouwma, I. M., Jongman, R. H. G., and Özkan, M. B. (2009). Ecological networks as a new approach for nature conservation in Turkey: A case study of i?zmir Province. Landsc. Urban Plan. 90 (3–4), 143–154. doi:10.1016/j.landurbplan.2008.10.023
Hofman, M. P. G., Hayward, M. W., Kelly, M. J., and Balkenhol, N. (2018). Enhancing conservation network design with graph-theory and a measure of protected area effectiveness: Refining wildlife corridors in Belize, Central America. Landsc. Urban Plan. 178, 51–59. doi:10.1016/j.landurbplan.2018.05.013
Inkoom, J. N., Frank, S., Greve, K., Walz, U., and Fürst, C. (2018). Suitability of different landscape metrics for the assessments of patchy landscapes in West Africa. Ecol. Indic. 85, 117–127. doi:10.1016/j.ecolind.2017.10.031
Joly, C. A., Scarano, F. R., Bustamante, M., Gadda, T. M. C., Metzger, J. P. W., Seixas, C. S., et al. (2019). Brazilian assessment on biodiversity and ecosystem services: Summary for policy makers. Biota Neotrop. 19 (4). doi:10.1590/1676-0611-bn-2019-0865
Jongman, R. (2008). Ecological networks are an issue for all of us. J. Landsc. Ecol. 1 (1), 7–13. [Online]. doi:10.2478/v10285-012-0001-8
Jorgenson, A. K., and Burns, T. J. (2007). Effects of rural and urban population dynamics and national development on deforestation in less-developed countries, 1990?2000. Sociol. Inq. 77 (3), 460–482. doi:10.1111/j.1475-682X.2007.00200.x
Kong, F., Yin, H., Nakagoshi, N., and Zong, Y. (2010). Urban green space network development for biodiversity conservation: Identification based on graph theory and gravity modeling. Landsc. Urban Plan. 95 (1–2), 16–27. doi:10.1016/j.landurbplan.2009.11.001
Lechner, A. M., Harris, R. M. B., Doerr, V., Doerr, E., Drielsma, M., Lefroy, E. C., et al. (2015). From static connectivity modelling to scenario-based planning at local and regional scales. J. Nat. Conserv. 28, 78–88. doi:10.1016/j.jnc.2015.09.003
Li, H., Chen, W., and He, W. (2015). Planning of green space ecological network in urban areas: An example of Nanchang, China. Int. J. Environ. Res. Public Health 12 (10), 12889–12904. doi:10.3390/ijerph121012889
Liang, H., Chen, D., and Zhang, Q. (2017). Assessing urban green space distribution in a compact megacity by landscape metrics. J. Environ. Eng. Landsc. Manag. 25 (1), 64–74. doi:10.3846/16486897.2016.1210157
Liu, T., and Yang, X. (2015). Monitoring land changes in an urban area using satellite imagery, GIS and landscape metrics. Appl. Geogr. 56, 42–54. doi:10.1016/j.apgeog.2014.10.002
Liu, G., Yang, Z., Chen, B., Zhang, L., Zhang, Y., Su, M., et al. (2015). An ecological network perspective in improving reserve design and connectivity: A case study of wuyishan nature reserve in China. Ecol. Modell. 306, 185–194. doi:10.1016/j.ecolmodel.2014.10.004
Liu, Z., He, C., and Wu, J. (2016). The relationship between habitat loss and fragmentation during urbanization: An empirical evaluation from 16 world cities. PLoS One 11 (4), e0154613. doi:10.1371/journal.pone.0154613
Loro, M., Ortega, E., Arce, R. M., and Geneletti, D. (2015). Ecological connectivity analysis to reduce the barrier effect of roads. An innovative graph-theory approach to define wildlife corridors with multiple paths and without bottlenecks. Landsc. Urban Plan. 139, 149–162. doi:10.1016/j.landurbplan.2015.03.006
Magidi, J., and Ahmed, F. (2019). Assessing urban sprawl using remote sensing and landscape metrics: A case study of city of tshwane, south Africa (1984–2015). Egypt. J. Remote Sens. Space Sci. 22 (3), 335–346. doi:10.1016/j.ejrs.2018.07.003
Mahmoudzadeh, H. (2007). Digital change detection using remotely sensed data for monitoring green space destruction in Tabriz. [Online].
May, F., Rosenbaum, B., Schurr, F. M., and Chase, J. M. (2019). The geometry of habitat fragmentation: Effects of species distribution patterns on extinction risk due to habitat conversion. Ecol. Evol. 9 (5), 2775–2790. doi:10.1002/ece3.4951
McCarthy, M. P., Best, M. J., and Betts, R. A. (2010). Climate change in cities due to global warming and urban effects. Geophys. Res. Lett. 37 (9), 845. doi:10.1029/2010GL042845
McGarigal, K., and Marks, B. J. (1995). “Spatial pattern analysis program for quantifying landscape structure,” in Gen. Tech. Rep. PNW-GTR-351. US dep. Agric. For. Serv. Pacific northwest res. Stn., 1–122. [Online].
McRae, B. H., and Kavanagh, D. M. (2011). Linkage mapper connectivity analysis software. Seattle: Nat. Conserv. Seattle WA. [Online].
ming Zhao, S., fei Ma, Y., ling Wang, J., and yi You, X. (2019). Landscape pattern analysis and ecological network planning of Tianjin City. Urban For. Urban Green. 46, 126479. doi:10.1016/j.ufug.2019.126479
Minor, E. S., and Urban, D. L. (2008). A graph-theory framework for evaluating landscape connectivity and conservation planning. Conserv. Biol. 22 (2), 297–307. doi:10.1111/j.1523-1739.2007.00871.x
Mutuga, F. (2009). “The effect of urbanization on protected areas,” in The impact of urban growth on a wildlife protected area: A case study of nairobi national park. Available from: http://lup.lub.lu.se/student-papers/record/1513631.
Naghsh Moheet engineering consultant co (2014). Naghsh Moheet engineering consultant co. Tabriz, Iran: comprehensive plan of Tabriz city.
Narumalani, S., Mishra, D. R., and Rothwell, R. G. (2004). Change detection and landscape metrics for inferring anthropogenic processes in the greater EFMO area. Remote Sens. Environ. 91 (3–4), 478–489. doi:10.1016/j.rse.2004.04.008
Nations, U. (2018). Revision of world urbanization prospects. New York, NY, USA: United Nations. [Online].
Nogués, S., and Cabarga-Varona, A. (2014). Modelling land use changes for landscape connectivity: The role of plantation forestry and highways. J. Nat. Conserv. 22 (6), 504–515. doi:10.1016/j.jnc.2014.08.004
Nor, A. N. M., Corstanje, R., Harris, J. A., Grafius, D. R., and Siriwardena, G. M. (2017). Ecological connectivity networks in rapidly expanding cities. Heliyon 3 (6), e00325. doi:10.1016/j.heliyon.2017.e00325
Pan, Z., Wang, G., Hu, Y., and Cao, B. (2019). Characterizing urban redevelopment process by quantifying thermal dynamic and landscape analysis. Habitat Int. 86, 61–70. doi:10.1016/j.habitatint.2019.03.004
Qi, K., Fan, Z., Ng, C. N., Wang, X., and Xie, Y. (2017). Functional analysis of landscape connectivity at the landscape, component, and patch levels: A case study of minqing county, fuzhou city, China. Appl. Geogr. 80, 64–77. doi:10.1016/j.apgeog.2017.01.009
Rahimi, A. (2016). A methodological approach to urban land-use change modeling using infill development pattern—A case study in Tabriz, Iran. Ecol. Process. 5 (1), 1. doi:10.1186/s13717-016-0044-6
Riggio, J., and Caro, T. (2017). Structural connectivity at a national scale: Wildlife corridors in Tanzania. PLoS One 12 (11), e0187407. doi:10.1371/journal.pone.0187407
Sathler, D., Adamo, S. B., and Lima, E. E. (2019). Deforestation and local sustainable development in Brazilian legal amazonia: An exploratory spatial analysis. Anais, 1–39.
Saura Santiago, T. J., and lucía, P (2008). Conefor Sensinode 2.2. Lleida, Spain: Processing, 0–56. [Online]. Available from: http://www.conefor.org/files/usuarios/CS22manual.pdf.
Saura, S., and Pascual-Hortal, L. (2007). A new habitat availability index to integrate connectivity in landscape conservation planning: Comparison with existing indices and application to a case study. Landsc. Urban Plan. 83 (2–3), 91–103. doi:10.1016/j.landurbplan.2007.03.005
Seto, K. C., Guneralp, B., and Hutyra, L. R. (2012). Global forecasts of urban expansion to 2030 and direct impacts on biodiversity and carbon pools. Proc. Natl. Acad. Sci. U. S. A. 109 (40), 16083–16088. doi:10.1073/pnas.1211658109
Soons, M. B. (2003). Habitat fragmentation and connectivity: Spatial and temporal characteristics of the colonization process in plants. [Online].
Statistical Center of Iran Results of the general population and housing census of 2020, (2020). [Online]. Available from: https://www.amar.org.ir/english.
Su, W., Gu, C., Yang, G., Chen, S., and Zhen, F. (2010). Measuring the impact of urban sprawl on natural landscape pattern of the Western Taihu Lake watershed, China. Landsc. Urban Plan. 95 (1–2), 61–67. doi:10.1016/j.landurbplan.2009.12.003
Suksavate, W., Duengkae, P., and Chaiyes, A. (2019). Quantifying landscape connectivity for wild Asian elephant populations among fragmented habitats in Thailand. Glob. Ecol. Conserv. 19, e00685. doi:10.1016/j.gecco.2019.e00685
Sun, J., Wang, J., Wang, T., and Zhang, T. (2019). Urbanization, economic growth, and environmental pollution. Manag. Environ. Qual. Int. J. 30 (2), 483–494. doi:10.1108/MEQ-05-2018-0101
Taheri, M., Gholamalifard, M., Riahi Bakhtiari, A., and Rahimoghli, S. (2014). Land cover changes modeling of Tabriz township using artificial neural network and Markov chain. Phys. Geogr. Res. Q. 45 (4), 97–121. doi:10.22059/jphgr.2014.50075
Thompson, P. L., and Gonzalez, A. (2017). Dispersal governs the reorganization of ecological networks under environmental change. Nat. Ecol. Evol. 1 (6), 0162. doi:10.1038/s41559-017-0162
Tian, Y., Jim, C. Y., Tao, Y., and Shi, T. (2011). Landscape ecological assessment of green space fragmentation in Hong Kong. Urban For. Urban Green. 10 (2), 79–86. doi:10.1016/j.ufug.2010.11.002
Tian, Y., Jim, C. Y., and Wang, H. (2014). Assessing the landscape and ecological quality of urban green spaces in a compact city. Landsc. Urban Plan. 121, 97–108. doi:10.1016/j.landurbplan.2013.10.001
van Bohemen, H. (1998). Habitat fragmentation, infrastructure and ecological engineering. Ecol. Eng. 11 (1–4), 199–207. doi:10.1016/S0925-8574(98)00038-X
Vergnes, A., Le Viol, I., and Clergeau, P. (2012). Green corridors in urban landscapes affect the arthropod communities of domestic gardens. Biol. Conserv. 145 (1), 171–178. doi:10.1016/j.biocon.2011.11.002
Wang, Y., Chan, A., Lau, G. N., Li, Q., Yang, Y., Yim, S. H. L., et al. (2019). Effects of urbanization and global climate change on regional climate in the Pearl River Delta and thermal comfort implications. Int. J. Climatol. 39 (6), 2984–2997. doi:10.1002/joc.5996
Wang, T., Li, H., and Huang, Y. (2021). The complex ecological network’s resilience of the Wuhan metropolitan area. Ecol. Indic. 130, 108101. doi:10.1016/j.ecolind.2021.108101
Wanghe, K., Guo, X., Wang, M., Zhuang, H., Ahmad, S., Khan, T. U., et al. (2020). Gravity model toolbox: An automated and open-source ArcGIS tool to build and prioritize ecological corridors in urban landscapes. Glob. Ecol. Conserv. 22, e01012. doi:10.1016/j.gecco.2020.e01012
Wimberly, M. C., Narem, D. M., Bauman, P. J., Carlson, B. T., and Ahlering, M. A. (2018). Grassland connectivity in fragmented agricultural landscapes of the north-central United States. Biol. Conserv. 217, 121–130. doi:10.1016/j.biocon.2017.10.031
Xu, X., Duan, X., Sun, H., and Sun, Q. (2011). Green space changes and planning in the capital region of China. Environ. Manage. 47 (3), 456–467. doi:10.1007/s00267-011-9626-3
Xun, B., Yu, D., and Liu, Y. (2014). Habitat connectivity analysis for conservation implications in an urban area. Acta Ecol. Sin. 34 (1), 44–52. doi:10.1016/j.chnaes.2013.11.006
Zhang, L., and Wang, H. (2006). Planning an ecological network of Xiamen Island (China) using landscape metrics and network analysis. Landsc. Urban Plan. 78 (4), 449–456. doi:10.1016/j.landurbplan.2005.12.004
Zhang, Z. (2017). Enhancing landscape connectivity in detroit through multifunctional green corridor modeling and design. Available from: https://hdl.handle.net/2027.42/136561.
Zhang, Z., Meerow, S., Newell, J. P., and Lindquist, M. (2019). Enhancing landscape connectivity through multifunctional green infrastructure corridor modeling and design. Urban For. Urban Green. 38, 305–317. doi:10.1016/j.ufug.2018.10.014
Keywords: ecological network and corridor, landscape connectivity, graph theory, least-cost modeling, landscape metrics
Citation: Mahmoudzadeh H, Masoudi H, Jafari F, Khorshiddoost AM, Abedini A and Mosavi A (2022) Ecological networks and corridors development in urban areas: An example of Tabriz, Iran. Front. Environ. Sci. 10:969266. doi: 10.3389/fenvs.2022.969266
Received: 14 June 2022; Accepted: 13 July 2022;
Published: 22 August 2022.
Edited by:
Farshid Aram, Polytechnic University of Madrid, SpainReviewed by:
Sepideh Baghaee, Polytechnic University of Madrid, SpainEbrahim Solgi, Griffith Sciences, Griffith University, Australia
Copyright © 2022 Mahmoudzadeh, Masoudi, Jafari, Khorshiddoost, Abedini and Mosavi. This is an open-access article distributed under the terms of the Creative Commons Attribution License (CC BY). The use, distribution or reproduction in other forums is permitted, provided the original author(s) and the copyright owner(s) are credited and that the original publication in this journal is cited, in accordance with accepted academic practice. No use, distribution or reproduction is permitted which does not comply with these terms.
*Correspondence: Hassan Mahmoudzadeh, bWFobW91ZHphZGVoQHRhYnJpenUuYWMuaXI=
 Hassan Mahmoudzadeh
 Hassan Masoudi
 Firouz Jafari1
 Asghar Abedini
 Amir Mosavi