 Yiting Li
 Jinglin Deng
 Chuanfu Zang
 Ming Kong
 Jieni Zhao
- School of Geography, South China Normal University, Guangzhou, China
In the formulation of scientific water resource management systems and strategies for improving water resource utilization efficiency, the effects of land use change and climate change on the temporal and spatial distribution of water resources cannot be overlooked. And the Hanjiang basin is the main source of water supply to eastern Guangdong and southwestern Fujian, China. However, the basin is experiencing a significant imbalance between water resource supply and demand. This study investigated the spatiotemporal distribution of water resources in the Hanjiang River Basin under changing environmental conditions using the Soil and Water Assessment Tool model. The findings reveal that, from 1980 to 2020, changes in water resources significantly varied among sub-basins, reflecting spatial heterogeneity. Moreover, sub-basins with severe land use changes showed significant changes in water resources. From 1970 to 2020, the water resources of each sub-basin changed with climate change, indicating temporal variability. Under the combined effects of land use change and climate change, the amount of water resources decreased and its spatial distribution changed dramatically. At the same time, the evolution of water resources under climate change was consistent with that under the combined influence of both land use change and climate change, indicating that climate change is the primary driver. The findings provide theoretical guidance for water resource research and management.
1 Introduction
Water resources are one of the most important factors for maintaining ecosystem balance, human survival, and socio-economic development (Long et al., 2019). With the growth of the economy and society, human demand for water resources is growing, and the sustainable use of water resources has emerged as a major stumbling block to China’s growth (Piao et al., 2010). Changes in hydrological circumstances have potential long-term consequences on human civilization (Hall et al., 2014). Climate change and changes in land cover/use are frequently reported as two primary driving factors of hydrological change (Zhou et al., 2015) and are strongly associated with current and future water scarcity (Zhou et al., 2022). At long time scales, climate change plays a dominant role in influencing hydrological cycle processes in watersheds; at short time scales, land use change is one of the key factors influencing changes in hydrological elements in watersheds (Zhang et al., 2020a). Under the background of global warming, changes in rainfall, evaporation, runoff, and soil moisture will alter the global hydrological cycle, inducing a redistribution of water resources temporally and spatially (Xia et al., 2015). At the same time, continued population growth and highly intensive human activities also alter land cover conditions, which in turn induce changes in various hydrological processes such as infiltration and evaporation (Miller et al., 2014; Zang et al., 2015; Anand et al., 2018; Ross and Randhir, 2022). Many studies also suggest that land use change will negatively affect the sustainable use of water resources in the future (Shrestha et al., 2018; Ross and Randhir, 2022). The joint interaction of climate change and land use change has resulted in changes in terrestrial water cycle processes, redistribution of water resources on the ground, and even extreme hydrological events, further exacerbating the conflict between water supply and demand (Davis et al., 2015; Zang et al., 2015; Zhang et al., 2020b; Wu et al., 2021). In this context, the effects of climate change and human activities on water resources, as well as the characteristics of water resource evolution at the basin scale, should not be overlooked when developing scientific water resource management systems and strategies for improving water resource utilization efficiency.
As the impact of human activities and climate change on water resources is growing, the United Nations Educational, Scientific and Cultural Organization (UNESCO) Intergovernmental Hydrological Programme (IHP), International Geosphere Biosphere Programme (IGBP) and other large international scientific research programs are increasingly focusing on the impact of these two factors to establish a scientific foundation for the transformation and rational use of water resources (Sivakumar, 2011). Many researchers in China and worldwide have studied the effects of changing scenarios (such as land use change and climate change) on water resources under this setting. Piao et al. (2010) investigated the effects of climate change on water resources and agriculture in China by analyzing climate change trends and water resource trends (2010). Lotz et al. (2018) quantified the hydrological response of the Dongting Lake watershed in China to land use change using the Soil and Water Assessment Tool (SWAT) model, and they found that the transition from agricultural land to forest land reduced surface runoff and total water, while increasing evapotranspiration, subsurface flow, and groundwater flow (2018). Kundu et al. (2017) investigated the effects of climate and land use change on future water balance, and concluded that climate change has a stronger influence on water production, whereas land use change has a stronger influence on evapotranspiration (2017). In general, most studies have focused on changes in water resources within a single environment. In terms of research methods, many scholars have studied the use of various hydrological models to assess the combined effects of land use change and climate change. Among these, the SWAT model is an integrated tool for multidisciplinary studies at the regional scale in diverse physiographic and climatic conditions. It is also one of the most widely used watershed-scale models in the world today (Krysanova and White, 2015; Souffront Alcantara et al., 2019). Therefore, more in-depth quantitative analyses of the spatiotemporal evolution characteristics and driving mechanisms of water resources at the basin scale are required with the help of SWAT models, considering both human activities and climate change. Such analyses are critical for water resource planning and management.
Apart from the Pearl River Basin, eastern Guangdong and southern Fujian in China rely significantly on the Hanjiang River for water. With a population of over 10 million people and a combined regional gross domestic product (GDP) of over 190 billion Yuan, the Hanjiang River Basin is the second-largest basin in Guangdong (Li et al., 2021), and occupies a very important position in the economic and social development of Guangdong. In the context of global climate change, changes in the runoff of the Hanjiang River Basin are becoming increasingly significant, with frequent floods in local areas in the flood season and more severe water shortages or even severe droughts in the non-flood season (Feng and Hu, 2021). For example, the Hanjiang River Basin suffered the most severe drought in 60 years in 2017. As precipitation is the primary source of water in the Hanjiang River Basin, climate change directly affects the spatiotemporal distribution of water resources in the basin (Li et al., 2021). With the implementation of the reform and opening up of China since 1978, the Hanjiang River Basin has experienced rapid economic development, and with urbanization, land use types in the Hanjiang River Basin have shifted substantially (Zhang, 2007), which affect hydrological processes such as runoff confluence, evaporation, and dispersion. Major reservoirs in the Hanjiang River Basin have limited water storage capacity, with their total water storage capacity accounting for only about 5% of the water resources in the entire basin, which is far below the national average 12% (Li et al., 2021). Therefore, the basin has limited resistance to extreme hydrological events.
This study investigated the spatiotemporal distribution of water resources in the Hanjiang River Basin considering changes in human activities and climatic conditions. The effects of climate change and land use type change on both the temporal and spatial variability of water resources in the Hanjiang River Basin under several scenarios were quantitatively analyzed using the SWAT model. Furthermore, the geographical distribution pattern of water resources was investigated at the basin scale. The geographical distribution and usage of water resources were combined to obtain a theoretical foundation and scientific basis for the integrated management, water security, ecological security, and long-term economic growth of the Hanjiang River Basin. The findings will promote rational scheduling and management of water resources in the basin, modernization of the water governance system and governance capacity in the basin, and high-quality, long-term economic growth in the basin.
2 Study area
The Hanjiang River Basin is mainly located in eastern Guangdong and southwestern Fujian, China. It covers some counties and cities in Guangdong, Fujian, and Jiangxi provinces (Figure 1). Following the Pearl River Basin, this basin is the second-largest river basin in Guangdong Province. The area of the basin is 30,112 km2, of which 13,929 km2 (46.3%) is covered by the Meijiang River, 11,802 km2 (39.2%) by the Ting River, 3,346 km2 (11.1%) by the Hanjiang River, and 1,035 km2 (3.4%) by the Hanjiang River Delta (below Chaoan Station). The Hanjiang River Basin is located in the subtropical southeast Asian monsoon region, which has subtropical climate. The climate is hot and humid, with abundant rainfall and frequent rainstorms. The annual average rainfall is approximately 1,600 mm. Precipitation shows uneven annual distribution and wide spatial variability, controlled by the topography.
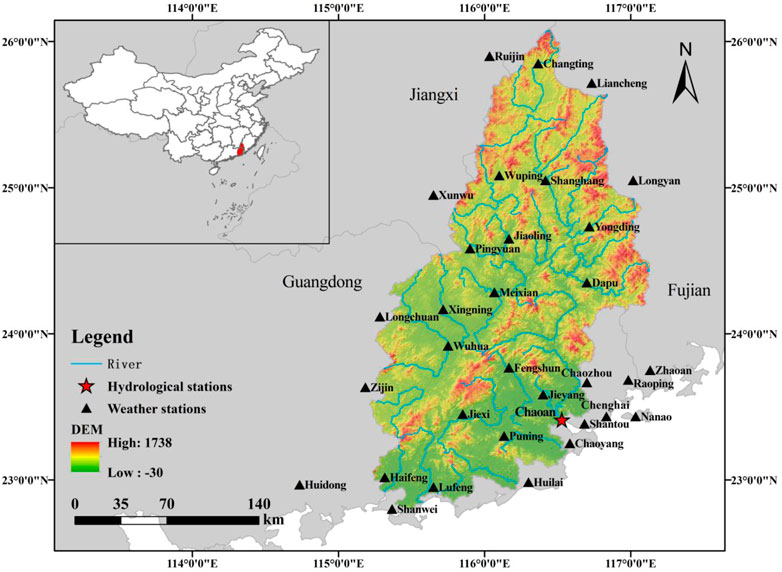
FIGURE 1. Location and distribution of meteorological stations in the Hanjiang River Basin, China.
The variability of annual rainfall in the Hanjiang River Basin causes large disparities in runoff in the dry and flood seasons, with the average discharge in the flood season being 2.7 times that of the dry season. The total annual runoff is 24.5 billion m3, the average depth of yearly runoff is 600–1,200 mm, the average annual runoff coefficient is 0.51, and the yearly runoff distribution is unbalanced. Approximately 80% of the yearly runoff occurs from April to September. The spatial distribution of runoff is roughly consistent with the rainfall distribution. The topography of the Hanjiang River basin is predominantly mountainous and hilly. The mountainous area accounts for 70% of the total basin area, mostly distributed in the northern and central regions, and the general elevation is above 500 m. Hilly areas account for 25% of the total basin area, mostly distributed in the Meijiang River Basin and other major tributaries, with a general elevation below 200 m. Plain areas account for 5% of the total basin area, mostly in the delta downstream of the Hanjiang River, with a general elevation below 20 m. The main land use types are forest, cultivated land, grassland, and construction land, covering about 97% of the basin area.
3 Materials and methods
3.1 Materials
It is necessary to collect and preprocess relevant data of the Hanjiang River Basin and finally import the model database. The construction of the SWAT model required the import of sub-catchment data along with other data. The required data include Digital Elevation Model Data (DEM), land use data, soil data, and meteorological data (Table 1).
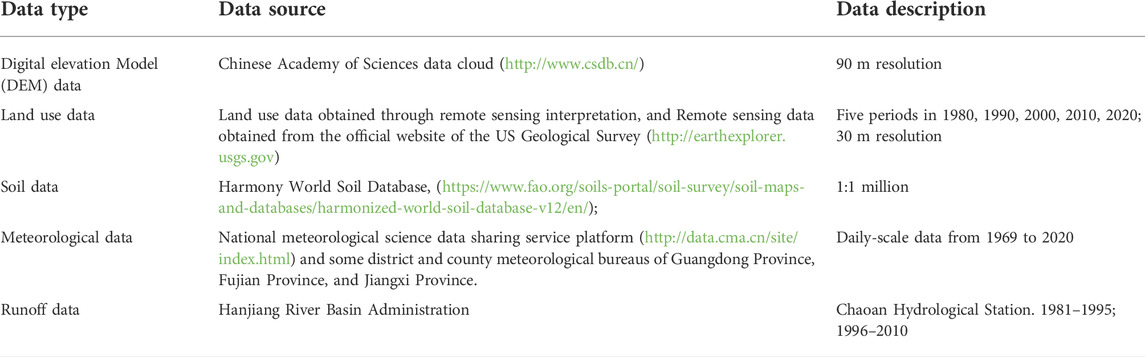
TABLE 1. Data used to construct the Soil and Water Assessment Tool for the Hanjiang River Basin, China.
It is an important step to make sure the variables meet the underlying assumptions of the algorithms before conducting any statistical analyses. Therefore, following data collection, many types of data must be processed. Considering the Digital Elevation Model Data and Land-Use and Land-Cover Change Data are consistent with the target data properties required for modeling, we do less transformation processing on these data. Contrarily, conversion processing is necessary for the original soil and meteorological data since their characteristics differ from those needed to create the model. First, the raw Digital Elevation Model Data was processed with Arcgis software. Second, the land use categories map was reclassified in accordance with the watershed’s real circumstances using the Land-Use and Land-Cover Change classification method, which corresponds to CropLu and UrbanLu, and ultimately the five reclassified land use maps were obtained. Third, the processing and integration of soil data is required for the building of the hydrological model. As a result, we gathered soil type and property data from the World Soil Database and then utilized the Soil-Plant-Atmosphere-Water (SPAW) program created by Washington State University to compute soil bulk density, effective field capacity, saturated hydraulic conductivity, and other parameters. Forth, for this study, observational data from 32 meteorological stations in the Han River watershed from 1969 to 2020 must be processed. In order to create the weather file needed for modeling, the data must first be sorted and validated before being fed into the weather generator.
3.2 Hydrological model: Soil and water assessment tool
Soil and Water Assessment Tool (SWAT) utilizes meteorological, hydrological, and management data to calculate the internal circulation of each hydrologic response unit (HRU) individually. The model then groups them into sub-basins and connects them organically through the river network to approximate surface catchments. Therefore, the model can not only evaluate the distribution of water resources but also identify and simulate non-point source pollution in critical areas (Arnold et al., 1998). Currently, the SWAT model has been widely used to simulate and assess the impact of land use change on watershed hydrology (Gassman et al., 2007). Therefore, the hydrological module of this model was selected to simulate hydrological processes in the Hanjiang River Basin.
SWAT simulates two types of hydrological processes: the hydrological cycle and the confluence phase. The water balance equation is the foundation of the hydrological cycle (Osei et al., 2019):
In Eq. 1, SWt is the final soil water content (mm); SW0 is the pre-soil water content (mm); t is the time step (d); Pday is precipitation on day i (mm); Qsurf is surface runoff on day i (mm); Ea is evapotranspiration on day i (mm); Wseep is soil infiltration and lateral flow on day i (mm); and Qgw is subsurface runoff on day i (mm).
In this study, ArcSWAT version 2012 was used for the construction and running of the SWAT model after data pre-processing. The watershed was divided into 48 sub-basins with topographic data and minimum catchment area (CSA) thresholds from the Digital Elevation Model Data of the Hanjiang River Basin. Secondly, the sub-basins were further divided into 931 HRUs within each sub-basin based on a combination of specific land use and soil type thresholds to ensure that the entire sub-basin area was modeled. Finally, 32 meteorological stations and related files were written for the period 1969–2020. After selecting the suitable calculation technique and output items, the commands to run the model were executed.
Before calibrating the model, the parameters that have the most influence on the streamflow simulation need to be estimated by sensitivity analysis. Since ArcSWAT contains a large number of hydrological parameters and all of them may have an impact on the model effects, important input parameters for the simulation need to be identified (Uniyal et al., 2015). After the SWAT model run is completed, the model needs to be calibrated and validated to evaluate its applicability. SWAT-CUP (Calibration and Uncertainty Program) is a stand-alone program developed to calibrate SWAT (Abbaspour et al., 2007). The procedure evaluates the sensitivity of model parameters using multiple regression values of the objective function based on Latin hypercube sampling, integrating the SUFI2 (Sequential Uncertainty Fitting) algorithm, PSO (Particle Swarm) algorithm, GLUE (Maximum Likelihood) algorithm, ParaSol algorithm, and MCMC (Monte Carlo) algorithm. The SUFI2 algorithm is a method for calculating the objective function by randomly generating a set of parameters substituted into SWAT by the Latin-Hypercube simulations (Abbaspour et al., 2015).
Especially in hydrology, correlation and correlation-based measures such as the coefficient of determination and the Nash-Sutcliffe coefficient have been widely used to evaluate the “goodness-of-fit” of hydrologic and hydroclimatic models (Legates and McCabe, 1999). Coefficient of determination is a useful metric for a general interpretation of the efficiency of a model or a part (Nash and Sutcliffe, 1970), as it is widely used not only in hydrology but also for modeling and forecasting purposes in domains related to ecology, agriculture, and climatology (Onyutha, 2022). Its value ranges from 0 to 1. The higher value of it is associated with an effective model. However, it’s value can be low and high for an accurate and imperfect model, respectively. Meanwhile, it does not quantify a model’s bias (Onyutha, 2022). Therefore, the coefficient of efficiency such as the Nash-Sutcliffe coefficient improve the coefficient of determination for model evaluation purposes, as it is sensitive to differences in the observed and model- simulated means variances (Legates and McCabe, 1999). For that reason, modelers, especially hydrologists, tend to agree that the NSE is the optimal version of R-squared in general (Nash and Sutcliffe, 1970; Kvålseth, 1985). The value range of Nash-Sutcliffe coefficient is (−∞, 1], when Ens = 1, the simulation effect is the best; when Ens < 0, it indicates that the simulated and actual values are poorly fitted (McCuen et al., 2006). Many scholars believe that the simulation of the model is considered good when Ens > 0.75, good when Ens is between 0.36 and 0.75, and poor when Ens < 0.36 (Santhi et al., 2001; McCuen et al., 2006). R2 and Ens are calculated as follows.
In the equation,
In this study, the Chaoan station, an important hydrological station in the Han River basin, was selected to calibrate the model for the monthly runoff in the Han River basin from 1969 to 2020 with a simulation step of months. Among them, 1969–1980 is set as the pre-calibration period, 1981–1995 as the calibration period, and 1996–2010 as the validation period. The SWAT model was run with the important complementary tool SWAT-CUP which provides the SUFI2 algorithm to perform parameter sensitivity analysis and rate and validate the sensitive parameters to make the model accurate.
3.3 Water resource statistics
3.3.1 Calculation of water resources
When calculating water resources, this study did not simply count the surface runoff of each sub-basin. Instead, the sum of seepage, surface runoff, and lateral flow in the root zone was calculated using SWAT model simulations based on the main components and functions of water resources and combined with the Hanjiang River basin’s characteristics.
In Eq. 4, i represents the i-th HRU and n represents the total number of HRUs; W is the total water resources (m3); PREC is seepage in the root zone during the time step (mm); SURQ is the surface runoff generated by the hydrologic response unit (HRU) within a certain period of time (mm); LATQ is lateral flow generated in the HRU during timestep (mm).
3.3.2 The relative change rate
Under various scenarios, the relative rate of change of water resources in the basin might reflect the change of water resources (Zang et al., 2012). The relative change rate (RCR) of water resources in different periods can be expressed as:
In Eq. 5, RCR is the relative rate of change in water resources, W is the water resource for each scenario, and W1 and W2 are the water resources in the previous and latter period, respectively.
3.4 Scenario settings
After completing model evaluation, eight scenarios were set up (Figure 2; Table 2) to quantitatively analyze the changes in the spatial and temporal distribution of water resources in the basin under human activities and climate change. Based on these scenarios, the effects of land use variability, climate change on water resources were assessed, as well as their combined impacts.
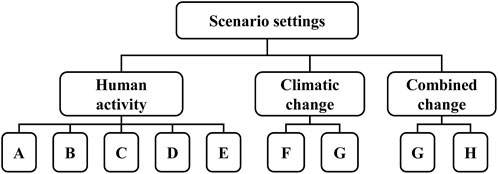
FIGURE 2. Scenarios and conditions considered for analysis.
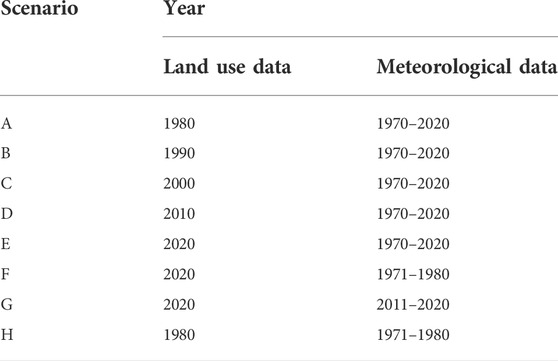
TABLE 2. Periods of land use and meteorological data considered in the scenarios.
The periods of data used in eight simulation experiments are as follows. In Scenarios A, B, C, D, and E, meteorological data of 1970–2020 were used. Regarding land use data for these scenarios, data of 1980 were used for Scenario A, 1990 for Scenario B, 2000 for Scenario C, 2010 for Scenario D, and 2020 for Scenario E. For Scenario F, land use data of 2020 and meteorological data of 1971–1980 were used. For Scenario G, land use data of 2020 and meteorological data of 2011–2020 were used. For scenario H, land use data of 1980 and meteorological data of 1971–1980 were used. Scenarios A–E were compared to analyze the impact of land use change on the spatial and temporal distribution of water resources. By comparing scenarios F–G, the impact of climate change on the spatial and temporal distribution of water resources was investigated. Scenario G was compared with Scenario H to assess the impact of the two combined scenarios on the spatial and temporal distribution of water resource.
4 Results
4.1 Validation results
The calibration and validation of the SWAT model simulations of the downstream hydrographic station (Chaoan Station) provided satisfactory results (Figure 3). The correlation coefficient R2 and the Nash-Sutcliffe efficiency coefficient were used to evaluate the SWAT model simulation results. For the calibration period, R2 = 0.95 and Ens = 0.94, and for the validation period, R2 = 0.95 and Ens = 0.93. The accuracy of the runoff simulation values for the calibration and validation periods was high, and the high R2 indicates that the simulated and observed runoffs are highly correlated. Overall, the model simulation results were satisfactory, indicating the applicability of the model to the analysis of the regional and temporal distribution of water resources in the Hanjiang River Basin under changing conditions.
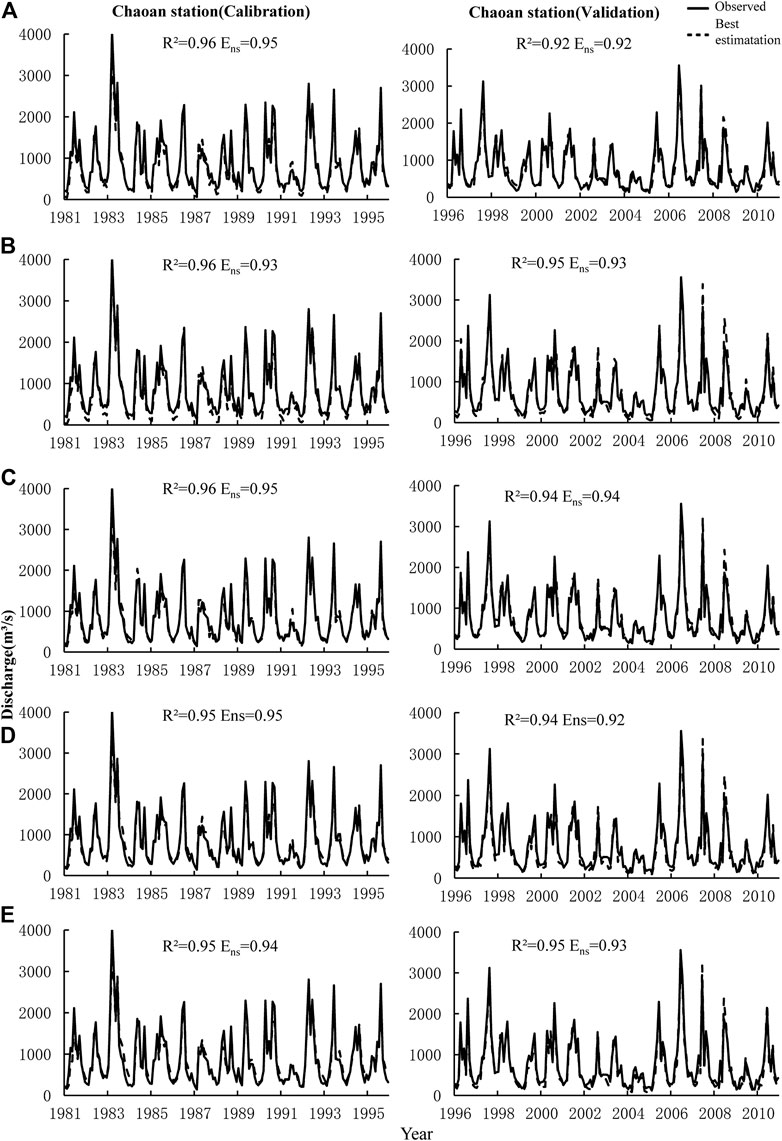
FIGURE 3. Under (A–E) scenarios, comparison of the soil and water assessment tool (SWAT) models simulations results to observed data for the Chaoan station over the calibration (1981–1995) and validation periods (1996–2010) in the Hanjiang River Basin, China (expressed as 95% prediction uncertainty band).
4.2 Impact of land use change
The flow of water in the Hanjiang River Basin, as well as the spatial and temporal distribution of water resources, has changed as a result of human activity. Land use categories in the basin have shifted as a result of human activity, and the nature of the substratum affects water cycle processes, resulting in changes in water resources. Under changing land use types from 1980 to 2020, the magnitude of changes in water resources and the magnitude of changes in the sub-basins of the Hanjiang River Basin fluctuated.
The most dramatic change in water resources was observed between 1980 and 1990 (Scenario A to Scenario B), as shown in Figure 4. Water resources in all sub-basins increased by an average of 36.20%. The increase in construction land and decline in farmland and forest area are the primary causes of the significant increase in water resources in the midstream and downstream areas. The loss of cropland and woodland eventually resulted in an increase in surface runoff and an increase in the total water resources, whereas the increase in the area of impervious surface negatively influences water infiltration.

FIGURE 4. Water resources in the Hanjiang River Basin in different human activity scenarios. The impacts were assessed with relative change rate.
No significant change in water resources was observed between 1990 and 2000 (Scenario B to Scenario C). A decline in water resources was observed in all sub-basins, but the decrease was small, with an average change of 15.01%. Although the amount of land used for construction has increased in some sub-basins, the area of forest land has also increased. Moreover, the increase in forested land is more notable than the increase in land used for construction, reducing the flow of water.
The change in water resources in each sub-basin from 2000 to 2010 (Scenarios C to D) was essentially the same as that from 1990 to 2000 (Scenarios B to C), although with a comparatively large reduction. The area of forest land increased in the downstream western sub-basin and the area of mixed wetlands increased in the upstream eastern sub-basin, with relatively considerable water resources losses in these areas.
Water resources increased in all sub-basins from 2010 to 2020 (Scenarios D to E), but not significantly. It increased considerably in individual sub-basins owing to the significant expansion in built-up land area in this region. In these scenarios, urbanization altered the spatial distribution of water while increasing water resources in all sub-basins.
In this equation, W1 and W2 are the water resources in the previous and latter period respectively.
4.3 Impact of climate change
According to variations in annual average precipitation and annual average temperature throughout the basin and in each sub-basin from 1970 to 2020, temperature continuously increased every year, while precipitation exhibited significant temporal and spatial variability (Figure 5). After analyzing changes in water resources in the basin under climate change scenarios, changes in water resources were found to be concentrated in the midstream and downstream areas, as well as the lower reaches (Figure 6). Water resources increased significantly in the midstream and downstream areas of the sub-basin, with an average rate of change of approximately 20%. In contrast water resources decreased in the eastern half of the downstream sub-basin, with an average rate of change of approximately 18%. These variabilities are mostly attributable to changes in precipitation and temperature. Temperature exhibited a continuous increase on a basin-wide scale, while precipitation in the middle and upper reaches increased and subsequently decreased, as a result of which water resources increased in some of the midstream sub-basins. From 1970 to 2020, the eastern sub-basin of the lower reaches experienced a decline in water resources due to a decrease in precipitation and an increase in temperature. On this basis, both temperature and precipitation can be ascertained to influence the spatial and temporal distribution of water resources in the Hanjiang River Basin. Specifically, temperature exhibited a rising trend from 1970 to 2020, whereas precipitation exhibited variable increase with uneven spatial distribution. Moreover, precipitation widely varied among sub-basins, which may lead to increased differences in the spatial and temporal distribution of water resources.

FIGURE 5. Climate change at meteorological stations in the Hanjiang River basin from 1970 to 2020.
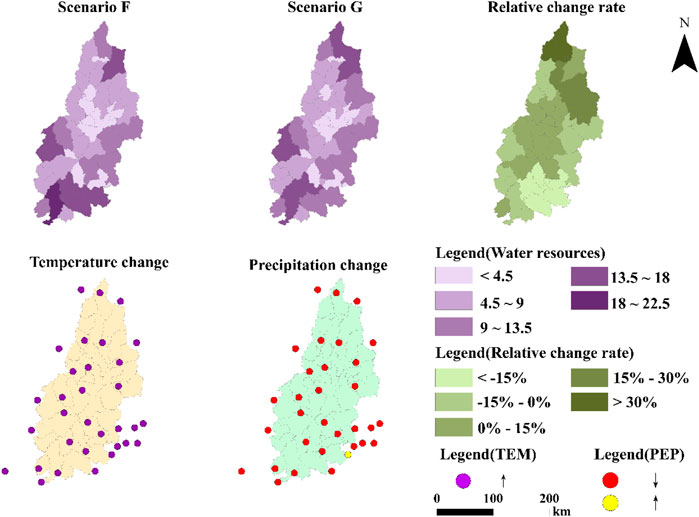
FIGURE 6. Climate change in the Hanjiang River Basin and changes in water resources in the sub-basins under the influence of climate change. The impacts were assessed with relative change rate.
In this equation, W1 and W2 are the water resources in the previous and latter period respectively.
4.4 Impact of land use change and climate change
The total water resources in the basin decreased by 8.92 million m3 as a result of human activities and climate change, but total evapotranspiration increased by 9.09 million m3. According to the water balance formula, the overall change in total water resources and total evapotranspiration in the Hanjiang River Basin were almost equivalent. According to water change rate statistics for each sub-basin between 1980 and 2020, water resources exhibited a rising trend in 31 sub-basins, accounting for 65% of the entire basin, and it exhibited a declining trend in 16 sub-basins, accounting for 35%. The rates of change of water resources in each sub-basin from 1980 to 2020 are compared in Figure 7. The figure reveals that the spatial distribution of water resources in the Hanjiang River Basin has dramatically changed over the years. Water resources dramatically changed in the middle and upper reaches of the basin, leading to considerable increases in overall water resources, with an average rate of change of more than 16%. Water resources dramatically increased in most of the central sub-basins, with some sub-basins experiencing a rate of change of more than 30%. Human activities changed the land use type between 1980 and 2020, as reflected by the following changes. With the increase in the area of building land, surface water infiltration was decreased and the water resources increased. The decrease in water resources in the southern sub-basin was more noticeable, with an average rate of change of more than 15%. According to the above finding, this decrease in water resources is primarily attributable to climate change, as the temperature of the region continuously increased from 1980 to 2020, whereas precipitation decreased.
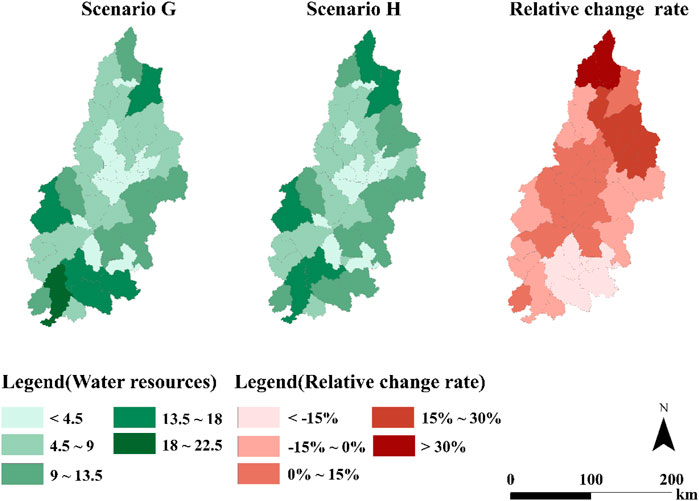
FIGURE 7. Changes in water resource at the sub-basin scale under the influence of combined conditions.
Analyzing the changes in the basin’s total water resources under the combined change scenario reveals a decline in the basin’s total water resources, which implies that the degree of the influence of climatic conditions on water resource changes may be greater than that caused by changes in land use. Additionally, each sub-basin’s water resources are roughly comparable to those in each sub-basin in a scenario of climate change, suggesting that the climate may have been the primary driver of water resource evolution in the Hanjiang River basin.
In this equation, W1 and W2 are the water resources in the previous and latter period respectively.
5 Discussion
Taking the Hanjiang River Basin as the research object, this study investigated the spatial and temporal distribution characteristics of water resources under changing conditions, and quantitatively analyzed the influence of different conditions on water resources. This study fills a gap in existing studies and provides a theoretical basis for the planning and management of water resources in the Hanjiang River Basin. Two main findings can be deduced from the results: first, anthropogenic land use change has significantly altered the geographical and temporal distribution patterns of water resources; second, the temporal variability of water resources is more prominent with climate change, and the evolution characteristics of water resources under climate change are more consistent with those under the combined influence of both land use change and climate change.
Changes in land use type driven by human activities were found to directly alter the geographical and temporal distribution of water resources in the Hanjiang River Basin. Between 1980 and 2020, the regional and temporal distribution of water resources in the Hanjiang River Basin changed dramatically, but the overall change in the amount of water resources was very small. Changes in land use can affect water production by altering hydrological processes such as evapotranspiration and soil moisture dynamics (Sterling et al., 2013; Anand et al., 2018; Zhang et al., 2018). The land cover pattern within the Hanjiang River Basin has changed dramatically with the development of the social economy since the reform and opening up of China starting from 1978 (Zhang, 2007). The area of construction land within the basin increased significantly from 1980 to 2020, with an average change rate of more than 200%. The impervious ground of construction land to some extent reduces the production sink time and increases the flood peak, leading to an increase in regional water production (Miller et al., 2014; Strohbach et al., 2019). It is noteworthy that forest land is the primary land use type in the Hanjiang River Basin (Zhang, 2007). Changes in the extent of forest land are also important to the development of water resources in the basin, and the loss of woodland area negatively influences the processes of vegetation retention, lateral flow, and evapotranspiration, resulting in an increase in runoff (Brown et al., 2005; Foley et al., 2005; Sajikumar and Remya, 2015). Consequently, the spatial distribution pattern of water resources within the Hanjiang River Basin was altered. Therefore, the major reasons for the change in the spatial and temporal distribution of water resources are the growth in building land and the reduction in forest land caused by human activities.
Regarding the evolution of water resources under climate change, changes in climatic conditions from 1970 to 2020 induced significant temporal variability of water resources in the Hanjiang River Basin. In addition, the characteristics of changes in water resources were similar to those under combined conditions. Climate change (i.e., rising temperatures and changing rainfall patterns) is anticipated to have a major influence on the hydrological cycle by altering the spatial and temporal distribution of water cycle elements such as precipitation, evaporation, runoff, and soil moisture, which are predicted to affect the reallocation of water resources (Wu et al., 2012; Wang et al., 2013; Zang and Liu, 2013). Precipitation in the Hanjiang River Basin fluctuated downward from 1970 to 2020 while temperature continuously increased, resulting in increased evapotranspiration (Li and Fang, 2021). Consequently, the average annual surface runoff, baseflow, groundwater recharge, and thus total water quantity in the basin decreased. Furthermore, the characteristics of the changes in water volume varied with climate change in each sub-basin from 1970 to 2020, and the changes in water volume were more significant in sub-basins with more fluctuating climatic conditions, indicating that climate change is the main driver of natural temporal changes in the total water volume and water distribution in the basin. Furthermore, changes in the water volume in each sub-basin under climate change were similar to those under combined conditions, indicating that climate change is currently the most influential factor controlling the spatial and temporal evolution of water resources in the Hanjiang River Basin.
Compared to previous research findings, the current study presents similar but distinct findings. From a common point of view, climate change affects the evolution of water resources over time, and the effects of climate change are stronger than that of land use (Hagemann et al., 2013; Anand et al., 2018; Shrestha et al., 2018; Ross and Randhir, 2022). However, because anthropogenic land use change does not always imply a change in total water resources but rather changes in the distribution pattern of water resources, its impact is more visible at the basin scale (Zang et al., 2015; Anand et al., 2018; Ross and Randhir, 2022). In terms of various factors, some scholars have explored future climate change trends and their impact on water resources using climate change models and concluded that water resources in southern China will decrease significantly (Hagemann et al., 2013; Ljungqvist et al., 2016). In contrast, the results of this study suggest that the decreasing trend of future water resources in the Hanjiang River Basin is not significant. The difference between the findings of this study and previous studies can be attributed to the difference in the approaches employed. In this study, the evolution of water resources under climate change conditions was investigated with the scenario setting approach, and because the number of scenarios established is limited, the difference in the time scales of the climate change scenarios might lead to varying results.
We provide the following recommendations in light of the findings of this research and the situation of the water resources in the Hanjiang River Basin. First, strengthen restrictions on the use of water resources, such as strengthening oversight of water resources of crucial sub basins, and severely limit activities that have a negative impact on water resources. Second, we should standardize water consumption and promote water conservation at the source in important sectors of the economy, including agriculture and industry. Third, improve the functional control and allocation of water resources, as well as the management of water intake licenses and the management of planned and quota water consumption; Stop illegal groundwater exploitation and strengthen groundwater management and protection. The above ideas enable the sustainable expansion of the economy, society, and ecological environment by following the law of change to the management of water resources in a scientific and efficient manner.
Although the spatiotemporal evolution of water resources was comprehensively analyzed, some limitations still remain and they need to be further investigated. First, there are uncertainties in the simulation of the hydrological model (SWAT). In this study, monthly runoff data from the Chaoan station covering 1981–2010 were used to calibrate and validate the model, and the spatial location of the hydrological station will affect the model simulation performance. Second, the climate change scenarios and integrated scenarios in this study are relatively simple. Therefore, more climate change scenarios are required to analyze the specific impact mechanisms of climate change. Third, only a few indicators were considered to examine land use change induced by human activities. Moreover, the influence mechanism of each land use type on the evolution of water resource is still unknown. To clarify the influence mechanism of each land use type on water resources, subsequent studies should consider multiple indicators to evaluate land use change. Fourth, other factors such as topography, geochemistry, and the dynamic evolution of species communities may also have an impact on how watershed water resources evolve, making it possible to conduct a more comprehensive study of this evolution in the future based on the aforementioned aspects.
6 Conclusion
In this study, the SWAT model was calibrated and validated using monthly runoff data covering 1969–2020 from the Chaoan hydrological station in the Hanjiang River Basin, and eight types of scenarios were set up to quantitatively analyze the influence of anthropogenic land use change and climate change on the regional and temporal evolution of water supply in the Hanjiang River. From the results, the following conclusions can be drawn.
Under the influence of human activities, the distribution of water resources in the Hanjiang River Basin exhibited spatial heterogeneity between 1980 and 2020, which is mostly expressed in the varied evolution of water resource among sub-basins. Rapid development in the basin has had an impact on the water cycle, aggravating disparities in water distribution across the basin. Changes in land use type due to human activities bring about changes in hydrological processes within the basin, thus changing the spatial and temporal distribution of water resources. These results suggest that land use changes are the primary factor controlling the spatial evolution of water resources.
Under the climate pattern of continuous rise in temperature and fluctuating decline in precipitation from 1970 to 2020, hydrological processes and elements exhibited various changes, which in turn reflect the influence of temperature and precipitation on water resources. These changes indicate the temporal variability of the evolution of water resources in the Hanjiang River Basin.
The total water resources in the Hanjiang River Basin decreased by 8.92 million m³ under the combined conditions (i.e., land use change and climate change), and the changes in water volume varied among sub-basins. Nevertheless, the changes in water volume caused by climate change were more consistent with the combined conditions, indicating that climate change is the main driver of the natural evolution of water resources in the Hanjiang River Basin.
The findings of this study may provide scientific guidance for determining the spatial and temporal distribution of water resources and hydrological processes at a basin scale in basins across the world with similar natural characteristics. The findings can also serve as a reference for investigating the spatial and temporal evolution of water resources in basins under changing conditions. The findings have potential applicability in integrated planning and efficient utilization of water resource in basins with similar conditions around the world, including southern China.
Data availability statement
The original contributions presented in the study are included in the article/Supplementary Materials, further inquiries can be directed to the corresponding author.
Author contributions
YL, JD, and CZ: Methodology, software, validation, formal analysis, investigation, resources, data curation, writing-original draft, writing-review and editing, visualization, supervision. YL, JD, MK, JZ, and CZ: Formal analysis, investigation, resources, data curation, writing-review and editing, visualization. YL, JD, MK, and CZ: conceptualization, methodology, software, formal analysis, investigation, resources, data curation, writing-original draft, writing-review and editing, visualization, supervision, project administration.
Funding
This research was supported by Forestry ecological monitoring network platform construction (Nos. 2021-KYXM-09; 2021-KYXM-09-001), and the Guangdong Natural Science Foundation (No. 2019A1515011627).
Acknowledgments
We thank the Field Scientific Observation and Research Station of Hanjiang River in Guangdong province, we also thank my other colleagues’ valuable comments and suggestions that have helped improve the manuscript.
Conflict of interest
The authors declare that the research was conducted in the absence of any commercial or financial relationships that could be construed as a potential conflict of interest.
Publisher’s note
All claims expressed in this article are solely those of the authors and do not necessarily represent those of their affiliated organizations, or those of the publisher, the editors and the reviewers. Any product that may be evaluated in this article, or claim that may be made by its manufacturer, is not guaranteed or endorsed by the publisher.
References
Abbaspour, K. C., Rouholahnejad, E., Vaghefi, S. R. I. N. I. V. A. S. A. N. B., Srinivasan, R., Yang, H., and Kløve, B. (2015). A continental-scale hydrology and water quality model for Europe: Calibration and uncertainty of a high-resolution large-scale SWAT model. J. hydrology 524, 733–752. doi:10.1016/j.jhydrol.2015.03.027
Abbaspour, K. C., Yang, J., Maximov, I., Siber, R., Bogner, K., Mieleitner, J., et al. (2007). Modelling hydrology and water quality in the pre-alpine/alpine Thur watershed using SWAT. J. hydrology 333 (2-4), 413–430. doi:10.1016/j.jhydrol.2006.09.014
Anand, J., Gosain, A. K., and Khosa, R. (2018). Prediction of land use changes based on Land Change Modeler and attribution of changes in the water balance of Ganga basin to land use change using the SWAT model. Sci. total Environ. 644, 503–519. doi:10.1016/j.scitotenv.2018.07.017
Arnold, J. G., Srinivasan, R., Muttiah, R. S., and Williams, J. R. (1998). Large area hydrologic modeling and assessment part I: Model development 1. J. Am. Water Resour. Assoc. 34 (1), 73–89. doi:10.1111/j.1752-1688.1998.tb05961.x
Brown, A. E., Zhang, L., McMahon, T. A., Western, A. W., and Vertessy, R. A. (2005). A review of paired catchment studies for determining changes in water yield resulting from alterations in vegetation. J. hydrology 310 (1-4), 28–61. doi:10.1016/j.jhydrol.2004.12.010
Davis, J., O'Grady, A. P., Dale, A., Arthington, A. H., Gell, P. A., Driver, P. D., et al. (2015). When trends intersect: The challenge of protecting freshwater ecosystems under multiple land use and hydrological intensification scenarios. Sci. Total Environ. 534, 65–78. doi:10.1016/j.scitotenv.2015.03.127
Feng, Y., and Hu, M. (2021). Spatial-temporal characteristics of extreme hydrological events in Hanjiang River basin. Northwest Hydropower 05, 1–9+16. doi:10.3969/j.issn.1006-2610.2021.05.001
Foley, J. A., DeFries, R., Asner, G. P., Barford, C., Bonan, G., Carpenter, S. R., et al. (2005). Global consequences of land use. science 309 (5734), 570–574. doi:10.1126/science.1111772
Gassman, P. W., Reyes, M. R., Green, C. H., and Arnold, J. G. (2007). The soil and water assessment tool: Historical development, applications, and future research directions. Trans. ASABE 50 (4), 1211–1250. doi:10.13031/2013.23637
Hagemann, S., Chen, C., Clark, D. B., Folwell, S., Gosling, S. N., Haddeland, I., et al. (2013). Climate change impact on available water resources obtained using multiple global climate and hydrology models. Earth Syst. Dyn. 4 (1), 129–144. doi:10.5194/esd-4-129-2013
Hall, J. W., Grey, D., Garrick, D., Fung, F., Brown, C., Dadson, S. J., et al. (2014). Coping with the curse of freshwater variability. Science 346 (6208), 429–430. doi:10.1126/science.1257890
Krysanova, V., and White, M. (2015). Advances in water resources assessment with SWAT—an overview. Hydrological Sci. J. 60 (5), 771–783. doi:10.1080/02626667.2015.1029482
Kundu, S., Khare, D., and Mondal, A. (2017). Individual and combined impacts of future climate and land use changes on the water balance. Ecol. Eng. 105, 42–57. doi:10.1016/j.ecoleng.2017.04.061
Kvålseth, T. O. (1985). Cautionary note about R 2. Am. Statistician 39 (4), 279–285. doi:10.1080/00031305.1985.10479448
Legates, D. R., and McCabe, G. J. (1999). Evaluating the use of “goodness-of-fit” measures in hydrologic and hydroclimatic model validation. Water Resour. Res. 35 (1), 233–241. doi:10.1029/1998WR900018
Li, C., and Fang, H. (2021). Assessment of climate change impacts on the streamflow for the mun River in the mekong basin, southeast Asia: Using SWAT model. Catena 201, 105199. doi:10.1016/j.catena.2021.105199
Li, Z., Huang, B., Qiu, J., Cai, Y., Yang, Z., and Chen, S. (2021). Analysis on evolution characteristics of ecological flow of Hanjiang River under changing environment. Water Resour. Prot. 37 (05), 22–29. doi:10.3880/j.issn.1004-6933.2021.05.004
Ljungqvist, F. C., Krusic, P. J., Sundqvist, H. S., Zorita, E., Brattström, G., and Frank, D. (2016). Northern Hemisphere hydroclimate variability over the past twelve centuries. Nature 532 (7597), 94–98. doi:10.1038/nature17418
Long, H., Lin, B., Ou, Y., and Chen, Q. (2019). Spatio-temporal analysis of driving factors of water resources consumption in China. Sci. Total Environ. 690, 1321–1330. doi:10.1016/j.scitotenv.2019.06.311
Lotz, T., Opp, C., and He, X. (2018). Factors of runoff generation in the Dongting Lake basin based on a SWAT model and implications of recent land cover change. Quat. Int. 475, 54–62. doi:10.1016/j.quaint.2017.03.057
McCuen, R. H., Knight, Z., and Cutter, A. G. (2006). Evaluation of the nash–sutcliffe efficiency index. J. Hydrol. Eng. 11 (6), 597–602. doi:10.1061/(ASCE)1084-0699(2006)11:6(597)
Miller, J. D., Kim, H., Kjeldsen, T. R., Packman, J., Grebby, S., and Dearden, R. (2014). Assessing the impact of urbanization on storm runoff in a peri-urban catchment using historical change in impervious cover. J. Hydrology 515, 59–70. doi:10.1016/j.jhydrol.2014.04.011
Nash, J. E., and Sutcliffe, J. V. (1970). River flow forecasting through conceptual models part I—a discussion of principles. J. hydrology 10 (3), 282–290. doi:10.1016/0022-1694(70)90255-6
Onyutha, C. (2022). A hydrological model skill score and revised R-squared. Hydrology Res. 53 (1), 51–64. doi:10.2166/nh.2021.071
Osei, M. A., Amekudzi, L. K., Wemegah, D. D., Preko, K., Gyawu, E. S., and Obiri-Danso, K. (2019). The impact of climate and land-use changes on the hydrological processes of Owabi catchment from SWAT analysis. J. Hydrology Regional Stud. 25, 100620. doi:10.1016/j.ejrh.2019.100620
Piao, S., Ciais, P., Huang, Y., Shen, Z., Peng, S., Li, J., et al. (2010). The impacts of climate change on water resources and agriculture in China. Nature 467 (7311), 43–51. doi:10.1038/nature09364
Ross, E. R., and Randhir, T. O. (2022). Effects of climate and land use changes on water quantity and quality of coastal watersheds of Narragansett Bay. Sci. total Environ. 807, 151082. doi:10.1016/j.scitotenv.2021.151082
Sajikumar, N., and Remya, R. S. (2015). Impact of land cover and land use change on runoff characteristics. J. Environ. Manag. 161, 460–468. doi:10.1016/j.jenvman.2014.12.041
Santhi, C., Arnold, J., Williams, J. R., Dugas, W. A., Srinivasan, R., and Hauck, L. M. (2001). Validation of the SWAT model on a large river basin with point and nonpoint sources. J. Am. Water Resour. Assoc. 37, 1169–1188. doi:10.1111/j.1752-1688.2001.tb03630.x
Shrestha, S., Bhatta, B., Shrestha, M., and Shrestha, P. K. (2018). Integrated assessment of the climate and landuse change impact on hydrology and water quality in the Songkhram River Basin, Thailand. Sci. Total Environ. 643, 1610–1622. doi:10.1016/j.scitotenv.2018.06.306
Sivakumar, B. (2011). Global climate change and its impacts on water resources planning and management: assessment and challenges. Stoch. Environ. Res. Risk Assess. 25 (4), 583–600. doi:10.1007/s00477-010-0423-y
Souffront Alcantara, M. A., Nelson, E. J., Shakya, K., Edwards, C., Roberts, W., Krewson, C., et al. (2019). Hydrologic modeling as a service (HMaaS): a new approach to address hydroinformatic challenges in developing countries. Front. Environ. Sci. 7, 158. doi:10.3389/fenvs.2019.00158
Sterling, S. M., Ducharne, A., and Polcher, J. (2013). The impact of global land-cover change on the terrestrial water cycle. Nat. Clim. Chang. 3 (4), 385–390. doi:10.1038/nclimate1690
Strohbach, M. W., Döring, A. O., Möck, M., Sedrez, M., Mumm, O., Schneider, A. K., et al. (2019). The “hidden urbanization”: Trends of impervious surface in low-density housing developments and resulting impacts on the water balance. Front. Environ. Sci. 7, 29. doi:10.3389/fenvs.2019.00029
Uniyal, B., Jha, M. K., and Verma, A. K. (2015). Assessing climate change impact on water balance components of a river basin using SWAT model. Water Resour. manage. 29 (13), 4767–4785. doi:10.1007/s11269-015-1089-5
Wang, G. Q., Zhang, J. Y., Xuan, Y. Q., Liu, J. F., Jin, J. L., Bao, Z. X., et al. (2013). Simulating the impact of climate change on runoff in a typical river catchment of the Loess Plateau, China. J. Hydrometeorol. 14 (5), 1553–1561. doi:10.1175/JHM-D-12-081.1
Wu, S., Gao, J., Wei, B., Zhang, J., Guo, G., Wang, J., et al. (2021). Theoretical paradigm for natural disaster-resilient society. Acta Geogr. Sin. 76 (5), 1136–1147. doi:10.11821/dlxb202105007
Wu, Y., Liu, S., and Gallant, A. L. (2012). Predicting impacts of increased CO2 and climate change on the water cycle and water quality in the semiarid James River Basin of the Midwestern USA. Sci. Total Environ. 430, 150–160. doi:10.1016/j.scitotenv.2012.04.058
Xia, J., Shi, W., Luo, X., Hong, S., Ning, L., and Gippel, C. J. (2015). Revisions on water resources vulnerability and adaption measures under climate change. Adv. Water Sci. 26 (2), 279–286. doi:10.14042/j.cnki.32.1309.2015.02.019
Zang, C. F., Liu, J., Van Der Velde, M., and Kraxner, F. (2012). Assessment of spatial and temporal patterns of green and blue water flows under natural conditions in inland river basins in Northwest China. Hydrol. Earth Syst. Sci. 16 (8), 2859–2870. doi:10.5194/hess-16-2859-2012
Zang, C., Liu, J., Gerten, D., and Jiang, L. (2015). Influence of human activities and climate variability on green and blue water provision in the Heihe River Basin, NW China. J. Water Clim. Chang. 6 (4), 800–815. doi:10.2166/wcc.2015.194
Zang, C., and Liu, J. (2013). Trend analysis for the flows of green and blue water in the Heihe River basin, northwestern China. J. Hydrology 502, 27–36. doi:10.1016/j.jhydrol.2013.08.022
Zhang, J., Wang, G., Jin, J., He, R., and Liu, C. (2020a). Evolution and variation characteristics of the recorded runoff for the major rivers in China during 1956—2018. Adv. Water Sci. 31 (2), 153–161. doi:10.14042/j.cnki.32.1309.2020.02.001
Zhang, L., Cheng, L., Chiew, F., and Fu, B. (2018). Understanding the impacts of climate and landuse change on water yield. Curr. Opin. Environ. Sustain. 33, 167–174. doi:10.1016/j.cosust.2018.04.017
Zhang, Q., Liu, Y., Yao, J., Lai, X., Li, X., Wu, G., et al. (2020b). Lake hydrology in China: Advances and prospects. J. Lake Sci. 32, 1360–1379. doi:10.18307/2020.0511
Zhang, Z. (2007). Synthetic study of land use/cover change in typical area in Hanjiang River basin, Guangdong province. PhD. Guangzhou: Graduate University of Chinese Academy of Sciences. Guangzhou Institute of Geochemistry. CNKI:CDMD:1.2007.101649.
Zhou, C., Xie, Y., Zhang, A., Liu, C., and Yang, J. (2022). Spatiotemporal analysis of interactions between seasonal water, climate, land use, policy, and socioeconomic changes: Hulun-Buir Steppe as a Case Study. Water Res. 209, 117937. doi:10.1016/j.watres.2021.117937
Keywords: land use change, climate change, Hanjiang River Basin, SWAT model, water resource
Citation: Li Y, Deng J, Zang C, Kong M and Zhao J (2022) Spatial and temporal evolution characteristics of water resources in the Hanjiang River Basin of China over 50 years under a changing environment. Front. Environ. Sci. 10:968693. doi: 10.3389/fenvs.2022.968693
Received: 14 June 2022; Accepted: 25 July 2022;
Published: 25 August 2022.
Edited by:
Rita Yi Man Li, Hong Kong Shue Yan University, Hong Kong SAR, ChinaCopyright © 2022 Li, Deng, Zang, Kong and Zhao. This is an open-access article distributed under the terms of the Creative Commons Attribution License (CC BY). The use, distribution or reproduction in other forums is permitted, provided the original author(s) and the copyright owner(s) are credited and that the original publication in this journal is cited, in accordance with accepted academic practice. No use, distribution or reproduction is permitted which does not comply with these terms.
*Correspondence: Chuanfu Zang, Y2h1YW5mdXphbmdAMTYzLmNvbQ==