 Guo Chen
 Shixiong Cheng1*
- 1Business School, Hubei University, Wuhan, China
- 2Open Economy Research Center, Hubei University, Wuhan, China
- 3Economics and Management School, Wuhan University, Wuhan, China
Since the financial crisis, especially after the outbreak of COVID-19, the global trade division of labor has been changing rapidly. The global value chain (GVC) keeps shrinking while the domestic value chain (DVC) continues to develop. Therefore, it is important to re-examine the impact of different modes of value chain division of labor on China’s energy efficiency. In this study, we first constructed an input-output model of provinces embedded in the world to measure the dual embedding of domestic and global value chains. Then we used a three-dimensional fixed-effect model to study the impact and mechanism of dual value chain embedding on energy efficiency. We found that domestic value chain embedding inhibits energy efficiency improvement and global value chain embedding promotes energy efficiency improvement. A series of robustness and endogeneity tests support these findings. The heterogeneity tests revealed that the effects of dual value chain embedding on energy efficiency are more pronounced in low-polluting industries, high-tech industries, years before 2008, and coastal regions. The mechanism test revealed that DVC embedding inhibits energy efficiency by exacerbating the low-end lock-in effect, reducing environmental regulation and scale efficiency, and it increases energy efficiency by increasing technological progress efficiency. GVC embedding improves energy efficiency by weakening the low-end lock-in effect and increasing technical efficiency and scale efficiency, and it inhibits energy efficiency improvement by reducing environmental regulation and technological progress efficiency.
1 Introduction
Since energy is the blood of economic operation, clean and efficient use of energy is a crucial foothold for China to achieve green economic transformation (Awan et al., 2022; Li et al., 2022). After China entered late industrialization, energy efficiency has been improved significantly. During 2012–2021, energy consumption per unit of GDP decreased from 0.75 to 0.46 (tons of standard coal per 10,000 yuan) and the elasticity coefficient of energy consumption increased from 0.49 to 0.641. However, China is the world’s largest energy consumer and
The embedding of global value chains (GVCs) is important for China’s energy efficiency. Since the reform and opening up, especially since its accession to the WTO, China has become “the World Factory” with abundant labor and resource advantages. China’s import and export scale has expanded rapidly, which has brought about vast energy consumption and environmental degradation (Kee and Tang, 2016; Tiwari et al., 2022). Coupled with the massive impact of COVID-19, the risk of GVC breakage has further increased while domestic value chains (DVCs) have become increasingly important. In contrast to the GVC, the DVC emphasizes the allocation and combination of domestic resources. In other words, the DVC is a domestic region-based production division of the labor system formed by domestic enterprises with their advantages, relying on domestic market demand and fully integrating domestic value-added links (Li, 2016). China’s domestic trade division of labor has remained active. From 2002 to 2007, China’s total interprovincial trade increased from 7.48 trillion yuan to 178.65 trillion yuan, expanding nearly 24 times2. In addition, the Chinese government proposed to establish a “dual circulation” development pattern in 2020, with emphasis on the leading role of the “domestic economic cycle” in “double circulation”. The deepening development of DVCs also puts forward newer and higher requirements for energy consumption.
Considering the aforementioned context, what impact does dual value chain embedding (GVCs and DVCs) has on energy efficiency? Do these impacts differ across industries and regions? Moreover, what are the mechanisms of the two effects? This study discusses the aforementioned questions in depth, which provides some implications for optimizing the layout of DVCs and GVCs and realizing energy conservation and green economic development in China.
Compared with previous studies, the marginal contribution of our study has three points. First, this study entirely considers the changes in global value chain division after the financial crisis to examine the impact of China’s dual embedding in DVCs and GVCs on energy efficiency. Second, to avoid measurement bias of DVC embedding, we decomposed the value added driven by the final demand from different sources and refined it to the province-industry level. In addition, we merged and matched the three versions of China’s interprovincial input-output tables with the Organization for Economic Co-operation and Development (OECD) Inter-Country Input-Output (ICIO) Table. We extended the data coverage to 2002–2017, enhancing the timeliness of the research findings. Third, we explored the five impact mechanisms of dual value chain embedding on energy efficiency, including the low-end lock-in effect, environmental regulation effect, technological progress effect, scale effect, and technical efficiency effect. Based on these mechanism analyses, we deepen our knowledge on the logic chain behind the value chain division of labor and energy consumption.
2 Literature review
Since the 1980s, the rising tide of globalization has generated extensive academic attention and research on the issue of international trade and environment. Petig (1976) and McGuire (1982) made a seminal contribution to this issue by analyzing the impact of environmental regulation on trade in the framework of a general equilibrium model. Copeland and Taylor (1994) and Copeland and Taylor (1995) further incorporated the pollution paradise hypothesis into the theoretical model, that is, changes in international trade division may lead pollution-intensive activities to transfer from areas with higher environmental standards to areas with lower environmental standards. Some scholars focused on the impact of trade division on energy efficiency. Imbruno and Ketterer (2018) used Indonesian microdata and concluded that importing intermediate goods positively affects productivity and energy efficiency by expanding the variety and lowering the prices of intermediate goods. Kahrl and Roland-Holst (2008) stated that exports were the largest source of growth in China’s energy demand. He and Huang (2020) found an inverted U-shaped relationship between the intensity of processing exports and the energy efficiency of Chinese firms, with processing exporters being less energy efficient than non-processing exporters. Liu et al. (2018) conducted an empirical analysis on this issue of China’s GVC position and their energy and environmental efficiency, The results showed a positive feedback loop between them. Wang et al. (2015) and Zhang and Li (2009) suggested that embedding GVCs brought about learning and pollution transfer effects, which have a U-shaped impact on energy efficiency. Wang et al. (2020) used production length to measure GVC embedding. They investigated the effects of pure domestic production length, traditional trade production length, and GVC production length on energy efficiency. Yao et al. (2021) found that value-added trade, especially value-added exports, significantly improved energy efficiency based on cross-country panel data.
The measurement of GVCs is now relatively mature, and a large number of relevant literature exists (Hummels et al., 2001; Antràs et al., 2012; Johnson and Noguera, 2012; Wang et al., 2013; Koopman et al., 2014; Wang et al., 2017). On this basis, some scholars have combined the world input-output model with the single-country interregional input-output model to study the dual embedding of a country in GVCs and DVCs. Meng et al. (2013) applied the concept of trade in value added (Tiva) to China’s domestic interregional input-output table. They found that inland regions provide value primarily through participation in the domestic production portion of global supply chains in coastal regions. Dietzenbacher et al. (2012) studied the role of Brazilian states in the global value chain. Their results showed that participation of Brazil in the global value chain was somewhat limited. Cherubini and Los (2016) integrated sub-national input-output tables for Italy into the World Input-Output Database (WIOD), in order to assess the effects of changes in the structure of value chains on regional employment patterns. Meng and Yamano (2017) comparatively analyzed the characteristics of the value distribution of domestic regions in China and Japan in GVCs. Beverelli et al. (2019) studied the role of domestic value chains (DVCs) for GVC integration. They found that DVC integration was less conducive to GVC integration in industries that are characterized by relatively high switching costs and relatively low fragmentation costs. From a measurement perspective, most scholars drew on Koopman et al. (2014) to measure the distribution of Chinese provinces in GVCs and DVCs in terms of trade volume (Su, 2016; Li et al., 2018; Li, 2020; Ma and Yu, 2021). Fewer scholars drew on Johnson and Noguera (2012) to examine the degree of dual value chain embedding in Chinese provinces from a final demand perspective (Liu and Xia, 2021).
In summary, three aspects of the existing literature need to be expanded. First, many scholars discussed the impact of international trade division of labor on energy efficiency, but they ignored the impact of DVC division of labor on energy efficiency. Second, DVC mainly referred to domestic cross-regional and cross-province value chain links. However, most existing literature used the total export decomposition (KWW) to measure dual value chains. It led to the province’s value-added due to the province’s final demand to be mistakenly taken as part of the province’s embedding in DVCs. Third, since multiple versions of China’s interprovincial input-output table and world input-output table covered a wide range of time, the dual value chain embedding measurement was mainly stuck in 2012. The timelines of the data needs to be further expanded.
Therefore, this study first builds an input-output model of provinces embedded in the world. Then, we decomposed value-added exports and constructed measure indicators of DVC and GVC embedding from the perspective of final demand. In the next step, we merged and matched different visions of input-output tables. The interprovincial input-output tables are compiled by Carbon Emission Accounts and Datasets (CEADs) and the Chinese Academy of Sciences. The global input-output tables are compiled by the OECD. Based on these, we empirically investigated the impacts of dual value chain embedding on energy efficiency, using province-industry level data of 13 manufacturing industries in 30 Chinese provinces from 2002 to 2017. In addition, we tested the heterogeneity of the two impacts from four aspects: pollution levels, technological levels, before 2008 or not, and geographical regions. Finally, we examined the mechanisms of dual value chain embedding on energy efficiency.
3 Theoretical mechanisms and research hypothesis
3.1 Impact mechanisms of global value chain embedding on energy efficiency
GVC embedding may inhibit energy efficiency improvement through the low-end lock-in effect and environmental regulation effect. First, China has abundant natural resources and cheap labor. Based on these factor endowments, at the early stage of GVC embedding, China vigorously developed high-polluting and low-tech industries, such as processing trade, which caused China to become “the world factory” with relatively low energy efficiency (Davis et al., 2011; Huang et al., 2017). Second, developed countries have been dominating the leading position and core links of the GVC and setting up technological blockades and trade barriers. Conversely, developing countries have been locked into low value-added and energy-intensive segments (Corredoira and McDermott, 2014; Halpern et al., 2015). Third, in pursuit of economic growth, China has relaxed its environmental regulations and participated in the GVC by undertaking low-end industries transferred from developed countries. It brings about huge energy consumption and pollution emissions and reduces energy efficiency improvement (Copeland and Taylor, 1994; Arce González et al., 2012; Wu et al., 2020; Wang et al., 2021).
GVC embedding may promote energy efficiency improvement through technical efficiency effect and scale effect, and it suppresses energy efficiency improvement through technological progress effect. First, during embedding in GVCs, China introduced more advanced foreign production management technologies and equipment and adopted higher energy-saving and environmental protection technical standards. The technological gap between China and production frontiers has narrowed, and China’s energy efficiency has improved (Amiti et al., 2014; Wang et al., 2020). Second, with GVC embedding, China has realized the convenient flow and optimal allocation of production factors, such as capital, labor, and technology. It has dramatically improved the level of specialization, scale efficiency, and energy efficiency. Third, GVC embedding in developing countries is usually at the cost of cheap domestic land, labor, and high environmental costs, which cause insufficient motivation for independent innovation and excessive dependence on external factors in core technologies and key links. As a result, technological progress and energy efficiency improvement are suppressed (Eaton and Kortum, 2001; Amendolagine et al., 2019).
3.2 Impact mechanisms of domestic value chain embedding on energy efficiency
DVC embedding may decrease energy efficiency through the low-end lock-in effect and environmental regulation effect. First, since the industrialization started late in developing countries, the development of DVCs is immature compared to GVCs. The DVC is mainly distributed in labor- and resource-intensive low-end industries, with enormous energy consumption and low energy efficiency (Chen et al., 2021). Second, the distribution of China’s DVC shows an “inside-high and outside-low” pattern. Due to backward technology and equipment, abundant natural resources, and labor force, the underdeveloped inland regions have taken over a large number of low-end industries removed from the developed coastal regions. These industries have high energy intensity and pollution emissions, which reduce energy efficiency (Meng et al., 2013). Third, to promote economic development, governments at all levels in inland areas implement weaker energy conservation and emission reduction policies and enterprises adopt lower environmental protection technology standards. Therefore, high-energy-consuming and high-polluting industries further shift to inland areas with deeper DVC embedding, thus lowering energy efficiency (Wu et al., 2020).
DVC embedding may increase energy efficiency through technological progress and hinder the improvement of energy efficiency through the scale effect. First, with the deepening of the domestic division of labor and the further improvement of basic supporting facilities, such as finance, transportation, and communication, the DVC has been extended, and the vitality of the local market has been released. This significantly increased the number of local companies and stimulated companies to innovate independently, including energy technology innovation (Chen et al., 2021; Dong et al., 2021). Second, due to the big regional differences in geographical conditions, resource endowments, and economic development levels, China has strong regional trade barriers, low market development, and weak regional-industry synergy capabilities. The technology spillover effect of DVCs is limited and so are the scale efficiency and energy efficiency (Meng et al., 2013; Chen et al., 2021).
Comparing the mechanisms of GVC embedding and DVC embedding on energy efficiency, we found that both types of embedding have different impacts. Nevertheless, in the overall review, the impact of GVC embedding on energy efficiency is mainly positive, while the effect of DVC embedding on energy efficiency is primarily negative. The possible reason is that the GVC is relatively mature in development, with high specialization, strong technology spillover effect, and scale effect. Conversely, China’s DVC is relatively backward in development, with low specialization, and is mainly distributed in high-energy-consumption industries and less developed regions. Figure 1 visually shows these impact mechanisms.
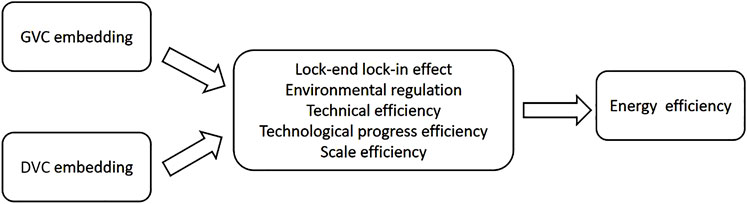
FIGURE 1. Impact mechanisms of GVC/DVC embedding on energy efficiency.
Based on the aforementioned analysis, this study proposes the following hypotheses:
Hypothesis 1: GVC embedding will improve energy efficiency, while DVC embedding will lower energy efficiency.
Hypothesis 2: GVC and DVC embedding affect energy efficiency through low-end lock-in effect, environmental regulation effect, technological efficiency effect, technological progress effect, and scale effect.
4 Variable measurement, model design, and data processing
4.1 Measuring dual value chain embedding
4.1.1 Constructing input-output tables of provinces embedded in the world
Following Liu and Xia (2021), this section first constructs a world input-output model that includes all provinces in China. This model analyzes GVCs and DVCs calculated under the same framework.
We assumed that the world contains G countries, country a contains R provinces, and each country and province contains N sectors. Where a denotes country a; -a denotes all other countries except a; i denotes province i; -i denotes all other provinces except i; k denotes industry k; and -k denotes all other sectors except k.
The total output of each province in country a is divided into two categories according to the route of use: intermediate goods used as intermediate inputs for reproduction and final goods used for final consumption.
where X denotes intermediate goods, F denotes final goods, and Y denotes total output.
Based on the regions where the intermediate and final products are used, the study further decomposes Y into six components.
where
Since this trading system satisfies the market clearing condition of X = AX + F, we obtained the following input-output model:
where I is the unit inverse matrix. According to Eq. 2, X, F, and A can be rewritten as follows:
where A denotes the direct consumption matrix, and the matrix’s elements indicate the direct consumption of a unit of output from one sector to products from the other sectors. Here, (11) (11) denotes the output from province 1 in country 1 to province 1 in country 1, (11) (12) denotes the output from province 1 in country 1 to province 2 in country 1, and (11)2 denotes the output from province 1 in country 1 to country 2. Through Eq. 3, this study establishes the correlation between final demand and total output in each region. Then we can further analyze the output of each region driven by final demand from different regions (this province, other provinces, and other countries).
4.1.2 Decomposition of value-added exports from a final demand perspective
Referring to Johnson and Noguera (2012), this study expands the definition of value-added export in combination with the provincial-embedded global input-output model constructed before. Value-added exports are the value-added products of a province generated by all of the production divisions to meet the final demand of other provinces and countries. The former is the result of embedding in DVCs, and the latter is the result of embedding in GVCs.
According to Eq. 3, this study defines
Each row of Eq. 4 represents that the value-added exports of a province or country are driven by the production of final goods in each province or country. Each column of Eq. 4 represents the pull of the production of final goods in a particular province or country to the value-added exports of each province or country. The value-added of the province
where
where
Here,
In this study, we decomposed
where
4.1.3 Degree of dual value chain embedding
Based on the aforementioned analysis, this study defines DVC and GVC as the value-added process of goods or services to meet the final demand across domestic regions and countries, respectively. Both of them include a series of divisions of labor such as production, distribution, consumption, recycling, and disposal. Therefore, in this study, the DVC embedding of sector
where
4.2 Empirical strategy
On the basis of previous theoretical analysis, to test the impact of dual value chain embedding on energy efficiency, this study uses three-dimensional data from 13 manufacturing industries in 30 Chinese provinces from 2002, 2007, 2010, 2012, 2015, and 2017. The benchmark model is set as follows:
Here, subscripts i, j, and t represent province, industry, and year, respectively; EE is the total green factor of energy efficiency; DVC is DVC embedding; GVC is GVC embedding; X denotes control variables, including industrial scale (Scale), capital labor ratio (Klr), foreign capital dependence (FDIr), export openness (Openness), energy consumption structure (Estru), urbanization level (Ur), and infrastructure (Infra);
4.3 Selection of indicators
4.3.1 Explained variables
Total Factor Energy Efficiency, TFEE. In this study, total factor energy efficiency is calculated using the SBM-DEA model with reference to Tone (2002). Capital stock, labor, and energy are selected as input variables; province-industry level value-added export is selected as expected output; and
4.3.2 Core explanatory variables
Dual value chain embedding (DVC embedding and GVC embedding). The measurement has been described before and will not be repeated in this section.
4.3.3 Control variables
Industrial scale, Scale. The larger this indicator is, the larger the industry is. We used the total industrial output value of the industry/the average number of all employees in the industry to express. To eliminate the effects of price fluctuations, we deflated the total industrial output value to the comparable price based on 2000 by the ex-factory price index of industrial products.
Capital labor ratio, Klr. We used the annual balance of net fixed assets/the annual average number of all employees to express.
Foreign capital dependence, FDIr. We used (foreign capital + Hong Kong, Macao, and Taiwan capital)/paid-in capital to express.
Export openness, Openness. We used the value of export delivery/total output value to express.
Energy consumption structure, Estru. We used total coal consumption/total energy consumption to express.
Urbanization level, Ur. We used urban population/total population by each province to express.
Infrastructure, infra. We used each province’s total road mileage/land area (road density) to express. The full description of the varibles is presented in Table 1.
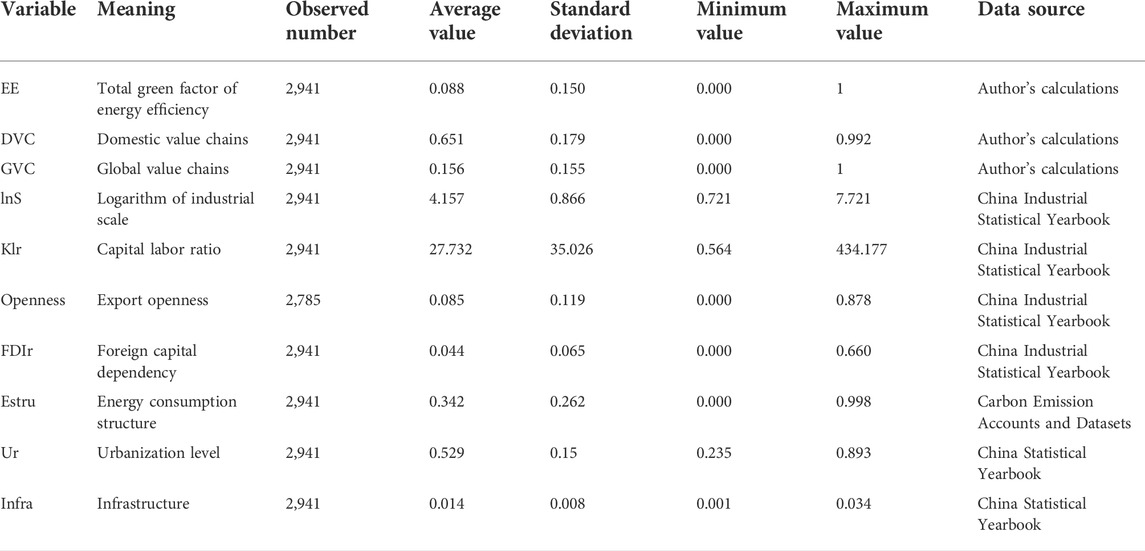
TABLE 1. Descriptive statistics.
Before the multiple regressions, we reported the Pearson correlation matrix in Table 2. The correlation between DVC and EE is significantly negative, which provides preliminary evidence that DVC embedding will reduce energy efficiency. The GVC is positively correlated with EE, and it tentatively suggests that GVC embedding can improve energy efficiency.
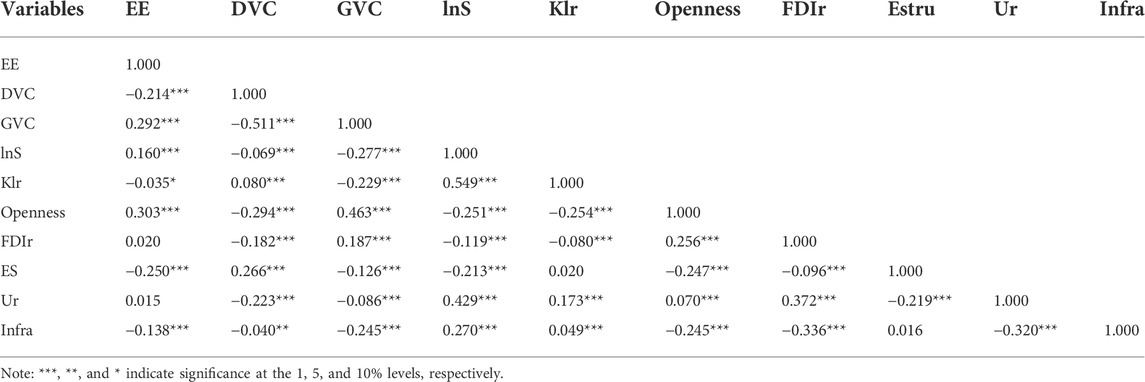
TABLE 2. Correlation matrix.
4.4 Description of data
This study mainly covers data for 13 manufacturing industries in 30 Chinese provinces from 2002, 2007, 2010, 2012, 2015, and 20173. The data on energy efficiency by province-industry come from the China Industrial Statistical Yearbook4 and Carbon Emission Accounts and Datasets (CEADs). The data on the embedding of the dual value chain come from four types of input-output tables: China’s inter-province input-output table in 2002 compiled by CAS Research Center on Fictitious Economy & Data Science; China’s inter-province input-output tables in 2007 and 2010 compiled by CAS Key Laboratory of Regional Sustainable Development Modelling; China’s inter-province input-output tables in 2012, 2015, and 2017 compiled by CEADs; and the global input-output tables during 2002–2017 compiled by OECD5. Control variables come from the China Industrial Statistics Yearbook, China Statistical Yearbook, and CEADs.
There are differences in sector classifications between the three visions of Chinese interprovincial input-output tables, the world input-output tables, and Chinese national economic activities. In contrast, such differences are more prominent in the service sector and smaller in the manufacturing sector. Considering these aforementioned factors, we adopted the following three steps for sector matching. First, the manufacturing sectors of the three versions of the interprovincial input-output tables are combined and matched according to the sector names. Second, the first matching step results are matched with the manufacturing sectors of OECD-ICIO according to the Classification of Products by Activity (CPA) with reference to the European Community. Third, the results of the second matching step are matched with the manufacturing sector of the China Industrial Statistical Yearbook according to the industry names. Finally, 13 manufacturing industries were selected as samples for this study, namely, food, beverage, and tobacco manufacturing, textile manufacturing, paper and paper products manufacturing, petroleum processing and coking, chemical raw materials and chemical products, non-metallic mineral products, metal smelting and rolling processing, metal products, machinery and equipment manufacturing, transportation equipment manufacturing, electrical machinery and equipment manufacturing, communication equipment, computer, and other electronic equipment manufacturing, and instrumentation manufacturing.
5 Empirical analysis of empirical results
5.1 Analysis of baseline regression results
Table 3 examines the impact of dual value chain embedding on energy efficiency. Columns (1)–(3) show the regression results of the impact of DVC embedding on energy efficiency. Columns (4)–(6) show the regression results of the impact of GVC embedding on energy efficiency. Among them, columns (1)–(4) of Table 2 control for province-fixed effects, sector-fixed effects, and year-fixed effects; columns (3)–(6) of Table 2 add more control variables; and columns (3) and (6) further add all control variables. The estimated coefficients of DVC embedding are always significantly negative, while the estimated coefficients of GVC embedding are always significantly positive. It indicates that DVC embedding inhibits energy efficiency improvement while GVC embedding improves energy efficiency. There is a significant difference between the two effects. There may be two reasons for this. First, compared with GVCs, China’s DVCs are more distributed in industries and regions with high energy consumption and pollution. From the beginning of reform and opening up, the eastern coastal region took the lead in joining the division of labor in the GVC by processing trade industries such as garments, machinery, and electronics. These industries have relatively low energy consumption and higher green technology. Then energy efficiency has been improved. In comparison, the central and western inland regions have been deeply embedded in DVC by providing primary products such as energy to the eastern coastal region. Second, the development of the DVC system lags behind the GVC system. The domestic market needs further improvement and more support from producer services, such as finance, transportation, logistics and communication, and personnel training. The interregional transaction cost is high, and the regional-industry synergy is poor. Both result in weak energy spillover effects and massive energy consumption. Therefore, the improvement of energy efficiency is suppressed by DVC embedding.
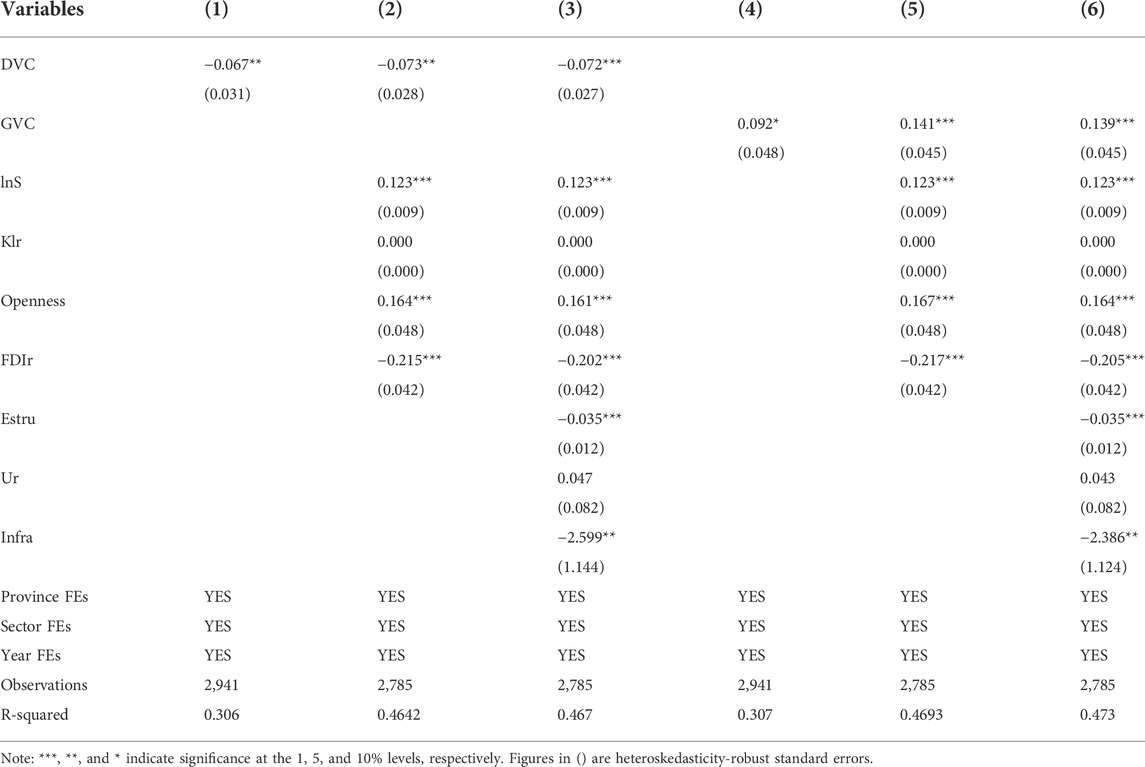
TABLE 3. Regression results of dual value chain embedding and productivity.
Among the control variables, the coefficients of the industrial scale are significantly positive, indicating that the expanding industrial scale can create a scale effect and improve energy use efficiency. The coefficients of the capital labor ratio are not significant, proving that capital intensity does not significantly impact energy efficiency. Since China entered a post-industrialization period, the demographic dividend has disappeared. Thus, it is difficult for China to improve energy efficiency by increasing the capital labor ratio sustainably. The coefficients of export openness are significantly negative, indicating that the trade development of exports can encourage firms to invest more in R&D and improve production technology and energy technology to reduce costs to achieve exports. The coefficients of foreign capital dependence are significantly negative, proving that introducing foreign capital decreases energy efficiency. Because multinational companies retain the core link and key technologies in the home country, the inflow of foreign capital does not bring advanced technologies in production and management but instead squeezes out the living space of domestic capital, which suppresses energy efficiency. The coefficient of energy consumption structure is significantly negative, indicating that the higher the share of coal energy consumption is, the more detrimental it is to energy efficiency improvement. The possible reason is the development of clean energy is slow due to technical and market conditions, and the energy input of regions-industries is still dominated by fossil energy sources, such as coal. Furthermore, the unreasonable energy consumption structure makes them retain relatively backward production processes. All of the aforementioned factors lead to low energy efficiency. The coefficient of urbanization level is insignificant. It proves that urbanization has no significant effects on energy efficiency. The infrastructure’s estimate is significantly negative, and it indicates that the increase in road density reduces energy efficiency. It is probably because the higher road density areas consume more energy, thus hindering the energy efficiency improvement.
5.2 Robustness and endogeneity tests
1. Alternative explained variables. Considering that the explained variables measured by different methods may affect the regression results, this study follows Ang and Goh (2018) to measure energy efficiency in terms of province-industry value-added/energy consumption. According to the results reported in columns (1)–(2) of Table 4, the estimated coefficients of GVC and DVC embedding remain consistent with the baseline regression.
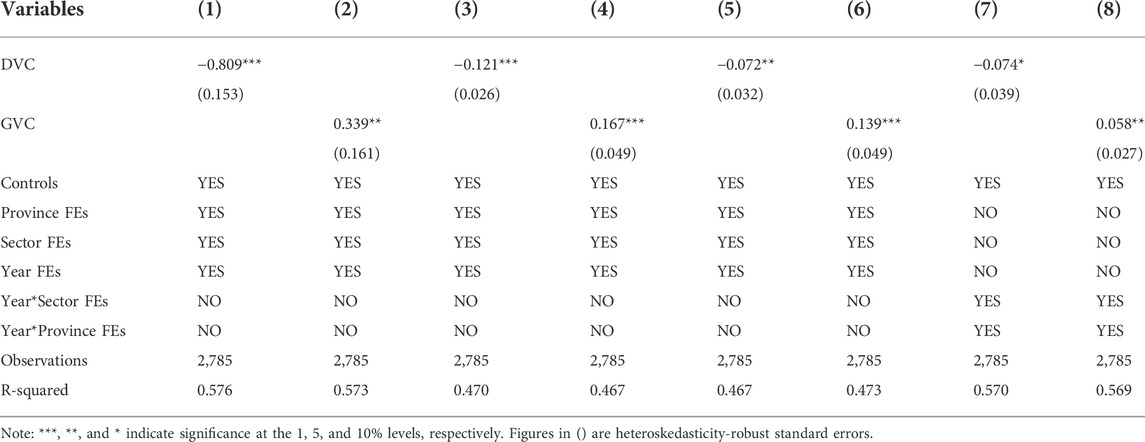
TABLE 4. Robustness regression results.
2. Alternative core explanatory variables. Since DVCs and GVCs mainly involve interprovincial and transnational intermediate trade, this study decomposes intermediate goods into three parts according to their sources: this province, other provinces, and other countries. The degree of DVC embedding is represented by intermediate goods from other provinces/total intermediate goods inputs, and the degree of GVC embedding is represented by intermediate goods from other countries/total intermediate goods inputs. The results of columns (3)–(4) of Table 4 show that the core conclusions of this study still hold.
3. Alternative clustering levels. Considering that the sample may have intra-group differences at province and industry levels, this study clusters at the province*industry level to eliminate heteroskedasticity. Based on the results in columns (5)–(6) of Table 4, the previous findings are still robust and significant.
4. Alternative control variables. Since economic shocks in the time dimension are heterogeneous across industries and provinces, this study controls for the interaction terms between year fixed effects and sector fixed effects and the interaction terms between year fixed effects and province fixed effects. As shown in columns (7)–(8) of Table 4, DVC and GVC estimates’ directions are the same as the baseline regression. The core findings are verified again.
5. Endogeneity issues. In Table 5, we use the system generalized method of moments estimation (SYS-GMM) and the instrumental variables method (IV) for regression analysis. Using SYS-GMM can correct unobserved individual heterogeneity problems, omitted variable bias, and potential endogeneity problems. Using the industry average of DVC and GVC as instrumental variables can ease the two-way causality problem caused by industry-level differences. According to the input-output tables, the industry-average DVC embedding in each province is highly correlated with the DVC embedding of each province-industry. However, it has no direct correlations with industry-specific energy efficiency, and it is strictly exogenous. To further eliminate the correlation with province-industry energy efficiency, we use the industry averages of DVC and GVC for each province after excluding themselves as instrumental variables. The regression results remain consistent with the above.

TABLE 5. Endogeneity regression results.
5.3 Heterogeneity analysis
1. Industry characteristics: high pollution and low pollution. As there are differences in the degree of DVC embedding and GVC embedding in industries with different pollution levels, this study follows Shen (2012) to classify 13 manufacturing industries into high-polluting- and low-polluting industries. High-polluting industries include petroleum processing and coking, chemical raw materials and chemical products, non-metallic mineral properties, ferrous metal smelting, and metal products. Low-polluting industries include the other manufacturing industries. Columns (1)–(2) of Table 6 suggest that the DVC coefficient of high-polluting industries is insignificant while the DVC coefficient of low-polluting industries is significantly negative. The reason may be that the development of DVCs is still immature, the regional-industrial synergy needs to be improved, and the promotion of production technology and energy efficiency is relatively weak. Moreover, with the deepening of DVC embedding, the high-polluting industries keep moving inland. The low-polluting industries also undertake more production links with high energy consumption and pollution. Since low-polluting industries have little space for emission reduction and energy efficiency improvement, DVC embedding reduces energy efficiency. As shown in columns (3)–(4) of Table 6, the GVC coefficients are significantly negative for high-polluting industries while it is positive for low-polluting industries. Because GVC embedding has strong effects on green technology spillovers and clean production capacity communication, thus improving energy efficiency in low-polluting industries. However, developed countries prefer to move high-polluting industries to China by GVC division of labor, and the energy efficiency of these industries is suppressed.
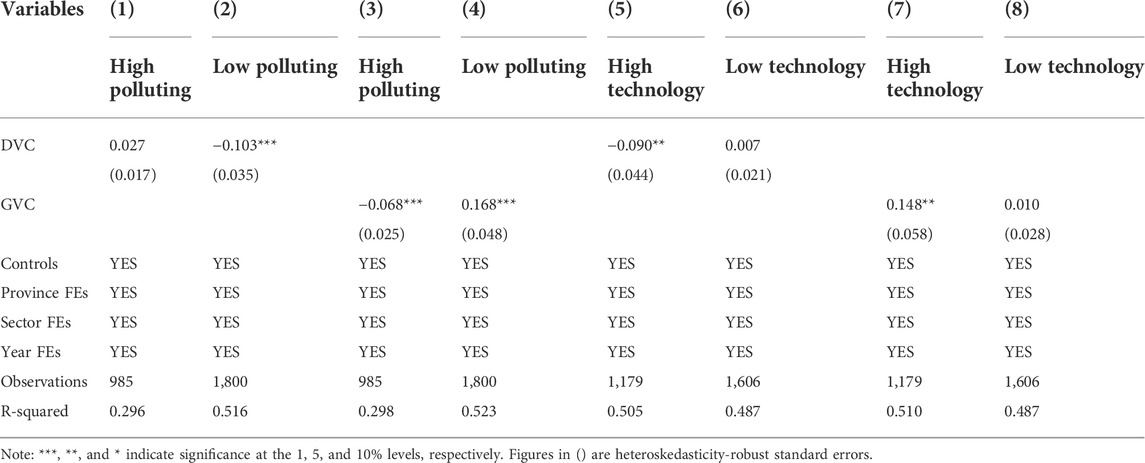
TABLE 6. Heterogeneity regression results a.
2. Industry characteristics: high technology and low technology. In industries with different technology densities, the degree of DVC embedding and GVC embedding has big differences. Therefore, according to OECD technology classification, we classify 13 manufacturing industries into high-tech and low-tech industries. High-tech industries include chemical raw materials and chemical products manufacturing, machinery and equipment manufacturing, transportation equipment manufacturing, electrical machinery and equipment manufacturing, communication equipment computer and other electronic equipment manufacturing, and instrumentation manufacturing. Columns (5)–(6) of Table 6 show that the DVC coefficients of high-tech industries are significantly negative, while the DVC coefficients of low-tech industries are not significant. It suggests that the DVC division of labor system is imperfect and has high regional trade costs for lack of support for productive service industries. Thus, the domestic production division of labor is stuck in low-tech and high-energy industries, and the DVC embedding does not bring significant technological progress and energy efficiency improvement. Columns (7)–(8) of Table 6 show that the GVC coefficients are significantly negative for high-tech industries and not significant for low-tech industries. The possible reason is that high-tech industries have stronger R&D strength and learning ability, so it is easier for them to obtain cleaner intermediate inputs and higher environmentally friendly production technologies through GVC embedding. On the contrary, low-tech industries have a lower technical level. Once locked in the low end of the GVC, the developing countries will not only be difficult to break through the blockade and restrictions from developed countries but also undertake more production links with low technology, low value-added, high pollution, and high energy consumption. Based on these factors, GVC embedding has a limited effect on energy efficiency in low-tech industries.
3. Timing characteristics: before the global financial crisis and after the global financial crisis. The outbreak of the global financial crisis in 2008 brought a vast external shock to China’s economic growth and internal and external trade. Then the GVC began to contract while the DVC continued to develop. In this study, the sample is divided into pre-2008 and post-2008 according to the time of the financial crisis outbreak. Columns (1)–(2) of Table 7 show that the coefficient of DVC before the financial crisis is significantly negative. At the same time, the coefficient of DVC after the financial crisis is still negative but not significant. Columns (3)–(4) of Table 7 indicate that the coefficient of GVC before the financial crisis is significantly positive, and the coefficient of GVC after the financial crisis is still positive but not significant. Because after the global financial crisis, global foreign trade demand declined, and developed countries set stricter trade barriers and technological blockades. Then, the technological progress effect in energy conservation and environmental protection brought about by GVC embedding is weakened. However, the division of labor in DVCs is further developed, the inland market is further opened up, and producer services, such as finance, communication, and infrastructure, are further improved. Meanwhile, governments at all levels pay more attention to the performance assessment of energy conservation and environmental protection. Based on those, DVC embedding inhibition on energy efficiency tends to weaken.
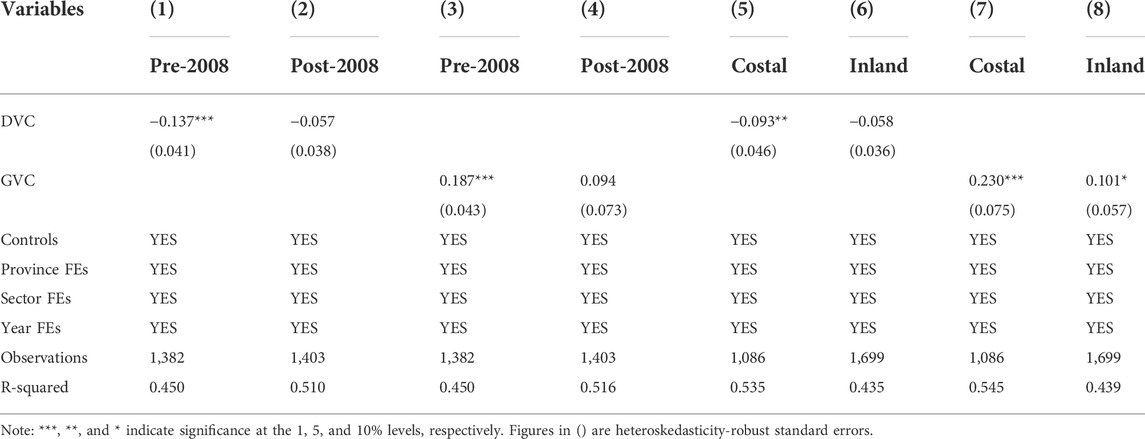
TABLE 7. Heterogeneity regression results b.
4. Regional characteristics: coastal and inland. The degree of DVC and GVC embedding differs significantly between coastal and inland regions of China due to various factors, such as geographic location, marketization degree, openness level, resource endowment, economic foundation, etc. In this section, 11 provinces, namely Liaoning, Hebei, Tianjin, Shandong, Jiangsu, Shanghai, Zhejiang, Fujian, Guangdong, Guangxi, and Hainan, are taken as coastal regions, and other provinces are taken as inland regions. According to columns (5)–(6) in Table 7, the DVC coefficient is negative for coastal regions and negative but not significant for inland regions. The possible reason is that, compared with inland regions, coastal regions have higher economic development and energy efficiency. However, many value-added links in the DVC division system are still stuck in high energy consumption and high-polluting industries, which do not meet the economic development and energy-saving needs of coastal regions. It leads to the inhibition of DVC embedding on energy efficiency in coastal regions being more prominent. Conversely, the inland regions are original “suppliers” of primary materials for coastal regions, so the negative effect of embedding in DVCs on energy efficiency is weaker. Columns (7)–(8) of Table 7 suggest that the GVC coefficients are significantly positive for both coastal and inland regions, and the significance and magnitude of the DVC coefficients are smaller for inland regions. The reason is that GVC embedding brings more advanced production and energy technologies, cleaner intermediate inputs, and higher green technical standards, thus effectively promoting energy efficiency. In particular, coastal regions are more active in multinational trade and have a higher degree of GVC embedding, so the positive effect on energy efficiency is more pronounced.
5.4 Mechanism analysis
According to the previous theoretical hypothesis, this section tests five mechanisms of the dual value chain embedding on energy efficiency: low-end lock-in effect, environmental regulation effect, technical efficiency effect, technological progress effect, and scale effect. The degree of low-end lock-in is denoted by the output of low-tech industries/total output of the province. The data are from China’s interprovincial input-output table. The selection of low-tech industries is consistent with the heterogeneity analysis. The higher the output value of low-tech industries is, the stronger the low-end lock-in effect is. The environmental regulation comprehensive index denotes the strength of environmental regulation. This index is calculated from the emissions of
The econometric model of mechanism analysis is set as follow:
where
1. Low-end lock-in effect. Columns (1)–(2) of Table 8 show that the estimated coefficients of DVC are significantly positive while the estimated coefficients of GVC are significantly negative. It indicates that DVC embedding exacerbates the low-end lock-in effect while GVC embedding mitigates the low-end lock-in effect, which is somewhat different from theoretical expectations. The possible reason is that although GVC embedding exacerbates the low-end lock-in effect, it also brings advanced production management technology, promoting industrial upgrading in the country and ultimately mitigating the low-end lock-in effect. From the perspective of the existing literature, it is clear that a country’s lock-in to low-end industries can result in inefficient energy use (Jenne and Cattell, 1983; Eichhammer and Wilhelm, 1997; Huang et al., 2017; Yang et al., 2018). Thus, DVC embedding exacerbates the low-end lock-in effect, which decreases energy efficiency; GVC embedding weakens the low-end lock-in effect, increasing energy efficiency.
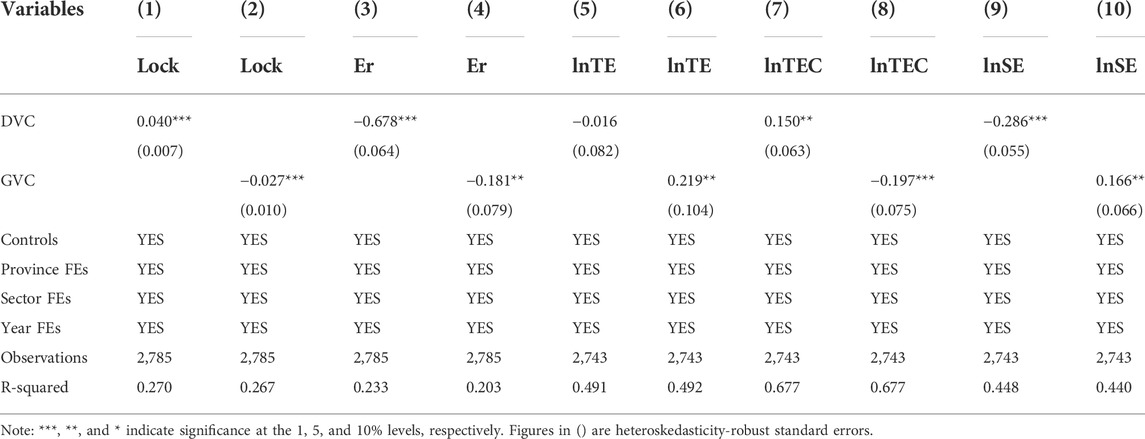
TABLE 8. Results of mechanism test.
2. Environmental regulation effect. In Columns (3)–(4) of Table 8, the estimates are significantly negative for DVC and GVC. It proves that both DVC and GVC embedding reduce environmental regulation, especially for DVC embedding, and it is consistent with theoretical expectations. Existing studies have confirmed the positive effect of environmental regulation on energy efficiency (Bi et al., 2014; Costantini and Crespi, 2008; Mandal, 2010; Wu et al., 2020). By increasing the cost of pollution end-of-pipe control and forcing technological innovation, environmental regulation improves energy efficiency. In summary, dual value chain embedding weakens environmental regulation and inhibits energy efficiency improvement.
3. Technical efficiency effect. Columns (5)–(6) of Table 8 show that the estimated coefficients of DVC are negative but insignificant, and the estimated coefficients of GVC are significantly positive, indicating that DVC embedding does not have a significant effect on technical efficiency, and GVC embedding is beneficial to improve technical efficiency, in line with theoretical expectations. The positive relationship between total factor productivity (TFP) and energy efficiency has been confirmed by numerous studies (Martin et al., 2012; Wu et al., 2014; Cantore et al., 2016; Li and Lin, 2018; Wang and Wang, 2020). As part of the TFP decomposition derived, technical efficiency is also positively related to energy efficiency (Yang et al., 2018). Thus, GVC embedding promotes technical efficiency, improving energy efficiency.
4. Technological progress effect. The regression results reported in Columns (7)–(8) of Table 8 suggest that DVC embedding promotes technological progress by stimulating the country to increase R&D investments and independent innovation, and GVC embedding tends to cause over-reliance on foreign technology and inhibits domestic technological progress. The results remain the same as theoretical expectations. Similar to technical efficiency, the technological progress efficiency derived from total factor productivity decomposition also has a positive impact on energy efficiency (Chen and Liu, 2021; Sun et al., 2021; Jahanger et al., 2022). In brief, DVC embedding improves energy efficiency by promoting technical efficiency, while GVC embedding suppresses energy efficiency by inhibiting technical efficiency.
5. Scale effect. As shown in Columns (9)–(10) of Table 8, we conclude that DVC embedding suppresses scale efficiency, and GVC embedding expands scale efficiency, corresponding with what we propose in theory. This conclusion proves again that the DVC division system lags far behind the GVC division system, and the supporting and collective capacities of each link in DVCs need further improvement. According to the literature on TFP and energy efficiency, the scale efficiency derived from TFP decomposition also promotes energy efficiency. Therefore, DVC embedding improves energy efficiency, and GVC embedding suppresses technical efficiency.
6 Conclusion and policy recommendations
As “the world factory”, China faces enormous energy consumption, and its energy efficiency is closely related to GVC embedding. However, after the global financial crisis of 2008, the GVC has been shrinking while the DVC has been developing continuously. Thus, this study studies the impact of provinces’ dual value chain embedding on energy efficiency in China.
In this study, we first build an input-output model of provinces embedded in the world. Then, we use the trade value-added accounting method to derive the formula of DVC and GVC from the perspective of the final demand sources. Next, we combine three versions of Chinese interprovincial input-output tables with OECD-ICIO to measure the dual value chain embedding (DVC and GVC) in 13 manufacturing industries of 30 Chinese provinces from 2002 to 2017. Finally, we investigate the impact of dual value chain embedding on energy efficiency and the impact mechanism using a three-dimensional stationary model. The conclusions are as follows: 1) DVC embedding and GVC embedding have different impacts on energy efficiency. The former inhibits energy efficiency, and the latter improves energy efficiency. And this finding still holds after a series of robustness and endogeneity tests. 2) There is significant heterogeneity in the effects of DVC and GVC embedding on energy efficiency. These effects are more pronounced in low-pollution industries, high-tech industries, pre-2008, and coastal regions. 3) According to the mechanism test, DVC embedding reduces energy efficiency by exacerbating the low-end lock-in effect and environmental regulation effect, and it improves energy efficiency by increasing the efficiency of technological progress. GVC embedding improves energy efficiency by reducing the low-end lock-in effect, increasing technical efficiency and scale efficiency, and it decreases energy efficiency by reducing technological progress efficiency and environmental regulation.
These findings have important implications for China’s clean and efficient energy use. China’s DVC is immaturely developed and still mainly distributed in high-energy and low-tech industries, which results in a large amount of energy waste. Policies should be considered to raise the energy efficiency in the DVC. The government should perfect the relevant laws of environmental protection and increase the disclosure of enterprises’ pollution emissions to strengthen the environmental regulation in the DVC. In addition, the industrial structure of the DVC needs further improvement. The enterprises should upgrade traditional industries’ production processes and equipment, such as coal, petroleum, petrochemicals, and steel, to realize green industry transformation. Moreover, China needs to improve the level of division of labor and cooperation among domestic regions and industries. Through developing the producer services, such as finance, communication, transportation, and breaking the local protection and market segmentation, scale efficiency and technical efficiency have been improved, which in turn increase energy efficiency.
By contrast, the GVC is relatively mature and developed, with obvious technology spillover effects and scale impacts, thus contributing to energy efficiency improvements. China should actively participate in the GVC and introduce advanced foreign energy-saving and clean technologies and standards to the domestic division of labor. Therefore, the GVC and the DVC can achieve effective docking and linkage between the GVC and the DVC, which helps China to transfer from a rough production mode with high pollution and high consumption to an intensive production mode with low pollution and high efficiency. At the same time, in energy technology, China should strengthen independent innovation and core technology research in order to avoid excessive dependence on foreign countries.
The impact of dual value chain embedding on energy efficiency may be significantly different between countries, developed and developing, and big and small. In future investigations, we can collect transnational data and conduct international comparison research. In addition, restricted by the data source, the year of the Chinese inter-province input-output table used by the study is not continuous, and the section division of each version is different. As a result, there are some errors in the dual value chain embedding measurement. Hence, we can reconstruct Chinese inter-province input-output tables with consecutive years and unified sector classifications in the next stage.
Data availability statement
Publicly available datasets were analyzed in this study. This data can be found at: China Industrial Statistical Yearbook, China Statistical Yearbook, Carbon Emission Accounts and Datasets (CEADs), Organization for Economic Co-operation and Development Inter‐Country Input‐Output Table (OECD‐ICIO), CAS Key Laboratory of Regional Sustainable Development Modelling, and CAS Research Center on Fictitious Economy & Data Science.
Author contributions
GC: conceptualization, supervision, validation, and writing—original draft and review. SC: conceptualization, funding support, and writing—review and editing. QG: data curation and formal analysis. BL: writing—review and editing and project administration.
Funding
This work was supported by the National Social Science General Program of China [Grant Numbers 19BGJ03] and National Social Science Foundation Key Project of China [Grant Numbers 19AJL004].
Conflict of interest
The authors declare that the research was conducted in the absence of any commercial or financial relationships that could be construed as a potential conflict of interest.
The reviewer MU declared a shared affiliation with the author QG to the handling editor at the time of review.
Publisher’s note
All claims expressed in this article are solely those of the authors and do not necessarily represent those of their affiliated organizations, or those of the publisher, the editors, and the reviewers. Any product that may be evaluated in this article, or claim that may be made by its manufacturer, is not guaranteed or endorsed by the publisher.
Footnotes
1The data are from the National Bureau of Statistics of China.
2The data are calculated by using the interprovincial input-output tables in 2002 and 2017.
3China’s input-output tables are updated every 5 years. The 2017 input-output tables were published in 2019, and the resulting interregional input-output tables for China can only be compiled up to 2017. The vast majority of existing studies only used input-output tables up to and including 2012, which were updated in this study to more comprehensively reflect the latest trends in the division of labor in domestic value chains.
4The data for 2017 sub-provinces and sub-industries are missing and are obtained by summing and averaging the data for 2016 and 2018.
5We excluded outliers with overall domestic value chain embedding >1.
References
Amendolagine, V., Presbitero, A. F., Rabellotti, R., and Sanfilippo, M. (2019). Local sourcing in developing countries: The role of foreign direct investments and global value chains. World Dev. 113, 73–88. doi:10.1016/j.worlddev.2018.08.010
Amiti, M., Itskhoki, O., and Konings, J. (2014). Importers, exporters, and exchange rate disconnect. Am. Econ. Rev. 104 (7), 1942–1978. doi:10.1257/aer.104.7.1942
Ang, B. W., and Goh, T. (2018). Bridging the gap between energy-to-GDP ratio and composite energy intensity index. Energy Policy 119, 105–112. doi:10.1016/j.enpol.2018.04.038
Antràs, P., Chor, D., Fally, T., and Hillberry, R. (2012). Measuring the upstreamness of production and trade flows. Am. Econ. Rev. 102 (3), 412–416. doi:10.1257/aer.102.3.412
Arce González, G., Cadarso Vecina, M. Á., and López Santiago, L. (2012). “Indirect pollution haven hypothesis in a context of global value chain,” in Final WIOD Conference: Causes and Consequences of Globalization, Groningen, The Netherlands, 2012.
Awan, A., Kocoglu, M., Banday, T. P., and Tarazkar, M. H. (2022). Revisiting global energy efficiency and CO2 emission nexus: Fresh evidence from the panel quantile regression model. Environ. Sci. Pollut. Res. 1–14. doi:10.1007/s11356-022-20320-z
Beverelli, C., Stolzenburg, V., Koopman, R. B., and Neumueller, S. (2019). Domestic value chains as stepping stones to global value chain integration. World Econ. 42 (5), 1467–1494. doi:10.1111/twec.12779
Bi, G. B., Song, W., Zhou, P., and Liang, L. (2014). Does environmental regulation affect energy efficiency in China's thermal power generation? Empirical evidence from a slacks-based DEA model. Energy Policy 66, 537–546. doi:10.1016/j.enpol.2013.10.056
Cantore, N., Calì, M., and te Velde, D. W. (2016). Does energy efficiency improve technological change and economic growth in developing countries? Energy Policy 92, 279–285. doi:10.1016/j.enpol.2016.01.040
Chen, A. Z., Chen, F. L., and He, C. Y. (2021). Industry chain linkage and firm’s innovation. China Ind. Econ. 33 (9), 80–98. doi:10.19581/j.cnki.ciejournal.2021.09.004
Chen, Y., and Liu, Y. (2021). How biased technological progress sustainably improve the energy efficiency: An empirical research of manufacturing industry in China. Energy 230, 120823. doi:10.1016/j.energy.2021.120823
Cherubini, L., and Los, B. (2016). Regional employment patterns in a globalizing world: A tale of four italies. Glob. value Chains new Evid. Implic., 213–235.
Copeland, B. R., and Taylor, M. S. (1994). North-south trade and the environment. Q. J. Econ. 109 (3), 755–787. doi:10.2307/2118421
Copeland, B. R., and Taylor, M. S. (1995). Trade and transboundary pollution. Am. Econ. Rev. 85 (4), 716–737. doi:10.2307/2118228
Corredoira, R. A., and McDermott, G. A. (2014). Adaptation, bridging and firm upgrading: How non-market institutions and MNCs facilitate knowledge recombination in emerging markets. J. Int. Bus. Stud. 45 (6), 699–722. doi:10.1057/jibs.2014.19
Costantini, V., and Crespi, F. (2008). Environmental regulation and the export dynamics of energy technologies. Ecol. Econ. 66 (2-3), 447–460. doi:10.1016/j.ecolecon.2007.10.008
Davis, S. J., Peters, G. P., and Caldeira, K. (2011). The supply chain of CO2 emissions. Proc. Natl. Acad. Sci. U. S. A. 108 (45), 18554–18559. doi:10.1073/pnas.1107409108
Dietzenbacher, E., Guilhoto, J., and Imori, D. (2012). The role of Brazilian regions in the global value chain. SSRN Journal-USP Work. Pap. 2013, 15. doi:10.2139/ssrn.2402274
Dong, F., Li, Y., Zhang, X., Zhu, J., and Zheng, L. (2021). How does industrial convergence affect the energy efficiency of manufacturing in newly industrialized countries? Fresh evidence from China. J. Clean. Prod. 316, 128316. doi:10.1016/j.jclepro.2021.128316
Eaton, J., and Kortum, S. (2001). Technology, trade, and growth: A unified framework. Eur. Econ. Rev. 45 (4-6), 742–755. doi:10.1016/S0014-2921(01)00129-5
Eichhammer, W., and Wilhelm, M. (1997). Industrial energy efficiency: Indicators for a European cross-country comparison of energy efficiency in the manufacturing industry. Energy Policy 25 (7-9), 759–772. doi:10.1016/S0301-4215(97)00066-9
Halpern, L., Koren, M., and Szeidl, A. (2015). Imported inputs and productivity. Am. Econ. Rev. 105 (12), 3660–3703. doi:10.1257/aer.20150443
He, L. Y., and Huang, G. (2020). Processing trade and energy efficiency: Evidence from Chinese manufacturing firms. J. Clean. Prod. 276, 122507. doi:10.1016/j.jclepro.2020.122507
Huang, J., Du, D., and Tao, Q. (2017). An analysis of technological factors and energy intensity in China. Energy Policy 109, 1–9. doi:10.1016/j.enpol.2017.06.048
Hummels, D., Ishii, J., and Yi, K. M. (2001). The nature and growth of vertical specialization in world trade. J. Int. Econ. 54 (1), 75–96. doi:10.1016/S0022-1996(00)00093-3
Imbruno, M., and Ketterer, T. D. (2018). Energy efficiency gains from importing intermediate inputs: Firm-level evidence from Indonesia. J. Dev. Econ. 135, 117–141. doi:10.1016/j.jdeveco.2018.06.014
Jahanger, A., Usman, M., Murshed, M., Mahmood, H., and Balsalobre-Lorente, D. (2022). Thelinkages between natural resources, human capital, globalization, economic growth, financial development, and ecological footprint: The moderating role of technological innovations. Resour. Policy 76, 102569. doi:10.1016/j.resourpol.2022.102569
Jenne, C. A., and Cattell, R. K. (1983). Structural change and energy efficiency in industry. Energy Econ. 5 (2), 114–123. doi:10.1016/0140-9883(83)90018-X
Jiang, T., Li, S., Yu, Y., and Peng, Y. (2022a). Energy-related carbon emissions and structural emissions reduction of China’s construction industry: The perspective of input–output analysis. Environ. Sci. Pollut. Res. 29 (26), 39515–39527. doi:10.1007/s11356-021-17604-1
Jiang, T., Yu, Y., Jahanger, A., and Balsalobre-Lorente, D. (2022b). Structural emissions reduction of China's power and heating industry under the goal of “double carbon”: A perspective from input-output analysis. Sustain. Prod. Consum. 31, 346–356. doi:10.1016/j.spc.2022.03.003
Johnson, R. C., and Noguera, G. (2012). Accounting for intermediates: Production sharing and trade in value added. J. Int. Econ. 86 (2), 224–236. doi:10.1016/j.jinteco.2011.10.003
Kahrl, F., and Roland-Holst, D. (2008). Energy and exports in China. China econ. Rev 19 (4), 649–658. doi:10.1016/j.chieco.2008.05.004
Kee, H. L., and Tang, H. (2016). Domestic value added in exports: Theory and firm evidence from China. Am. Econ. Rev. 106 (6), 1402–1436. doi:10.1257/aer.20131687
Koopman, R., Wang, Z., and Wei, S. J. (2014). Tracing value-added and double counting inGross exports. Am. Econ. Rev. 104 (2), 459–494. doi:10.1257/aer.104.2.459
Li, F. (2020). Chinese provincial regional role under the dual value chain - a comprehensive theoretical analysis framework. China Ind. Econ. 1, 136–154. doi:10.19581/j.cnki.ciejournal.2020.01.009
Li, F. (2016). How did China’s national value chain form? J. Quant. Tech. Econ. 33 (9), 76–94. doi:10.13653/j.cnki.jqte.2016.09.005
Li, K., and Lin, B. (2018). How to promote energy efficiency through technological progress in China? Energy 143, 812–821. doi:10.1016/j.energy.2017.11.047
Li, S. T., He, J. B., and Liu, Y. Z. (2018). Research on division of labor of China’s domestic value chain from the perspective of global value chain. Manage. Rev. 30 (5), 9–18. doi:10.14120/j.cnki.cn11-5057/f.2018.05.002
Li, S., Yu, Y., Jahanger, A., Usman, M., and Ning, Y. (2022). The impact of green investment, technological innovation, and globalization on CO2 emissions: Evidence from MINT countries. Front. Environ. Sci. 156. doi:10.3389/fenvs.2022.868704
Liu, H., Li, J., Long, H., Li, Z., and Le, C. (2018). Promoting energy and environmental efficiency within a positive feedback loop: Insights from global value chain. Energy Policy 121, 175–184. doi:10.1016/j.enpol.2018.06.024
Liu, P., and Xia, Y. (2021). China's provinces' value-added export and embedding in value chains - from the perspective of global value chain and national value chain. J. Int. Trade. 5, 109–126. doi:10.13510/j.cnki.jit.2021.05.008
Ma, D., and Yu, X. (20212021). Characteristics and enlightenment of China’s regional trade value added. J. Quant. Tech. Econ. 38 (12), 3–24. doi:10.13653/j.cnki.jqte.2021.12.002
Mandal, S. K. (2010). Do undesirable output and environmental regulation matter in energy efficiency analysis? Evidence from Indian cement industry. Energy Policy 38 (10), 6076–6083. doi:10.1016/j.enpol.2010.05.063
Martin, R., Muûls, M., De Preux, L. B., and Wagner, U. J. (2012). Anatomy of a paradox: Management practices, organizational structure and energy efficiency. J. Environ. Econ. Manage. 63 (2), 208–223. doi:10.1016/j.jeem.2011.08.003
McGuire, M. C. (1982). Regulation, factor rewards, and international trade. J. Public Econ. 17 (3), 335–354. doi:10.1016/0047-2727(82)90069-X
Meng, B., Wang, Z., and Koopman, R. (2013). How are global value chains fragmented and extended in China's domestic production networks?. Institute of Developing Economies, JETRO. doi:10.20561/00037746
Meng, B., and Yamano, N. (2017). Compilation of a regionally extended inter-country input–output table and its application to global value chain analyses. J. Econ. Struct. 6 (1), 23. doi:10.1186/s40008-017-0081-z
Pethig, R. (1976). Pollution, welfare, and environmental policy in the theory of comparative advantage. J. Environ. Econ. Manage. 2 (3), 160–169. doi:10.1016/0095-0696(76)90031-0
Shen, N. (2012). Environmental efficiency, industrial heterogeneity and intensity of optimal regulation - nonlinear test based on industrial panel-data. China Ind. Econ. 3, 56–68. doi:10.19581/j.cnki.ciejournal.2012.03.005
Su, Q. Y. (2016). Tracing value added in China’s exports at the provincial level. Econ. Res. J. 51 (01), 84–98+113.
Sun, H., Edziah, B. K., Kporsu, A. K., Sarkodie, S. A., and Taghizadeh-Hesary, F. (2021). Energy efficiency: The role of technological innovation and knowledge spillover. Technol. Forecast. Soc. Change 167, 120659. doi:10.1016/j.techfore.2021.120659
Tiwari, A. K., Kocoglu, M., Banday, U. J., and Awan, A. (2022). Revisiting global energy efficiency and CO2 emission nexus: Fresh evidence from the panel quantile regression model. Environ. Sci. Pollut. Res. 1-18, 47502–47515. doi:10.1007/s11356-022-19101-5
Tone, K. (2002). A slacks-based measure of super-efficiency in data envelopment analysis. Eur. J. Oper. Res. 143, 32–41. doi:10.1016/S0377-2217(01)00324-1
Wang, H., and Wang, M. (2020). Effects of technological innovation on energy efficiency in China: Evidence from dynamic panel of 284 cities. Sci. Total Environ. 709, 136172. doi:10.1016/j.scitotenv.2019.136172
Wang, L., Yue, Y., Xie, R., and Wang, S. (2020). How global value chain participation affects China's energy intensity. J. Environ. Manage. 260, 110041. doi:10.1016/j.jenvman.2019.110041
Wang, S., He, Y., and Song, M. (2021). Global value chains, technological progress, and environmental pollution: Inequality towards developing countries. J. Environ. Manage. 277, 110999. doi:10.1016/j.jenvman.2020.110999
Wang, Y., Wang, J., and Yan, J. (2015). The double effect of global value chain embeddedness on energy conservation and emission reduction–an empirical study on panel data of China’s industries. China Soft Sci. Mag. 296 (8), 148–162. doi:10.3969/j.issn.1002-9753.2015.08.014
Wang, Z., Wei, S. J., Yu, X., and Zhu, K. (2017). Characterizing global value chains: Production length and upstreamness (No. w23261). National Bureau of Economic Research. doi:10.3386/w23261
Wang, Z., Wei, S. J., and Zhu, K. (2013). Quantifying international production sharing at the bilateral and sector levels (No. w19677). National Bureau of Economic Research. doi:10.3386/w19677
Wu, A. H., Cao, Y. Y., and Liu, B. (2014). Energy efficiency evaluation for regions in China: An application of DEA and malmquist indices. Energy Effic. 7 (3), 429–439. doi:10.1007/s12053-013-9232-8
Wu, H., Hao, Y., and Ren, S. (2020). How do environmental regulation and environmental decentralization affect green total factor energy efficiency: Evidence from China. Energy Econ. 91, 104880. doi:10.1016/j.eneco.2020.104880
Yang, T., Chen, W., Zhou, K., and Ren, M. (2018). Regional energy efficiency evaluation in China: A super efficiency slack-based measure model with undesirable outputs. J. Clean. Prod. 198, 859–866. doi:10.1016/j.jclepro.2018.07.098
Yao, X., Shah, W. U. H., Yasmeen, R., Zhang, Y., Kamal, M. A., Khan, A., et al. (2021). The impact of trade on energy efficiency in the global value chain: A simultaneous equation Approach. Sci. Total Environ. 765, 142759. doi:10.1016/j.scitotenv.2020.142759
Yu, Y., Jiang, T., Li, S., Li, X., and Gao, D. (2020). Energy-related CO2 emissions and structural emissions’ reduction in China’s agriculture: An input–output perspective. J. Clean. Prod. 276, 124169. doi:10.1016/j.jclepro.2020.124169
Yu, Y., Li, S., Sun, H., and Taghizadeh-Hesary, F. (2021). Energy carbon emission reduction of China’s transportation sector: An input–output approach. Econ. Anal. Policy 69, 378–393. doi:10.1016/j.eap.2020.12.014
Keywords: global value chain, domestic value chain, dual embedding, energy efficiency, final demand
Citation: Chen G, Cheng S, Gao Q and Li B (2022) How dual value chain embedding affects energy efficiency in China. Front. Environ. Sci. 10:967470. doi: 10.3389/fenvs.2022.967470
Received: 12 June 2022; Accepted: 04 July 2022;
Published: 16 August 2022.
Edited by:
Atif Jahanger, Hainan University, ChinaReviewed by:
Yang Yu, Hainan University, ChinaMuhammad Usman, Wuhan University, China
Ashar Awan, Nişantaşı University, Turkey
Copyright © 2022 Chen, Cheng, Gao and Li. This is an open-access article distributed under the terms of the Creative Commons Attribution License (CC BY). The use, distribution or reproduction in other forums is permitted, provided the original author(s) and the copyright owner(s) are credited and that the original publication in this journal is cited, in accordance with accepted academic practice. No use, distribution or reproduction is permitted which does not comply with these terms.
*Correspondence: Guo Chen, Z3VvY2hlbkBodWJ1LmVkdS5jbg==; Shixiong Cheng, Y3N4Y3N4MDA3QGh1YnUuZWR1LmNu