- School of Economics and Management, Beijing Forestry University, Beijing, China
As one of the means of informal environmental regulation, environmental information disclosure has an essential impact on improving green energy efficiency. This paper selects the panel data of 113 environmental information disclosure cities in China from 2008 to 2018 and uses the Super-efficiency SBM model with undesirable outputs to measure green energy efficiency. Based on the measurement results, this paper empirically studies the impact of environmental information disclosure on green energy efficiency and its spatial spillover effect using the spatial Durbin model. The main conclusions are as follows: 1) From 2008 to 2018, the average green energy efficiency of 113 environmental information disclosure cities in China was 0.6676, and the regional distribution showed the characteristics of “high in the East and low in the west.” 2) Both environmental information disclosure and green energy efficiency have significant spatial correlation and show the characteristics of “high-high” and “low-low” agglomeration in spatial distribution. 3) Environmental information disclosure can significantly improve green energy efficiency in the region and surrounding areas. After the robustness test and endogenous test, the conclusion is still robust. 4) The impact of environmental information disclosure on green energy efficiency in the eastern region is significantly more significant than in the central and western regions. This paper provides a theoretical reference for the government to formulate corresponding environmental policies to promote green energy efficiency and promote green and sustainable economic development.
Introduction
Since the reform and opening-up, China’s economic development has made remarkable achievements, creating a “Chinese miracle” of economic development (Wang and Zhao, 2021; Zhang and Song, 2021). China’s rapid economic growth is inseparable from energy consumption (Zhang and Chen, 2022). According to the survey data from China energy statistical yearbook, China’s total energy consumption in 2000 was 146,964 (million tons of standard coal). It increased to 498,000 (million tons of standard coal) in 2020, becoming the largest energy-consuming country in the world. Although energy consumption has promoted the rapid growth of China’s economy, for a long time, China’s economic growth has been dominated by the development model of high pollution, high emissions, low efficiency, and the energy utilization efficiency is low (Yu, 2021). This extensive development model has led to severe environmental pollution and restricted the sustainable development of China’s economy (Li et al., 2021). To solve the contradiction between economic growth and environmental pollution and promote sustainable economic growth, the Chinese government proposed the green development model. This development model emphasizes environmental protection under the constraints of ecological environment capacity and resource carrying capacity (Meng and Qu, 2022). Energy consumption is one of the critical factors in promoting economic development. Promoting the green transformation of energy consumption, coordinating energy consumption with environmental protection, and improving green energy efficiency are essential to promoting the green and sustainable development of China’s economy.
Studies have shown that environmental regulation is an essential factor in improving green energy efficiency (Du et al., 2022). Environmental regulation includes formal environmental regulation and informal environmental regulation. The government is the main force of formal environmental regulation, and its means mainly include the direct adoption of control command-based policies (Chen et al., 2018) and economic policies (Liu et al., 2020). Environmental non-governmental organizations (ENGOs) are the main force of informal environmental regulation. ENGOs refer to non-governmental organizations with the theme of environmental protection, which can provide public welfare services related to the environment but do not have administrative power (Bu et al., 2022). Environmental information disclosure (EID) is one of the main means of non-governmental environmental regulation. ENGOs can encourage the public to play a more significant role in environmental governance by collecting and processing environmental information and making it public in an easy way to understand (Li et al., 2021). With the continuous development of ENGOs in recent years, informal environmental regulation has played an increasingly important role in environmental protection. It has become a powerful supplement to formal environmental regulation. However, from the existing research, scholars’ research on environmental regulation and green energy efficiency still focuses on the impact of formal environmental regulation on green energy efficiency (Du et al., 2022; Wu and Lin, 2022). Whether informal environmental regulation with environmental information disclosure as the primary means can affect green energy efficiency remains to be further discussed. Therefore, the main purposes of this paper are as follows: 1) How to reasonably measure the green energy efficiency of 113 critical environmental protection cities? 2) Can environmental information disclosure improve green energy efficiency? 3) Does environmental information disclosure have a spatial spillover effect and regional heterogeneity on green energy efficiency? The answers to these questions can provide corresponding theoretical support for the government to formulate environmental policies, promote the improvement of green energy efficiency, and promote the green and sustainable development of China’s economy.
The rest section of this paper is arranged as follows: Literature review is the literature review; Methodology and data is the method and data, including the Super-efficiency SBM model with undesirable output and spatial Durbin model; Empirical results is the empirical results, including DEA measurement results, benchmark regression results, robustness, endogenous discussion, and heterogeneity analysis; Discussions discusses the conclusions drawn from the empirical study; Section 6 is the conclusion and policy recommendations.
Literature review
Environment information disclosure
China has made significant progress in environmental information disclosure (EID) in recent years, and more scholars have begun studying EID. This paper discusses the related research of EID from the macro and micro perspectives.
From the macro perspective, scholars mainly focus on the impact of EID on pollution emissions, industrial structure, technological innovation, and government environmental policy-making (Liu et al., 2022). For example, Feng et al. (2021) selected the PITI data of 113 EID cities from 2008 to 2018 to study the impact of EID on haze pollution and proposed that EID could inhibit haze pollution. Liu et al. (2021) selected the PITI data from 2003 to 2017 and used the DID model to verify the impact of EID on the upgrading of regional industrial structures. They considered that EID significantly promotes the upgrading of urban industrial structures. Li et al. (2022) also used the DID model to verify that EID can improve the level of regional green technology innovation. Wang et al. (2022) empirically test the impact of EID on the government supply of public goods using the spatial Durbin model.
From the micro perspective, scholar mainly focuses on the impact of EID on the environmental protection behavior of enterprises (Xie et al., 2022). For instance, Xie et al. (2022) examined the impact of EID on the export of enterprises by using data from China’s manufacturing industry from 2000 to 2013. They concluded that EID only impacts the export value and export intensity of enterprises in the cleaner production industry with a high degree of EID cities. Shi et al. (2021) regarded the PTTI published in 2008 as a quasi-natural experiment, used the matching data of China’s industrial enterprise database and China’s industrial enterprise pollution database from 2003 to 2012, and discussed the impact of EID on the emission reduction of industrial enterprises using the DID method. They proposed that EID can significantly reduce SO2 emissions from industrial enterprises.
Green energy efficiency
Firstly, the measurement of green energy efficiency. Energy efficiency, including labor, capital, energy, and other production input factors in the production function, reflects the impact of production factors on economic output (Yu, 2021). However, although energy input can promote economic growth and bring desirable outputs, it will also produce environmental pollution and bring undesirable outputs. Therefore, the energy efficiency calculated by incorporating the undesirable outputs into the energy measurement efficiency system is called green energy efficiency (Du et al., 2022). From the existing research, the measurement of green energy efficiency mainly includes SFA and DEA. Stochastic Frontier analysis (SFA) is a parameter analysis method. When measuring green energy efficiency, we need to accurately give the specific production function and strictly assume the probability distribution of the error term (Kumbhakar et al., 2015). In practice, if the production function is set incorrectly, the measurement results will differ from the actual situation. Therefore, the SFA model is not the best to measure green energy efficiency. DEA model is a nonparametric analysis method. Unlike the SFA model, the DEA model does not need to set the form of the production function. It calculates the objective function through the linear programming method, simulates the production process of multi-input and multi-output, and thus obtains the efficiency value of the decision-making unit (DMU) (Guo et al., 2018). In addition, the DEA model can distinguish between the desirable outputs and undesirable outputs, which provides the possibility to measure green energy efficiency. Given the advantages of the DEA model, most scholars choose the DEA model to estimate green energy efficiency (Chen and Lin, 2021; Wang and Zhao, 2021; Zhang and Chen, 2022).
Secondly, the influencing factors of green energy efficiency. Many scholars believe that foreign direct investment (Pan et al., 2020), environmental regulation (Du et al., 2022; Wu and Lin, 2022), economic growth (Zhu and Lin, 2022), Internet development (Wu et al., 2021), and resource allocation efficiency (Hao et al., 2020) can affect the green energy efficiency. However, these factors are mostly discussed from the macro level, and few studies discuss the impact of environmental information disclosure on energy efficiency. Bu et al. (2022) discussed the impact of EID on enterprise energy efficiency and believed that EID could significantly improve enterprise energy efficiency. However, there is still no research on the impact of EID on urban green energy efficiency.
The existing literature has laid a good theoretical foundation for this study. However, there are still some deficiencies: 1) From the perspective of research content, the existing research rarely discusses the impact of environmental information disclosure on green energy efficiency and its spatial spillover effect. 2) Regarding research methods, scholars mostly measure GEE based on provincial data, and few scholars involve GEE at the city level. In addition, as for the impact of EID on GEE, no scholars have used the spatial econometric model to explore the causal relationship between the two and its spatial spillover effect.
To sum up, the marginal contributions of this paper are as follows: 1) The impact of environmental information disclosure on green energy efficiency and its spillover effect are deeply discussed in this paper. 2) Based on the panel data of 113 EID cities in China, the Super-efficiency SBM model with undesirable output is used to measure GEE. It provides a new data processing idea for the measurement of urban green energy efficiency. 3) The spatial Durbin model is used to study the impact of EID on GEE and its spatial spillover effect. This model can solve the problem that the ordinary OLS regression model ignores spatial correlation, thus improving the robustness of the results. 4) The possible endogenous problems can be solved reasonably by selecting the instrumental variables. The heterogeneity is discussed according to China’s different regions and development stages so that the research conclusion is closer to the actual situation in China.
Methodology and data
Study area
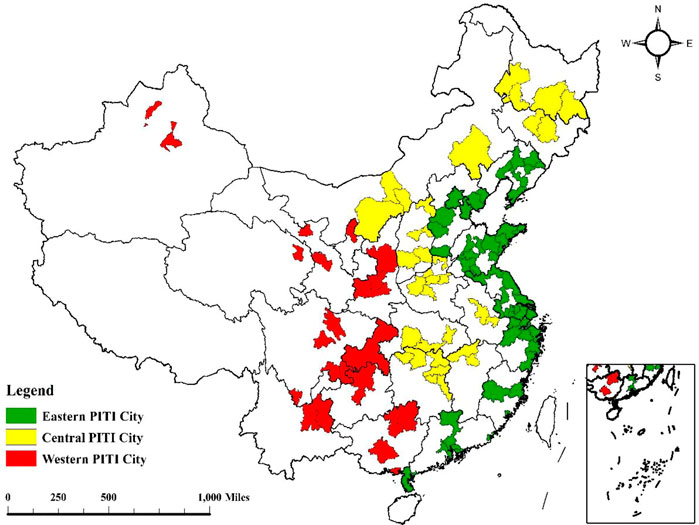
In May 2008, the Chinese government began to implement the measures for environmental information disclosure. To promote the further disclosure of environmental information, the Institute of Public and Environmental Affairs (IPE) and the Natural Resources Defense Council (NRDC) released the first phase of the Pollution Information Transparency Index (PITI) in June 2009. The index was first composed of environmental information disclosure scores of 113 sample cities in China. Since 2013, the research sample has expanded from 113 cities to 120. To ensure the continuity of the research samples, this paper selects 113 cities that published PITI data in 2008 to carry out the research. Figure 1 shows the study area of this paper. As can be seen from Figure 1, these 113 cities cover the capital cities of 29 provincial administrative regions in China (excluding Hong Kong, Macao, Taiwan, Hainan, and Tibet in China), coastal port cities, special economic zone cities, key tourist cities, and so on, which are widely distributed in the eastern, central and western regions of China.
Spatial econometric model
Spatial weight matrix (W)
Setting the spatial weight matrix is critical in analyzing the problem with the spatial econometric model. There are three standard spatial weight matrices: geographical distance weight matrix (W1), 0-1 weight matrix (W2), and economic weight matrix (W3). Formula 1 is the geographic distance weight matrix. The weight matrix is constructed (1/d2) based on the reciprocal of the square of the geographical distance between the two regions. Formula 2 is the 0-1 weight matrix. The weight matrix is used to reflect the adjacency relationship between regions. If the two regions are adjacent on the administrative boundary, the value is assigned as one; otherwise, it is 0. Formula 3 is the economic weight matrix. The economic distance matrix is calculated based on the GDP development level of each region. Some cities have no adjacency relationship in geographical location, but they are relatively close in economic development. Due to the existence of the “learning effect” and “imitation effect” between regions, there is an interaction between economic variables (Du et al., 2022).
Spatial correlation test
The first law of geography states that everything is related to everything else, but near things are more connected than distant things (Tobler, 1970). Since the law was proposed, many scholars have researched the spatial correlation of economic variables (Feng et al., 2019; Ge et al., 2021; Han et al., 2020; Li and Wu, 2017; Wang et al., 2021). The spatial correlation test is a method to verify whether there is a spatial correlation between variables. We usually use Moran Index for the spatial correlation test. Moran Index includes Global Moran Index and Local Moran Index. The Global Moran index identifies a spatial correlation between variables in different regions. The local Moran index examines whether similar or different observations are clustered in a local area.
The calculation formula of global Moran’s I is shown as follows:
Where
The local Moran index is mainly used to judge the spatial agglomeration near an area, and the calculation formula is as follows:
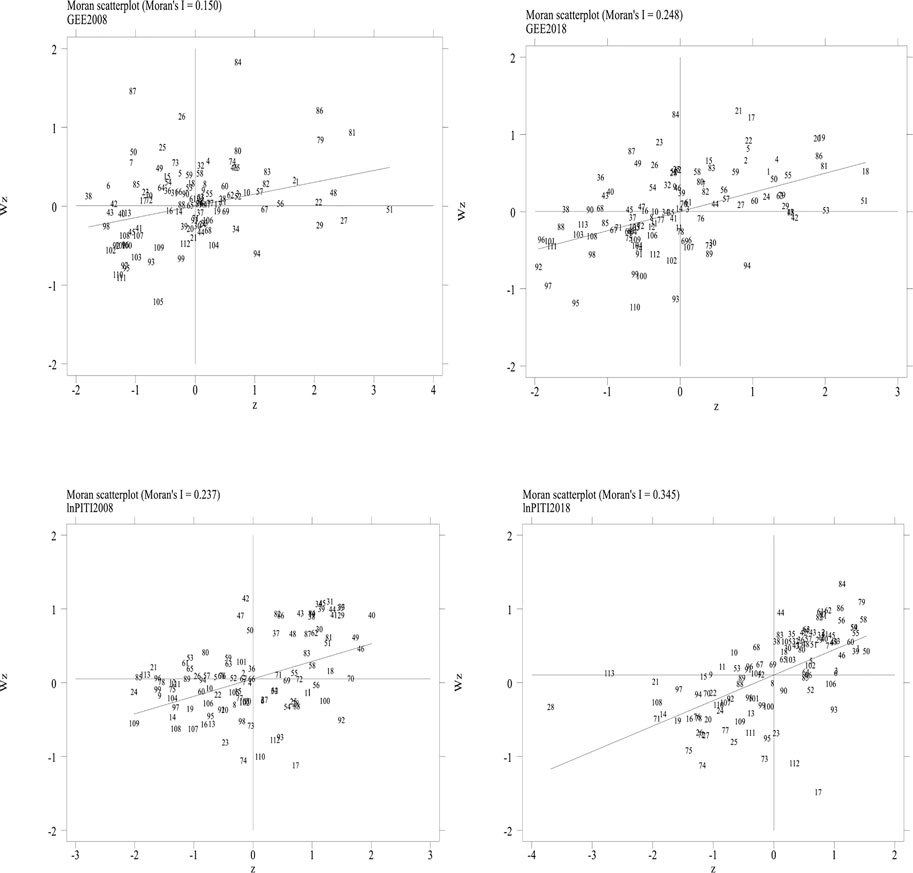
Local spatial correlation is usually described by Moran scatter diagram. The horizontal axis represents the current value of the sample variable, and the vertical axis represents the spatial lag term. The four quadrants of the graph divide the spatial correlation between the sample area and its neighboring areas into four relationships: “high-high” (HH), “high-low” (HL), and “low-low” (LL) and “low-high” (LH). Among them, “high-high” (HH) and “low-low” (LL) indicate that there is a significant spatial positive correlation between the research samples, that is, the sample area is a high value (low value), and the surrounding area is also high value (low value); The “high-low” (HL) and “low-high” (LH) indicate that there is a significant negative spatial correlation between the samples, that is, the sample area is a high value (low value), but the surrounding area is a low value (high value).
Model established
According to Yu (2021) and Lou et al. (2021), we constructed the following OLS model to verify the impact of EID on GEE. The details are shown in the following Formula 6.
In Formula 6, GEEit is the explained variable, which represents the green energy efficiency of city i in year t. PITIit is the core explanatory variable, indicating the environmental information disclosure of city i in year t. X represents the control variables.
The OLS model does not consider the spatial correlation between variables. Therefore, to further analyze the possible spatial spillover effect of EID on GEE, this paper will build a spatial econometric model to verify the impact of EID on GEE and its spatial spillover effect. Spatial econometric models mainly include the following three types: spatial lag model (SAR), spatial error model (SEM), and spatial Durbin model (SDM) (Anselin and Getis, 1992; Elhorst, 2010, 2014). The spatial models constructed in this paper are shown in the following Formula 7, Formula 8, and Formula 9.
In Formula 7, Formula 8, and Formula 9, ρ is the spatial regression coefficient of green energy efficiency; λ Is the spatial error coefficient, η Is the spatial regression coefficient of PITI, θ Is the spatial regression coefficient of the control variable. W stands for spatial weight matrix. Formula 7 is the SAR model, which only contains the spatial regression coefficients of the explained variables. This means that the SAR model only considers the spatial spillover effects of the explained variables and does not consider the spatial spillover effects of the core explanatory variables and other variables. Formula 8 is the SEM model, reflecting the spatial spillover effect of random disturbance terms. The spatial Durbin model represented by Formula 9 includes the spatial regression coefficients of the explained variables and explanatory variables. This shows that the SDM model can consider the spatial spillover effects of explained variables and explanatory variables. It is worth noting that when
Although the spatial Durbin model covers the spatial and non-spatial correlation terms of sample variables, it does not fully reflect the spatial effects (Lesage and Pace, 2010). Therefore, in order to analyze the entire impact paths of EIDs on GEE, according to Lesage and Pace (2010) and Elhorst (2014), this paper adopts the method of partial differential equation to divide the impact of EID on GEE into direct effect, indirect effect and total effect. The direct effect refers to the influence of explanatory variables on the explained variables in the local province. The indirect effect also called the spillover effect, measures the degree of the explanatory variable of the local province that affects the explained variable of the adjacent provinces. The total effect is the sum of direct effect and indirect effect. The general form of the SDM model is shown in Formula 10:
Find the partial differential equation about the kth explanatory variable for the explained variable vector Y in Formula 10, and we can get Formula 11.
Among them, the direct effect of the kth explanatory variable is the average value of each element of the main diagonal in the matrix; The kth explanation changes the indirect effect into the average value
Variable selection
GEE
Green energy efficiency (GEE) is the explained variable in this paper. The Super-efficiency SBM model with undesirable outputs will be used to estimate the green energy efficiency of each PTIT city. The Super-efficiency SBM model proposed by Tone (2002) is a non-radial DEA model, which can measure energy efficiency from both input and output. The Super-efficiency SBM model can solve the problem that the traditional radial DEA model does not include slack variables in efficiency measurement. In reality, energy use in a region can increase production efficiency and promote economic growth, but it also creates environmental pollution problems. Environmental pollution caused by energy use is a typical undesirable output. Therefore, when calculating energy efficiency, we need to consider the impact of undesirable output on energy efficiency. Tone (2003) added undesirable output based on the Super-efficiency SBM model and proposed a Super-efficiency SBM model with undesirable output.
Suppose there are n decision-making units (DMU), and each DMU contains 3-factor sets, namely input set m, desirable output factor set q1, and undesirable output factor set q2. Then, the vector sets of input, desirable output, and undesirable output can be written as
In the formula:
According to Yu (2021), Zhang and Chen (2022), and Du et al. (2022), we have used the Super-efficiency SBM with undesirable outputs model to measure the green energy efficiency in 113 EID cities. Table 1 is the input and output indicators system of green energy efficiency.
The input indicators are as follows: 1) Labor input: the number of employees in each city at the end of the year as the indicator of labor input in this paper. 2) Capital input: according to the total investment in fixed assets of each city, we calculated the capital investment of each city by using the perpetual inventory method. The specific calculation method is:
The output indicators are as follows: 1) Desirable output: the GDP of each city is used to represent desirable output in this paper. 2) Undesirable outputs: Considering that in industrial production, more than 70% of SO2, smoke, and dust are caused by coal combustion (Du et al., 2022). Therefore, this paper selected industrial wastewater discharge, industrial sulfur dioxide discharge, and industrial smoke (dust) discharge as undesirable outputs.
EID
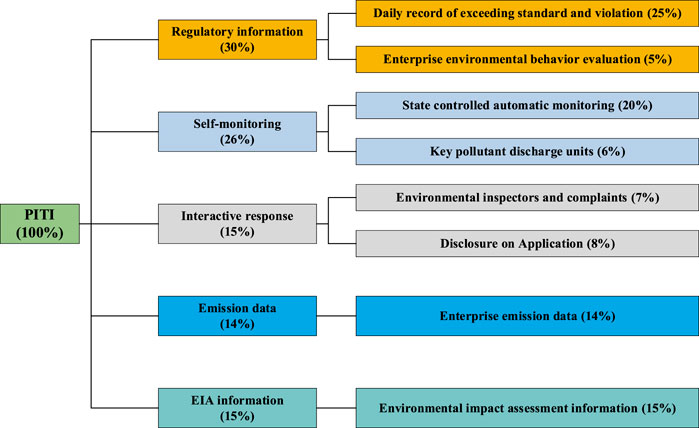
This paper uses the Pollution Information Transparency Index (PITI) published by the IPE and the NRDC as the proxy index of EID. Therefore, the PITI is the core explanatory variable in this paper. Since the release of the index, China’s progress in environmental regulatory information transparency has been widely recognized by the international community and scholars (Li et al., 2021). PITI mainly evaluates five aspects, including “regulatory information,” “self-monitoring,” “interactive response,” “emission data,” and “environmental impact assessment information,” covering eight secondary indicators. Each indicator is set with its weight, and quantitative evaluation is carried out through the four dimensions of systematicness, timeliness, integrity, and friendliness. The composition of the PITI index is shown in Figure 2 below.
Control variables
In order to avoid ignoring other factors affecting energy efficiency, the following control variables are added in the regression process: 1) economic development level (lnRGDP). This paper uses the logarithm of the per capita GDP of each city to measure the economic development level of each region. 2) Urban scale (lnScale). In this paper, the logarithm of the total population at the end of the year is used as the proxy variable of the city size. 3) Government intervention (Gov). This paper uses the proportion of fiscal expenditure to fiscal revenue as the proxy variable of government intervention. 4) Degree of opening up (Open). This paper uses the proportion of foreign direct investment in GDP to measure the degree of opening to the outside world. It is worth noting that the original foreign direct investment data are in US dollars. We convert the foreign direct investment into RMB according to the exchange rate of US dollars against RMB provided by the OECD database. 5) Financial development level (Fin). This paper uses the ratio of the total year-end loans of financial institutions in various regions to the total year-end deposits of financial institutions as an indicator to measure the level of financial development. 6) Industrial structure (IS). This paper uses the proportion of the total output value of the secondary industry in GDP as an index to measure the industrial structure.
Data sources and statistical description
This paper selects the panel data of 113 EID cities in China from 2008 to 2018 to conduct empirical research. Among them, the data on environmental information disclosure comes from the PITI published by IPE and NRDC from 2009 to 2019. The original data of all other variables are from the official data published in the 2009–2019 China Urban Statistical Yearbook and the statistical yearbooks of all provinces. This paper uses the linear interpolation method to supplement a small number of missing values in the sample data. In addition, to solve the dimensional problem of different indicators and improve the authenticity and robustness of the regression results, we took logarithms of PITI, per capita GDP, and city size in the regression process. The statistical description of the samples is shown in Table 2 below1.
Empirical results1
Temporal and spatial distribution characteristics GEE
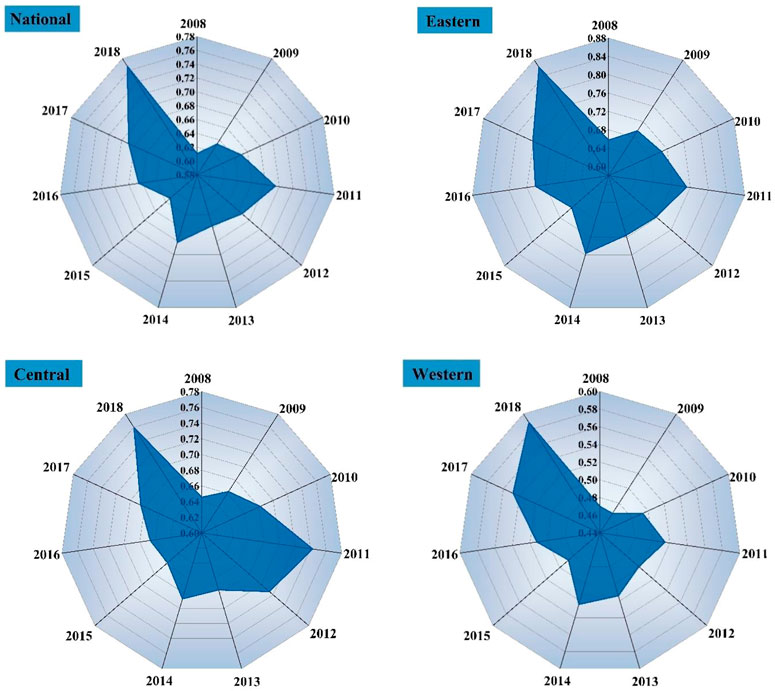
According to the Super-efficiency SBM with undesirable outputs model, we calculated the GEE of 113 EID cities in China from 2008 to 2018. The calculation results are shown in Figures 3, 4 reflects the temporal distribution characteristics of green energy efficiency from 2008 to 2018. We can find that the average value of GEE in 113 EID cities was 0.6676 (GEE<1) from 2008 to 2018, which indicates that green energy efficiency is relatively low and needs to be further improved. From the perspective of temporal distribution characteristics, the GEE of 113 EID cities showed a fluctuating upward trend from 2008 to 2018. The average value in 2008 was 0.6107, and it rose to 0.751 in 0.7667, with a growth rate of 25.54%. It shows that the GEE has been continuously improved, and more attention has been paid to environmental protection in energy use.
In order to further explain the regional differences of green energy efficiency, we divided China into eastern, central, and western regions. As shown in Figure 3, the average values of GEE in eastern, central, and western are 0.7318, 0.6889, and 0.5105, respectively. The eastern region is close to the national average, and the central and western regions are lower than the national average. The three regions also show a fluctuating upward trend in terms of temporal distribution characteristics.
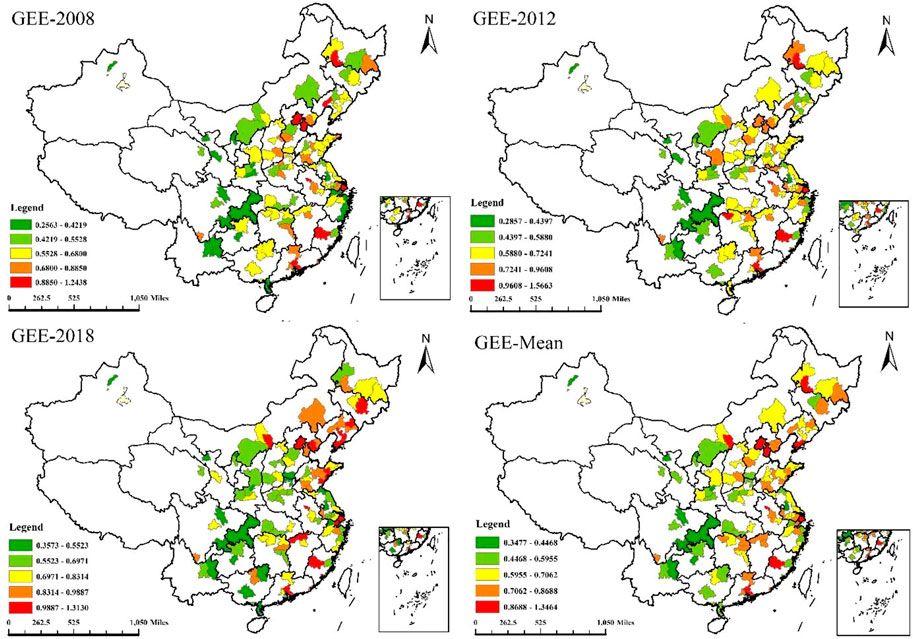
From Figure 4, we can find that there are also significant geographical differences in the green energy efficiency of 113 EID cities. The spatial distribution characteristics of GEE show a trend of “high in the east, low in the west” and gradually decreasing from east to west. Among them, the three cities with the highest green energy efficiency are Shenzhen (1.3464), Shanghai (1.1584), and Guangzhou (1.1226). These three cities are located in the economically developed eastern region. The three cities with the lowest green energy efficiency are Shizuishan (0.3751), Mianyang (0.3615), and Chongqing (0.3477). The three cities are located in the western region of China.
Results of spatial correlation test
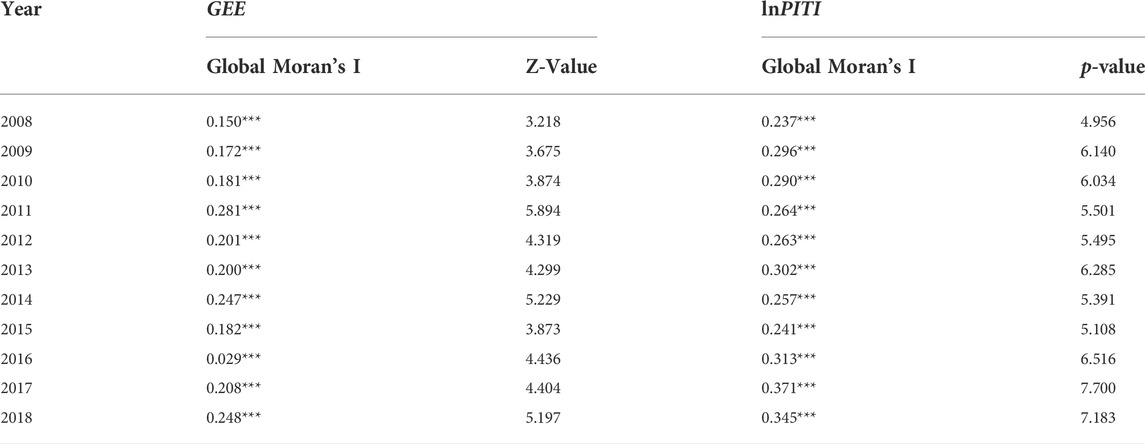
As is shown in Table 3, the Global Morans’ I of GEE and lnPITI were significant at the significance level of 1% from 2008 to 2018. This indicates that green energy efficiency and environmental information disclosure have a high positive spatial correlation.
However, the spatial distribution of GEE and EID is not random. Cities with similar GEE and EID show a significant spatial agglomeration characteristic. Figure 5 is the Local Moran scatter diagram of GEE and lnPITI. As can be seen from the Local Moran scatter diagram, most cities are scattered in the first and the third quadrant, suggesting that the GEE and EID show a prominent spatial agglomeration characteristic of “high-high” and “low-low.” Therefore, we believe that the spatial econometric model can be used in the following analysis.
Benchmark regression results
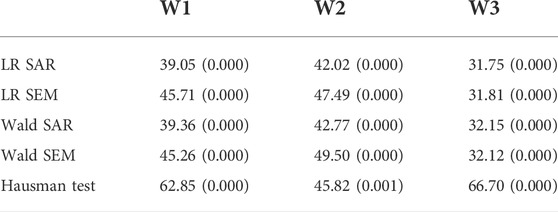
Before empirical analysis, we need to use the LR, Wald, and Hausman tests to find the appropriate model for further analysis (Lesage and Pace, 2014; Wang. et al., 2022). Table 4 shows the results of LR, Wald, and Hausman tests under spatial matrices W1, W2, and W3. According to the results, we can find that the p-values of the LR and Wald tests are all 0.000, indicating that the SDM model cannot be converted into SAR and SEM models. Therefore, the SDM model is suitable for further analysis. In addition, the p-value of the Hausman test is 0.000, which shows that the fixed effect model is better than the random model.
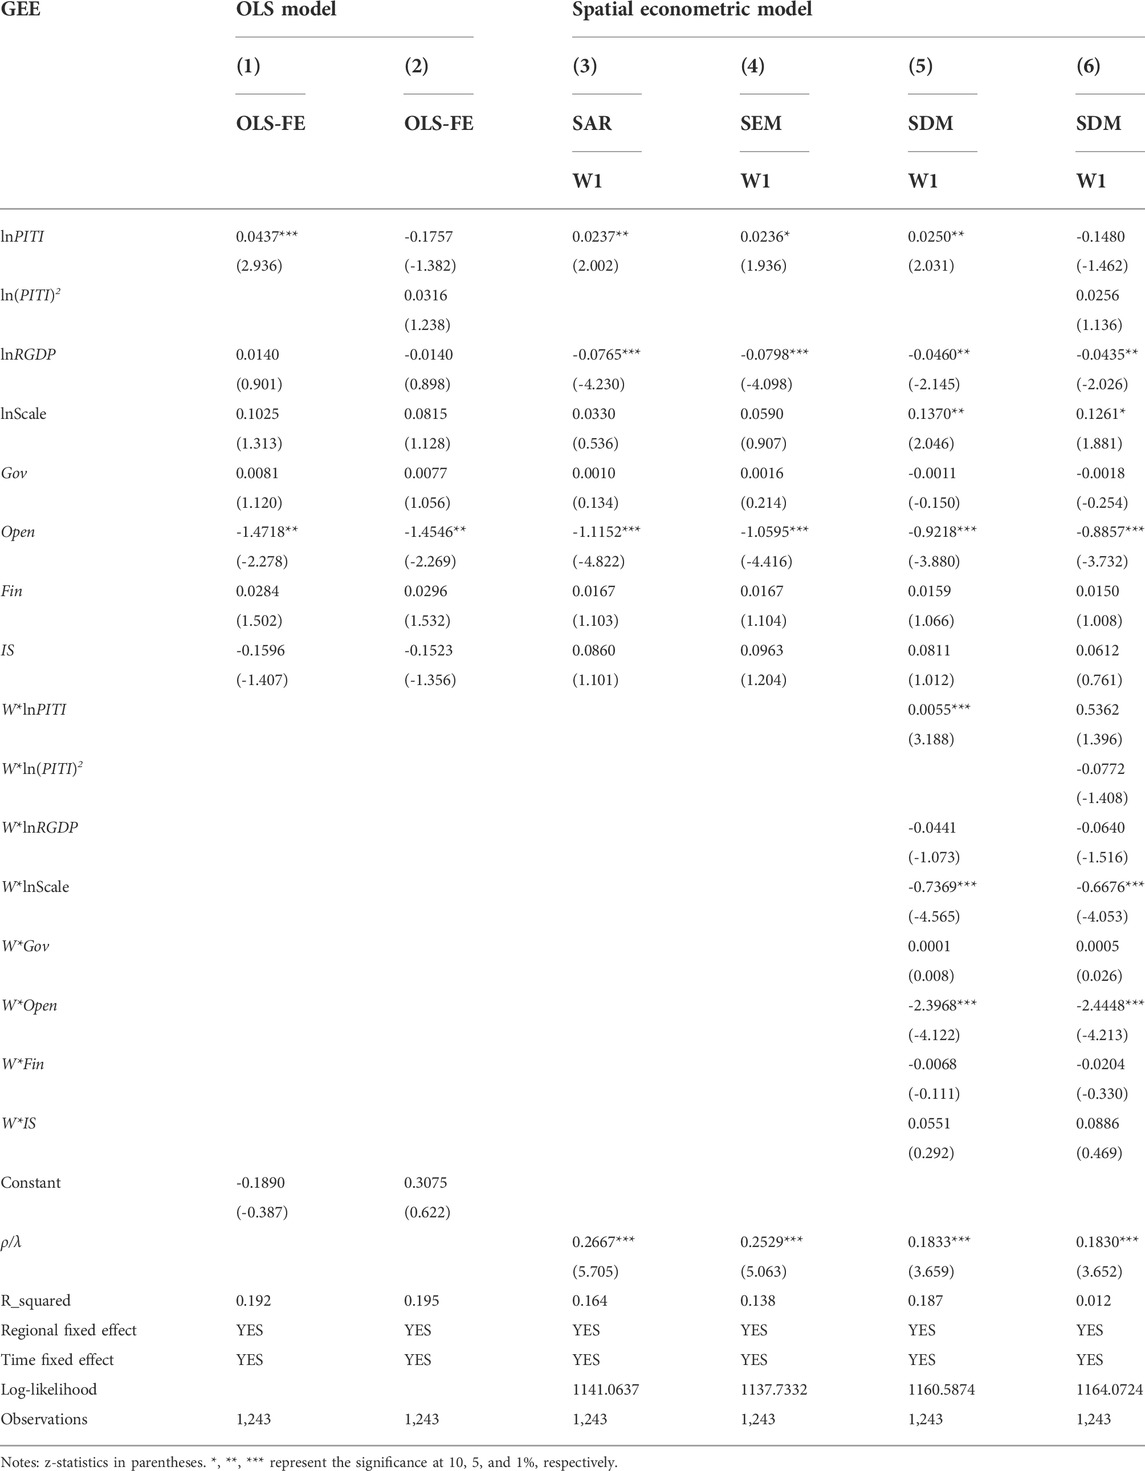
To identify the impact of EID on GEE and its spatial spillover effect, Table 5 gives the benchmark regression results of the OLS model and spatial econometric model. Columns (1) and (2) are the regression results of the OLS model without considering spatial factors. From column (1), we can find that the coefficient of lnPITI is 0.0437, which is positive and significant at the 1% level. This indicates that the EID has a significant positive impact on GEE; that is, a 1% increase in EID can promote GEE growth by 0.0437. In column (2), we added the quadratic term lnPITI to the regression equation. The results show that the primary term of ln PITI is negative and the second term of lnPTIT is positive, both of which are insignificant. This shows no “U-Shape” non-linear relationship between EID and GEE. This conclusion is consistent with Lou et al. (2021).
Columns (3)–(6) are the regression results of the spatial econometric model under the geographic distance weight matrix (W1). Because the spatial econometric model assumes spatial correlation among regions, the classical assumption of the OLS model cannot be used in this case (Du et al., 2022). Therefore, we use the Maximum Likelihood Estimation method. As shown in columns (3)–(6), under the three spatial econometric models, the coefficient of lnPITI is still significantly positive. This is the same as the result of the OLS model. This proves once again that EID is conducive to the promotion of GEE. In addition, the spatial lag terms of SAR, SEM, and SDM models ρ/λ are positive at the significance level of 1%. This shows a significant spatial spillover effect in green energy efficiency; that is, the improvement of GEE in this region can drive the improvement of GEE in surrounding regions. LR test and Wald test verify that the SDM model is more suitable for analyzing the impact of EID on GEE. Therefore, this paper mainly uses the regression results of column (5) to explain.
Column (5) is the regression result of the SDM model. The coefficient of spatial lag term ρ is 0.1833, which is positive at the significance level of 1%. This shows a significant positive spatial spillover effect in the energy efficiency of the 113 EID cities. In the process of promoting green energy efficiency, cities should strengthen exchanges and cooperation in cleaner production and other fields, not formulate local protection policies, and avoid the phenomenon of “beggar thy neighbor” (Yu, 2021; Du et al., 2022). The coefficient of lnPITI is 0.0250, which is positive and significant at the 5% level. This means that EID can promote the improvement of GEE in the local region. The coefficient of W*lnPITI is 0.0055, which is positive and significant at the 1% level. This indicates that a 1% increase of EID in the local region can boost the GEE of the adjacent areas by 0.0055. This result shows a significant “learning effect” in each region when environmental information is disclosed. Cities with better environmental information disclosure will be learned by surrounding cities, which will drive the improvement of the green energy efficiency of neighboring cities.
The regression results of control variables show that the level of economic development has an inhibitory effect on the improvement of green energy efficiency in the region and adjacent areas. The urban scale has significantly improved the green energy efficiency of the region but inhibited the improvement of green energy efficiency in adjacent areas. Government intervention has inhibited the improvement of green energy efficiency in the region and promoted green energy efficiency in neighboring regions. However, from the empirical results, both are not significant. The level of opening to the outside world has significantly inhibited the improvement of green energy efficiency in the region and adjacent areas. The level of financial development is conducive to promoting green energy efficiency in the region but not conducive to improving green energy efficiency in neighboring regions. However, from the empirical results, the results are not significant. The industrial structure can promote the green energy efficiency of the region and inhibit the improvement of green energy efficiency in the neighboring regions. However, from the empirical results, the results are not significant.
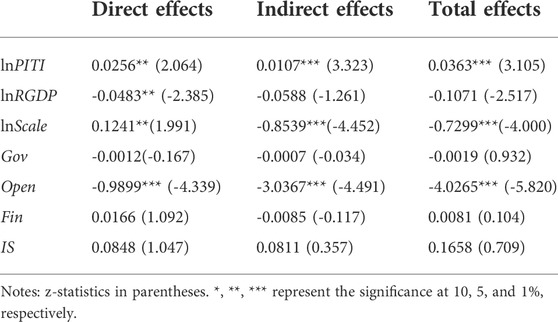
Table 6 shows the estimated results of direct, indirect, and total effects calculated according to Formula 11. It can be seen that the estimation results of direct effect and indirect effect are close to those in Table 5, which shows that the estimation results of benchmark regression are effective.
The direct effect in this study refers to the overall impact of changes in EID on GEE. This impact includes the direct impact on GEE when the EID changes and the “feedback effect” (Lou et al., 2021). The “feedback effect” means that EID can affect the GEE in the local area by affecting the GEE in the adjacent area (Ge et al., 2021). In terms of regression results, direct effect = spatial Durbin model estimation coefficient + feedback effect. Column 1) of Table 6 shows the estimated results of direct effects. The regression results show that Eid has a significant positive impact on green energy efficiency. When EID is increased by 1%, green energy efficiency increases by 2.56%. The feedback effect of environmental regulation on green energy efficiency is 0.0006. In other words, EID can improve the green energy efficiency of the region by affecting the green energy efficiency of other regions.
The indirect effect in this study refers to the impact of EID on GEE in adjacent areas. That is the “spatial spillover effect” of EID on GEE. Column (2) of Table 6 shows the estimated results of indirect effects. The regression results show that EID has a significant role in promoting GEE in adjacent areas. When the local EID is increased by 1%, the GEE of neighboring cities will be increased by 1.07%. This also verifies the spatial spillover effect of EID on GEE.
The total effect is the sum of direct effect and indirect effect. In column (3), the total effect of EID is 0.0363, significant at the significance level of 1%. From Table 6, we can also find that the estimated results of the direct and indirect effects of the control variables are roughly the same as those in the benchmark regression.
Robustness test
To verify the robustness of the benchmark regression results, this paper uses the 0-1 weight matrix (W2) and the economic weight matrix (W3) to replace the geographical distance weight matrix (W1) in the benchmark regression. The results of the robustness test are shown in Table 7 below. Firstly, under W2 and W3, the spatial lag terms ρ/λ are significantly positive at the 5% significance level. This shows that there is an obvious “learning effect” in the process of promoting green energy efficiency between similar regions. Second, under W2 and W3, the regression coefficients of lnPITI are significantly positive. This proves once again that EID can promote GEE in the region. Thirdly, from the regression results of the SDM model, it can be found that under W2 and W3, the regression coefficients of W*lnPITI are 0.0092 and 0.0167, respectively. Both are positive under the significance level of 1%, which is consistent with the conclusion drawn from the benchmark regression results. Finally, the direction and significance of the regression coefficient of the control variable are roughly the same as the benchmark regression results. Therefore, we can consider that the results of benchmark regression are robust.
Endogenous test
Using the econometric model to study the impact of environmental information disclosure on green energy efficiency, we need to consider the existence of endogenous problems. The endogeneity of the impact of EID on GEE may arise from the following three aspects: first, the explanatory variables and the explained variables in the model may be mutually causal. Secondly, some unobservable factors may be omitted from the regression model. These unobservable factors will passively enter the random disturbance term, which leads to the correlation between the core explanatory variables and the random disturbance term. The estimation results do not meet the strict exogenous assumptions required by the least square method. Finally, there may be a “time-lag effect” in the impact of EID on GEE. This is because the environmental information disclosure is based on the relevant data evaluation of the previous year. When a region has a low score, it needs some time to rectify. In this case, when a region’s environmental information disclosure score in the previous year is low, it will usually impact the green energy efficiency of the next period. Therefore, it is necessary to select an instrumental variable to solve the estimation errors caused by endogeneity.
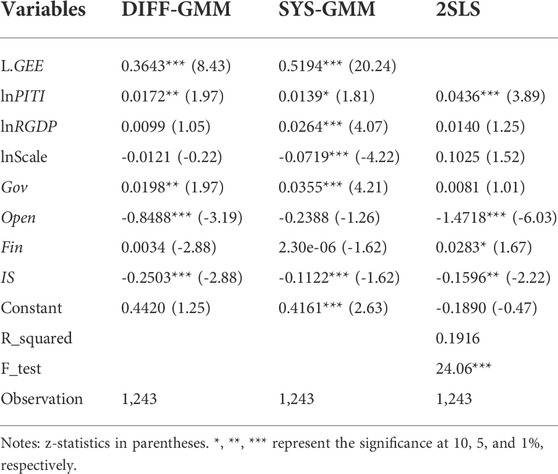
This study selects “the number of mobile phone users at the end of the year” as the instrumental variable to solve the endogenous problem. The choice of instrumental variable needs to meet the strict assumptions of correlation and exogenous. In terms of relevance, the number of mobile phones often represents the informatization level. EID cannot be separated from the support of informatization means. The informatization level determines the degree of social supervision on the cleaner production behavior of enterprises (Lou et al., 2021). Therefore, the level of informatization will impact EID. In terms of externality, there is a strict exogenous relationship between the number of mobile phone users at the end of the year and green energy efficiency. Green energy efficiency will not be affected by the number of mobile phone users. Therefore, we believe that the selection of the instrumental variables better meets the assumptions of correlation and exogenous. In the estimation method, the GMM and 2SLS are selected as the regression methods to deal with endogenous problems.
The first and second columns of Table 8 are the regression results of DIFF-GMM and SYS-GMM models. According to Arellano and Bond (1991) and Blundell and Bond (1998), we make a first-order difference for GEE. The regression results show that the first-order lag term of GEE is significantly positive, indicating that green energy efficiency has time continuity, so it is necessary to use dynamic panel model. The p-values of the AR 1) test of DIFF-GMM and SYS-GMM are both 0.0000, and the p-values of the AR 2) test are 0.4621 and 0.2408, respectively. This means that the difference equations with random perturbation terms have first-order sequence correlation and no second-order sequence correlation. The autocorrelation test of the model passes. In addition, the p-values of the Sargan tests are all 1.000, which indicates that there is no problem of over-identification of the instrumental variable. Under GMM estimation, EID is still significantly positive for the improvement of GEE. The third column is the estimation result of the 2SLS model. It can be seen that after considering the endogenous problem, the impact of EID on GEE is still significantly positive. An increase of 1% in EID will lead to an increase of 4.36% in GEE. In addition, the significance level of the F-test is 1%, indicating that there is no problem with a weak instrumental variable in the model, and the estimation results of the instrumental variable in this paper are valid.
Heterogeneity test
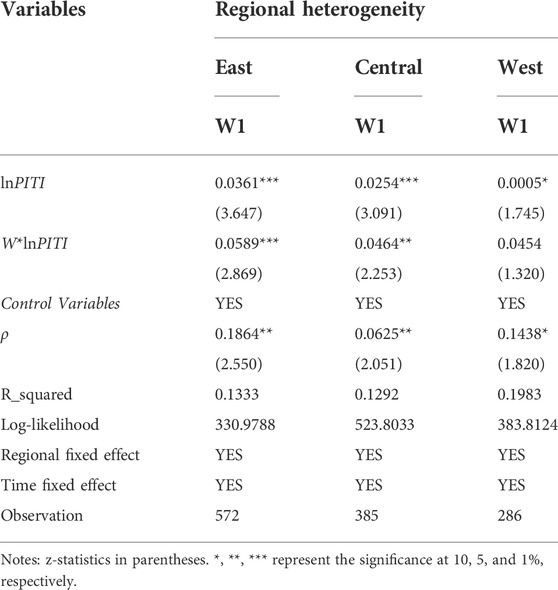
This study divides China into the eastern, central, and western regions to further analyze the regional differences between EID and GEE. From Table 9 we can find that: 1) The regression results of spatial lag term ρ in the three regions are 0.0625, 0.1864, and 0.1438, respectively, and they are all significantly positive. This again shows that GEE has a significant spatial spillover effect. 2) The regression coefficient of lnPITI in the eastern region is 0.0361, which is positive at the significance level of 1%. The regression coefficient of W*lnPITI is 0.0589, which is positive at the significance level of 1%. 3) The regression coefficient of lnPTIT in the central region is 0.0254, which is positive at the significance level of 1%. The regression coefficient of W*lnPITI is 0.0464, which is positive at the significance level of 1%. 4) The regression coefficient of lnPITI in the western region is 0.0005, which is positive at the significance level of 10%. The regression coefficient of W*lnPITI is 0.0454, which is not significant.
Discussions
Spatial distribution and agglomeration characteristics of GEE
Figure 4 shows the spatial distribution of green energy efficiency in 113 EID cities in China, showing the characteristics of “high in the East and low in the west.” Table 3; Figure 5 show that GEE shows a significant positive spatial correlation in space. In addition, GEE shows the characteristics of “high-high” and “low-low” in spatial agglomeration. The GEE in the eastern region is mainly characterized by “high-high” agglomeration. In contrast, the GEE in the western region is mainly characterized by “low-low” agglomeration. This research conclusion is similar to that of Liu and Dong (2021). The main reason for this distribution of GEE may be the mismatch between China’s economic development level and the regional distribution of energy resources (Du et al., 2022).
The eastern region has a high economic level, but its energy resource endowment is insufficient. The eastern region has improved energy efficiency by promoting enterprises to improve cleaner production capacity, upgrading industrial structure, pollution control, and environmental protection (Yu, 2021). The central and western regions are rich in energy resources, but their economic development level is low. Most cities with a low level of economic development still adopt the extensive development model. In addition, cities in the central and western regions are also affected by backward technology and a low level of cleaner production, making the overall level of GEE in the central and western areas low. For example, Shanxi Province is one of the provinces with the largest output of coal resources in China. However, the GEE of Taiyuan is only 0.6589, which is lower than the national average. This is because the industry of Shanxi Province is mainly based on the coal industry. For a long time, Shanxi Province has formed an industrial development model dominated by energy resources and highly dependent on coal. Limited by the technical level, the utilization efficiency of coal resources is not high, and the environmental pollution in the mining process cannot be avoided. Therefore, the GEE of Shanxi is relatively low.
The impacts of EID on GEE and its spillover effects
The empirical analysis in the previous part found that EID positively impacts GEE in the region and adjacent regions. In this part, we will discuss the reasons for this phenomenon.
Firstly, EID can significantly improve the local GEE. This shows that in addition to formal environmental regulations, informal environmental regulations are also conducive to promoting GEE. ENGOs disclose environmental information to the public, strengthening the public’s supervision over the environmental protection behavior of the government and enterprises (Wang, H. et al., 2022). On the one hand, EID can strengthen the public’s supervision of cleaner production behavior of enterprises, and reduce the problems of “adverse selection” and moral hazards caused by environmental information asymmetry. The public supervises the environment through “voting with their feet”, which can enhance enterprises’ environmental awareness and social responsibility. It is conducive to promoting enterprises to reduce pollution emissions (Shi et al., 2021), strengthen cleaner production capacity, and improve local energy efficiency. On the other hand, EID can affect the government’s environmental policy. More and more people begin to pay attention to environmental issues, forcing local governments to pay more attention to environmental and ecological protection. By improving environmental supervision and other means, we can improve the level of cleaner production and green energy efficiency.
Secondly, on the whole, EID can significantly improve the GEE of adjacent cities. This is due to the “learning effect” and “competition effect” in the process of environmental protection in various regions (Lou et al., 2021). The “learning effect” refers to when a region performs well in environmental information disclosure, and it will cause imitation learning in other regions (Lou et al., 2021). This also explains why most cities with a high level of EID show the characteristics of “high-high” aggregation. In addition, with the continuous strengthening of environmental protection awareness in recent years, the political evaluation mechanism guided by economic development has gradually shifted to the political evaluation mechanism guided by the harmonious development of economy and ecology (Jiang et al., 2022). Under the pressure of promotion incentives and “competitive effect,” the local government began to learn from other regions’ advanced environmental regulation means, which improved the ecological environment, cleaner production capacity, and resource utilization efficiency in the local region. Learning from the advanced experience of other regions has promoted the improvement of GEE. This also reminds the government to strengthen the contact and communication between regions when formulating environmental policies, learn from other regions’ excellent environmental management experience, and avoid the “beggar thy neighbor” phenomenon.
Thirdly, the impact mechanism of EID on GEE and its spatial spillover effect are different in the eastern, central, and western regions. We can find a very interesting phenomenon from the regression results: the coefficients of lnPITI and W*lnPITI show a common feature: the eastern region > the central region > the western region. This indicates that the impact of EID on GEE is more obvious in the eastern region. This phenomenon is caused by the regional imbalance in China’s economic and social development (Wang, X. et al., 2022).
Conclusion and policy recommendations
As one of the important means of informal environmental regulation, environmental information disclosure has an important impact on improving green energy efficiency. This paper selects the panel data of 113 environmental information disclosure cities in China from 2008 to 2018 for empirical analysis. The Super-efficiency SBM model with undesirable outputs model is used to measure green energy efficiency. On this basis, the spatial Durbin model is used to test the impact of environmental information disclosure on green energy efficiency and its spatial spillover effect. The main conclusions of this paper are as follows:
1) From 2008 to 2018, the average green energy efficiency of 113 environmental information disclosure cities was 0.6676. The overall level is low and needs to be further improved. In terms of time evolution trend, green energy efficiency shows an increasing trend year by year. From the perspective of regional distribution, green energy efficiency shows the characteristics of “high in the East and low in the west.” The average GEE of the eastern, central, and western regions is 0.7318, 0.6889, and 0.5105, respectively.
2) Environmental information disclosure and green energy efficiency have a high spatial correlation. Both environmental information disclosure and green energy efficiency show the characteristics of “high-high” and “low-low” agglomeration in spatial distribution.
3) Environmental information disclosure can significantly promote the improvement of green energy efficiency in the local region and adjacent areas. The results of the robustness test and endogenous test verify the validity of this conclusion.
4) The impact of environmental information disclosure on green energy efficiency and its spatial spillover effect is different in the eastern, central, and western regions. The impact of environmental information disclosure on green energy efficiency in the eastern region is significantly greater than that in the central and western regions.
Based on the conclusion, this paper puts forward the following policy recommendations:
1) When formulating environmental policies, we should fully consider the actual situation of different regions, such as the level of economic development, ecological resource endowment, and production technology. According to local conditions, adopt reasonable environmental policies to reduce the differences in green energy efficiency among regions.
2) Improving the government environmental information disclosure system and giving full play to the role of environmental information disclosure in promoting green energy efficiency. Through empirical research, this study found that environmental information disclosure can significantly improve green energy efficiency. Currently, environmental information disclosure is only carried out in some cities in China, and the scale of environmental information disclosure is relatively small. From the evaluation results, it can be seen that there is still a big gap between the actual disclosure of some urban environmental information and the theoretical disclosure. Therefore, the government should optimize the mechanism design of environmental information disclosure and promote the orderly disclosure of more urban government environmental information.
3) Strengthen the integration and cooperation between formal environmental regulations and environmental information disclosure, and promote the improvement of green energy efficiency jointly. Public participation in environmental protection is significant in improving the environmental governance mechanism and management. Environmental information disclosure can reduce the information asymmetry among environmental protection participants and mobilize the public’s enthusiasm to participate in environmental governance. It is a powerful supplement to formal environmental supervision. Therefore, we should speed up the development of a coordinated governance mechanism between formal environmental regulation and environmental information disclosure to promote the improvement of green energy efficiency.
4) All regions should strengthen exchanges and cooperation in environmental information disclosure. This paper also shows that environmental information disclosure can promote the green energy efficiency of surrounding areas. Therefore, all regions should weaken local protection, reduce regional barriers, strengthen coordinated development and cooperation in environmental information disclosure, and promote the improvement of green energy efficiency jointly.
This paper studies the impact of environmental information disclosure on green energy efficiency and its spillover effect. However, future work still has certain expansion space and limitations. First of all, although the data of the latest year that can be consulted has been used, it still lags behind slightly. If the data is updated, this study should be further supplemented and enriched. Second, it is also interesting to extend the research data to all cities and analyze the impact of environmental information disclosure on green energy efficiency in all cities in China. At the same time, I hope this paper can promote more research in the field of environmental information disclosure and green energy efficiency, and design some policies to improve energy efficiency and promote environmental protection.
Data availability statement
The original contributions presented in the study are included in the article/supplementary material, further inquiries can be directed to the corresponding author.
Author contributions
LD: Conceptualization, Methodology, Visualization, Writing -original draft. FW: Formal analysis and Conceptualization. MT: Funding acquisition and Writing-review and editing.
Funding
This research was supported by the general project of the National Social Science Foundation of China (Item Number: 21BJY196).
Conflict of interest
The authors declare that the research was conducted in the absence of any commercial or financial relationships that could be construed as a potential conflict of interest.
Publisher’s note
All claims expressed in this article are solely those of the authors and do not necessarily represent those of their affiliated organizations, or those of the publisher, the editors and the reviewers. Any product that may be evaluated in this article, or claim that may be made by its manufacturer, is not guaranteed or endorsed by the publisher.
Footnotes
1The author agrees to provide data sets and codes, which can be obtained from the author if necessary.
References
Anselin, L., and Getis, A. (1992). Spatial statistical analysis and geographic information systems. Ann. Reg. Sci. 26 (1), 19–33. doi:10.1007/bf01581478
Arellano, M., and Bond, S. (1991). Some tests of specification for panel data: Monte Carlo evidence and an application to employment equations. Rev. Econ. Stud. 58, 277–298. doi:10.2307/2297968
Blundell, R., and Bond, S. (1998). Initial conditions and moment restrictions in dynamic panel data models. J. Econom. 87, 115–143. doi:10.1016/s0304-4076(98)00009-8
Bu, C., Zhang, K., Shi, D., and Wang, S. (2022). Does environmental information disclosure improve energy efficiency? Energy Policy 164, 112919. doi:10.1016/j.enpol.2022.112919
Chen, Y., and Lin, B. (2021). Understanding the green total factor energy efficiency gap between regional manufacturing—Insight from infrastructure development. Energy 237, 121553. doi:10.1016/j.energy.2021.121553
Chen, H., Hao, Y., Li, J., and Song, X. (2018). The impact of environmental regulation, shadow economy, and corruption on environmental quality: Theory and empirical evidence from China. J. Clean. Prod. 195, 200–214. doi:10.1016/j.jclepro.2018.05.206
Du, L., Tian, M., Cheng, J., Chen, W., and Zhao, Z. (2022). Environmental regulation and green energy efficiency: An analysis of spatial Durbin model from 30 provinces in China. Environ. Sci. Pollut. Res. Int. doi:10.1007/s11356-022-20551-0
Elhorst, J. P. (2014). “Spatial panel data models,” in SpringerBriefs Regional Science, 37–93. doi:10.1007/978-3-642-40340-8_3
Feng, Y., Wang, X., Du, W., Wu, H., and Wang, J. (2019). Effects of environmental regulation and fdi on urban innovation in China: A spatial Durbin econometric analysis. J. Clean. Prod. 235, 210–224. doi:10.1016/j.jclepro.2019.06.184
Feng, Y., Wang, X., and Liang, Z. (2021). How does environmental information disclosure affect economic development and haze pollution in Chinese cities? The mediating role of green technology innovation. Sci. Total Environ. 775, 145811. doi:10.1016/j.scitotenv.2021.145811
Ge, T., Hao, X., and Li, J. (2021). Effects of public participation on environmental governance in China: A spatial Durbin econometric analysis. J. Clean. Prod. 321, 129042. doi:10.1016/j.jclepro.2021.129042
Guo, P., Qi, X., Zhou, X., and Li, W. (2018). Total-factor energy efficiency of coal consumption: An empirical analysis of China's energy intensive industries. J. Clean. Prod. 172, 2618–2624. doi:10.1016/j.jclepro.2017.11.149
Han, Z., Han, C., and Yang, C. (2020). Spatial econometric analysis of environmental total factor productivity of ranimal husbandry and its influencing factors in China during 2001-2017. Sci. Total Environ. 723, 137726. doi:10.1016/j.scitotenv.2020.137726
Hao, Y., Gai, Z., and Wu, H. (2020). How do resource misallocation and government corruption affect green total factor energy efficiency? Evidence from China. Energy Policy 143, 111562. doi:10.1016/j.enpol.2020.111562
Jiang, S., Tan, X., Hu, P., Wang, Y., Shi, L., Ma, Z., et al. (2022). Air pollution and economic growth under local government competition: Evidence from China, 2007–2016. J. Clean. Prod. 334, 130231. doi:10.1016/j.jclepro.2021.130231
Kumbhakar, S. C., Wang, H.-J., and Horncastle, A. P. (2015). A practitioner's guide to stochastic frontier analysis using stata.
Lesage, J. P., and Pace, R. K. (2010). “Spatial econometric models,” in Handbook of applied spatial analysis.
Li, B., and Wu, S. (2017). Effects of local and civil environmental regulation on green total factor productivity in China: A spatial Durbin econometric analysis. J. Clean. Prod. 153, 342–353. doi:10.1016/j.jclepro.2016.10.042
Li, Y., Zhang, X., Yao, T., Sake, A., Liu, X., and Peng, N. (2021). The developing trends and driving factors of environmental information disclosure in China. J. Environ. Manage. 288, 112386. doi:10.1016/j.jenvman.2021.112386
Li, G., Xue, Q., and Qin, J. (2022). Environmental information disclosure and green technology innovation: Empirical evidence from China. Technol. Forecast. Soc. Change 176, 121453. doi:10.1016/j.techfore.2021.121453
Liu, Y., and Dong, F. (2021). How technological innovation impacts urban green economy efficiency in emerging economies: A case study of 278 Chinese cities. Resour. Conserv. Recycl. 169, 105534. doi:10.1016/j.resconrec.2021.105534
Liu, Y., Zhu, J., Li, E. Y., Meng, Z., and Song, Y. (2020). Environmental regulation, green technological innovation, and eco-efficiency: The case of Yangtze river economic belt in China. Technol. Forecast. Soc. Change 155, 119993. doi:10.1016/j.techfore.2020.119993
Liu, S., Liu, C., and Yang, M. (2021). The effects of national environmental information disclosure program on the upgradation of regional industrial structure: Evidence from 286 prefecture-level cities in China. Struct. Change Econ. Dyn. 58, 552–561. doi:10.1016/j.strueco.2021.07.006
Liu, S., Liu, C., and Yang, M., 2022. Greening of Chinese industrial sector: Stakeholders' responsiveness to non-governmental environmental monitoring. China Econ. Rev. 72, 101744. doi:10.1016/j.chieco.2022.101744
Lou, L., Li, J., and Zhong, S. (2021). Sulfur dioxide (SO2) emission reduction and its spatial spillover effect in high-tech industries: Based on panel data from 30 provinces in China. Environ. Sci. Pollut. Res. Int. 28 (24), 31340–31357. doi:10.1007/s11356-021-12755-7
Meng, M., and Qu, D. (2022). Understanding the green energy efficiencies of provinces in China: A super-SBM and gml analysis. Energy 239, 121912. doi:10.1016/j.energy.2021.121912
Pan, X., Guo, S., Han, C., Wang, M., Song, J., and Liao, X. (2020). Influence of FDI quality on energy efficiency in China based on seemingly unrelated regression method. Energy 192, 116463. doi:10.1016/j.energy.2019.116463
Shi, D., Bu, C., and Xue, H. (2021). Deterrence effects of disclosure: The impact of environmental information disclosure on emission reduction of firms. Energy Econ. 104, 105680. doi:10.1016/j.eneco.2021.105680
Tobler, W. (1970). A computer movie simulating urban growth in the Detroit region. Econ. Geogr. 46, 234–240. doi:10.2307/143141
Tone, K. (2002). A slacks-based measure of super-efficiency in data envelopment analysis. Eur. J. Oper. Res. 143 (1), 32–41. doi:10.1016/s0377-2217(01)00324-1
Tone, K. (2003). Dealing with undesirable outputs in DEA: A slacks-based measure (SBM) approach. GRIPS research report series 2003.
Tone, K. (2004). Dealing with undesirable outputs in DEA: A slacks-based measure (SBM) approach. Toronto, 44–45.
Wang, Q., and Zhao, C. (2021). Dynamic evolution and influencing factors of industrial green total factor energy efficiency in China. Alexandria Eng. J. 60 (1), 1929–1937. doi:10.1016/j.aej.2020.11.040
Wang, B., Yu, M., Zhu, Y., and Bao, P. (2021). Unveiling the driving factors of carbon emissions from industrial resource allocation in China: A spatial econometric perspective. Energy Policy 158, 112557. doi:10.1016/j.enpol.2021.112557
Wang, H., Yang, G., Ouyang, X., and Tan, Z. (2022). Does environmental information disclosure promote the supply of environmental public goods? Evidence based on a dynamic spatial panel Durbin model. Environ. Impact Assess. Rev. 93, 106725. doi:10.1016/j.eiar.2021.106725
Wang, X., Wang, X., Ren, X., and Wen, F. (2022). Can digital financial inclusion affect CO2 emissions of China at the prefecture level? Evidence from a spatial econometric approach. Energy Econ. 109, 105966. doi:10.1016/j.eneco.2022.105966
Wu, R., and Lin, B. (2022). Environmental regulation and its influence on energy-environmental performance: Evidence on the Porter Hypothesis from China's iron and steel industry. Resour. Conservation Recycl. 176, 105954. doi:10.1016/j.resconrec.2021.105954
Wu, H., Hao, Y., Ren, S., Yang, X., and Xie, G. (2021). Does internet development improve green total factor energy efficiency? Evidence from China. Energy Policy 153, 112247. doi:10.1016/j.enpol.2021.112247
Xie, D., Li, X., and Zhou, D. (2022). Does environmental information disclosure increase firm exports? Econ. Analysis Policy 73, 620–638. doi:10.1016/j.eap.2021.12.012
Yang, Z., and Wei, X. (2019). The measurement and influences of China's urban total factor energy efficiency under environmental pollution: Based on the game cross-efficiency DEA. J. Clean. Prod. 209, 439–450. doi:10.1016/j.jclepro.2018.10.271
Yu, B., and Shen, C. (2020). Environmental regulation and industrial capacity utilization: An empirical study of China. J. Clean. Prod. 246, 118986. doi:10.1016/j.jclepro.2019.118986
Yu, B. (2021). Urban spatial structure and total-factor energy efficiency in Chinese provinces. Ecol. Indic. 126, 107662. doi:10.1016/j.ecolind.2021.107662
Zhang, C., and Chen, P. (2022). Applying the three-stage SBM-DEA model to evaluate energy efficiency and impact factors in RCEP countries. Energy 241, 122917. doi:10.1016/j.energy.2021.122917
Zhang, Y., and Song, Y. (2021). Environmental regulations, energy and environment efficiency of China’s metal industries: A provincial panel data analysis. J. Clean. Prod. 280, 124437. doi:10.1016/j.jclepro.2020.124437
Keywords: environmental information disclosure, green energy efficiency, super-efficiency SBM model with undesirable outputs, spatial Durbin model, prefecture-level cities
Citation: Du L, Wang F and Tian M (2022) Environmental information disclosure and green energy efficiency: A spatial econometric analysis of 113 prefecture-level cities in China. Front. Environ. Sci. 10:966580. doi: 10.3389/fenvs.2022.966580
Received: 11 June 2022; Accepted: 08 July 2022;
Published: 19 August 2022.
Edited by:
Ferda Halicioglu, University of Lincoln, United KingdomReviewed by:
Luigi Aldieri, University of Salerno, ItalyScott Hegerty, Northeastern Illinois University, United States
Copyright © 2022 Du, Wang and Tian. This is an open-access article distributed under the terms of the Creative Commons Attribution License (CC BY). The use, distribution or reproduction in other forums is permitted, provided the original author(s) and the copyright owner(s) are credited and that the original publication in this journal is cited, in accordance with accepted academic practice. No use, distribution or reproduction is permitted which does not comply with these terms.
*Correspondence: Fuwei Wang, a2VudGwxMDBAMTI2LmNvbQ==
 Lei Du
 Fuwei Wang
 Minghua Tian