 Yongpan Guan
 Huijuan Wang1
 Lin Ding
- 1School of Statistics and Mathematics, Central University of Finance and Economics, Beijing, China
- 2School of Mathematics and Information Science, Yantai University, Yantai, China
Background: Inclusive green development aims to combine economic inclusiveness with greenness, which is an important goal of current economic development for China to achieve common prosperity. Measuring inclusive green total factor productivity (IGTFP) is of great significance for evaluating the quality of inclusive economic growth and accelerating inclusive economic growth.
Method: This study establishes an index evaluation system of IGTFP from four aspects of high quality, efficient, fair, and sustainable development, using super-SBM to measure IGTFP based on panel data of 276 cities in China from 2006 to 2019, and conducts empirical comparative analysis from national central cities, provincial capitals, and ordinary prefecture.
Result: 1) The IGTFP and technical progress rate in the central city and the provincial capital are significantly higher than that of the ordinary prefecture, but there is no significant difference in technical efficiency; the growth rate of IGTFP in the most central city remains around 10%, which is significantly higher in the south than that in the north. 2) According to the index decomposition result, all cities have basically realized the double-line improvement of technological efficiency and technological progress rate, but the technological efficiency is mostly lower than the technological progress rate. 3) From the perspective of economic convergence, only the IGTFP of provincial capitals shows the
Conclusion: The integration of “technology” and “efficiency” is the main driving force and path to realize the sustainable improvement of IGTFP in cities. Inclusive green growth needs to break “regional boundaries,” including north–south boundaries and urban boundaries.
Introduction
Common prosperity is the essential requirement of socialism and an essential feature of Chinese-style modernization. Since the 18th National Congress of the Communist Party of China (CPC), China has taken various measures to ensure and improve people’s livelihood and achieved comprehensive poverty alleviation in 2020. However, over the past 40 years of reform and opening-up, China’s economic development has paid a substantial environmental and social cost. On the one hand, the extensive growth with high input, high consumption, heavy pollution, and low efficiency leads to resource exhaustion, environmental pollution, and ecological destruction. On the other hand, the development opportunities brought by economic growth are not distributed equally among members of the society, and the achievement of growth is not equally distributed, which leads to the widening income gap and the aggravation of social inequality (Wan, 2010). Based on this background, the Chinese government put forward in the “14th Five -Year Plan” that “coordinated development and inclusive growth must be the trend of China’s economic and social development.” This means that the future of China’s economic development should improve the total factor productivity and improve the efficiency of inclusive green growth, and promote inclusive economic development.
Since the Asian Development Bank put forward the concept of inclusive growth in Strategy 2020 in 2008, the academia has not formed a unified definition of inclusive growth. Regarding the theoretical connotation and policy significance of inclusive growth, the research of Sun et al. (2018) shows that the essence of inclusive growth was to reduce the income gap. Rachel thought that inclusive growth should include income growth and welfare growth (Rachel, 2012; World Bank., 2012), while Ali and Son (2007) focused on the opportunity of intergroup welfare access (Ali and Son, 2007). On this basis, some scholars incorporated “green” into the inclusive growth system to comprise inclusive green growth. Similar to inclusive growth, inclusive green growth has not constituted a unified definition. D. Doumbia et al. believed that inclusive green growth should pay attention to current and future generations’ welfare growth and intergenerational inheritance when weighing the relationship between economic growth, inclusiveness, and green (Grosse et al., 2008; Dinda, 2014; Doumbia, 2019). Berkhout et al. (2017) show that “inclusive green growth is an economic growth path that aims to reduce regional differences, takes into account ecological environmental protection, and provides more opportunities for poor areas and people” (Hill et al., 2012; Dinda, 2013; Berkhout et al., 2017). By combing through relevant studies on inclusive green growth, we can know that inclusive green growth has not formed a unified concept, but its connotation includes three aspects: economic growth, ecological environmental protection, and social inclusion (Dollar et al., 2014; Ahmad, 2021; Gu et al., 2021; He and Du, 2021). Therefore, the inclusive green growth in our research is an economic development path that takes economic growth as its goal and simultaneously considers ecological environmental protection and social opportunity equity.
Total factor productivity is an important engine of economic growth. The report of the 19th National Congress of the Communist Party of China has made a critical judgment that China’s economy has shifted from a high-speed growth stage to a location of high-quality development and put forward urgent requirements for improving total factor productivity. Due to the limited resources and increasingly serious environmental pollution, the concept of green development and sustainable development has attracted people’s attention. Resources and the environment are not only endogenous variables that affect economic development, but also rigid constraints that limit the quality of economic development. Compared with the total factor productivity that only considers the expected output, the green total factor productivity that incorporates unexpected output such as pollutant emissions into the indicator system is more comprehensive and objective. Therefore, some scholars (Wang et al., 2019; Song et al., 2020; Wang et al., 2020) have begun to use resource consumption and environmental pollution as measurement indicators and incorporated them into the calculation system of total factor productivity to evaluate industrial development and economic growth. The total factor productivity obtained from this is green total factor productivity.
At the same time, the expansion of the income gap and socially sustainable development poses a severe challenge. On this basis, some scholars (Chen and Qin, 2014; Li and Dong, 2021) have begun to consider the inclusiveness of GTFP. They believe that the government should pay attention to the environmental protection and benefit equity of economic achievements while increasing the TFP. Therefore, IGTFP was proposed. How to realize the common prosperity and realize the harmonious development become the urgent need to solve the strategic problem, inclusive green growth will become a new opportunity, and crack the issue of reasonable measure IGTFP is particularly important.
Compared with the total factor productivity that only considers the expected output, the green total factor productivity that incorporates undesired outputs such as pollutant emissions into the indicator system is more comprehensive and objective. Therefore, many scholars began to use resource consumption and environmental pollution as measurement indicators and incorporated them into the calculation system of total factor productivity to evaluate industrial development and economic growth. The total factor productivity obtained from this is green total factor productivity.
The research on total factor productivity has been relatively complete. Song et al. (2018) studied the traditional total factor productivity and the green total factor productivity with environmental factors, which significantly improved the scientific and accurate estimation of total factor productivity (Chirisa et al., 2016; Song et al., 2018; Cui et al., 2019; Peng et al., 2020). However, China’s current development goal is to achieve inclusive economic growth by protecting the environment and saving resources to achieve common prosperity, so social equity is also one of the urgent issues that should be solved. The study of Chen and Qin (2014) shows that the income gap is an undesired output in economic development and incorporated it into the input–output system. However, it only studies the provincial level and does not consider the increasingly severe imbalance in economic development within provinces and among different urban strata. Although Sun et al. (2018) took cities as the research object, they only studied green total factor productivity in the traditional sense and did not involve the fundamental problem of the income gap in the input–output system. The existing measurement methods on inclusive green growth, whether through depicting the opportunity function or building a comprehensive index system, are all essentially measured by a current indicator. It is difficult to judge whether its economic growth is an extensive development with high input and high output or an efficient development with low input and high output. Using super-efficiency SBM to measure inclusive green growth by measuring total factor productivity, on the one hand, we can observe whether China’s economic operation keeps efficient development; second, it can analyze whether “inclusive” and “green” achieved at the same time of economic growth (Zhang et al.,2019; Zhu and Azhong., 2018; Sun et al., 2020; Xin et al., 2022).
To sum up, this study first incorporates the income gap as the core concept of inclusive growth. The IGTFP was defined under the new input–output system and was estimated and analyzed based on the super-efficiency SBM model. While observing whether China’s economic operation has maintained efficient growth, it also examines whether it has realized “inclusive” and “green,” which can scientifically grasp the basis of China’s high-quality economic development and promote China’s green coordinated development and high quality, balanced development (Parikh, 2014; Chen et al., 2020; Ren et al., 2022). This study empirically investigates the spatial–temporal evolution characteristics of IGTFP growth. It is of great theoretical and practical significance for formulating differentiated regional development policies, realizing coordinated development of economic growth, resource conservation, and environmental protection in various regions of China, and realizing common prosperity.
The marginal contributions of this study are as follows. First, the concept of IGTFP is defined. It is considered that IGTFP is a measurement system about high-quality economic development based on economic growth while including ecological environmental protection and equal distribution of social resources. Second, the income gap index and environmental index are incorporated into the input–output system as “green” and “inclusive” indicators, respectively, to construct the input–output system from the inclusive perspective and carry out positive measurement and analysis of IGTFP based on the city level.
Measurement system of inclusive green total factor productivity
The essence of inclusive green growth is to reduce the gap between the rich and the poor while achieving green economic development and balanced development, and common prosperity (Re and Grosskopf, 2010; Li et al., 2021; Sun et al., 2022). Therefore, based on the connotation of inclusive green growth, in the measurement of IGTFP, based on the measurement system of total factor productivity, this study adds “three industry wastes” and urban–rural income ratio that hinders “green” and “inclusive” (Table 1).
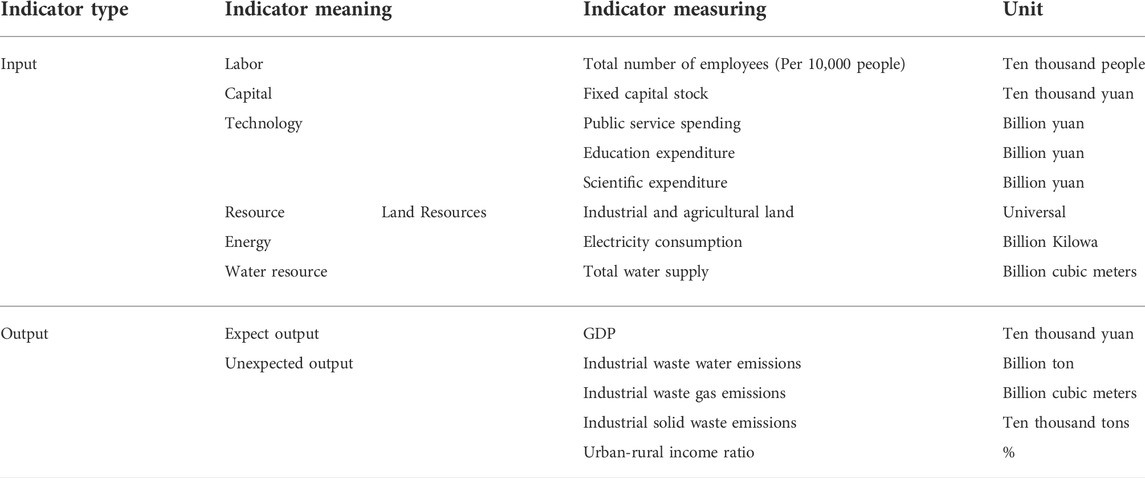
TABLE 1. Input–output system and interpretation.
In terms of input factors, this study mainly measures from four dimensions. It includes not only the labor and capital factors that are common in the macro production function, but also the measurement of technology and resources. In the dimension of output factors, in addition to the GROSS regional product, urban and rural residents’ income and consumption levels are also included in the expected output. Undesired output includes “three industrial wastes” and the urban–rural income ratio. The total factor productivity is judged to be “green” and “inclusive,” respectively.
Input indicators
Labor input
The total number of employed persons represents the labor input of each city, and employed persons include employees of units, individuals, and private enterprises.
Capital input
Fixed capital stock, with 2000 as the base period, is expressed by the perpetual inventory method.
Resource input
The balance between economic development and resource utilization is the primary basis of inclusive economic development (Xin et al., 2021; Zhao et al., 2022). Efficient utilization of resources is an essential symbol of high-quality economic transformation. This study selects the total amount of industrial and agricultural land, power consumption, and water supply as the land, energy, and water resources metrics. Land resources are the necessary conditions for production and the most basic means of production. In terms of energy input, this study draws lessons from the practice of Li et al. (2020), taking power consumption as the measurement index of energy input. Water resources are the essential input of economic activities (Li et al., 2020). In this study, the total water supply is selected as the measurement index of water resources.
Technology input
This study adopts public service expenditure, science and technology research expenditure, and education expenditure as the measurement index of expenditure input. Public service expenditure in this study refers to the expenditure part of public finance expenditure except science, technology, and education expenditure, such as medical treatment, pension, housing security, and other related expenditure. Expenditure on public services is the most direct way to increase the well-being of people. And education expenditure is the way to improve the core competitiveness of the next generation in poor areas, to avoid intergenerational transfers of poverty and make economic growth more inclusive; science and technology expenditure can realize green economic development to a certain extent and improve the “green proportion” in total factor productivity.
Output indicators
Expected output
This study selects GDP as the measurement indicator of expected output.
Unexpected output
IGTFP should be “inclusive” based on green total factor productivity. Therefore, this study takes “three industrial wastes” as the unexpected output and incorporates the “urban–rural income ratio,” which measures the urban-rural income gap, into the undesired output system. The “three industrial wastes” are industrial waste gas emissions, industrial wastewater, and solid waste emissions, respectively, by sulfur dioxide, industrial smoke, and industrial wastewater emissions. The urban–rural income ratio is the ratio of the per capita disposable income of urban residents to rural residents’ per capita net income.
Theoretical models
Based on relative efficiency, the Data Envelopment Analysis (DEA) could use mathematical programming and statistical data to evaluate the relative effectiveness of decision-making units. However, traditional non-parametric DEA measures efficiency from radial and Angle (Wang et al., 2019; Feng et al., 2020; Yang et al., 2022). Therefore, it lacks the slack of considering input and output and cannot distinguish whether multiple decision units are effective or not. Therefore, the accuracy of the efficiency value obtained is difficult to guarantee. However, the SBM model and super-efficiency DEA can directly put the “relaxation” variable into the objective function (Zhou and Wu, 2018; Li et al., 2020). Moreover, it can sort and distinguish multiple decision units. Since the input–output system in this study includes “three industry wastes” and the urban–rural income gap as undesired outputs, this study attempts to use the super-efficiency Slack Based Measure (SBM) model containing undesired outputs to Measure IGTFP of 276 cities in China under the condition of variable returns to scale. There are n DMU (decision units), and each DMU has m kinds of inputs, q1 expected outputs, and q2 unexpected outputs. The expression of super-efficiency SBM containing unexpected outputs is as follows:
In Eqs. 1, 2 ,
The Inclusive Global Malmquist–Luenberger (IGML) index represents IGTFP, reflecting the efficiency of inclusive and green economic growth with current factor inputs. IGML index also includes the relative relationship between actual production and production frontier as well as the change of production frontier boundary of each DMU. Therefore, it can be decomposed into GTC (Global Technical Change) and GEC (Global Efficiency Change). GEC refers to the change of relative efficiency under the condition of constant return to scale and free disposal of elements. It measures the degree to which the production system catches up with the production possibility boundary from the current period to the next period. If GEC>1, technical efficiency is improved. On the contrary, it means that technical efficiency decreases; GTC represents the change degree of the production technology of the production system from the current period to the next period, that is, the innovation degree of production technology. If GTC>1, it indicates that the production technology has improved. Conversely, explain production technology retreat.
In the above formula,
Empirical results
This study takes 276 prefecture-level cities in China as the research object and analyses the IGTFP at the national, regional, and urban levels. The data were obtained from China Statistical Yearbook, China Energy Statistical Yearbook, and China Urban Statistical Yearbook and China Economic Network (Table 1).
General characteristics
The contribution of different urban economic conditions to IGTFP is different. This study takes the proportion of urban GDP in the total urban GDP as the weight and obtains the IGTFP. IGTFP in China basically maintained positive growth from 2006 to 2019 (Figure 1). This shows that China’s economic development in recent years has considered both “equity” and “efficiency” to some extent. From the perspective of time, Chinese cities’ IGTFP has maintained positive growth during the 11th Five-Year Plan period (2006–2010), except for less than 1 in 2007. The rest showed positive growth; from the decomposition point of view, the rate of technological progress has already exceeded the technical efficiency by the end of the eleventh Five-Year Plan. This indicates that the rate of technological progress has increasingly become the primary driver of IGTFP.” During the 12th Five-Year Plan period (2011–2015), the growth of the three indexes showed a relatively stable trend. Although the technical efficiency was lower than 1 in some years, it generally maintained positive growth.” IGTFP maintained a high growth level in the first 2 years of the 13th Five-Year Plan period. IGTFP exceeded 1.5 in 2017 and maintained a positive growth trend in the following 2 years, although the growth rate slowed down. In the report to the 19th CPC National Congress in 2017, the CPC Central Committee, for the first time, proposed “establishing and improving the economic system of green, low carbon, and circular development.” China has paid more attention to environmental protection while building a “modern economic system.”
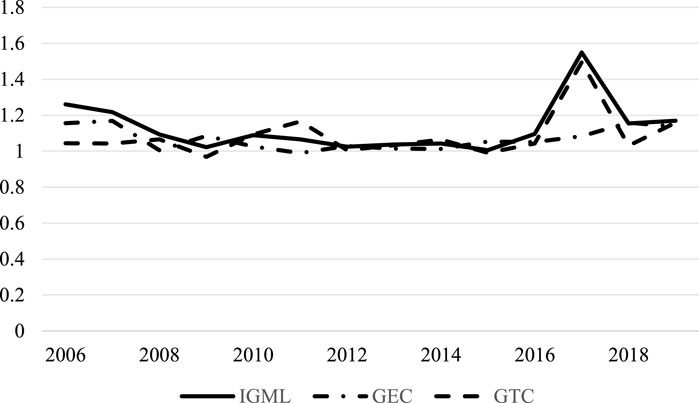
FIGURE 1. National IGTFP and its decomposition.
Inclusive green total factor productivity in regions
The establishment of national strategic urban agglomeration is an important measure to strengthen the leading role of central cities to surrounding cities, strengthen inter-city cooperation and promote regional integration in China. Yangtze River Delta Economic Zone, Pearl River Delta Economic Zone, and Bohai Rim, as three national strategic city clusters in China, represent the highest level of China’s economic development to a large extent and shoulder the responsibility of taking the lead in realizing modernization. Therefore, this study takes the three economic zones as the research object and explores the “inclusiveness” of China’s regional economic growth by analyzing their total inclusive factor productivity.
Figure 2 shows IGTFP and fluctuations in the three economic zones. In general, the PEARL River Delta economic zone’s IGTFP level is slightly lower than that of the Yangtze River Delta Economic Zone and the Bohai Rim Economic Zone. From 2006 to 2010, the IGTFP of the three economic zones remained the same. Since 2010, the Bohai Rim economic Zone’s IGTFP has been significantly improved, especially in 2011 and 2015. It ranked first among the three economic zones. Since 2016, the inclusive total factor productivity of the Yangtze River Delta Economic Zone and Bohai Rim Economic Zone has gradually opened a gap with that of the Pearl River Delta Economic Zone. From 2017 to 2019, there was a trend of “Yangtze River Delta ‘>’ Bohai Rim ‘>’ Pearl River Delta.” The reason for this difference is that there are great differences in the level of economic development between cities in the Pearl River Delta. For example, in 2018, the per capita GDP of the core area of the Pearl River Delta has reached over 100,000 yuan, which has reached the level of high-income countries or regions. For example, the per capita GDP of eastern, western, and northern Guangdong is around 40,000 yuan, far lower than the national average. The low-level cities in the Pearl River Delta economic zone have a relatively low level of professional production technology, and a large number of input production factors cannot get the corresponding except output, while the difference in the level of urban economic development in the Yangtze River Delta is small, and its convenient transportation conditions facilitate the high-frequency technical exchanges between cities, thus promoting the formation of a low input and high-yield industrial chain, It has promoted the overall improvement of inclusive green total factor productivity. As a result, the IGTFP of the PEARL River Delta economic Zone is lower than that of the other two regions.
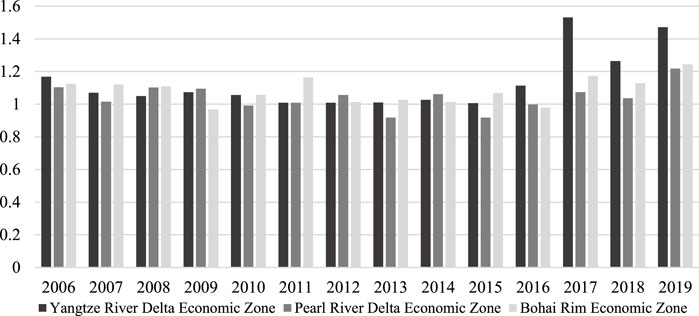
FIGURE 2. IGTFP in three major economic zones.
The IGTFP of the Bohai Rim Economic Zone and the Yangtze River Delta Economic Zone was the same from 2006 to 2017. Only in 2011 and 2015, the Bohai Rim Economic Zone was slightly higher than the Yangtze River Delta Economic Zone. However, from 2016, the inclusive total factor productivity of the Yangtze River Delta economic Zone exceeded that of the other two regions. The reason is that the total economic volume of Shanghai and Zhejiang provinces in the Yangtze River Delta economic zone has declined slightly. Nevertheless, the proportion of Jiangsu province and Anhui province has achieved different rising degrees. The balanced economic development has promoted IGTFP in the Yangtze River Delta region.
Inclusive green total factor productivity in urbans
From the perspective of city classification, the IGTFP of cities of different sizes is different. The specific performance is shown in Table 2. According to the classification of city size, IGTFP showed a phenomenon of “national central city > provincial capital city > prefecture-level city.” It indicates that cities’ level of economic development and political status positively affects IGTFP to a certain extent. This also confirms the significance of establishing a national central city from the perspective of urban green development. It also shows that China’s economic growth still has a certain degree of agglomeration effect. The higher the administrative level of a city, the better it is equipped with transportation and other infrastructure. At the same time, more universities, scientific research talents, and even leading enterprises will gather in this city, thus stimulating the agglomeration effect of urban economic growth.
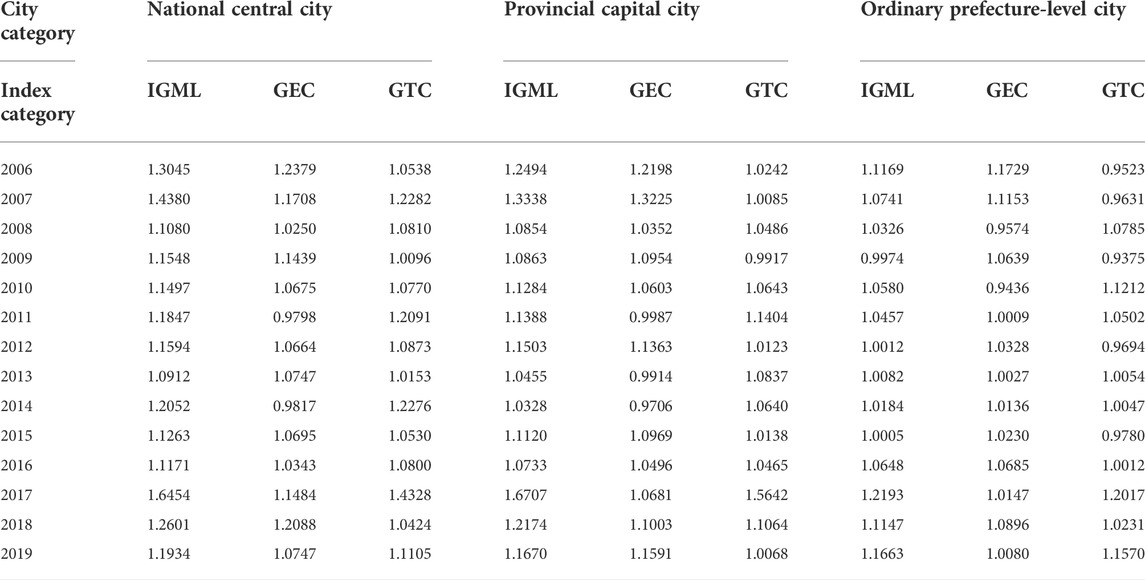
TABLE 2. Measurement and decomposition of IGTFP.
From the decomposition results of IGTFP, there is not much difference between the technical efficiency coefficients of the national central city, provincial capital city, and ordinary prefecture-level city, and even the technical efficiency coefficients of the ordinary prefecture-level city exceed that of the provincial capital city and national central city in some years. On the one hand, China’s ordinary prefecture-level cities have relatively sufficient land, labor, and other factors of production. On the other hand, the utilization of resources in Chinese cities is relatively complete. The resources of ordinary prefecture-level cities have been brought into full play through policy. However, we can see that the rate of technological progress of ordinary prefecture-level cities is significantly lower than that of provincial capitals and central cities. This is why the IGTFP of ordinary prefecture-level cities is lower than that of national central cities and provincial capitals. It also shows that the production technology of ordinary prefecture-level cities is different from that of national central cities and provincial capital cities. The dividend of the vigorous development of science and technology in China is more applied in major cities.
The national central city is the top-level legal planning in urban and rural planning. It is the overall arrangement of urban development and urban spatial layout, a vital policy basis for actively and steadily promoting urbanization, and the basis for all localities to formulate regional urban system planning and overall urban planning. The development of national central cities has a maximum effect on other cities and even society. Therefore, national central cities’ IGTFP is analyzed separately. According to the analysis results in Table 3, the IGTFP of central cities in each country increased from 2006 to 2019. Among them, the geometric mean productivity growth rate of most cities like Chongqing and Beijing reached more than 10%, and five cities like Chongqing, Beijing, Wuhan, Chengdu, and Shanghai even exceeded 14%. The southern cities have comprehensively surpassed the northern cities in terms of region. Among the northern cities, only Beijing and Xi’’an have achieved an average growth rate of more than 10%, while all the southern cities have exceeded 10%. This also shows that China’s economic development center is still in the south. In the future, more attention should be paid to the economic development of the northern central cities. On the other hand, it also reflects the more stable and “inclusive” development of central cities in the south. The income gap between urban and rural areas in northern China is relatively large, and the “inclusive” level of economic growth is slightly delayed.
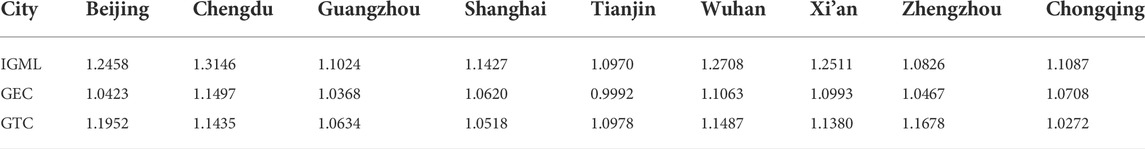
TABLE 3. National center city.
From exponential decomposition, all cities have realized the double-line improvement of technological efficiency and progress rate. Although the technical efficiency coefficients of Guangzhou and Tianjin are lower than 1, it also reaches more than 0.99, basically maintaining a stable state. The analysis shows that the technical efficiency coefficients of almost every city are lower than the technological progress rate coefficients. The reason is that China’s economy has been growing faster in recent years. The economic growth rate of the country’s central cities is leading the country. Large base and resources have been fully utilized, resulting in a slow growth rate of technical efficiency. In recent years, the level of scientific and technological development in China has developed rapidly, and the number of scientific and technological output in China has jumped to the second place in the world. The application of many scientific and technological achievements promotes rapid technological progress in China’s production process.
Convergence analysis of inclusive green total factor productivity
In order to further analyze the trend of IGTFP in China, our research uses the
The
In the above formula,
According to the national
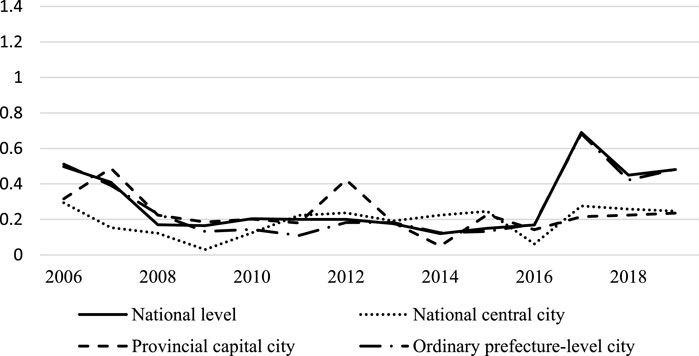
FIGURE 3.
Absolute
Absolute
Table 4 shows the absolute
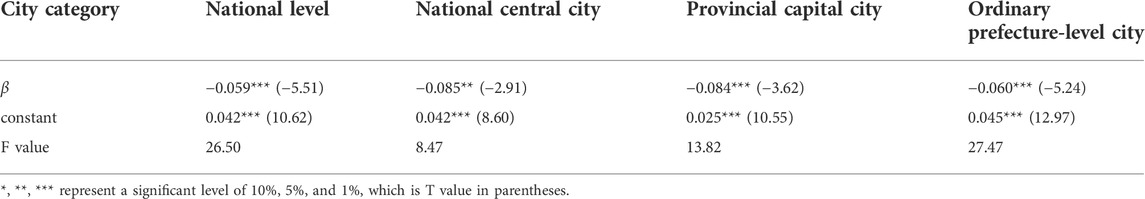
TABLE 4. Absolute
Conclusion
From the perspective of inclusive green growth, we establish the index evaluation system of inclusive green growth. By using the method of super-SBM, we measure the inclusive green total factor productivity (IGTFP) of China from the city level and explore and analyze the IGTFP index and its decomposition and evolution trend of coefficients of economic convergence. Empirical analysis results are as follows.
First, IGTFP in China has maintained a steady but rising trend both at the national level and at all levels of city, especially after 2008. Second, from the decomposition of IGTFP, there is a positive correlation between the rate of technological progress and the scale of urban development. In addition, the technical efficiency of the country and higher-level cities are generally lower than the rate of technological progress. Third, from the economic region level, the regional development of IGTFP in China is unbalanced. Fourth, the IGTFP of southern cities is significantly higher than that of northern cities, indicating that the southern cities are more substantial than the northern cities in terms of green economic development and social equity. Finally, from the economic convergence, only the IGTFP of provincial capitals shows the
The policy implications of this study are as follows: first, we should adhere to the concept of inclusive green development and achieve high-quality economic development through energy conservation and emission reduction and promoting social equity. On the one hand, it is necessary to increase investment in enterprise R&D and create a more relaxed R&D environment for enterprises, such as R&D incentives and tax exemptions. On the other hand, we should improve the income distribution system and strengthen the guidance of tertiary distribution on the basis of giving full play to secondary distribution to realize the organic unity of efficiency and fairness. Second, we need to break down the “regional” boundaries including the geographical boundaries (such as the north–south boundary) and the boundaries at the city level, between city scales, and within the economic zone. Third, we should strengthen the core driving function of green technology innovation and progress. The integration of technology and efficiency is the main driving force and path to realize the sustainable improvement of IGTFP in cities. For example, promoting the cooperation between “resource-first” enterprises in underdeveloped cities and “technology-first” enterprises in developed cities, accelerating the upgrading of industrial structure, and realizing the “two-wheel drive” of IGTFP. In addition, cities with low IGTFP can develop rural tourism, e-commerce, and other related industries according to local characteristics, and form an economic form with low input, high output, and lower-income gap with business models such as “New Economy” and “Digital Economy.” While promoting rural revitalization, the “digital economy” can also reduce the income gap between urban and rural areas, which can not only promote the improvement of IGTFP level, but also achieve China’s common prosperity goal.
Data availability statement
The original contributions presented in the study are included in the article/supplementary material, further inquiries can be directed to the corresponding author.
Author contributions
YG: Data Curation, Formal Analysis and Writing - Original Draft. HW: Conceptualization, Funding Acquisition and Visualization. RG: Resources and Software. DL: Supervision, Validation and Writing - Review & Editing.
Funding
Supported by the disciplinary funding of Central University of Finance and Economics, Supported by Program for Innovation Research in Central University of Finance and Economics, supported by the Emerging Interdisciplinary Project of CUFE.
Conflict of interest
The authors declare that the research was conducted in the absence of any commercial or financial relationships that could be construed as a potential conflict of interest.
Publisher’s note
All claims expressed in this article are solely those of the authors and do not necessarily represent those of their affiliated organizations, or those of the publisher, the editors, and the reviewers. Any product that may be evaluated in this article, or claim that may be made by its manufacturer, is not guaranteed or endorsed by the publisher.
References
Ahmad, E. (2021). Multilevel financing of sustainable infrastructure in China —policy options for inclusive, resilient and green growth. J. Infrastruct. Policy Dev. 5 (1), 1251. doi:10.24294/JIPD.V5I1.1251
Berkhout, K., Bouma, J., Terzidis, N., and Voors, M. (2017). Supporting local institutions for inclusive green growth: developing an evidence gap map. NJAS Wageningen J. life Sci. 84, 51–71. S1573521417300192. doi:10.1016/j.njas.2017.10.001
Chen, G., Yang, Z., and Chen, S. (2020). Measurement and convergence analysis of inclusive green growth in the Yangtze-river economic belt cities. Sustainability 12, 2356. doi:10.3390/su12062356
Chen, H., and Qin, W. (2014). The inclusive growth of China's economy: an explanation based on the perspective of inclusive total factor productivity. China Ind. Econ. 30 (01), 18–30. doi:10.19581/j.cnki.ciejournal.2014.01.002
Chirisa, I., Muzenda, A., and Bandauko, E. (2016). A case for inclusive growth through green economies in peri-urban Sub-Saharan Africa. Cham: Springer International Publishing. doi:10.1007/978-3-319-34231-3_7
Cui, H., Wang, H., and Zhao, Q. (2019). Which factors stimulate industrial green total factor productivity growth rate in China? An industrial aspect. Greenh. Gas. Sci. Technol. 9 (12), 505–518. doi:10.1002/ghg.1874
Dinda, S. (2013). Inclusive green growth and sustainable development through productive consumption. MPRA Paper.
Dinda, S. (2014). A theoretical basis for green growth. Int. J. Green Econ. 8 (2), 177. doi:10.1504/ijge.2014.065851
Dollar, D., Kleineberg, T., and Kraay, A. (2014). Growth, inequality, and social welfare: cross-country evidence. Econ. Policy 30 (82), 335–377. doi:10.1093/epolic/eiv001
Doumbia, D. (2019). The quest for pro-poor and inclusive growth: the role of governance. Appl. Econ. 51 (16-18), 1762–1783. doi:10.1080/00036846.2018.1529392
Feng, J., Zhao, L., Zhang, Y., Sun, L., Yu, X., Yu, Y., et al. (2020). Can climate change influence agricultural GTFP in arid and semi-arid regions of Northwest China? J. Arid. Land 12 (5), 837–853. doi:10.1007/s40333-020-0073-y
Grosse, M., Harttgen, K., and Klasen, S. (2008). Measuring pro-poor growth in non-income dimensions. World Dev. 36 (6), 1021–1047. doi:10.1016/j.worlddev.2007.10.009
Gu, K., Dong, F., Sun, H., and Zhou, Y. (2021). How economic policy uncertainty processes impact on inclusive green growth in emerging industrialized countries: a case study of China. J. Clean. Prod. 322, 128963. doi:10.1016/j.jclepro.2021.128963
He, Q., and Du, J. (2021). The impact of urban land misallocation on inclusive green growth efficiency. Environ. Sci. Pollut. Res. 28 (8), 1–12. doi:10.21203/rs.3.rs-421869/v1
Hill, H., Khan, M. E., and Zhuang, J. (2012). Diagnosing the Indonesian economy (toward inclusive and green growth). Munich, Washington, DC: Human Capital and Economic Development. doi:10.7135/UPO9781843313786.010
Li, H., and Dong, Y. (2021). China’s high-quality economic development level and the Source of differences: based on the inclusive green TFP perspective. J. Finance Econ. 47 (08), 4–18. doi:10.16538/j.cnki.jfe.20210615.201
Li, M., Zhang, Y., Fan, Z., and Chen, H. (2021). Evaluation and research on the level of inclusive green growth in asia-pacific region. Sustainability 13, 7482. doi:10.3390/su13137482
Li, X., Shu, Y., and Jin, X. (2020). Environmental regulation, carbon emissions and green total factor productivity: a case study of China. Environ. Dev. Sustain. 24, 2577–2597. doi:10.1007/s10668-021-01546-2
Parikh, K. S. (2014). Inclusive green growth in India's aspirational democracy. Oxf. Rev. Econ. Policy 30 (3), 569–583. doi:10.1093/oxrep/gru033
Peng, Y., Chen, Z., and Lee., J. (2020). Dynamic convergence of green total factor productivity in Chinese cities. Sustainability 12, 4883. doi:10.3390/su12124883
Rachel, K. (2012). Inclusive green growth: The pathway to sustainable development. Washington, DC: World Bank. doi:10.1093/epolic/eiv001
Re, F. R., and Grosskopf, S. (2010). Directional distance functions and slacks-based measures of efficiency: some clarifications. Eur. J. Operational Res. 206 (3), 702. doi:10.1016/j.ejor.2010.02.033
Ren, S., Li, L., Han, Y., Hao, Y., and Wu, H. (2022). The emerging driving force of inclusive green growth: does digital economy agglomeration work? Bus. Strategy Environ. 31, 1656–1678. doi:10.1002/bse.2975
Song, K., Bian, Y., Zhu, C., and Nan, Y. (2020). Impacts of dual decentralization on green total factor productivity: evidence from China's economic transition. Environ. Sci. Pollut. Res. 27 (1), 14070–14084. doi:10.1007/s11356-020-07953-8
Song, M., Du, J., and Tan, K. H. (2018). Impact of fiscal decentralization on green total factor productivity. Int. J. Prod. Econ. 205, 359–367. doi:10.1016/j.ijpe.2018.09.019
Sun, C., Liu, L., and Tang, Y. (2018). Measuring the inclusive growth of China's coastal regions. Sustainability 10 (8), 2863. doi:10.3390/su10082863
Sun, H., Mao, W., Dang, Y., and Luo, D. (2022). What inhibits regional inclusive green growth? empirical evidence from China. Environ. Sci. Pollut. Res. 29 (26), 39790–39806. doi:10.1007/s11356-021-17250-7
Sun, Y., Ding, W., Yang, Z., Yang, G., and Du, J. (2020). Measuring China's regional inclusive green growth. Sci. Total Environ. 713, 136367. doi:10.1016/j.scitotenv.2019.136367
Wan, G. (2010). Understanding regional poverty and inequality trends in China: methodological issues and empirical findings. Rev. Income Wealth 53 (1), 25–34. doi:10.1111/j.1475-4991.2007.00216.x
Wang, K., Pang, S., Ding, L., and Miao, Z. (2020). Combining the biennial Malmquist–luenberger index and panel quantile regression to analyze the green total factor productivity of the industrial sector in China. Sci. Total Environ. 739 (3), 140280. doi:10.1016/j.scitotenv.2020.140280
Wang, Y., Xie, L., Zhang, Y., Wang, C., and Yu, K. (2019). Does FDI promote or inhibit the high-quality development of agriculture in China? An agricultural GTFP perspective. Sustainability 11 (17), 4620. doi:10.3390/su11174620
World Bank (2012). Inclusive green growth: the pathway to sustainable development. Manila: World Bank. doi:10.1093/epolic/eiv001
Xin, Z. A., Wei, G., and Mbb, C. (2022). Inclusive green growth and development of the high-quality tourism industry in China: the dependence on imports. Sustain. Prod. Consum. 29, 57–78. doi:10.1016/j.spc.2021.09.023
Yang, H., Lin, Y., Hu, Y., Liu, X., and Wu, Q. (2022). Influence mechanism of industrial agglomeration and technological innovation on land granting on green total factor productivity. Sustainability 14, 3331. doi:10.3390/su14063331
Zhang, X., Wan, G., Zhang, J., and Zongyue, H. E. (2019). Digital economy, financial inclusion, and inclusive growth. Econ. Res. J. 54 (08), 71–86. CNKI: SUN: JJYJ.0.2019-08-005.
Zhao, F., Yuan, Y., and Zhang, Q. (2022). Carbon emission trading scheme, carbon emissions reduction and spatial spillover effects: Quasi-experimental evidence from China. Front. Environ. Sci. 1 (04), 824298. doi:10.3389/fenvs.2021.824298
Zhou, X., and Wu, W. (2018). Measurement and analysis of China's inclusive green growth. Quantitative Econ. Tech. Econ. 35 (08), 3–20. doi:10.13653/j.cnki.jqte.2018.08.001
Keywords: inclusive green total factor productivity, index evaluation system, urban level, super-SBM, economic convergence
Citation: Guan Y, Wang H, Guan R and Ding L (2022) Measuring inclusive green total factor productivity from urban level in China. Front. Environ. Sci. 10:966246. doi: 10.3389/fenvs.2022.966246
Received: 10 June 2022; Accepted: 06 July 2022;
Published: 09 August 2022.
Edited by:
Kun Guo, University of Chinese Academy of Sciences, ChinaReviewed by:
Lanhui Wang, Beijing Forestry University, ChinaYang Faqiong, Yunnan Normal University, China
Copyright © 2022 Guan, Wang, Guan and Ding. This is an open-access article distributed under the terms of the Creative Commons Attribution License (CC BY). The use, distribution or reproduction in other forums is permitted, provided the original author(s) and the copyright owner(s) are credited and that the original publication in this journal is cited, in accordance with accepted academic practice. No use, distribution or reproduction is permitted which does not comply with these terms.
*Correspondence: Lin Ding, ZGluZ2xpbmtsQDEyNi5jb20=