 Guangliang Wu1
 Yana Buravleva
 Decai Tang
95% of researchers rate our articles as excellent or good
Learn more about the work of our research integrity team to safeguard the quality of each article we publish.
Find out more
ORIGINAL RESEARCH article
Front. Environ. Sci. , 13 September 2022
Sec. Environmental Economics and Management
Volume 10 - 2022 | https://doi.org/10.3389/fenvs.2022.964528
This article is part of the Research Topic Assessment of Nuclear and Renewable Energy Utilization for Sustainable Economic Growth View all 9 articles
Governments design and implement policies to achieve various goals. Still, perhaps none are as pressing as shifting national economies away from non-renewable fuels and towards more sustainable, environmentally-friendly technologies. To incentivize such transitions, governments provide subsidies to private and public companies to innovate, i.e., to engage in research and development (R&D). However, it can be asked if companies are using government subsidies (GS) actually to perform R&D, and the answer will determine the effectiveness of government policies. This paper seeks to answer this question by investigating Chinese lithium-ion battery (LiB) firms and the GS they receive. Hausman tests, fixed- and random-effects models, and Generalized Method of Moments confirmed a positive but weak correlation between GS and R&D as determined by patent output (PO). Interestingly, observations of information flow suggested that GS also affected other variables such as net profit and main business income. This suggests that firms are awarded GS for higher PO, but a corresponding increase in R&D and its expected growth in company performance is not occurring. It is suggested that performance indicators other than PO be used as Chinese firms may use this metric to apply for more GS, rather than performing R&D that leads to technological breakthroughs.
On 24 February 2022, previously strained relationships between Russia and Ukraine severely worsened into active hostilities. This led to large-scale perturbations in the stability of world energy and food markets as both nations are major global suppliers of fossil fuels and grain (Ozili, 2022). Following sanctions imposed upon Russia by Western European and other countries (Chepeliev et al., 2022), restrictions on the sale of Russian fossil fuels to these nations have aggravated the historical volatility of the sector (Stulberg, 2017; Fokaides, 2020; Goncharuk et al., 2021; Stančík et al., 2021; Mišík, 2022). Consequently, it can be argued that if these Western European and other nations were less reliant on fossil fuels in general, the geopolitics currently in play could have been altered towards greater international peace through the adoption of renewable energy (Ratner et al., 2019; Su et al., 2021; Yusta and Beyza, 2021; Hosseini, 2022). Renewable energy, however, is strongly reliant on the grid operator’s ability to store electricity generated from (primarily) solar and wind energy (Keck et al., 2019; Loukatou et al., 2020; Laribi and Rudion, 2021; Mikulski and Tomczewski, 2021; Šimić et al., 2021; Olabi et al., 2022a). Lithium-ion batteries (LiBs) have emerged as a critical technology in advancing the spread and development of renewable energy (Olabi et al., 2022b) and are being used to stabilize electrical grids (Mora et al., 2020; Laribi and Rudion, 2021; Moy et al., 2021), and in a new generation of electric vehicles (Rodríguez-Fernández et al., 2020; Scott and Ireland 2020; Cui et al., 2022). However, in volatile energy markets, how can enterprises be incentivized to engage in research and development (R&D) activities to make such technologies possible? Governments often answer this question in the form of policies, the granting of subsidies, tax reductions, and grant schemes (Yang et al., 2019; Lin and Luan., 2020; Helm and Mier, 2021).
In a recent study, we used Hausman tests, fixed- and random-effects, and information flow to study the causal relationship of government subsidies (GS) on R&D activity in Chinese LiB companies (Buravleva et al.,2021). There it was found that Hausman tests, fixed- and random-effects models all supported a weak but positive association between GS and R&D as measured by patent output (PO), but IF model revealed that GS also influenced other variables, including net profit (NP), and main business income (MBI). This shows that corporations are receiving GS for higher PO, but there is no matching rise in R&D, and so no predicted development in company performance. Here in this follow-up study, the well-balanced panel dataset used there is re-organized to investigate bidirectional causality in LiB enterprise patent output and R&D on longer scales of time than in the original study conducted by Buravleva et al. (2021), which had a larger dataset, but only had 89 data from 2015–2018. In this study, 67 LiB enterprises were chosen with data from 2012–2018 to continue testing the causal relationship of GS on patent output (PO) and R&D investment (RD). In addition to previously mentioned methods, this study uses OLS regression to identify the connection between GS and other chosen variables from a bidirectional causality perspective rather than a unidirectional perspective as is common in the literature. This is achieved using traditional regression analyses, fixed- and random effects models, and a Hausman test. Still, it also uses information flow (IF) to examine bidirectional causality, which is not currently widely applied but is very powerful. The remainder of this paper is organized as follows: Data and methodology gives the data acquired and methodologies employed, Results describes the main findings of this study, and Conclusion provides the conclusions and policy recommendations.
As one of the largest producers of lithium and a key consumer of LiBs (Liu et al., 2021; Yu et al., 2022), China is an important laboratory to test the effects of government policies on enterprise R&D investments in LiB technologies (Chen et al., 2019; Shen and Wang, 2019; Pu et al., 2022). For example, Wu et al. (2019) suggested that even with an increase in the number of R&D subsidies, innovation output in Chinese firms was weak, if at all, affected. Li et al. (2020) suggested that, based on analyses of dual credit policies and subsidies, unless the government supplied new financial subsidies, Chinese LiB producers were not competitive. Peng and Li (2022) studied the evolution of the Chinese new energy vehicle industrial policy and found that financial policies significantly stimulated the development of the new energy vehicle industry. Pu et al. (2022) analysed the patent network of LiBs in three stages: 2009–2012, 2013–2016, and 2017–2020 and showed that following 2009, new LiB enterprises and institutions were more inclined to cooperate with institutions with high centrality, and these were primarily state-owned organizations/institutions with key technologies that control network resources and influence network development. Zhong et al. (2022) used a three-stage Data Envelopment Analysis (DEA) and Tobit models to evaluate China’s listed LiB enterprises in an examination of how external environment and enterprise management factors influence the industry’s real technological innovation efficiency (TIE). The authors found that the average TIE was low at 0.39, but to improving the implementation of industrial support policies, enhancing industrial agglomeration, and promoting the sharing of innovative resources may potentially be important for driving firm scale efficiencies. Sun et al. (2021) argued through an investigation of R&D manipulation of Chinese listed companies under preferential tax policies. They found that preferential tax policies can reduce tax burdens of high-tech enterprises but warn that some companies have enjoyed corporate income tax breaks by manipulating R&D spending. As suggested by recent literature, there may exist a bidirectional causal relationship between the patent number or firm innovation and R&D investments (Yu et al., 2016; Altuzarra, 2019). For example, Santoleri et al. (2020) showed through a regression discontinuity that R&D grants trigger increases in investments and innovation outcomes as measured by cite-weighted patents, in addition to allowing for faster growth in assets, employment, revenues, and higher likelihoods of receiving follow-on equity financing and lower failure chances. Xue et al. (2021) used annual data from 1990–2019 to examine the factors affecting the development of new energy development in China. They found that, excluding industrial structure, one-way Granger causality exists between each studied factor and new energy consumption in different lag orders. In Korea, Sung (2019) showed a positive bidirectional causal relationship exists between firm innovation and R&D subsidies in Korean renewable energy firms. Chiappini et al. (2022) suggested that access to innovation subsidies significantly improved access to bank financing for subsidized firms. Vestikas and Stamboulis (2017) investigated the causal relationship between R&D expenditure, patents, and economic growth in ten innovative countries. They found a strong unidirectional causal link between economic growth and two innovation indicators for time lags of significant length. Das (2020) studied both the long-run associations and short-run dynamics between R&D spending, patent number, and per capita income growth in a panel of countries and groups for the period 1996–2017 and found that none of these variables has long-run equilibrium relations but in the short-run, income growth and the patent number increases R&D spending.
In panel data study, regression analysis fixed and random effects models are commonly employed to examine the influence of GS and corporate R&D investments (Bell et al., 2019). Consider the following cross-sectional multiple regression with explanatory variables X1 and X2:
where X1 is the covariate of X2 and vice versa. For a given variable, covariates serve as regulating factors. When control variables are available,
The marginal effects have the same explanation, but we can now monitor the system’s evolution over time. To account for time heterogeneity, we can combine Eqs 1, 2 to create a pooled dataset, which can be used to create panel data using the panel regression method:
Cross section and time heterogeneity can be managed using a two-way error component assumption for perturbations:
where
In this paper, the R&D investments and PO are used to measure innovation in LiB. R&D investments, as the name implies, are funds invested by LiB enterprises in technological breakthroughs, which indicate these companies’ determination to innovate. As there is a lag between patent application and authorisation, PO is measured in terms of the number of patents applied for due to technological innovations rather than the actual number of patents received. The key explanatory variable in this analysis is GS. If the increase of corporate R&D investments outpaces the growth of GS, this suggests that GS is promoting R&D investments. Correspondingly, if R&D investments are lower than GS growth, GS is likely not having the desired effect and that subsidies should be redesigned. Table 1 contains the full list of variables.
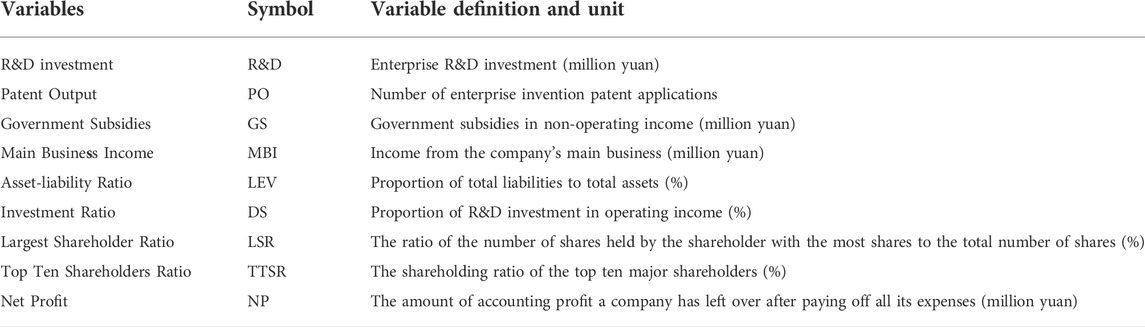
TABLE 1. Variable descriptions.
The size and operating conditions of LiB firms are the most important control elements regarding R&D investment. The main business income (MBI) of LiB enterprises indicates sales and market share, and it can be used as a representative variable to describe the company’s size. If the company is not performing well, it will face a debt problem, and it will be necessary to prioritize principal and interest repayment, restricting R&D investment. The asset-liability ratio (LEV) is a measurement of a company’s financial health that is represented as the ratio of total liabilities to total assets. The level of organizational knowledge impacts LiB company innovation as an emerging industry. Their R&D intensity largely influences LiB firms’ PO. To represent the importance of LiB enterprises on R&D, the R&D investment ratio (DS) is utilized. Generally, the stronger the company’s R&D intensity, the greater the concentration on R&D activities, and the higher the output of high-quality patents. The largest shareholders ratio (LSR) was chosen as an index because it represents the propensity of the company’s largest owners to invest in innovations to maximize their profits from selling high-quality products. Net Profit (NP) expresses the size of profit and reflects the amount of money that corporations can spend directly on innovation. To indicate the probable shareholders’ contribution to R&D, the top 10 shareholders ratio (or major shareholders; TTSR) was employed as the largest shareholders ratio, confined to within 10 primary distributors.
Among the control variables, the RD investment of lithium battery companies is mainly affected by the size and operating conditions of the company. Main business income (MBI) reflects the sales and market share of LiB companies and can be used as a representative variable reflecting the company’s scale. If the business is not operating well, it will lead to a debt crisis, and the company must prioritize repayment of principal and interest, thereby reducing RD investment. The asset-liability ratio (LEV) is used to reflect the business status of the enterprise, and it is expressed as the proportion of total liabilities to total assets. As an emerging industry, the innovation of lithium battery companies is also affected by the level of organizational knowledge. The patent output of lithium companies is mainly affected by the company’s RD intensity. The RD investment ratio (DS) is used here to express the importance of LiB companies on RD. Generally, the greater the RD intensity of the company, the more emphasis is placed on RD activities, and the better the output of high-quality patents. The largest shareholders ratio (LSR) was chosen as an index, representing the willingness of shareholders with the largest share in the company to invest in innovations, focusing on maximization of their income from selling high-quality inventions. Net Profit (NP) reflects the amount of money that companies can spend directly on innovations and expresses the size of profit. The top 10 shareholders ratio (or major shareholders) (TTSR) as the largest shareholders ratio was used to represent the possible shareholders’ contribution to RD, limited to within 10 main distributors.
To investigate the effects of GS on LiB innovation, we use a well-balanced panel dataset of 67 LiB-manufacturing companies from 2012 to 2018. To consider both fixed and random effects, the Hausman specification test is employed (Hausman, 1978):
where R&D is R&D investments and PO is the PO; i = 1, 2, ..., n, represents different enterprises; t = 1, 2, ..., n, represents time, and
According to Table 2, there is a significant gap between the highest and minimum value of R&D investment, and the median is significantly less than the average value, showing that overall LiB R&D investment is minimal, but the R&D investment of a few LiB businesses has expanded. The number of innovation patents and R&D investments have a similar distribution, with the median being significantly lower than the average, showing that LiB firms’ overall production of invention patents is tiny and unevenly distributed. The impact of GS on LiB enterprises’ R&D investment can be further investigated using the econometric model. Given the significant differences in values between variables, before all further analyses were conducted, the data were normalized to a 0 to 1 range.
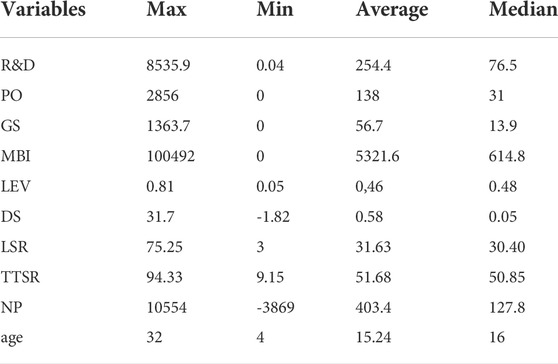
TABLE 2. Descriptive statistics before normalization.
The Hausman or Durbin-Wu-Hausman (DWH) test is done on panel data to select the best appropriate model among fixed and random effects models. It determines the presence of endogeneity (predictor variables) in the panel model. The random effects model is used if the p-value is > 0.05. If the p-value is
Linear regression models are useful in a variety of situations. A multinational firm, for example, can use linear regression to determine which elements are crucial in determining how its product sales are affected. The Ordinary Least Squares (OLS) approach is commonly used in econometrics to estimate a linear regression model’s parameter. The sum of squared errors is minimized using OLS estimators (a difference between observed and predicted values). While OLS is computationally feasible and may be easily used in any econometrics test, it is critical to understand the assumptions that underpin OLS regression. This is because a lack of understanding of OLS assumptions could lead to its misuse, resulting in inaccurate results for the econometrics test. Simple linear regression is a statistical model widely used in machine learning regression problems, based on the idea that the relationship between two variables can be explained by the following equation:
where
In OLS, the idea of a simple linear regression is to find those parameters
The optimization problem steps can be demonstrated as follows. If we rethink the square sum of errors as:
We can set our optimization problem as follows:
Based on the optimization in Eq. 13,
Knowing that the sample covariance between two variables is defined as:
Knowing that the sample correlation coefficient between the two variables is:
We can rephrase the above expression as follows:
The same is true for
Having obtained those values of
OLS is a strategy for getting a “straight line” from the model as close as possible to data points. While OLS is not the only optimization strategy, it is the most popular for this kind of problem because the regression outputs (i.e., coefficients) are objective estimates of the actual alpha and beta values. In this model, innovation in LiBs also is measured by R&D and PO. The main business income (MBI), the asset-liability ratio, and the biggest shareholder’s ownership ratio (LSR) were also employed as control variables in the OLS regression model. The level of organizational knowledge impacts LiB company innovation as an emerging industry. The R&D intensity of a LiB firm has a significant impact on its PO. The company’s age is used to represent the duration of the company’s existence from its inception to 2018. Equity nature (ES) denotes whether the corporation is owned by the government or private entrepreneurs. If the company is owned by the country, the variable will be represented as 1. If the company is not owned by the country, the variable will be represented as 0. Table 3 contains the list of variables.
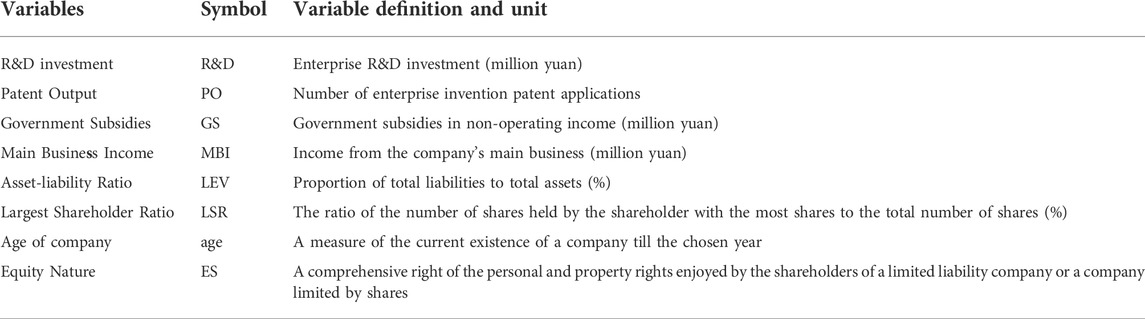
TABLE 3. Variable descriptions.
We used a balanced panel data set encompassing 67 LiB manufacturing enterprises from 2012–2018 to investigate the impact of GS on LiB innovation. The following model is built to investigate the impact of GS on LiB company innovation:
where i = 1, 2, ..., n, represents different companies, t = 1, 2, ..., n, represents time, δi+φt represents industry and time fixed effects, and αit represents random effects. The study selected 67 companies, and the data does not include the impact of price factors. The patent data is collected from the patent search and analysis platform (http://pss-system.cnipa.gov.cn), and the rest comes from the Guotai’an database (https://www.gtarsc.com). To ensure the robustness of the model, quality control was performed to exclude companies that lost a large amount of data.
Based on Eqs 7, 8, a dynamic panel regression model is constructed by adding the first-order lag term of the explained variable as the explanatory variable. Focus on the impact of Chinese government subsidies on the R&D of LiB manufacturing enterprises under the dynamic panel model, as shown in Eqs 22, 23.
IF determines the bi-directionality of causality between GS and other factors. IF is a true physical concept created and rigorized by Liang (2014) for assessing causation between two-time series quantitatively. The rate of information flow from one variable’s time series to another is used to determine causality. The maximum probability estimator of IF from X2 to X1 given two-time series X1 and X2 is:
where
where
The Granger causality method is essentially a statistical hypothesis test. It is based on the complete information set and the sequence of occurrence times. It belongs to the hypothesis of “cause is earlier than effect”. The Granger causality method only judges whether the sequence of two events is statistically significant and cannot accurately determine the causal relationship. Compared with the Granger causality method, IF gives a strict definition of information flow and extends it to systems with arbitrary dimensions. Different information flow transfer rate formulas of deterministic/stochastic systems are derived.
ADF test was used to test the unit root of the variables. If the unit root exists, it indicates that the panel data is not stable. At this time, differential processing is required for the data. To improve the accuracy of the test results, this paper uses PP Fisher, LLC and ADF Fisher test methods to test R&D, GS, MBI, LEV, LSR, PO, DS and TTSR. The stationarity of GS, LEV, LSR, PO and DS was poor after processing with Stata software. Therefore, after the first-order difference processing, the unit root was tested again, and the results showed that the sequence was stable. The unit root test results are shown in Table 4. R&D, GS, MBI, LEV, LSR, PO, DS and TTSR are all first-order single integer sequences.
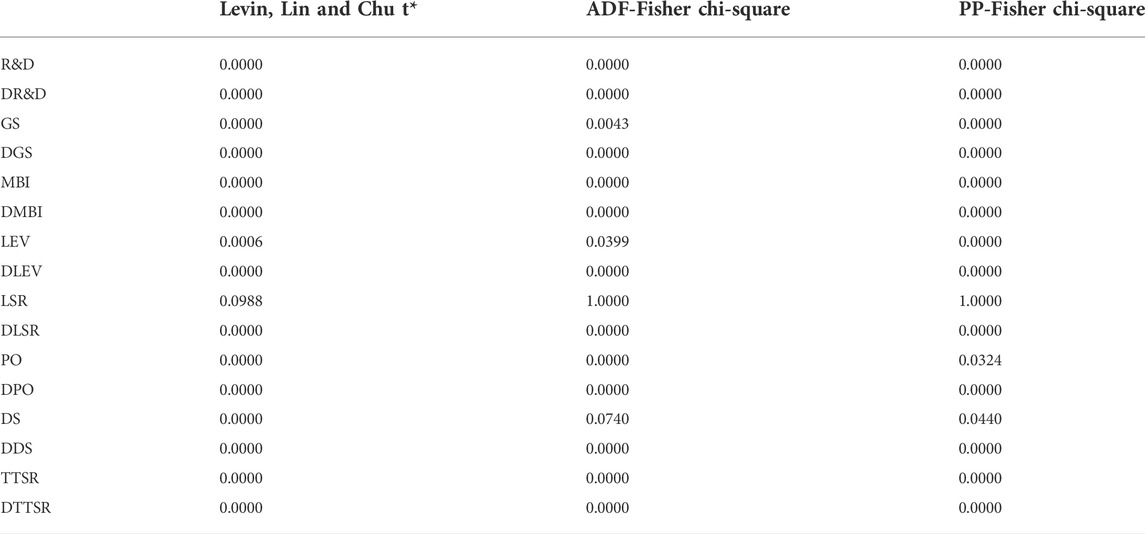
TABLE 4. Unit root test results.
To estimate the correlation between the selected variables for another period, fixed and random effect models and the Hausman test were implemented. As shown in Table 5, the Prob > chi2 value is greater than 0.05, and the original assumption is accepted at the level of a 95% confidence interval. So we choose the random effect model. Hausman test is only an auxiliary tool to determine the fixed effect model or random effect model, so this paper discusses and analyzes the two models. As shown in Table 5, the MBI successfully passes the 1% significance level test, with a coefficient of 0.203 and 0.216. This indicates that for a longer period LiB enterprise R&D investment is also positively correlated with company size, supporting the previous conclusion that LiB enterprises are important parts of the Chinese economy and are provided with the complete PD investment structure. With the increased business income of Chinese lithium-ion battery enterprises, lithium-ion battery enterprises carry out technological innovation to reduce product production costs. And develop new products according to the market demand to increase the R&D investment of the enterprise. GS passed the 1% significance level, with a coefficient of 0.515 and 0.495, respectively, which are higher than for the same model but for a shorter period, indicating the importance of governmental subsidies for LiB enterprises in the long term. To promote industrial development, the government provides subsidies to lithium-ion battery enterprises to reduce the cost and risk of enterprise R&D projects. However, due to the influence of the industrial development environment, enterprise development status and subsidy policies, government subsidies can not promote the growth of enterprise R&D investment. The results show that Chinese government subsidies can significantly promote the R&D investment of lithium-ion battery enterprises. LSR didn’t pass the significance test at the 1% level, with correlation coefficients for the fixed and random effects being measured at 0.018 and 0.007, respectively, supporting the result for a shorter period (2015–2018). This also indicates that long-term support from investors doesn’t influence the higher R&D investments.
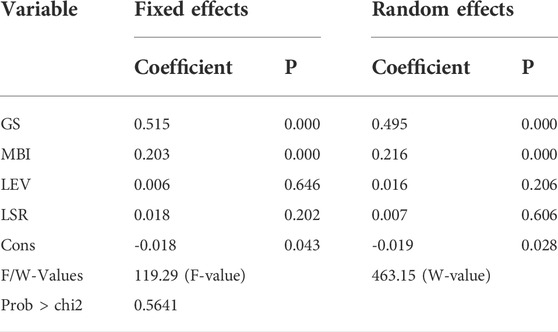
TABLE 5. Regression results for R&D investments.
As shown in Table 6, the Prob > chi2 value is greater than 0.05, and the original assumption is accepted at the level of a 95% confidence interval. So we choose the random effect model. Hausman test is only an auxiliary tool to determine the fixed effect model or random effect model, so this paper discusses and analyzes the two models. Table 6 shows that the model’s capacity to estimate hidden effects is significant, with F- and W-values of 113.03 and 441.40, respectively. With coefficients of 0.916 and 0.917, GS passed the significance test at the 1% level, indicating a strong positive correlation between GS and PO. The government subsidises lithium-ion battery enterprises to promote industrial innovation and development. Enterprises use government funds and policies to speed up technology and product research and development, thus accelerating the improvement of enterprise patent output. When the regression findings of the R&D investment equation (Table 5) are considered together, GS has a direct role in R&D promotion. These findings, however, show that LiB firms are not sufficiently motivated to engage in high-quality R&D, given the subsidies’ policy focus on fostering continuing investments. Otherwise, among the control variables, the R&D investment ratio did not pass the significant test at the level of 1%, with a coefficient of 0.005 and -0.003 for fixed and random effect models, respectively. These results show that the amount of money invested in R&D is unrelated to the number of patents. At the 10% level, the LSR almost passed the significance test, with coefficients of 0.113 and 0.094 for fixed and random effect models, respectively.
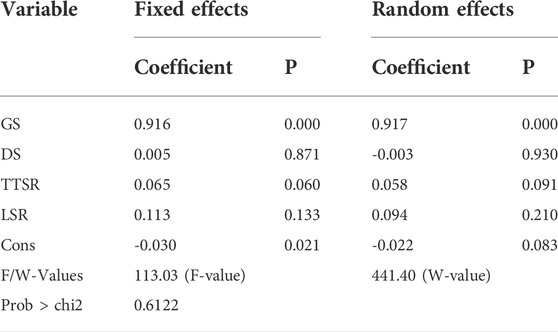
TABLE 6. Patent output regression results.
Taking into account the heterogeneity between samples, OLS regression models were used. Table 7 shows the estimated results of the R&D investment equation panel. R-squared and adjusted R-squared are 0.902 and 0.891, respectively. It shows that the fitting effect of this model is good. DW value is 2.197 greater than 2. It shows that the error term in the model is non-autocorrelation and conforms to the hypothesis. F-value is 81.63, which reflects that all variables of the model are significant. In the evaluation results, GS passed the 1% significance level test with a coefficient of 0.505, indicating that GS significantly impacted LiB’s R&D investment promotion. For these results, it is suggested that GS can effectively promote R&D investment. Among the control variables, MBI, which reflects the company’s size, passed the 1% significance level test with a coefficient of 0.212, indicating that LiB enterprise R&D investment is positively correlated with company size. With the growing scale of China’s lithium-ion battery enterprises, lithium-ion battery enterprises pay more attention to product technology innovation and new product design. Therefore, the R&D investment of enterprises has increased. LEV and LSR failed the 1, 5 and 10% significance test, and the coefficients of OLS regression were 0.007 and 0.018, respectively, indicating that the asset-liability ratio and shareholders’ role in R&D support is relatively low.

TABLE 7. Regression results of R&D investment.
According to Table 8, the F-value is 80.70, indicating that the model’s ability to estimate hidden effects is very important. R-squared and adjusted R-squared are 0.892 and 0.861, respectively. It shows that the fitting effect of this model is good. DW value is 1.967, close to 2. It shows that the error term in the model is non-autocorrelation and conforms to the hypothesis. F-value is 80.70, which reflects that all variables of the model are significant. In addition, GS also passed the 1% significance test with coefficients of 0.951, which indicates a very high positive correlation between GS and PO. Combined with the regression results of the R&D input equation (Table 7), GS has a direct role in promoting R&D. Among the control variables, the age of the OLS regression model and ES failed the significance test at the 1, 5 and 10% level, with coefficients of 0.007 and -0.002, indicating that the age of the company and its’ ownership doesn’t affect the number of patents in the long-term. The LSR didn’t exceed the 10% level, and the coefficients are 0.042, respectively, indicating that shareholders can have a small contribution to PO.
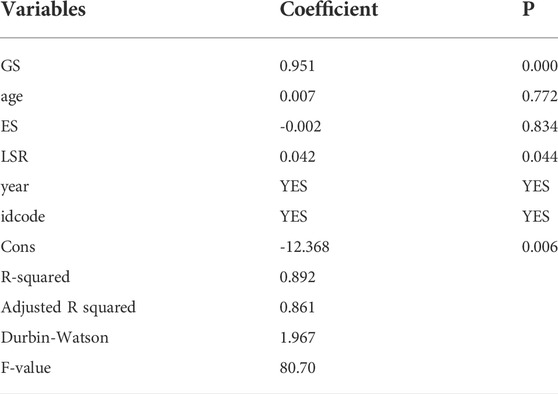
TABLE 8. Regression results of PO.
Because R&D and PO may have strong time series-related problems, we incorporate the lag phase of R&D and PO into the model and uses it to build a dynamic panel model. The two-step SYS-GMM is adopted for calculation, and the results are shown in Tables 9, 10.
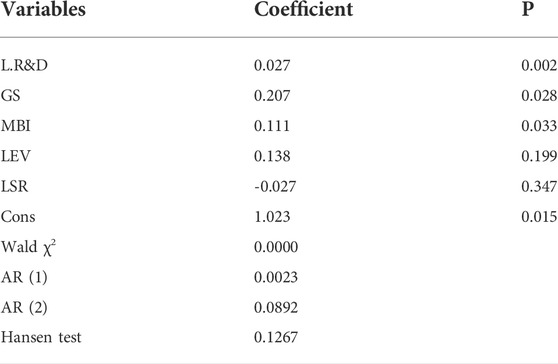
TABLE 9. Generalized Method of Moments results of R&D investment.
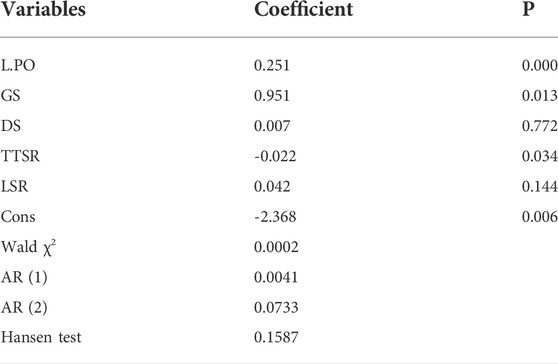
TABLE 10. Generalized Method of Moments results of PO.
It can be seen from Table 9 that the p-value of Wald χ2 is less than 0.05. The results of the AR test show that AR (1) is less than 0.05, and the random disturbance term has first-order autocorrelation. AR (2) is greater than 0.05, indicating no second-order autocorrelation in the random disturbance term. In addition, the result of the Hansen test is greater than 0.05, indicating that the model is not over-identified and that model is good. This shows that the regression results are credible. It can be seen from Table 9 that the coefficient of R&D lag of the first order is significantly positive at the level of 1%. It shows that R&D will be significantly affected by the lag period, but the impact is small, with a coefficient of 0.027. GS passed the 5% significance level test with a coefficient of 0.207. It has a significant positive impact on the R&D of LiB manufacturing enterprises. This conclusion is consistent with the fixed effect model and OLS regression. Among the control variables, MBI passed the 5% significance level test with a coefficient of 0.111. It has a significant positive impact on the R&D of LiB manufacturing enterprises. LEV and LSR did not pass the 5% significance level test and did not have a significant impact on the R&D of LiB manufacturing enterprises.
It can be seen from Table 10 that the p-value of Wald χ2 is less than 0.05. The results of the AR test show that AR (1) is less than 0.05, and the random disturbance term has first-order autocorrelation. AR (2) is greater than 0.05, indicating no second-order autocorrelation in the random disturbance term. In addition, the result of the Hansen test is greater than 0.05, indicating that the model is not over-identified and that model is good. This shows that the regression results are credible. It can be seen from Table 10 that the coefficient of PO lag of the first order is significantly positive at the level of 1%. It shows that PO will be significantly affected by the lag period, but the impact is small, with a coefficient of 0.251. GS passed the 5% significance level test with a coefficient of 0.951. It has a significant positive impact on the PO of LiB manufacturing enterprises. This conclusion is consistent with the fixed effect model and OLS regression. Among the control variables, TTSR passed the 5% significance level test with a coefficient of -0.022. It has a significant positive impact on the PO of LiB manufacturing enterprises. DS and LSR did not pass the 5% significance level test and did not have a significant impact on the R&D of LiB manufacturing enterprises.
In a deeper examination of the effect of GS on R&D and other variables for the period from 2012 to 2018, IF was applied and the results are collated in Table 11. Figure 1A presented IF from each variable to GS. The most important point is its magnitude and polarity. It differs from the positive and negative correlation represented by the positive and negative symbols in economics. In the information flow evaluation method, the positive value in the calculation result represents the determination of causality, and the negative value represents the uncertainty of causality. Among the eight variables, R&D, MBI, and LSR are negative, indicating that the causal relationship between R&D, MBI, LSR and GS is vague. PO, LEV, DS, NP, and TTSR have a long-term and stable causal relationship with GS. This also indicates that instead of information flowing from each variable to GS, information was flowing from GS to each variable, implying that growth was stimulated, which is correlated with the results of both fixed and random effects models and OLS regression. Figure 1B shows that DS is negative among the eight variables, indicating no stable causal relationship between GS and DS. The other seven variables are positive, indicating a long-term stable relationship between GS and the seven variables. Figure 1B indicates that R&D, PO, NP and MBI are all highly influenced by GS, while LSR, LEV, DS, and TTSR are almost totally neglected. Among them, the causal relationship between GS and R&D is the most significant. This result is consistent with the fixed effect and random effect models and OLS regression. The provision of R&D subsidies by the Chinese government often strictly requires enterprises to increase R&D investment. Therefore, lithium-ion battery enterprises receiving financial subsidies also show high R&D investment.
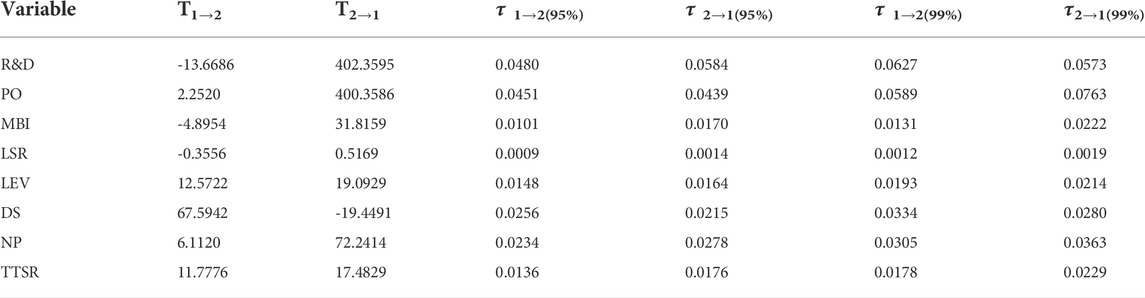
TABLE 11. Results of information flow.
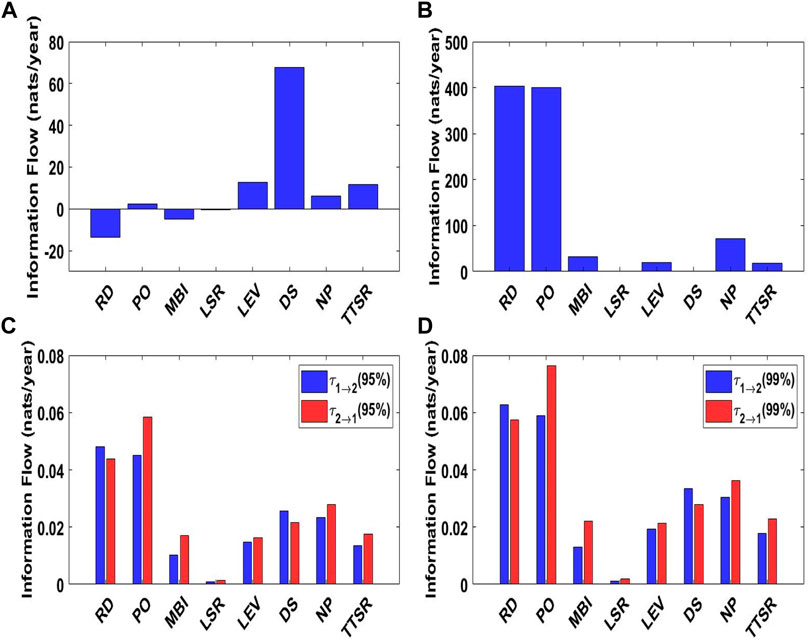
FIGURE 1. Information flow (A) from each variable to GS (T1→2), (B) from GS to each variable (T2→1), with the corresponding significant values (
The comparison between Figures 1A,B shows that the influence of GS on other variables is much greater than that of the influence of other variables on GS. Therefore, the government should formulate reasonable and effective financial subsidy policies according to the actual situation of enterprise development. To effectively promote the innovation and development of lithium-ion battery enterprises.
In Figure 1C, omitting the R&D variable, at the 95% confidence level, IF is higher to variables from GS (
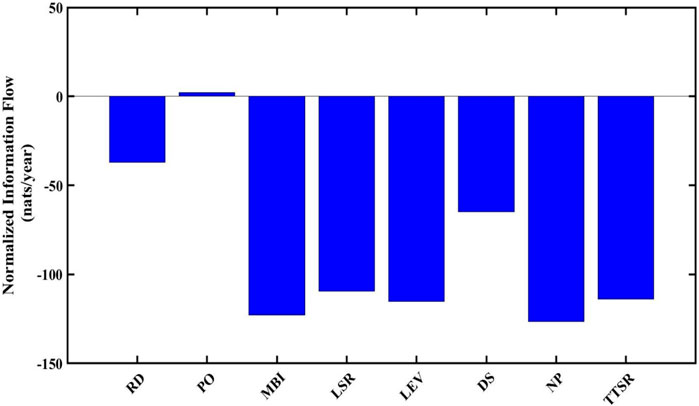
FIGURE 2. Relative importance of detected causality from each variable to GS.
In a world where geopolitical crises can strike at the heart of energy security, weaning economies off volatile fossil fuels is beneficial for slowing the pace of carbon dioxide emissions and global warming and minimizing conflict and economic uncertainty arising when markets are thrown into disarray. This study considered several factors thought to drive innovation in Chinese LiB manufacturers. LiBs are linchpins in the transition to renewable energy by investigating the causal relationship between corporate performance and PO as a result of R&D investments. Results from OLS regression and fixed and random effects revealed a link between GS, PO, and R&D investments, the association between these variables was sometimes rather modest in the short term. On longer scales of time, the role of GS in stimulating PO and R&D investments increased significantly. Specifically, as MBI passed the 1% significance test, this indicated that LiB enterprise R&D investment is positively correlated with company size over longer periods as identified by the original study conducted by Buravleva et al. (2021). Additionally, as GS also passed the 1% significance test, this highlights that GS remains important for LiB enterprises over the long term. However, LSR failed to pass the 1% significance test, suggesting that over long periods, support from investors does not strongly influence R&D investments. Additionally, it could be suggested that providing GS to enterprises led to more R&D investments and, consequently, higher PO. Applying IF causality from GS to the measured variables revealed that GS had the highest influence on PO, followed by NP and then R&D, with MBI and LEV having a substantially smaller influence. LSR, DS, and TTSR all had a negative impact on GS, implying that these variables may limit GS’s implementation for a specific firm. Although this analysis strongly suggested a favourable association between GS, R&D, and PO, it cannot be disregarded that patents may have been sought not when scientific advancements are made but as padding to ensure that personal or corporate assessments are optimum and GS can be acquired. Unfortunately, no clear correlation between PO and company success by IF can be verified due to additional variables not studied here, even though LiB manufacturers took risks by increasing R&D investments and GS were made accessible to incentivize these risks. These variables, such as the number of employees and their associated education levels, may significantly impact evaluating R&D investments and patent output because the more highly educated individuals a company has and maintains, the higher the quality of its products.
1) We should attach importance to the guiding role of government subsidies in enterprise innovation. From the empirical analysis of this paper, we can see that government subsidies have a general incentive effect on the innovation behaviour of enterprises. Because the R&D innovation of enterprises has its inherent limitations, the return cycle is long, and knowledge spillover is easy to occur. There is a serious asymmetry in the input-output ratio of enterprises, which leads to more concerns about R&D investment. The government has the role of regulating the market. It is necessary to give full play to the regulatory role of government subsidies in the innovation of lithium-ion battery enterprises to promote industry development.
2) Increase government subsidies for innovation of lithium-ion battery enterprises. To successfully transform China’s lithium-ion battery industry into a long-term and effective high-quality development, it is necessary to guide the market. In particular, high-tech enterprises and scientific research institutes will increase investment in innovation and improve the efficiency of subsidy funds.
3) Further improve the government subsidy mechanism. Learn from the experience of developed countries worldwide and allocate R&D funds fully and effectively. Improve the R&D fund allocation system to support innovative research so that science and technology can develop rapidly.
4) Formulate talent attraction policies for the lithium-ion battery industry. Ion battery enterprises should prioritize improving the quantity and quality of technical and scientific talents because only an expert team with a stronger theoretical and practical foundation can achieve breakthroughs and improve innovation efficiency.
5) Improve the enterprise R&D subsidy platform. The government should take the lead to create a more perfect enterprise R&D subsidy platform. More public announcements of government subsidy information will convey a positive signal mechanism for the market. Give certain signal guidance to industries with a slow return but great significance. Make the market actively promote the development of new technology industry and promote in-depth communication between the industry and market investors. It also broadens the financing channels of enterprises.
The original contributions presented in the study are included in the article/supplementary material, further inquiries can be directed to the corresponding authors.
All authors listed have made a substantial, direct, and intellectual contribution to the work and approved it for publication.
Thanks are extended to Patent Information Service Platform Network and China Stock Market and Accounting Research Database.
The authors declare that the research was conducted in the absence of any commercial or financial relationships that could be construed as a potential conflict of interest.
All claims expressed in this article are solely those of the authors and do not necessarily represent those of their affiliated organizations, or those of the publisher, the editors and the reviewers. Any product that may be evaluated in this article, or claim that may be made by its manufacturer, is not guaranteed or endorsed by the publisher.
Altuzarra, A. (2019). RD and patents: Is it a two-way street? Econ. Innovation New Technol. 28 (2), 180–196. doi:10.1080/10438599.2018.1449726
Bell, A., Fairbrother, M., and Jones, K. (2019). Fixed and random effects models: Making an informed choice. Qual. Quant. 53, 1051–1074. doi:10.1007/s11135-018-0802-x
Buravleva, Y. H., Tang, D., and Bethel, B. J. (2021). Incentivizing innovation: The causal role of government subsidies on lithium-ion battery research and development. Sustainability 13 (15), 8309. doi:10.3390/su13158309
Chen, K., Zhao, F., Hao, H., and Liu, Z. (2019). Selection of lithium-ion battery technologies for electric vehicles under China’s new energy vehicle credit regulation. Energy Procedia 158, 3038–3044. doi:10.1016/j.egypro.2019.01.987
Chepeliev, M., Hertel, T. W., and van der Mensbrugghe, D. (2022). Cutting Russia’s fossil fuel exports: Short-term pain for long-term gain. Available at: https://ssrn.com/abstract=4081300 or 10.2139/ssrn.4081300.
Chiappini, R., Montmartin, B., Sophie, P., and Demaria, S. (2022). Can direct innovation subsidies relax SMEs’ financial constraints? Res. Policy 51 (5), 104493. doi:10.1016/j.respol.2022.104493
Cui, Y., Liu, J. H., Han, X., Sun, S. H., and Cong, B. H. (2022). Full-scale experimental study on suppressing lithium-ion battery pack fires from electric vehicles. Fire Saf. J. 129, 103562. doi:10.1016/j.firesaf.2022.103562
Das, R. C. (2020). Interplays among R&D spending, patent and income growth: New empirical evidence from the panel of countries and groups. J. Innov. Entrep. 9, 18. doi:10.1186/s13731-020-00130-8
Fokaides, P. A. (2020). Cooperation of eu with Russia in the field of energy: A review. Curr. Sustain. Renew. Energy Rep. 7, 1–8. doi:10.1007/s40518-020-00145-5
Goncharuk, A., Liashenko-Shcherbakoba, V., and Chaika, N. (2021). The impact of the natural gas price on industrial performance during a hybrid war. Polityka Energetyczna –. Energy Policy J. 24 (4), 105–120. doi:10.33223/epj/144769
Hausman, J. A. (1978). Specification tests in econometrics. Econometrica 46 (6), 1251–1271. doi:10.2307/1913827
Helm, C., and Mier, M. (2021). Steering the energy transition in a world of intermittent electricity supply: Optimal subsidies and taxes for renewables and storage. J. Environ. Econ. Manag. 109, 102497. doi:10.1016/j.jeem.2021.102497
Hosseini, S. E. (2022). Transition away from fossil fuels toward renewables: Lessons from Russia-Ukraine crisis. fuen. 1 (1), 2–5. doi:10.55670/fpll.fuen.1.1.8
Keck, F., Lenzen, M., Vassallo, V. A., and Li, M. (2019). The impact of battery energy storage for renewable energy power grids in Australia. Energy 173, 647–657. doi:10.1016/j.energy.2019.02.053
Laribi, O., and Rudion, K. (2021). Optimized planning of distribution grids considering grid expansion, battery systems and dynamic curtailment. Energies 14 (17), 5242. doi:10.3390/en14175242
Li, J., Ku, Y., Liu, C., and Zhou, Y. (2020). Dual credit policy: Promoting new energy vehicles with battery recycling in a competitive environment? J. Clean. Prod. 243, 118456. doi:10.1016/j.jclepro.2019.118456
Liang, S. X. (2015). Normalizing the causality between time series. Phys. Rev. E 92 (02), 022126. doi:10.1103/physreve.92.022126
Liang, X. S. (2014). Unraveling the cause-effect relation between time series. Phys. Rev. E 90, 052150. doi:10.1103/physreve.90.052150
Lin, B., and Luan, R. (2020). Are government subsidies effective in improving innovation efficiency? Based on the research of China’s wind power industry. Sci. Total Environ. 710, 136339. doi:10.1016/j.scitotenv.2019.136339
Liu, W. Q., Liu, W., Li, X. X., Liu, Y. Y., Ogunmoroti, A. E., Li, M. Y., et al. (2021). Dynamic material flow analysis of critical metals for lithium-ion battery system in China from 2000-2018. Resour. Conservation Recycl. 164, 105122. doi:10.1016/j.resconrec.2020.105122
Loukatou, A., Johnson, P. V., Howell, S., and Duck, P. (2020). Optimal valuation of wind energy projects co-located with battery storage. Appl. Energy 283 (9), 116247. doi:10.1016/j.apenergy.2020.116247
Mikulski, S., and Tomczewski, A. (2021). Use of energy storage to reduce transmission losses in meshed power distribution networks. Energies 14 (21), 7304. doi:10.3390/en14217304
Mišík, M. (2022). The EU needs to improve its external energy security. Energy Policy 165, 112930. doi:10.1016/j.enpol.2022.112930
Mora, C. A., Montoya, O. D., and Trujillo, E. R. (2020). Mixed-integer programming model for transmission network expansion planning with battery energy storage systems (BESS). Energies 13 (17), 4386. doi:10.3390/en13174386
Moy, K., Lee, S. B., Harris, S., and Onori, S. (2021). Design and validation of synthetic duty cycles for grid energy storage dispatch using lithium-ion batteries. Adv. Appl. Energy 4 (19), 100065. doi:10.1016/j.adapen.2021.100065
Olabi, A., Adil, M., Sayed, E. T., Iqbal, A., Rodriguez, C., and Abdelkareem, M. A. (2022b). Lithium-ion batteries. Encycl. Smart Mater. 2, 93–105. doi:10.1016/B978-0-12-815732-9.00057-7
Olabi, A., Wilberforce, T., Sayed, E. W. T., Abo-Khalil, A. G., Maghrabie, H. M., Elsaid, K., et al. (2022a12398). Battery energy storage systems and SWOT (strengths, weakness, opportunities, and threats) analysis of batteries in power transmission. Energy 254. doi:10.1016/j.energy.2022.123987
Ozili, P. K. (2022). Global economic consequence of Russian invasion of Ukraine. SSRN J. doi:10.2139/ssrn.4064770
Peng, L., and Li, Y. (2022). Policy evolution and intensity evaluation of the Chinese new energy vehicle industry policy: The angle of the dual-credit policy. World Electr. Veh. J. 13 (5), 90. doi:10.3390/wevj13050090
Pu, G., Zhu, X., Dai, J., and Chen, X. (2022). Understand technological innovation investment performance: Evolution of industry-university-research cooperation for technological innovation of lithium-ion storage battery in China. J. Energy Storage 46, 103607. doi:10.1016/j.est.2021.103607
Ratner, S. V., Krustalev, E. Y., Larin, S. N., and Krustalev, O. E. (2019). Does the development of renewable energy and smart grids pose risks for Russian gas projects? Scenario forecast for partner countries. Int. J. Energy Econ. Policy 10 (1), 286–293. doi:10.32479/ijeep.8627
Rodríguez-Fernández, L., Carvajal, A. B. F., and Ruiz-Gómez, L. M. (2020). Evolution of European Union’s energy security in gas supply during Russia-Ukraine gas crises (2006–2009). Energy Strategy Rev. 30, 100518. doi:10.1016/j.esr.2020.100518
Santoleri, P., Mina, A., Di Minin, A., and Martelli, I., 2020: The causal effects of R&D grants: Evidence from a regression discontinuity. Available at. doi:10.2139/ssrn.3637867
Scott, S., and Ireland, R. (2020). Lithium-ion battery materials for electric vehicles and their global value chains. Office of Industries Working Paper ID-068. 2020. Available at: https://www.usitc.gov/publications/332/working_papers/gvc_overview_scott_ireland_508_final_061120.pdf (accessed February 22, 2022).
Shen, C., and Wang, H. (2019). “Research on the technological development of lithium ion battery industry in China,” in Journal of physics: Conference series, 1347, XV international Russian-Chinese symposium “new materials and technologies” (Beijing: Sochi, Russian Federation). 16 – 19, October, 2019.
Šimić, Z., Topić, D., Knežević, G., and Pelin, D. (2021). Battery energy storage technologies overview. Int. J. Electr. Comput. Eng. Syst. 12 (1), 53–65. doi:10.32985/ijeces.12.1.6
Stančík, A., Osička, J., and Overland, I. (2021). Villain or victim? Framing strategies and legitimation practices in the Russian perspective on the European union’s third energy package. Energy Res. Soc. Sci. 74, 101962. doi:10.1016/j.erss.2021.101962
Stulberg, A. (2017). Natural gas and the Russia-Ukraine crisis: Strategic restraint and the emerging Europe-Eurasia gas network. Energy Res. Soc. Sci. 24, 71–85. doi:10.1016/j.erss.2016.12.017
Su, C., Hkan, K., Umar, M., and Zhang, Z. (2021). Does renewable energy redefine geopolitical risks? Energy Policy 158 (6), 112566. doi:10.1016/j.enpol.2021.112566
Sun, W., Yin, K., and Liu, Z. (2021). Tax incentives, R&D manipulation, and corporate innovation performance: Evidence from listed companies in China. Sustainability 13 (21), 11819. doi:10.3390/su132111819
Sung, B. (2019). Do government subsidies promote firm-level innovation? Evidence from the Korean renewable energy technology industry. Energy Policy 132, 1333–1344. doi:10.1016/j.enpol.2019.03.009
Vestikas, A., and Stamboulis, Y. (2017). “R&D expenditure, Patents and Economic Growth: Causality evidence from ten innovative countries,” in 29th annual EAEPE conference (Budapest: Corvinus University). 19 – 21, October, 2017.
Xue, F., Feng, X., and Liu, J. (2021). Influencing factors of new energy development in China: Based on ARDL cointegration and granger causality analysis. Front. Energy Res. 9, 718565. doi:10.3389/fenrg.2021.718565
Yang, X. L., He, L. Y., Xia, Y. F., and Chen, Y. F. (2019). Effect of government subsidies on renewable energy investments: The threshold effect. Energy Policy 132, 156–166. doi:10.1016/j.enpol.2019.05.039
Yu, F., Guo, Y., Le-Nguyen, K., Barnes, S. J., and Zhang, W. (2016). The impact of government subsidies and enterprises’ R&D investment: A panel data study from renewable energy in China. Energy Policy 89, 106–113. doi:10.1016/j.enpol.2015.11.009
Yu, W. H., Shang, Z., Zhang, Y. C., and Xu, S. M. (2022). A review on comprehensive recycling of spent power lithium-ion battery in China. eTransportation 11, 100155. doi:10.1016/j.etran.2022.100155
Yusta, J. M., and Beyza, J. (2021). Optimal cooperative model for the security of gas supply on European gas networks. Energy Strategy Rev. 38 (11), 100706. doi:10.1016/j.esr.2021.100706
Keywords: lithium-ion batteries, governmental subsidies, Hausman test, information flow, OLS regression
Citation: Wu G, Buravleva Y, Wu J, Li Y, Tang D and Bethel BJ (2022) Investigating the effect of government subsidies on enterprise research and development. Front. Environ. Sci. 10:964528. doi: 10.3389/fenvs.2022.964528
Received: 08 June 2022; Accepted: 18 August 2022;
Published: 13 September 2022.
Edited by:
Mihaela Simionescu, Romanian Academy, RomaniaReviewed by:
Magdalena Radulescu, University of Pitesti, RomaniaCopyright © 2022 Wu, Buravleva, Wu, Li, Tang and Bethel. This is an open-access article distributed under the terms of the Creative Commons Attribution License (CC BY). The use, distribution or reproduction in other forums is permitted, provided the original author(s) and the copyright owner(s) are credited and that the original publication in this journal is cited, in accordance with accepted academic practice. No use, distribution or reproduction is permitted which does not comply with these terms.
*Correspondence: Jing Wu, anNnZXd1QHNpbmEuY29t; Yi Li, dG9sdW50b0AxMjYuY29t
Disclaimer: All claims expressed in this article are solely those of the authors and do not necessarily represent those of their affiliated organizations, or those of the publisher, the editors and the reviewers. Any product that may be evaluated in this article or claim that may be made by its manufacturer is not guaranteed or endorsed by the publisher.
Research integrity at Frontiers
Learn more about the work of our research integrity team to safeguard the quality of each article we publish.