 Javed Ahmed Memon
 Minhaj Ali
 Yukun Wang1
- 1School of Economics and Management, Yanshan University Qinhuangdao, Qinhuangdao, China
- 2Department of Economics, The Islamia University of Bahawalpur, Bahawalpur, Pakistan
This paper offers a new indulgence to the present literature by integrating the role of fiscal decentralization (FD) in affecting ecological footprint (EF). So, this study considered the effect of FD on EF in the existence of energy consumption (EC), technological innovation (TI), gross domestic product (GDP), and trade openness (TOP) from 1990 to 2018 in Pakistan. We employ econometric methods like Bayer & Hanck cointegration, fully modified ordinary least squares, dynamic ordinary least squares, and canonical cointegration regression for empirical analysis. Moreover, the frequency domain causality test is used to conclude the causal impact of FD, EC, TI, GDP, and TOP on EF. The regression results disclose that EC, GDP, and TOP boost EF in Pakistan; however, FD and TI promote the sustainability of the environment by reducing EF. Besides, the frequency causality outcomes indicate that FD, EC, TI, GDP, and TOP have insinuations for EF in the long term. As a policy recommendation, this research suggests that Pakistan could successfully integrate strategies to increase ecological quality by allowing the lower level of government to utilize eco-friendly technological innovations.
1 Introduction
Since the World Earth Summit in Kyoto, Japan, in 1997, developing a sustainable atmosphere has become a major global concern. The meeting emphasized the importance of protecting our earth from worldwide environmental catastrophe. Roughly 80% of the planet’s population resides in a nation that is beset by significant environmental challenges. Due to substantial economic advancement and affluence, human living requirements and well-being have soared substantially in recent generations (Majeed et al., 2021; Adebayo, 2022a; Adebayo et al., 2022; Ali et al., 2022; Kirikkaleli et al., 2022). This stresses the ecosystem, leading to pollution, biodiversity deterioration, and environmental disparity (Ahmed & Wang, 2019). As a result, developing and attaining long-term environmental goals has risen to the pinnacle of the critical global list.
Among these initiatives, some authorities and academics think fiscal decentralization (FD) is an impactful way to reduce emissions; they argue that FD can stimulate a “race to the top” between local authorities by creating greater ecological guidelines in order to generate eco-friendly environments and, as a result, less pollution in damaged regions (Mu, 2018; Chen and Chang, 2020). However, in current years, there has been an emergent risk of the influence of FD on environmental performance (Khan et al., 2021). Advocates of this viewpoint assume that FD will precipitate a “race to the bottom” wherein local authorities will reduce their environmental guidelines in order to draw foreign businesses, thereby increasing pollution. These conflicting findings have caught the attraction of academics in the link between FD and environmental sustainability.
Therefore, the research’s main goal is to examine the impact of FD on environmental sustainability in Pakistan. Decentralization in Pakistan looks to be regarded as either a curse or a cure or an augmentation to the nation’s already massive pressures or a remedy for all wrongs (Shahzad and Younus 2018). Pakistan is an Islamic country ruled by the 1973s Constitution of Pakistan. The national government accumulates the majority of the nation’s earnings and then redistributes it among the various governmental strands of national and provincial administrations to rectify both horizontal and vertical fiscal imbalances. According to the 1973 constitution, the National Finance Commission (NFC) creates prudent and honest resource allocation decisions between the national and provincial authorities (Asghar, 2016). Nevertheless, the NFC did not always deliver indisputable grants, and the fiscal resource allocation process did not always perform admirably. Pakistan, on the other side, is presently experiencing macroeconomic imbalances, as well as a current account deficit, rising unemployment, and rising prices. Under these circumstances, efficient FD is anticipated to be a productive tool for achieving long-term economic development, macroeconomic consistency, and enhanced environmental conservation.
This study gives a fresh perspective on FD and environmental sustainability in the case of Pakistan. To the best of our understanding, there appears to be a research discrepancy in the context of Pakistan. Notwithstanding the study of Li et al. (2021), this study employed ecological footprint (EF) as an alternative to ecological performance. Due to the widespread use of carbon dioxide (CO2) emissions as a measure, the existing literature has been criticized for neglecting to grasp all facets of a sustainable environment. This indicator has recently been called into the discussion because it is not inclusive, as the individual’s effect on the atmosphere is not studied. As a result, the emphasis has shifted to EF as an advanced measure (Charfeddine & Mrabet, 2017; Bello et al., 2018; Alola et al., 2019; Chunling et al., 2021). The EF integrates the two principles to confront the harm triggered instigated by human actions on the ground level as well as the destruction caused by unsolicited usage of all of the earth’s natural resources (Zahra & Badeeb 2022). Likewise, the current investigation also provides a deeper understanding of the roles of TI, GL, and GDP as substantial factors of EF. Besides, by applying contemporary time-series estimation methodologies to explore the impact of FD on EF, this research specifically adds to the literature. Furthermore, policymakers, climate activists, and public representatives will benefit from the study’s findings, which offer better knowledge as well as vital information, effects, and proof of ecological safety.
The subsequent section covers the theoretical model, data, and methods. The third section discusses the outcomes founded on the methods employed. The last section designates the conclusion and prospect policy outline.
2 Theoretical model, data, and methods
2.1 Theoretical framework and model
To study the effect of FD on EF in the presence of control factors like EC, TI, GDP, and TOP during 1990–2018, the empirical equation is exhibited as:
where EF shows ecological footprint, FD is fiscal decentralization, EC denotes energy consumption, TI means technological innovation, GDP stands for gross domestic product, and TOP signifies trade openness. Ln demonstrates the natural log,
FD increases the adequate allocation of confined resources by lowering the expense of providing local public products and improving the effectiveness of government spending. Local authorities may offer more beneficial public facilities with the incisive benefit of local desires under the FD mechanism. There are two distinct perspectives on FD that influence the atmosphere. The first one is the race to the top strategy, and the second is the race to the bottom strategy (Ji et al., 2021). The race to the top strategy encourages FD in the system, which helps to regulate or cut pollution levels in the environment. Besides, this process expedites sustainable development by strengthening economic performance, better utilization of fiscal resources, robust institutional performance, and normalization of environmental degradation externalities. Focusing on this strategy, FD is anticipated to have an adverse effect on EF,
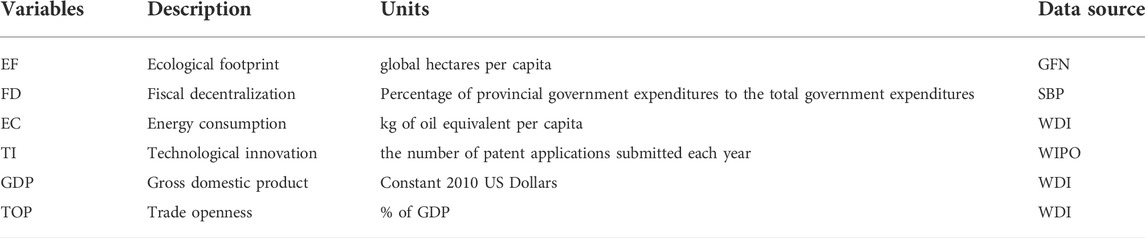
TABLE 1. Data description.
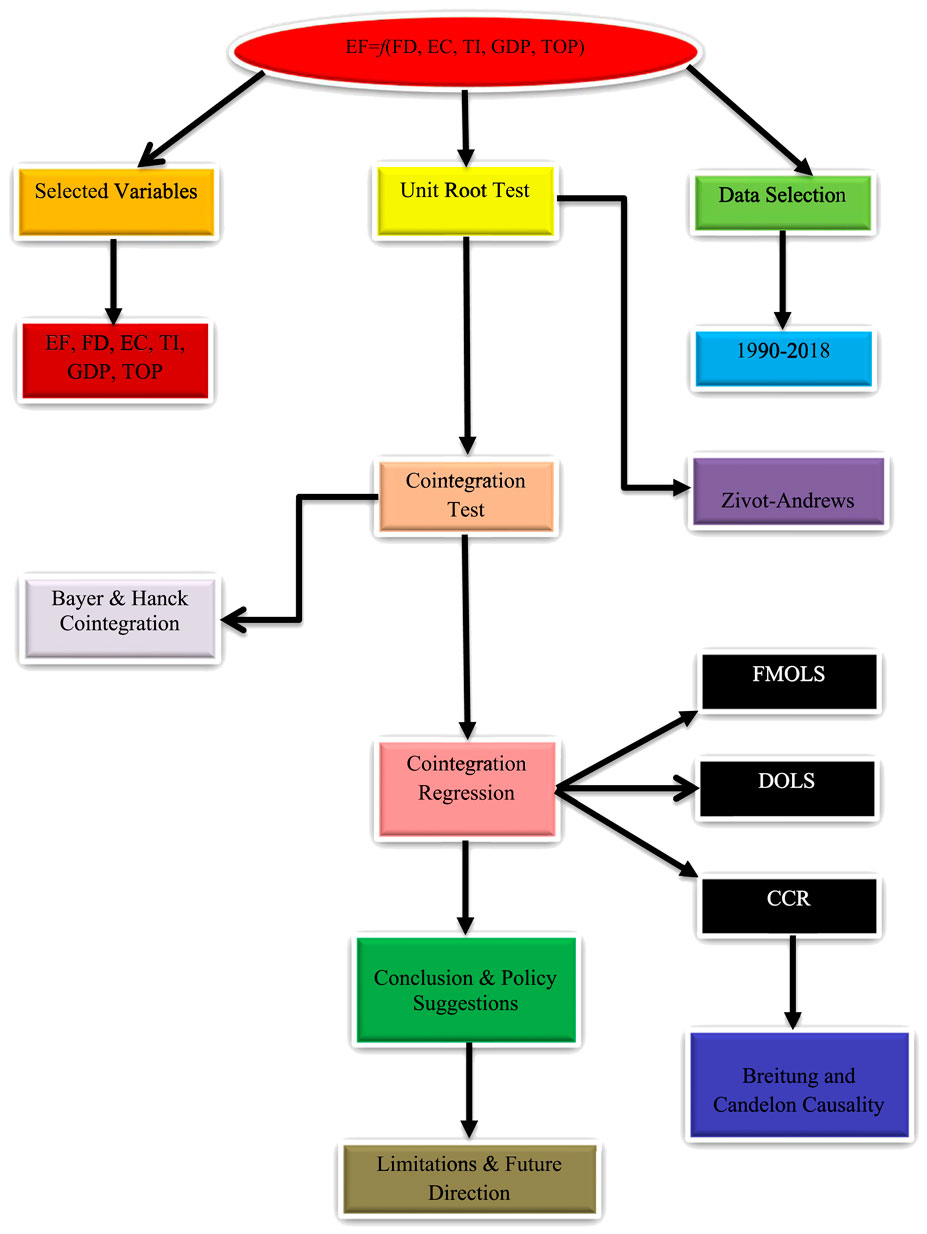
FIGURE 1. Flow diagram of the analysis.
2.2 Methodologies
2.2.1 Unit root test
Before a cointegration process is conducted, the sequence of the integration must often be acknowledged by probing the unit root test. The global transition occurs during our study period, resulting in structural breaks. Unit root indicators that do not correspond to structural breaks may produce unsatisfactory outcomes. Hence, the Zivot and Andrews (2002) unit root technique is used to evaluate the stationary attributes of the variables and single structural breaks. The Zivot and Andrews unit root approach is superior to others because it considers structural breaks when evaluating the stationarity level.
2.2.2 Cointegration test
Bayer & Hanck’s (2013) procedure is applied following the stationarity affirmation to examine the cointegration association between the study elements. By combining several different test results, such as those of Engle and Granger (1987), Johansen (1991), Peter Boswijk (1994), and Banerjee et al. (1998), this newly customized cointegration approach offers a more proper findings. The following are Fisher’s calculations for the Bayer & Hanck strategy:
The possible scores for each of the aforementioned cointegration tests are
2.2.3 Long-run estimates
To detect the long-run influence of FD on EF in Pakistan, with EC, TI, GDP, and TOP as controlled variables. We use the fully modified ordinary least square (FMOLS), dynamic ordinary least square (DOLS), and canonical cointegration regression (CCR) techniques correspondingly. Phillips and Hansen (1990) developed the semi-parametric technique FMOLS to address the correlation issue, emphasizing that the approach is completely impartial and reliable asymptotically. Likewise, CCR, a process equivalent to FMOLS founded by Park (1992), is exploited to probe cointegration patterns in a sequence in which the sequence of the stationarity is I (1). The main difference between the FMOLS and CCR approximation strategies is that the FMOLS tends to focus on both data and variable transition. In contrast, the CCR centres on data modification (Wu et al., 2018). The DOLS procedure incorporates leads and lags to compensate for simultaneity and tiny sample bigotry. Both DOLS and FMOLS methodologies address the issue of endogeneity and serial correlation by interacting with disorderly parameters (Yildirim & Orman, 2018).
2.2.4 Breitung and Candelon causality
In addition, to check the causal effects of FD on Pakistan’s EF and other factors at various frequency ranges. The frequency-domain causality test of Breitung and Candelon (2006) is utilized in this research. This methodology is built on primary investigation conducted by Geweke (1982) and Hosoya (1991). The decisive difference between time-domain and frequency-domain strategies, according to Odugbesan and Adebayo (2020), is that the time-domain approach uncovers a certain change within a time set, while the frequency-domain procedure embodies the density of distinctive adjustments inside a time sequence (Ali & Kirikkaleli, 2021).
3 Results and discussions
This paper intends to study the effects of FD on Pakistan’s environmental sustainability. As a first stage in estimating the model, the stationarity attributes of the data are examined by employing the Zivot and Andrews test for unit root. The unit root process has been used to determine a series of stationary factors resembling a structural break. As can be seen in Table 2, the unit root approach shows that none of the factors are stationary at the level. Besides, after the first difference, all of the elements become stationary.
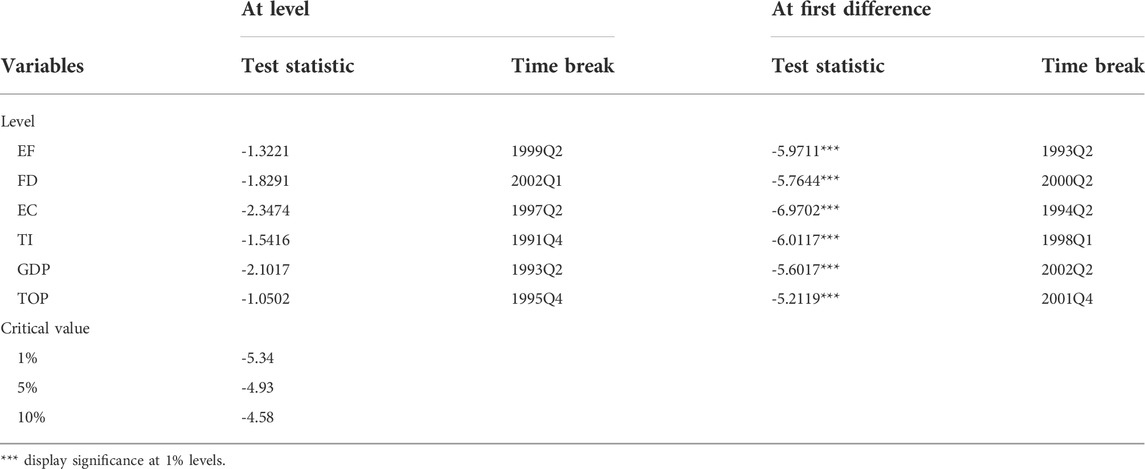
TABLE 2. Unit root test results.
The current study also uncovers the cointegration properties of parameters by utilizing the combined Bayer and Hanck cointegration test. Table 3 summarises the Bayer and Hanck test’s findings. At the 5% significance level, the outcomes specify that long-term cointegration continues between EF, FD, EC, TI, GDP, and TOP.
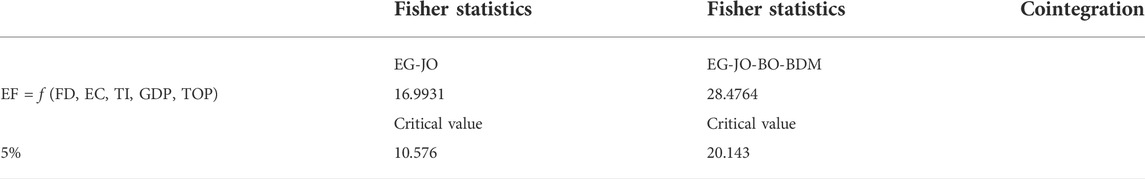
TABLE 3. Results of bayer and hanck cointegration.
Results from Table 4 denote that FD reduces EF by 0.182% in FMOLS, 0.195% in DOLS, and 0.188% in CCR. It infers that many ecological safety recommendations, like fiscal expenditures and environmental expenditures, are also executed through FD. According to the results, FD is linked with much more optimized and efficient monetary and fiscal practices, which may improve atmosphere sustainability via committed legitimacy. Wang & Lei (2016) contended that better FD enhances the ecological atmosphere because local authorities can devote more capably than the federal government due to the data benefit. These outcomes are analogous to those of Tufail et al. (2021) and Yuan et al. (2022). Overall, present estimates indicate that FD can be utilized as a productive tool to reduce EF. The empirical findings of the study show that FD decentralisation enhances ecological quality. Therefore, for ecological sustainability, a higher level of FD is necessary. As a result, it is crucial to explain roles at various stages of authority to attain the goal of lower pollution successfully.
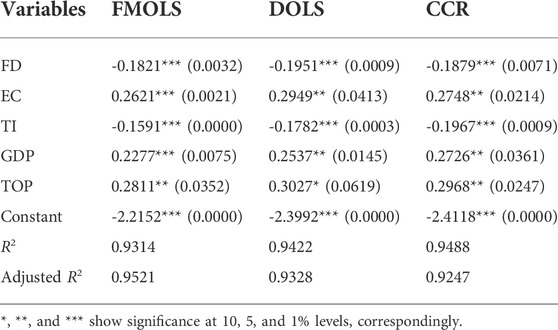
TABLE 4. Long-run results.
As per the EC outcomes, a 1% increase in EC raises EF by 0.262, 0.295, and 0.275%, respectively. Energy creation from fossil resources noticeably worsens environmental performance in Pakistan by raising pollution. Our findings are akin to those of Yang et al. (2021) and Shabir et al. (2022). It is hard to ignore the use of energy for a higher quality atmosphere because it is a necessary component of economic progression. Economic evolution raises the energy requirements by establishing new industries or expanding established ones, resulting in a rise in the country’s pollution levels. Besides this, there is an urgent consideration to establish clean and advanced energy sources in order to reduce pollution without negatively impacting the ecosystem or economic progress.
The coefficient values of TI had a negative indication, implying a pollution-mitigation impact. A 1% rise in TI substantially lowers EF by 0.159, 0.178, and 0.197%, respectively. Implementing eco-friendly, greener technologies to increase energy efficiency is the most effective way to address environmental contamination. Environmental innovation is a strategy for promoting economic expansion and advancement while preventing ecological deterioration and biodiversity loss. Numerous empirical investigations have found that energy technology advancement is shifting toward greener and more innovative energy sources (Du et al., 2019). Similarly, Cantner et al. (2019) have revealed that factories and government entities are now creating significant financing for research and development to obtain workable remedies in sustainable and clean energy to acquire greener economic development and the atmosphere. Our findings undermine the conclusions of Chunling et al. (2021) and Awosusi et al. (2022), who contended that TI utilizes energy sources to strengthen economic operations, which increases rather than decreases EF.
Table 4 also demonstrates that a 1% augmentation in GDP will lead to a 0.228, 0.254, and 0.273%, respectively, rise in EF. This demonstrates how growing GDP is preceded by surging EF in Pakistan. It must be mentioned that an expansion in a nation’s GDP amplifies a powerful push on the atmosphere, and ongoing and inadequate consumption of natural resources in a region further damages environmental protection. So, the rate of EF will ultimately surge. This indicates that as the GDP upswings, countries will move their concentration to more industries, further hovering demand for high energy usage. Because of the high demand for consumption, the industry’s use of nonrenewable energy is increasing. This type of energy usage is hazardous and inevitably raises the level of EF. The outcomes corroborate those of Kalmaz and Kirikkaleli (2019), Ji et al. (2021), Abid et al. (2022), and Akadiri et al. (2022).
Furthermore, at a 1% statistical level, TOP is positively connected to EF. The value of TOP denotes that a one percent rise in TOP raises EF by 0.281, 0.303, and 0.297%, respectively. The TOP outcomes are consistent with the findings of Danish et al. (2018) and Hashmi et al. (2020); they affirm the authenticity of a substantial relationship between TOP and environmental quality. The results revealed that the level of economic advancement is spreading due to the scale effect, which may exacerbate environmental pollution. The manufacturing of pollution-intensive goods causes more pollution. In recent times, the investigation of driving force has confirmed that trade density is the main factor in expanding emissions events (Wu et al., 2005).
A frequency-domain causality technique is utilized in this paper to assess the causal association among variables (see Table 5). The outcomes show that FD, TI, and TOP emit EF in the long term. Besides, EC and GDP contribute to EF in both the long and medium term. Hence, any policy change in FD, EC, TI, GDP, or TOP has aftermaths for EF in the long term. Similarly, any plan modification in EC and GDP also affects EF in the medium term.
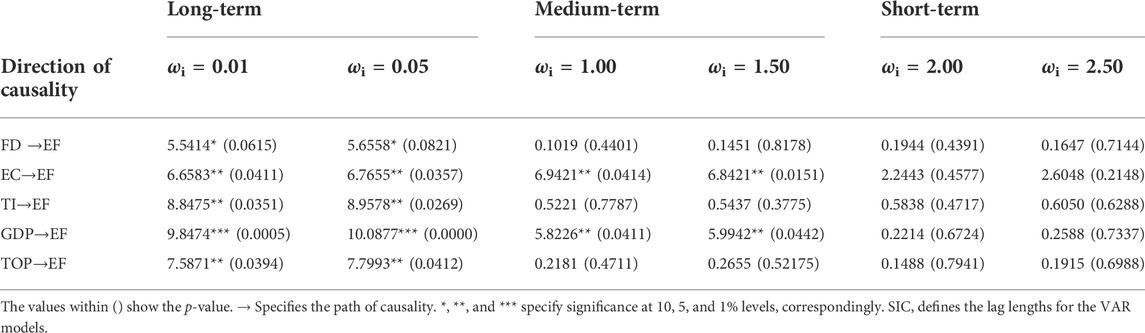
TABLE 5. Results of Frequency domain causality test.
4 Conclusion and policy recommendations
Given the ongoing dialogue over the reasons for environmental deterioration, this paper backs to the present literature by probing the effect of FD on the EF in the existence of EC, TI, GDP, and TOP in the case of Pakistan from 1990 to 2018. The econometric strategies provide significant results: i) all parameters are integrated to the same order of I (1); ii) long term cointegrating associations exist among variables; iii) FD and other control variables such as EC, TI, GDP, and TOP are crucial elements in the context of ecological footprint; iv) an increase in FD, and TI decrease EF in Pakistan; v) EC, GDP, and TOP are unfavorable for environmental performance; vi) there is confirmation of a long term causality between FD and EF, EC and EF, TI and EF, GDP and EF, TOP and EF.
Regarding policy concerns, this research implies that Pakistan could effectively incorporate policies to boost ecological performance by permitting a lower level of government. As a result, confirmation of duties at various stages of government is required to attain the energy-saving capabilities of fiscal spending. Moreover, an enhancement in technological innovation can help reduce ecological footprint efficiently; therefore, it is essential to pay attention to environment-conscious, highly developed innovations that transform economic development contributing factors aside from nonrenewable energies and toward green and clean energy sources. These eco-friendly developments have far-reaching ramifications for the environment and climate change. Besides that, economic structures in Pakistan must be amended to promote innovation.
Future work on Pakistan should concentrate on other combinations of accessible factors relating to fiscal decentralization and environmental quality. In addition, in the case of Pakistan, the future could also concentrate on determining the threshold level of FD that optimizes economic development. Another issue is that we only utilized Pakistan as a test example. In the upcoming investigation, the study’s results can be applied to different groups of nations, like the G20.
Author contributions
All authors listed have made a substantial, direct, and intellectual contribution to the work and approved it for publication.
Conflict of interest
The authors declare that the research was conducted in the absence of any commercial or financial relationships that could be construed as a potential conflict of interest.
Publisher’s note
All claims expressed in this article are solely those of the authors and do not necessarily represent those of their affiliated organizations, or those of the publisher, the editors and the reviewers. Any product that may be evaluated in this article, or claim that may be made by its manufacturer, is not guaranteed or endorsed by the publisher.
References
Abid, M., sakrafi, H., Gheraia, Z., and Abdelli, H. (2022). Does renewable energy consumption affect ecological footprints in Saudi arabia? A bootstrap causality test. Renew. Energy 189, 813–821. doi:10.1016/j.renene.2022.03.043
Adebayo, T. S., AbdulKareem, H. K. K., BilalKirikkaleli, D., Shah, M. I., and Abbas, S. (2022). CO2 behavior amidst the COVID-19 pandemic in the United Kingdom: The role of renewable and non-renewable energy development. Renew. Energy 189, 492–501. doi:10.1016/j.renene.2022.02.111
Adebayo, T. S. (2022a). Renewable energy consumption and environmental sustainability in Canada: Does political stability make a difference? Environ. Sci. Pollut. Res. Int., 1–16. doi:10.1007/s11356-022-20008-4
Adebayo, T. S., Oladipupo, S. D., Rjoub, H., Kirikkaleli, D., and Adeshola, I. (2022b). Environmental consequences of fossil fuel in Spain amidst renewable energy consumption: A new insights from the wavelet-based granger causality approach. Int. J. Sustain. Dev. World Ecol., 1–14. doi:10.1080/13504509.2022.2054877
Ahmed, Z., and Wang, Z. (2019). Investigating the impact of human capital on the ecological footprint in India: An empirical analysis. Environ. Sci. Pollut. Res. 26 (26), 26782–26796. doi:10.1007/s11356-019-05911-7
Akadiri, S. S., Adebayo, T. S., Asuzu, O. C., Onuogu, I. C., and Oji-Okoro, I. (2022). Testing the role of economic complexity on the ecological footprint in China: A nonparametric causality-in-quantiles approach. Energy & Environ., 0958305X221094573. doi:10.1177/0958305X221094573
Ali, M., and Kirikkaleli, D. (2021). The asymmetric effect of renewable energy and trade on consumption-based CO2 emissions: The case of Italy. Integr. Environ. Assess. Manag. 18, 784–795. doi:10.1002/ieam.4516
Ali, M., Kirikkaleli, D., Sharma, R., and Altuntaş, M. (2022). The nexus between remittances , natural resources , technological innovation , economic growth , and environmental sustainability in Pakistan. Environ. Sci. Pollut. Res. Int., 0123456789. doi:10.1007/s11356-022-21228-4
Alola, A. A., Bekun, F. V., and Sarkodie, S. A. (2019). Dynamic impact of trade policy, economic growth, fertility rate, renewable and nonrenewable energy consumption on ecological footprint in Europe. Sci. Total Environ. 685, 702–709. doi:10.1016/j.scitotenv.2019.05.139
Antweiler, W., Copeland, B. R., and Taylor, M. S. (2001). Is free trade good for the environment? Am. Econ. Rev. 91 (4), 877–908. doi:10.1257/aer.91.4.877
Asghar, N. (2016). Interrelationship between foreign aid, fiscal decentralization and economic growth in Pakistan: An econometric analysis. J. Political Stud. 23 (2), 525.
Awosusi, A. A., Adebayo, T. S., Kirikkaleli, D., and Altuntaş, M. (2022). Role of technological innovation and globalization in BRICS economies: Policy towards environmental sustainability. Int. J. Sustain. Dev. World Ecol., 1–18. doi:10.1080/13504509.2022.2059032
Banerjee, A., Dolado, J. J., and Mestre, R. (1998). Error-correction mechanism tests for cointegration in a single-equation framework. J. Time Ser. Anal. 19 (3), 267–283. doi:10.1111/1467-9892.00091
Bayer, C., and Hanck, C. (2013). Combining non-cointegration tests. J. Time Ser. Anal. 34 (1), 83–95. doi:10.1111/j.1467-9892.2012.00814.x
Bello, M. O., Solarin, S. A., and Yen, Y. Y. (2018). The impact of electricity consumption on CO2 emission, carbon footprint, water footprint and ecological footprint: The role of hydropower in an emerging economy. J. Environ. Manag. 219, 218–230. doi:10.1016/j.jenvman.2018.04.101
Breitung, J., and Candelon, B. (2006). Testing for short- and long-run causality: A frequency-domain approach. J. Econ. 132 (2), 363–378. doi:10.1016/j.jeconom.2005.02.004
Cantner, U., Dettmann, E., Giebler, A., Guenther, J., and Kristalova, M. (2019). The impact of innovation and innovation subsidies on economic development in German regions. Reg. Stud. 53 (9), 1284–1295. doi:10.1080/00343404.2019.1639656
Charfeddine, L., and Mrabet, Z. (2017). The impact of economic development and social-political factors on ecological footprint: A panel data analysis for 15 mena countries. Renew. Sustain. Energy Rev. 76, 138–154. doi:10.1016/j.rser.2017.03.031
Chen, X., and Chang, C. P. (2020). Fiscal decentralization, environmental regulation, and pollution: A spatial investigation. Environ. Sci. Pollut. Res. 27 (25), 31946–31968. doi:10.1007/s11356-020-09522-5
Chunling, L., Memon, J. A., Le Thanh, T., Ali, M., and Kirikkaleli, D. (2021). The impact of public-private partnership investment in energy and technological innovation on ecological footprint: The case of Pakistan. Sustainability 13 (18), 10085. doi:10.3390/su131810085
Danish, , , Wang, B., and Wang, Z. (2018). Imported technology and CO2 emission in China: Collecting evidence through bound testing and VECM approach. Renew. Sustain. Energy Rev. 82, 4204–4214. doi:10.1016/j.rser.2017.11.002
Du, K., Li, P., and Yan, Z. (2019). Do green technology innovations contribute to carbon dioxide emission reduction? Empirical evidence from patent data. Technol. Forecast. Soc. Change 146, 297–303. doi:10.1016/j.techfore.2019.06.010
Engle, R. F., and Granger, C. W. (1987). Co-Integration and error correction: Representation, estimation, and testing. Econometrica 55, 251–276. doi:10.2307/1913236
Fan, H., Hashmi, S. H., Habib, Y., and Ali, M. (2020). How do urbanization and urban agglomeration affect CO2Emissions in south asia? Testing non-linearity puzzle with dynamic STIRPAT model. Chn. J. Urb. Environ. Stud. 8 (1), 2050003. doi:10.1142/S2345748120500037
Fareed, Z., Rehman, M. A., Adebayo, T. S., Wang, Y., Ahmad, M., and Shahzad, F. (2022). Financial inclusion and the environmental deterioration in Eurozone: The moderating role of innovation activity. Technol. Soc. 69, 101961. doi:10.1016/j.techsoc.2022.101961
Geweke, J. (1982). Measurement of linear dependence and feedback between multiple time series. J. Am. Stat. Assoc. 77 (378), 304–313. doi:10.1080/01621459.1982.10477803
Hashmi, S. H., Hongzhong, F., Fareed, Z., and Bannya, R. (2020). Testing non-linear nexus between service sector and CO2 emissions in Pakistan. Energies 13 (3), 526. doi:10.3390/en13030526
Hosoya, Y. (1991). The decomposition and measurement of the interdependency between second-order stationary processes. Probab. Theory Relat. Fields 88 (4), 429–444. doi:10.1007/BF01192551
Ji, X., Umar, M., Ali, S., Ali, W., Tang, K., and Khan, Z. (2021). Does fiscal decentralization and eco-innovation promote sustainable environment? A case study of selected fiscally decentralized countries. Sustain. Dev. 29 (1), 79–88. doi:10.1002/sd.2132
Johansen, S. (1991). Estimation and hypothesis testing of cointegration vectors in Gaussian vector autoregressive models. Econometrica 59 (6), 1551. doi:10.2307/2938278
Kalmaz, D. B., and Kirikkaleli, D. (2019). Modeling CO 2 emissions in an emerging market: Empirical finding from ARDL-based bounds and wavelet coherence approaches. Environ. Sci. Pollut. Res. 26 (5), 5210–5220. doi:10.1007/s11356-018-3920-z
Khan, Z., Ali, S., Dong, K., and Li, R. Y. M. (2021). How does fiscal decentralization affect CO2 emissions? The roles of institutions and human capital. Energy Econ. 94, 105060. doi:10.1016/j.eneco.2020.105060
Kirikkaleli, D., Ali, M., and Altuntaş, M. (2022). Environmental sustainability and public–private partnerships investment in energy in Bangladesh. Environ. Sci. Pollut. Res. Int., 0123456789. doi:10.1007/s11356-022-19771-1
Li, X., Younas, M. Z., Andlib, Z., Ullah, S., Sohail, S., and Hafeez, M. (2021). Examining the asymmetric effects of Pakistan's fiscal decentralization on economic growth and environmental quality. Environ. Sci. Pollut. Res. 28 (5), 5666–5681. doi:10.1007/s11356-020-10876-z
Majeed, M. T., Tauqir, A., Mazhar, M., and Samreen, I. (2021). Asymmetric effects of energy consumption and economic growth on ecological footprint: New evidence from Pakistan. Environ. Sci. Pollut. Res. 28 (25), 32945–32961. doi:10.1007/s11356-021-13130-2
Mu, R. (2018). Bounded rationality in the developmental trajectory of environmental target policy in China, 1972-2016. Sustain. Switz. 10 (1), 199. doi:10.3390/su10010199
Odugbesan, J. A., and Adebayo, T. S. (2020). The symmetrical and asymmetrical effects of foreign direct investment and financial development on carbon emission: Evidence from Nigeria. SN Appl. Sci. 2 (12), 1982. doi:10.1007/s42452-020-03817-5
Park, J. Y. (1992). Canonical cointegrating regressions. Econometrica 60 (1), 119. doi:10.2307/2951679
Peter Boswijk, H. (1994). Testing for an unstable root in conditional and structural error correction models. J. Econ. 63 (1), 37–60. doi:10.1016/0304-4076(93)01560-9
Phillips, P. C. B., and Hansen, B. E. (1990). Statistical inference in instrumental variables regression with i(1) processes. Rev. Econ. Stud. 57, 99. doi:10.2307/2297545
Qayyum, M., Ali, M., Nizamani, M. M., Li, S., Yu, Y., and Jahanger, A. (2021). Nexus between financial development, renewable energy consumption, technological innovations and CO2 emissions: The case of India. Energies 14 (15), 4505. doi:10.3390/en14154505
Qayyum, M., Yu, Y., Nizamani, M. M., Raza, S., Ali, M., and Li, S. (2022). Financial instability and CO2 emissions in India: Evidence from ARDL bound testing approach. Energy Environ. doi:10.1177/0958305X211065019
Shabir, M., Ali, M., Hashmi, S. H., and Bakhsh, S. (2022). Heterogeneous effects of economic policy uncertainty and foreign direct investment on environmental quality: Cross-country evidence. Environ. Sci. Pollut. Res. 29 (2), 2737–2752. doi:10.1007/s11356-021-15715-3
Shahzad, A., and Younus, M. (2018). Fiscal decentralization in Pakistan: A case study of Punjab provincial finance commission. Pak Perspect. 23 (1), 89–112.
Tufail, M., Song, L., Adebayo, T. S., Kirikkaleli, D., and Khan, S. (2021). Do fiscal decentralization and natural resources rent curb carbon emissions? Evidence from developed countries. Environ. Sci. Pollut. Res. 28 (35), 49179–49190. doi:10.1007/s11356-021-13865-y
Wang, L., and Lei, P. (2016). Fiscal decentralization and high-polluting industry development: City-level evidence from Chinese panel data. Int. J. Smart Home 10 (9), 297–308. doi:10.14257/ijsh.2016.10.9.28
Wu, L., Kaneko, S., and Matsuoka, S. (2005). Driving forces behind the stagnancy of China's energy-related CO2 emissions from 1996 to 1999: The relative importance of structural change, intensity change and scale change. Energy Policy 33, 319–335. doi:10.1016/j.enpol.2003.08.003
Wu, J., Bahmani-Oskooee, M., and Chang, T. (2018). Revisiting purchasing power parity in G6 countries: An application of smooth time-varying cointegration approach. Empirica 45 (1), 187–196. doi:10.1007/s10663-016-9355-1
Yang, B., Ali, M., Nazir, M. R., Ullah, W., and Qayyum, M. (2020a). Financial instability and CO2 emissions: Cross-country evidence. Air Qual. Atmos. Health 13 (4), 459–468. doi:10.1007/s11869-020-00809-7
Yang, B., Ali, M., Hashmi, S. H., and Shabir, M. (2020b). Income inequality and CO2 emissions in developing countries: The moderating role of financial instability. Sustain. Switz. 12 (17), 6810. doi:10.3390/SU12176810
Yang, B., Jahanger, A., and Ali, M. (2021). Remittance inflows affect the ecological footprint in BICS countries: Do technological innovation and financial development matter? Environ. Sci. Pollut. Res. 28 (18), 23482–23500. doi:10.1007/s11356-021-12400-3
Yang, B., Ali, M., Hashmi, S. H., and Jahanger, A. (2022). Do income inequality and institutional quality affect CO2 emissions in developing economies? Environ. Sci. Pollut. Res. 29, 42720–42741. doi:10.1007/s11356-021-18278-5
Yildirim, D., and Orman, E. E. (2018). The feldstein–horioka puzzle in the presence of structural breaks: Evidence from China. J. Asia Pac. Econ. 23 (3), 374–392. doi:10.1080/13547860.2017.1396640
Yuan, R., Li, C., Memon, J. A., Ali, M., and Nawaz, M. A. (2022). The nexus between fiscal decentralization and environmental sustainability in Japan. Front. Environ. Sci. 10, 1–10. doi:10.3389/fenvs.2022.905461
Zahra, S., and Badeeb, R. A. (2022). The impact of fiscal decentralization, green energy, and economic policy uncertainty on sustainable environment: A new perspective from ecological footprint in five OECD countries. Environ. Sci. Pollut. Res. Int. 1, 1–20. doi:10.1007/s11356-022-19669-y
Keywords: fiscal decentralization, ecological footprint, FMOLS, DOLS, pakistan
Citation: Ahmed Memon J, Ali M and Wang Y (2022) Does fiscal decentralization curb the ecological footprint in pakistan?. Front. Environ. Sci. 10:964212. doi: 10.3389/fenvs.2022.964212
Received: 08 June 2022; Accepted: 27 July 2022;
Published: 25 August 2022.
Edited by:
Zeeshan Khan, Curtin University Sarawak, MalaysiaReviewed by:
Muhammad Tufail, Xi’an Jiaotong University, ChinaTomiwa Sunday Adebayo, Cyprus International University, Turkey
Copyright © 2022 Ahmed Memon, Ali and Wang. This is an open-access article distributed under the terms of the Creative Commons Attribution License (CC BY). The use, distribution or reproduction in other forums is permitted, provided the original author(s) and the copyright owner(s) are credited and that the original publication in this journal is cited, in accordance with accepted academic practice. No use, distribution or reproduction is permitted which does not comply with these terms.
*Correspondence: Minhaj Ali, TWluaGFqYWxpNTU2QGdtYWlsLmNvbQ==