 Lv Fu1
 Teng Wang
 Weile Li
94% of researchers rate our articles as excellent or good
Learn more about the work of our research integrity team to safeguard the quality of each article we publish.
Find out more
ORIGINAL RESEARCH article
Front. Environ. Sci. , 31 August 2022
Sec. Environmental Informatics and Remote Sensing
Volume 10 - 2022 | https://doi.org/10.3389/fenvs.2022.963322
This article is part of the Research Topic Advanced Big SAR Data Analytics and Applications View all 8 articles
Landslides are a major geohazard that endangers human lives and properties. Recently, efforts have been made to use Synthetic Aperture Radar Interferometry (InSAR) for landslide monitoring. However, it is still difficult to effectively and automatically identify slow-moving landslides distributed over a large area due to phase unwrapping errors, decorrelation, troposphere turbulence and computational requirements. In this study, we develop a new approach combining phase-gradient stacking and a deep-learning network based on YOLOv3 to automatically detect slow-moving landslides from large-scale interferograms. Using Sentinel-1 SAR images acquired from 2014 to 2020, we developed a burst-based, phase-gradient stacking algorithm to sum up phase gradients in short-temporal-baseline interferograms along the azimuth and range directions. The stacked phase gradients clearly reveal the characteristics of localized surface deformation that is mainly caused by slow-moving landslides and avoids the errors due to phase unwrapping in partially decorrelated areas and atmospheric effects. Then, we trained the improved Attention-YOLOv3 network with stacked phase-gradient maps of manually labeled landslides to achieve quick and automatic detection. We applied our method in an ∼180,000 km2 area of southwestern China and identified 3,366 slow-moving landslides. By comparing the results with optical imagery and previously published landslides in this region, the proposed method can achieve automatic detection over a large area precisely and efficiently. From the derived landslide density map, we determined that most landslides are distributed along the three large rivers and their branches. In addition to some counties with known high-density landslides, approximately 10 more counties with high landslide density were exposed, which should attract more attention to their risks for geohazards. This application demonstrates the potential value of our newly developed method for slow-moving landslide detection over a nation-wide area, which can be employed before applying more time-consuming time-series InSAR analysis.
As a major geological hazard, landslides, which are often triggered by factors such as earthquakes or heavy rainfall, greatly endanger human lives and property (Petley 2012; Fan et al., 2019). Even though ongoing and slow-moving landslides are widely distributed in mountainous regions, their locations are difficult to identify, particularly when landslides are located in areas inaccessible for detailed field-based surveys. This is due to the complex geographic environments and/or high costs of time and human resources. Thus, determining how to effectively update the inventory of moving landslides distributed over large areas is important for preventing disasters. Slow-moving landslides can be identified and monitored with field surveys and through aerial and optical remote sensing imagery. However, the identification of landslides by optical remote sensing requires strong expertise on regarding the morphology of landslides and recognition of ancient landslides as well as clear signs of deformation (Lacroix et al., 2018). The fact that the amount of displacement on the slope is a few centimeters per year before the occurrence of a catastrophic event (Hungr et al., 2014), coupled with the difficulty of field investigation, poses a great challenge for pre-identification and determining a warning of disaster for landslides.
Synthetic Aperture Radar Interferometry (InSAR) can capture small deformation signals on the earth’s surface and has been widely used to study landslides (Hilley et al., 2004; Chen et al., 2014; Hu et al., 2016; Handwerger et al., 2019; Dini et al., 2020). Although InSAR techniques have some challenging issues, such as decorrelated signals caused by vegetation, large deformation gradient and atmospheric effects (Liang et al., 2018; Murray et al., 2019), several multi-temporal InSAR-based techniques, including the Persistent Scatterers InSAR (PS-InSAR, Ferretti et al., 2001) and Small Baseline Subset InSAR (SBAS-InSAR (Berardino et al., 2002; Lanari et al., 2004), have been successfully applied in the early identification of slow-moving landslides (Zhao et al., 2012; Herrera et al., 2013; Ciampalini et al., 2016).
To improve applicability, different methods have been proposed with great success, such as Intermittent SBAS (Novellino et al., 2017), Coherent Scatterer Interferometry (CSI, Dong et al., 2018), and adaptive InSAR (ADS-InSAR, Jia et al., 2019). Nevertheless, due to the complexity of the landscape and the high computational cost of time-series analysis from large-scale interferograms, most applications have been limited to small and regional scales (Dai et al., 2016; Stumpf et al., 2017; Chaoying Zhao et al., 2018; Feng Zhao et al., 2018; Zhang et al., 2018). In addition, it is a challenge to set a rational threshold for detecting landslides in the velocity map calculated from the above-mentioned methods due to the influence of decorrelation, atmospheric, and phase unwrapping errors. To suppress random noises in velocity maps, Bekaert et al. (2020) propose a spatial differencing method to reveal the deformation-gradient pattern of the landslide in the velocity map covering Nepal. Liu et al. (2021) conducted the SBAS-InSAR analysis using Sentinel-1 and ALOS-1 images covering the Jinshajiang River and detected more than 900 active landslides over a large area. These attempts show promising results of applying InSAR to large-scale landslide detection. One recent achievement was proposed by Festa et al. (2022), which is a semi-automatic procedure for deriving a velocity map from large-scale interferograms. Using spatial clustering and setting a velocity threshold, they could identify 14,638 instable areas in the Italian Peninsula. However, detection is still based on InSAR-derived velocity maps and geomorphology features and requires a fair amount of computation and human resources. Generally, a fast and automatic landslide detection method with InSAR over a large-scale is still rare.
Compared to velocity maps, the interferometric phase gradient is sensitive to local deformation. This is because phase differences between adjacent pixels is likely dominated by localized deformation due to landslides rather than atmospheric delays, which have a typical correlation distance of several kilometers (Ferretti et al., 2001; Bekaert et al., 2020). The deformation gradient can reveal small-scale displacement variations, while stacking the phase gradients can effectively reduce the noise level in the data. Price and Sandwell (1998) used phase gradients to highlight strain concentrations on secondary fractures during the 1992 Landers earthquake, which allowed them to obtain fault extension distributions that were difficult to geologically trace. Recently, phase-gradient stacking has been successfully applied to detect small fractures produced by the 2019 Ridgecrest earthquake (Xu et al., 2020b; Xu et al., 2021). Using certain landslide applications, Hu et al. (2020) could calculate the phase gradient of L-band UAVSAR interferograms to identify the boundary of the Slumgullion landslide in the United States.
With these promising applications, phase-gradient stacking shows the capability of enhancing the localized deformation signal, and a method to automatically locate these localized deformation signals is the goal next. Recently, deeplearning network not only achieved outstanding performance in computer vision fields but has also been applied in the InSAR process for mining-induced deformation (Wu et al., 2022) and generated decorrelation masks (Zhang et al., 2021), which promoted us to search for a proper network structure to detect slow-moving landslides from the phase-gradient images. Algorithms of target detection with deep learning can be divided into two categories. One category is a two-stage detection method, including the RCNN and its improved versions (Girshick et al., 2014; Girshick 2015; Ren et al., 2015), which achieves this detection task via the generation of regional proposals of possible objects for training the classifier. The disadvantage of the two-stage algorithm is slow processing due to separate steps. The other category is an one-stage detection method, and the representative algorithm is the YOLO series (Redmon et al., 2016; Redmon and Farhadi 2017; Redmon and Farhadi 2018). Since the first YOLO version, the YOLOv1 network has been used to integrate the two individual steps of the two-stage method into one step and achieved a more than 50% faster inferring speed than the Faster-RCNN (Girshick 2015). Particularly, YOLOv3 adopts the robust backbone of Darknet-53 and increases the three anchors in YOLOv2 into nine anchors in the layers of different reception fields to predict the different-size objects, which results in a good effect for small target detection and is the representative version for the YOLO series.
Using the advantage of the high sensitivity of the phase gradient to small deformation, we use the pattern of the deformation gradient for landslide detection. Instead of unwrapping all interferograms for phase stacking or applying the time-series InSAR analysis, we stack the gradient maps of the wrapped phase in the time domain to enhance signals of local deformation. Considering the inferring speed and network performance, we use and adapt the widely used YOLOv3 network to detect localized deformation that is mostly due to slow-moving landslides from stacked phase-gradient maps. The spatial distribution of detected slow-moving landslide is further analyzed to evaluate the potential geological hazards in the study area.
Our study area is a 180,000 km2 region in southwestern China (Figure 1). It is in the transition zone between the Yunnan-Guizhou Plateau and the Sichuan Basin with an elevation range of 480 to 7,140 m. Three large rivers, the Dadu, Yalong and Litang, flow through the region. The river valleys, gullies and loose deposits caused by numerous earthquakes lead to landslides, mudslides and other geohazards that frequently occur and bring significant losses to the local population and economy (Dai et al., 2016). Recently, developments of infrastructure, such as water conservancy and transportation, have resulted in drastic changes to the environment and greatly increased the risk of geohazards and threatened hydropower stations along rivers. Several studies have been conducted in this area, including the early identification of landslides in the middle section of Yalong River (Dai et al., 2020) and recognition of a landslide group in Danba County (Dong et al., 2018) and in the area between Shimian and Hanyuan counties (Huang et al., 2020). The positions of certain previously identified landslides are also shown in Figure 1.
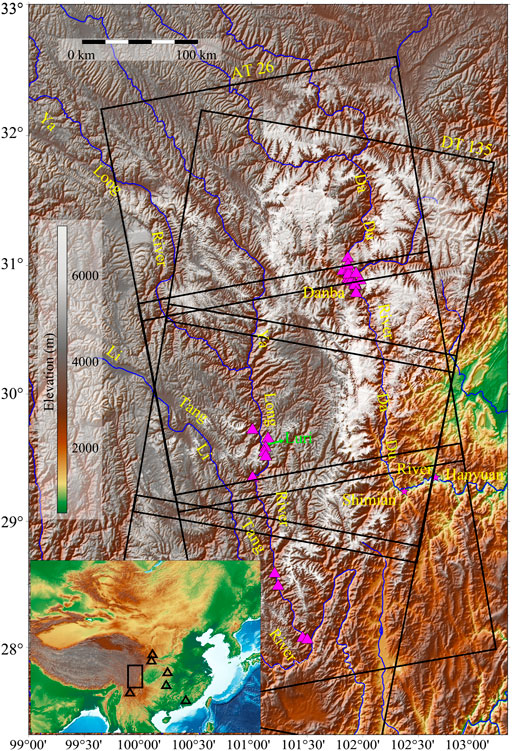
FIGURE 1. Study area and data coverage. Blue lines indicate the Litang, Yalong and Dadu rivers. Black boxes indicate Sentinel-1 data coverage by Ascending Track (AT) 26 and Descending Track (DT) 135 (both with three frames). The magenta triangles represent locations of studied landslides from previous time-series InSAR analysis (Dong et al., 2018; Dai et al., 2020). The snow-covered areas are colored white. The black boxes and triangles in the left-down inset map display locations of the study area (ROI) and other regions for collecting training samples for our deep-learning network. These areas are prone to slow-moving landslides in China and provide abundant and diverse training samples for training the deep-learning model. These regions are as mountainous as the study area but some have denser vegetation (southeast of the ROI), some have a clay-loess landform (northeast of the ROI) and some have steep reliefs (southwest of the ROI).
In this study, we use Sentinel-1 C-band SAR images from Ascending Track 26 (AT 26) and Descending Track 135 (DT 135) acquired from October 2014 to October 2020 (Figure 2). There are 145 images for AT 26 and 97 images for DT 135 and both contain three standard frames. The maximum temporal-baseline is set as 36 days, and 348 and 191 interferometric pairs are generated from the Ascending and Descending orbits, respectively. The whole processing time took less than 3 days by avoiding merge bursts and carry on time-series analysis with 84,564 ascending and 46,413 descending burst interferograms analyzed on a normal desktop computer.
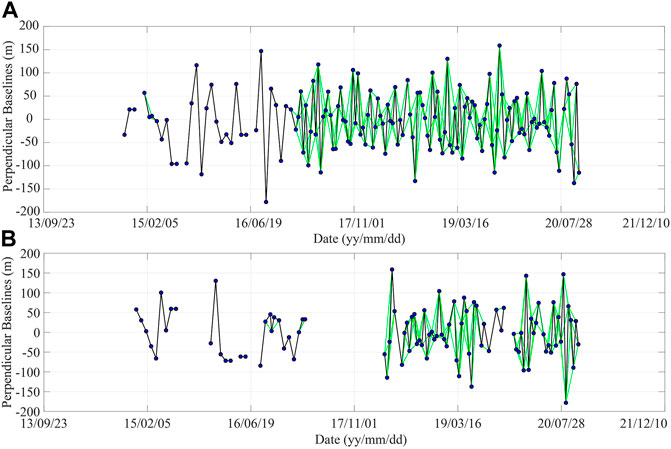
FIGURE 2. Image acquisition and perpendicular baselines of (A) ascending track AT 26 and (B) descending track DT 135 from Sentinel-1 data in the study area. The blue dots indicate the individual SAR acquisitions and lines show interferogram pairs. The black lines are for sequence acquisitions and the green lines show redundant interferograms used with no-more-than 36 days. Note that for the descending track, images acquired before 2018 are irregularly sampled in time due to much fewer acquisitions.
Meanwhile, we collected 67 multispectral Sentinel-2 L2A images acquired between January 2020 and March 2020 with cloud content less than 20% (12% on average) and topographic normalization, radiometric calibration and atmospheric correction were applied. We used the Sentinel-2 data processing package of the Sentinel Application Platform (SNAP) provided by the European Space Agency (ESA) to extract spectral band 3 (0.543–0.578 μm) and band 11 (1.565–1.655 μm) and to calculate the normalized difference snow index (NDSI, Zhu and Woodcock, 2012; Zhu et al., 2015) for masking out snow-covered areas (i.e., the white areas in Figure 1).
Due to the acquisition adjustment of Sentinel-1 satellites, some bursts are missed in standard-frame images, and the stitched interferograms may have incomplete parts of corresponding data coverage. To avoid this situation, we performed our analysis based on burst instead of stitched frames. Thanks to the 1.5 km-wide overlap between each burst, the entire area will be analyzed and burst-overlap interferometry and spectral-diversity co-registration can be avoided. The extreme case is that a landslide located in the middle of the burst-overlap area and its length in the azimuth direction is longer than 1.5 km. For such cases, the northern and southern parts of the landslide are imaged by adjacent bursts and maybe detected as two landslides. However, such extreme situations are rare, and even so this landslide can still be detected without the need for merging bursts.
For each burst, we first produce interferograms with temporal baselines no-more-than 36 days and stack their phase gradients along the azimuth and range directions. We then implemented a designed deep-learning network to detect landslides from stacked phase-gradient maps. After detection, the final stacked gradient maps and detection results of each burst are geocoded and superimposed with optical images in Google Earth for final examination of the source of the detected deformations. The snow-covered areas are derived from Sentinel-2 imagery and are masked in our result. The workflow is shown in Figure 3.
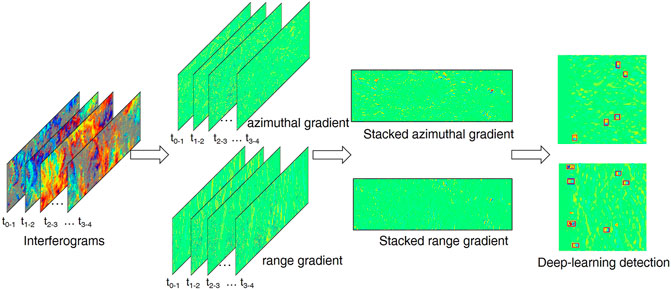
FIGURE 3. The workflow of the proposed method for one burst image. The phase-gradient stacking and detection are both performed in the radar coordinate for each burst of interferograms.
We processed the SAR images using the burst-based Sentinel-1 InSAR processor (https://sarimggeodesy.github.io/software/, Jiang et al., 2017). The topographic phase component is removed using the AW3D 30 m resolution DEM acquired in 2011. The multi-look parameters are 2 and 8 and correspond to the azimuth and range direction, respectively, resulting in a ground resolution of ∼40 m. Meanwhile, we replaced amplitude values of the interferogram with the corresponding coherence values and conducted a 2D convolution with a window size of
After interferometry, the phase differences of adjacent pixels in the wrapped interferogram are calculated to represent the phase gradients in range and azimuthal directions. Because interferometric phases are wrapped into [
Notably, the stacking of the phase gradient is based on an assumption shared with most phase unwrapping methods, which is the unwrapped-phase differences between adjacent pixels is smaller than
In particular, after the stacking of phase-gradient maps, the temporally uncorrelated atmospheric signals are further reduced while the deformation gradients are enhanced. Thus, we can neglect the influence of atmospheric turbulence on the stacked deformation gradient maps. Assuming that the landslide deformation is represented as increased phases, the phase gradient becomes positive from non-deforming to the peak of the deformation area, and then changes its sign to negative from the peak of deformation to non-deforming area along the direction for calculating the phase gradient. The patterns can be continuously reinforced with the increasing number of stacked phase-gradient maps. When patterns are distributed on the same slope surface, an active landslide is identified with coupled red-blue patches as shown in Figure 4.
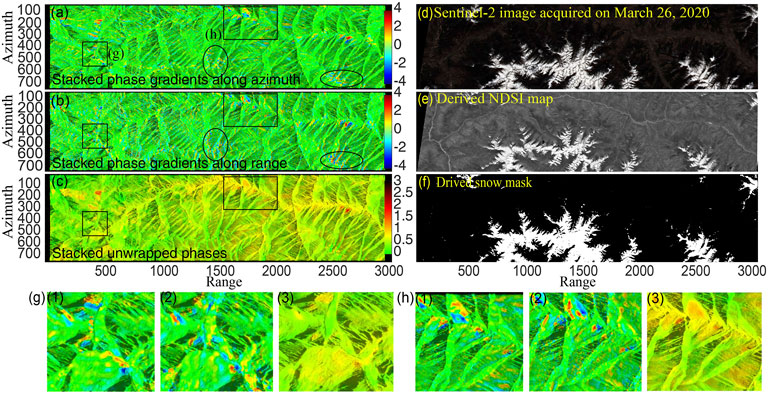
FIGURE 4. Comparison between phase-gradient stacking and unwrapped-phase stacking in the azimuth (A) and range direction (B). (C) Shows stacked unwrapped phases. (D) Sentinel-2 image for masking acquired on 26 March 2020 and (E) derived NDSI map and (F) snow mask. (G,H) are zoom-in views of the rectangle areas in (A) and show the stacked phase gradients in the azimuth (g1, h1) and the range (g2, h2) directions as well as the result of stacked unwrapped phases (g3, h3). The background is basically smooth except for the encircled areas shown in (A), which is caused by the decorrelation of glaciers and snow as shown in Sentinel-2 imagery (D–F).
The phase-gradient stacking results on a selected burst show that the random signals and noise have been effectively suppressed (Figures 4A,B). Compared with results obtained by stacking unwrapped phases (Figure 4C), the local deformation signals in the phase-gradient maps (coupled red-blue patches) can be clearly distinguished from background noise and features are more significant and easier to identify. However, similar patterns appear along high ridges shown as scattered red-blue patches (Figures 4A, B, circles). Such patches are mainly distributed on the top of mountains above the snow line in this region. We use Sentinel-2 images to mask them as shown in the next section (Figures 4D–F).
The decorrelation and movement of snow- and ice-covered areas resemble landslide movement (e.g., the encircled areas in Figures 4A, B), which can interfere with the identification. To mask the snow- and ice-covered regions, we use the multispectral optical image from Sentinel-2 L2A images to calculate the NDSI for extracting snow cover information (Zhang and Zhang 2020):
where band 3 and band 11 represent the spectral band images from Sentinel-2 data. Here, we apply the nearest resampling algorithm in the SNAP software to refer all images to a resolution of 20 m by 20 m. NDSI can effectively distinguish snow cover and cumulus cloud pixels by comparing the reflectivity between green and near-infrared bands. However, only using NDSI may mask water bodies and dense vegetation as their NDSI values are also high. Because the reflectance of water is pretty low in the near infrared, we can set a threshold of band8A (wavelengths: 0.86 μm) data to remove water pixels. Compared with snow pixels, dense vegetation is associated with lower Band 3 (wavelengths: 0.56 μm) data and they can be distinguished from snow pixels. Suitable thresholds are important for accurately masking snow pixels. According to our visual investigation in the study area, we found that 0.4 for NDSI, 0.28 for spectral band 3, and 0.15 for band 8A is the optimal combination for generating a snow mask most consistent with optical images. Note that this approach can only approximately mask snow-covered areas and some snow speckles may still exist, which can be manually masked from the phase-gradient maps with the aid of optical images. Finally, the masked area covers ∼18.57% of the study region.
The stacked phase gradients make the it clear between the local deformation signals and background noise. A quick localization of the deformation signal is a key problem that needs to be solved. Particularly, Wu et al. (2022) present two deep-learning networks for the aim: one is to detect mining-induced local subsidence from wrapped interferograms and the other is to unwrap the detected interferogram patches with dense fringes. However, we cannot directly adapt the strategy of Wu et al. (2022) for landslide detection for two reasons as follows: one is that mining-induced subsidence is so rapid that it is apparent in single interferograms even with 6-day temporal baselines. Yet, the deformation of most landslides is slow without any visible features from single interferograms. Second, because of their simple mechanisms, it is easy to simulate the fringe pattern produced by mining subsidence using a randomly distorted Gaussian surface as training samples (Wu et al., 2022). Yet, the deformation patterns of landslides are extremely complicated and cannot be simulated with a simple model. Therefore, we must conceive another detection strategy for our task at hand. We use the object detection algorithm YOLOv3 (Redmon and Farhadi 2018), which has been widely used in both industry and academic communities (Tang et al., 2020; Deepan and Sudha 2021) to quickly and automatically detect areas of local deformation. YOLOv3 has three detection layers, which set anchors of three aspect ratios, respectively, on each cell of the feature maps of three receptive fields to achieve the detection of small, medium, and large objects. As new YOLO series networks have been published, we designed the detection network based on YOLOV3 but also adopted data augmentation methods, loss functions of YOLOv4 (Bochkovskiy et al., 2020) and other advanced deep-learning modules to better adapt to the needs of our task.
Initially, we used a weighted convolutional kernel to allow the network to allocate more attention to features of landslides for improved recognition ability. Consequently, we add the Convolutional Block Attention Module (CBAM, Woo et al., 2018) to the backbone of YOLOv3. Specifically, we embedded the CBAM to the position that is exactly after each residual block in the backbone of YOLOv3. Meanwhile, to prevent the gradient dispersion caused by layer increasing, we use the module shortcut to connect the adjacent features before and after CBAM (Figure 5A). Thus, we add the attention mechanism of channel and space to the backbone of YOLOv3 and improve the capability of the network to extract and screen key features of the object (hereafter we call this network Attention-YOLOv3).

FIGURE 5. The network design of the Attention-YOLOv3. (A) Residual Block with Convolutional Block Attention Module (CBAM). (B) Diagram of Drop-Block (the white and green cells represent the non-activated and activated neurons, respectively. The black crosses represent the dropped neurons. (C) The diagram of CIoU was used as the loss for the proposed network and GIOU for mergence. Please refer the corresponding definitions in Section 4.3. Note that YOLOv3 is proposed to assess the detection of eighty categories in the massive ImageNet database that has millions of images (Redmon and Farhadi, 2018). In contrast, our task is a two-category detection problem to distinguish the local deformation signal from background noise with thousands of images. To avoid the over-fitting phenomenon, we tested two strategies to decrease the complexity of the network and compare their detection effects. In the first scheme, we apply regularization approaches to Attention-YOLOV3. Specifically, we put the Drop-Block (Ghiasi et al., 2018) into three detection layers of Attention-YOLOv3, which is a structured form of dropout for the convolution layer. As shown in Figure 5B, the Drop-Block abandons the neurons in the adjacent regions of the feature map together within a certain probability to reduce the fitting ability of the network. The second scheme is that we adopt Attention-YOLOv3-Tiny (a simplified structure of Attention-YOLOv3), which only has two detection layers and shallower layers of backbone to deal with our task.
Note that YOLOv3 is proposed to tackle with the detection task of eighty-category in the massive ImageNet database that has millions of images (Redmon and Farhadi, 2018). While, our task is a two-category detection problem to distinguish local deformation signal from background noise with thousands of images. To avoid the over-fitting phenomenon, we test two strategies to decrease the complexity of the network and compare their detection effects. The first scheme is that we apply regularization approaches to Attention-YOLOV3. Specifically, we put the Drop-Block (Ghiasi et al., 2018) into three detection layers of Attention-YOLOv3, which is a structured form of dropout for the convolution layer. As shown in Fig.5b, the Drop-Block abandons the neurons in the adjacent regions of the feature map together within a certain probability to reduce the fitting ability of the network. The second scheme is that we adopt Attention-YOLOv3-Tiny (a simplified structure of Attention-YOLOv3) which has only two detection layers and shallower layers of backbone, to deal with our task.
For the regression loss of anchor coordinates, we utilized CIoU loss to replace the MSE (Mean Square Error) loss in YOLOv3. This is because MSE loss only calculates the Euclidean distance between the coordinates of anchors and ground-truth boxes (GT box) and is unable to reflect the accurate overlapping effect of two detection boxes. Figures 5A–C represent the area of the prediction box (green) and GT Box (gray). U and I are the smallest enveloped and intersection areas. C is the complement area that equals U minus I. d represents the Euclidean distance between their center points. C is the diagonal length of U.
The CIoU loss considers the overlap area, the distance of the center points, and the aspect ratio between detection boxes and becomes one of the best loss functions in recent object detection applications (Zheng et al., 2020). The GIOU value ranges from −1 to 1, where a larger overlap between two boxes means larger GIOU (Rezatofighi et al., 2019). When the two boxes are separated from each other, GIOU approximates toward −1. Through experimentation, we chose to merge two detection results as one landslide if their GIOU is larger than zero. By calculating the GIOU, we can merge the overlapping anchor boxes from stacked azimuth and range gradients.
We produced stacked phase-gradient images covering not only the study area, but also other regions in China (Figure 1, black triangles in inset map) to enrich the diversity of training samples and cropped these burst-based phase-gradient images into thousands of sub-images with a size of 416 by 416 pixels. Among them, we carefully selected 712 (azimuth gradient) and 581 (range gradient) cropped images with red-blue patches that were well distributed. Then, we manually assigned rectangle frames to include the red-blue patterns as labels (e.g., red boxes in Figure 6). Finally, we obtained 5,692 labels as localized deformations, and divided these labels into training, validation and test datasets according to the ratio of 8:1:1. We also applied the Label Smoothing method (Szegedy et al., 2016) to enhance the generalization ability of the network. The label smoothing is conducted by adding random values to the binary label images during each training epoch to smooth the classification labels.
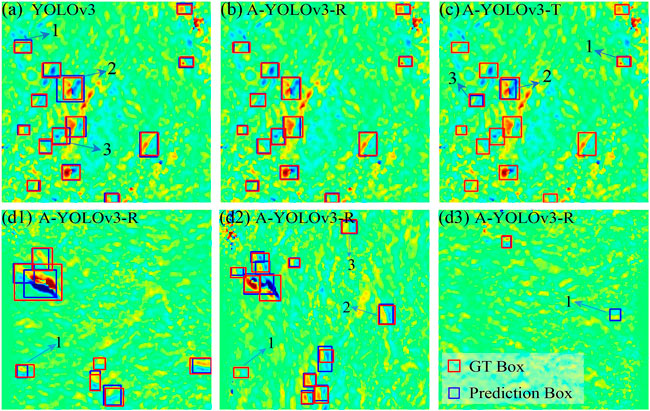
FIGURE 6. The detection result of different networks (in radar coordinate: 416 by 416 pixels). The gradients are scaled to [−4, 4] radians. Note that some yellowish and light bluish bands are visible in the phase-gradient maps, and there is background noise related to the shortening and shadowing effects. Actually, magnitudes are very small compared with the areas with localized deformation. The box with the blue boundary is the prediction from the network and with the red boundary is the ground-truth (GT) Box. Sub-plates (A,B, and C) represent the landslide detection result by YOLOv3, A-YOLOv3-R, and A-YOLOv3-T, respectively. Sub-plates (D1,D2) display the stacked phase gradients in the azimuth and range direction of another sample and show mis-location cases of the A-YOLOv3-R with numbers. Sub-plate (D3) shows a case (indicated as 1) that is detected by our network without being labeled.
Since anchors are the prior boxes that need to be trained to regress toward the GT boxes, setting the size and shape of anchors has a crucial impact on the speed and accuracy of the initial regression process. Because anchors of YOLOv3 have 9 kinds of scales and aspect ratios, which focus on the prediction to the objects of different shapes and sizes, we used a clustering method of k-means to cluster the width and height of all GT boxes in our dataset into nine categories. According to the clustering results, we set anchors in three detection layers (Table 1).
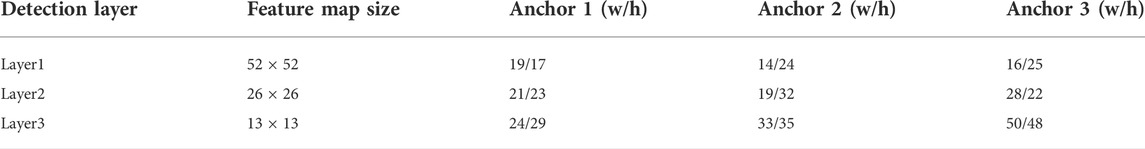
TABLE 1. Setting of anchor sizes (Unit: pixels).
The implementation of the network is based on Pytorch 1.7.0. The training machine is a server equipped with an Intel (R) Xeon (R) Gold 6132 CPU (2.60 GHz), 256 GB RAM, NVIDIA Tesla V100 GPU. In data preprocessing, we applied the data augmentation of a mosaic that zoomed four images and incorporated them into one image to achieve bigger batch size training (Bochkovskiy et al., 2020). The total training epoch is 300. In the first 100 epochs of training, we used an Adam automatic optimizer (Kingma and Ba 2015) to find a rough converging direction, and in the next 200 epochs, we utilized an optimizer of SGD Momentum (Goodfellow et al., 2016) to carefully adjust the learning rate to achieve a better training effect.
We employed the original YOLOv3, Attention-YOLOv3 with regularization (A-YOLOv3-R), and Attention-YOLOv3-Tiny (A-YOLOv3-T) to tackle the landslide detection task and compared the metrics of MAP (Mean Average Precision), Precision (confidence ≥ 0.8), and Recall (confidence ≥ 0.8) of different networks (Table 2). Here, precision and recall indicate the percentage of detected targets with labels in all predictions and ground truths, respectively. A confidence score is a value between 0 and 1 that is predicted by the network for each detected location and represents the probability of the detection. MAP is the weighted average precision of detections with ten confidence scores from 0.1 to 1 and reflects the comprehensive detection capability of different networks.
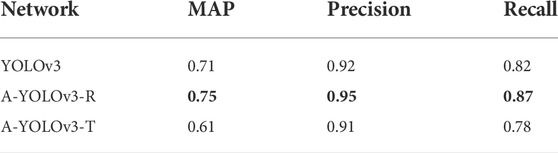
TABLE 2. Metrics of different networks.
From the detection results shown in Table 2, the A-YOLOv3-R presents the highest metric scores. We compare the detection effect of different networks on the test dataset (Figure 6). The A-YOLOv3-R not only detects all landslides in the image but also predicts the most accurate position of bounding boxes (Figure 6B). Although the original YOLOv3 also determines all the landslides in Figure 6A and guided by the MSE loss, the position of bounding boxes is inferior to the performance of A-YOLOv3-R such as the prediction boxes 1, 2, and 3 in Figure 6A. For A-YOLOv3-T and due to the limitation of network fitting ability, it only detects part of the landslides like the prediction boxes 1, 2, and 3 in Figure 6C. Therefore, we chose A-YOLOv3-R as our detection network in the following study.
Figures 6D–F show the performance of A-YOLOv3-R in another sample with failure detections. For instance, the number 1 landslide in Figures 6D, E was labeled in the range-gradient map but was not detected by our network. This is rare (5% in all labeled targets according to the Precision value derived from the validation dataset) and probably due to the very weak gradient pattern. The target was human recognized and facilitated by the azimuth-gradient map with a clear signal (Figure 6D). Numbers 2 and 3 in Figure 6E show cases that landslides were not detected by either humans or our network in the azimuth-gradient map because no visible gradient pattern can be recognized. However, they were successfully detected by our network in the range-gradient map. Such failure cases show that combining detections from both azimuth- and range-gradient maps can largely prevent missing deforming signals, which further improves the precision in real applications.
For landslide detection and despite that the signal of background noise has been largely reduced, sometimes the existing phase gradient of topography residues caused by the calculation of phase difference is still similar to the feature of landslide signal. Figure 6F shows a case where the gradient pattern was detected by our network without being labeled. This is mainly due to the weak signal that was ignored by visual investigation or the false signal that occurred across the mountain ridge. Additionally, the accumulated value of topography residues in the phase-gradient maps is likely smaller than the deformation phase gradient of the landslide thanks to the configuration of small baselines of Sentinel-1 satellites. To reduce the number of false alarms and put prior attention to the local deformation area with a large phase gradient, according to our test dataset we exclude a target if the gradient value in the detection boxes is lower than 1.2 radians or larger but only appears in less than 10% of the pixels.
We employed a trained network to the stacked phase-gradient maps calculated from Ascending and Descending Tracks of Sentinel-1 data burst by burst and cropped each burst to a series of 416 × 416 images with an overlapping area to prevent the loss of information, which was the same as preparing the training samples. We scaled the gradient values to [−4, 4] radians to enhance the visual contrast of the red-blue pattern. After detection, we merged the detection results from ascending and descending tracks if two overlapping detection boxes, which are associated with a GIOU larger than zero. Also, if the central locations of two separated boxes are within 500 m, we also consider them as the same deformation source with their largest common boundary. The merged detection results are shown in Figure 7 with a total of 3,366 potential landslides. Note that images from ascending and descending tracks are sensitive to slopes oriented to different aspect angles because of their different imaging geometries. As a result, their distributions of the detections look different, especially for mountainous areas with steep terrains (Figure 7).
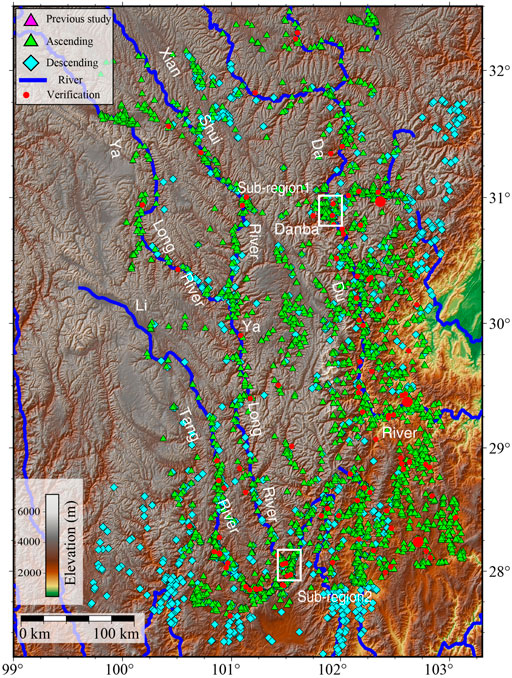
FIGURE 7. Slow-moving landslides are identified by phase-gradient stacking and the Attention-YOLOv3 network from AT26 (green triangles) and DT135 (light blue diamonds) images. Red dots indicate randomly selected landslides for verification with optical imagery, and the three bigger red dots from north to south correspond to landslides a-c in Figure 8. The magenta triangles are the same as in Figure 1.
To further verify these deformation phenomena, we employed optical images to investigate the morphology feature caused by slow-moving landslides. This morphology feature was caused by the movement of active landslides for years and represents evidence of long-term slow motion (Xu et al., 2020a). Thus, the sparse acquisition dates of optical images hardly impacts the identification of active landslides. We randomly selected 100 detected targets for verification on the Google Earth platform (red dots in Figure 7). Based on our experiences in identifying landslides from optical imagery (Xu et al., 2020a), we found that 72 detected targets were confirmed as active landslides based on their morphology features represented in optical images (e.g., Figure 8). Eight targets were deforming areas likely associated with human activities such as mining. The rest could not be judged as landslides. Thus, the false-alarm rate is ∼30%.
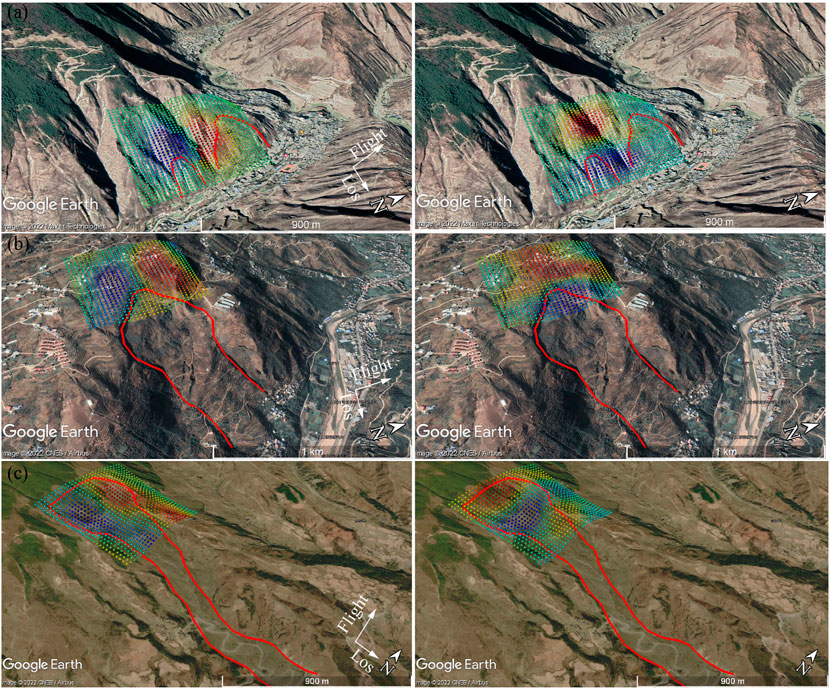
FIGURE 8. Verification of three slow-moving landslides detected from phase-gradient stacking in the azimuth (left column) and range (right column) directions and superimposed on Google Earth. The gradients are scaled to [−4, 4] radians as shown in Figure 6. The red polygons depict boundaries of these landslides identified from optical images based on their geomorphological features.
We show boundaries of 3 active landslides among the 100 random selected targets in Figure 8. Based on the calculation of phase gradient, the area between positive and negative gradients is associated with the maximum deformation. From the three examples, it is clear that maximum deformation occurred on the top of slow-moving landslides, and likely resulted from subsidence on the upper part of a sliding body. Therefore it is difficult to derive the landslide boundary from the phase gradient map, which only reflects the sign of deformation. This validation procedure also provides clues that in a real application, we can conduct the quality check based on open optical images to exclude obvious false detections before the time-series InSAR analysis.
The 3,366 detected slow-moving landslides are mostly distributed along the three large, north-south flowing rivers (Figure 9), namely, the Litang, Yalong, and Dadu rivers from west to east. This feature is consistent with the susceptibility to slope deformations in deep river canyons and steep mountains. We further calculated a density map based on the detected landslides and superimposed it with large rivers and their branches and residential counties (Figure 9). It shows that the high-density belts are following large rivers and some of their branches. The density of active landslides along the three major rivers increases from northwest to southeast, which is likely due to the increasing precipitation from west to east (Bontemps et al., 2020; Jin et al., 2021).
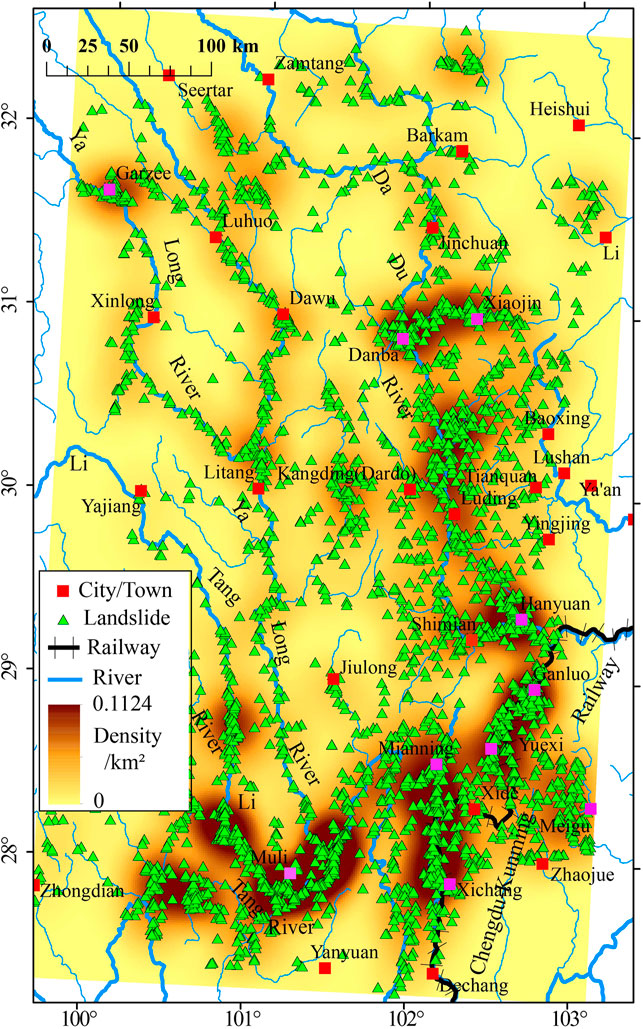
FIGURE 9. A landslide density map based on our detection result with county locations in the studied region.
The areas with highest landslide density preferably appear in the junction of rivers where some counties locate. Among these counties, landslides in Danba have been well studied and a group of landslides have been detected from time-series InSAR analysis (Dong et al., 2018; Zhang et al., 2018). Moreover, alluvial fans and loose deposits within the gorge topographic in Danba county have caused plenty of hazards since 2003 (Li et al., 2008a; Li et al., 2008b), and the deformation clustering indicates that the deformation is still undercurrent.
Our detection results also suggest that Muli County along the Litang River, Garzee along the Yalong River, Xiaojin and Hanyuan counties along the Dadu River, and Ganluo, Yuexi, Xichang, Meigu and Mianning counties are all located in high-risk areas with a landslide density higher than 0.1/km2. However, much fewer studies or concerns, at least from the scientific literature, have been focused on these counties. They are probably also endangered by surrounding landslides as the Danba County. The time-series InSAR analysis could be conducted to further investigate the landslide dynamic in such areas. In the following sub-sections, we focus on Danba County and the middle section of Yalong River (white rectangles in Figure 7) to present the detection results in detail and compare them with recently published results from traditional InSAR methods. All are high-risk areas with numerous active landslides.
Figure 10 shows landslides in Danba County detected from ascending and descending data. River erosion, hydropower development and construction of related facilities leads to many slope instabilities in this area. The landslides detected through phase-gradient stacking agree well with the landslide catalog by manually flagging active landsides with large velocities derived from time-series InSAR analysis (e.g., small circles labeled 1 to 15 in Figure 9A from Dong et al., 2018) but with more local deformation areas clearly showing typical gradient characteristics. In addition, different slope directions may show different features in phase-gradient maps. For example, cumulative gradient features in the azimuth direction are more obvious on narrow slopes in the east-west direction, and some landslides such as 16, 17, and 18 in Figure 10A show obvious gradient features in the azimuth direction but not in the range direction.
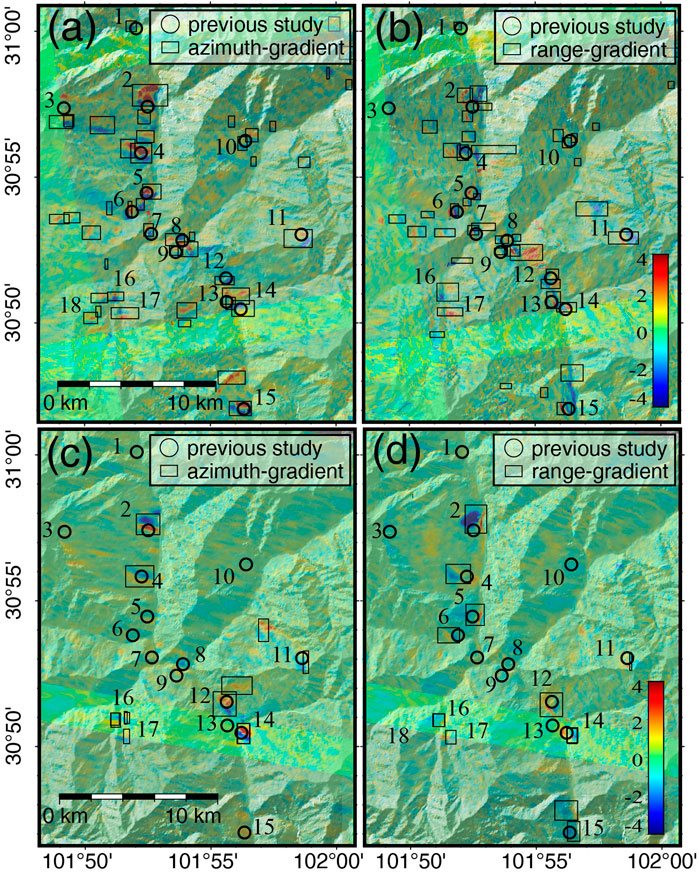
FIGURE 10. Detected slow-moving landslides (boxes) in Danba County using phase-gradient stacking and Attention-YOLOv3 network in (A,C) azimuth and (B,D) range directions obtained from AT26 (A,B) and DT135 (C,D) images. Circles labeled 1 to 15 mark locations of landslides identified in Dong et al. (2018).
We detected fewer landslides using descending (Figures 10C,D) than ascending data (Figures 10A,B). Apart from the detected landslides labeled 2, 4, 12, and 14, the phase-gradient patterns on the rest of the slopes are not present or slightly weak, such as 5, 6, 11, and 15, in the range direction. This is likely caused by the fewer number of interferograms for descending data. In addition, the side-look imaging geometry of SAR data limits the observation capabilities due to shadowing in the narrow valleys.
We apply our method in the middle section of the Yalong River and compare detection results with those obtained from the time-series SBAS-InSAR analysis (Dai et al., 2020). As shown in Figure 11, many active landslides present clear phase-gradient patterns near the junction of the Yalong and Litang rivers, including the Yangshan and Dujiacun landslides that were found by Dai et al. (2020). The landslide cluster northeast of the river junction does not exhibit clear gradient patterns in the range-gradient map (Figure 11B). This is probably because the north-south flowing river blocks the gradient calculation along the range direction from a deforming to non-deforming area. Nevertheless, the azimuth gradient map clearly exhibits a coupled red-blue pattern. For comparison with traditional InSAR analysis techniques, unwrapped-phase stacking from ascending data has been conducted as well as time-series analysis using SBAS-InSAR implemented by the StaMPS (Hooper et al., 2007) as shown in Figures 11C, D, respectively. We also show boxes after merging azimuth and range detections in Figures 11C, D.
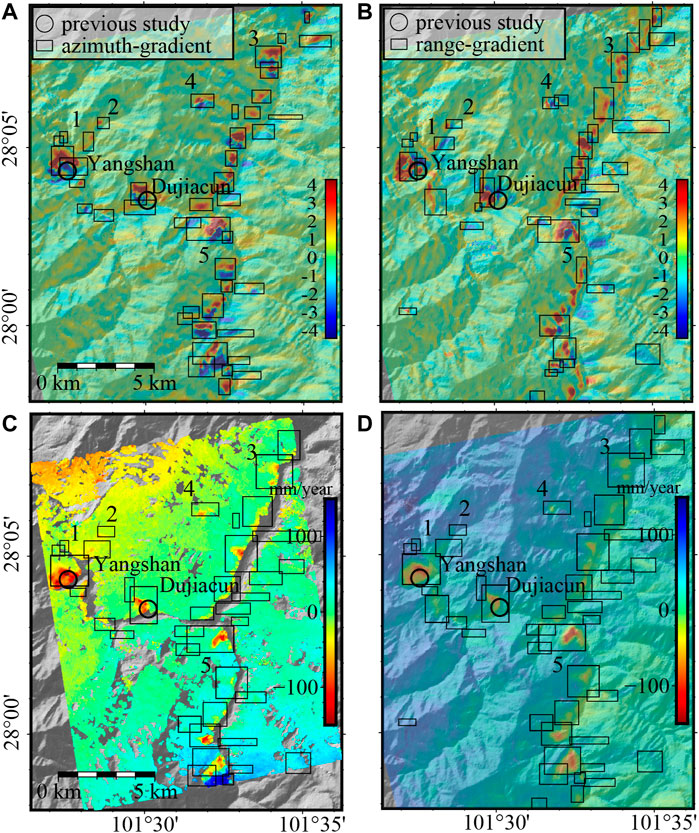
FIGURE 11. Slow-moving landslides in the middle section of the Yalong River detected by Attention-YOLOv3 in phase-gradient maps along azimuth (A) and range (B) directions. Surface velocity maps derived by the SBAS-InSAR method (C) and unwrapped-phase stacking (D) for the same area. Black boxes are merged results from (A,B) with numbers indicating a weak signal in the InSAR velocity maps. Circles show Yangshan and Dujiacun landslides from previous studies (Dai et al., 2020).
From the results, it is observed that there are many deforming areas distributed in this area, among which the annual displacement of the Yangshan and Dujiacun landslides can be up to 150 mm/year. Nevertheless, some local deformation signals may be polluted by the tropospheric residuals that make their velocity indistinguishable from background noise such as the deformation areas labeled from 1 to 5 in Figures 11C, D. However, the stacked phase gradients enhance the deformation signals so that they can be easily distinguished from the background noise, which improves the capability of local deformation detection. More importantly, the coupled red and blue pattern provides more spatial features for the deep-learning network to recognize its appearance. Consequently, our proposed network detects much more moving targets along valleys even though they are small objects. Although large displacement fields such as Yangshan and Dujiacun landslide can be detected by setting velocity thresholds using advanced time-series InSAR analysis, similar thresholds cannot distinguish many other localized deformation areas that are automatically detected by our network. Therefore, the new strategy not only significantly reduces the calculation burden, but also enables capture of more slow-moving landslides in large-scale applications.
The temporal behavior of a landslide can affect the signal-to-noise ratio after phase-gradient stacking. Also, the number of images required for conducting phase-gradient stacking needs to be discussed from the operational point of view. Low-gradient signals require more phase-gradient maps in stacking to be enhanced. Otherwise, gradient features may be too weak to be identified, particularly in areas with low coherence values. We conducted a test to quantitatively evaluate the effect of the number of images used in stacking by analyzing the number of landslides that can be detected with different numbers of phase-gradient maps. According to our test, few landslides can be detected if there are less than 50 short-temporal baseline interferograms, i.e., phase-gradient maps. The number of detected landslides begins to increase along with the number of stacked phase-gradient maps until a certain level (about 250 interferograms in this study area). Then, further increasing interferograms has little effect on improving the number of detected landslides because the noise is largely suppressed and existing deformation features are effectively enhanced.
However, for a specific case, if a landslide only moves temporally in a certain year or only moves in a short period within each year, increasing the number of interferograms may reduce the effective value of stacked phase gradients and make the phase gradients weaker. This is particularly the case for the Luri landslide located on the Yalong River (Figures 1, 12A).
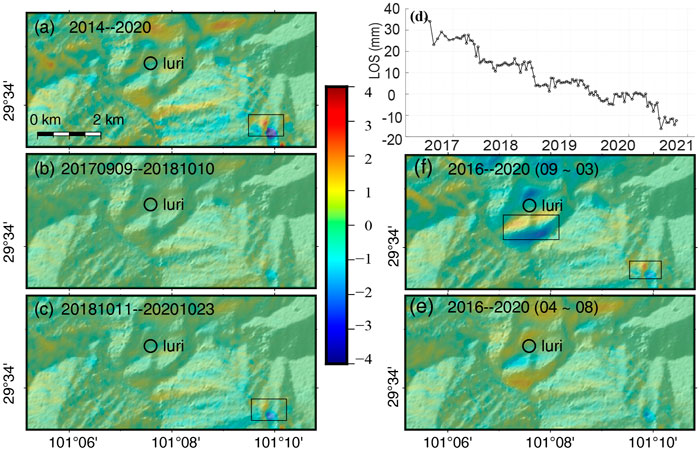
FIGURE 12. Stacked phase-gradient maps in the azimuth direction for the Luri landslide from (A) 2014 to 2020, (B) from September 2017 to October 2018, (C) from November 2018 to October 2020, and (D) the deformation series of the Luri landslide. Stacked phase-gradient maps in azimuth from (E) only images in September to the following March and (F) in April to August from 2016 to 2020. The black box indicates slow-moving landslides detected using the Attention-YOLOv3 network.
The Luri landslide has been investigated by Dai et al. (2020) from the velocity map derived from time-series InSAR analysis using Sentinel-1 images acquired from 9 September 2017 to 10 October 2018. However, our method failed to locate this landslide, which is the only one among the published landslides. We used images acquired at the same period as Dai et al. (2020), and the landslide still cannot be detected with a clear phase-gradient pattern (Figure 12B), which is likely due to the small amount of interferograms with deformation signal in this short period.
To understand the temporal behavior of this landslide, we conducted a time-series InSAR analysis using the StaMPS software. The time-series from 2016 to 2020 demonstrates a strong seasonal motion behavior (Figure 12D). The LOS deformation velocity is small and slightly positive from September to the following March but large and negative from Apr to September. This can be reflected in the stacked phase-gradient maps in different periods of the year with contrast gradient patterns (Figures 12E,F), and they are both detected by our network. Such temporally moving landslides might be missed if we use a long-term dataset to calculate the phase-gradient map because their gradient patterns are canceled with each other. From the hazard migration point of view, we need to focus particular attention on the deformation accumulated in the raining season by processing more interferograms acquired in such seasons when landslide motion is accelerated due to precipitation.
Combining phase-gradient stacking and a deep-learning network greatly improves the efficiency of landslide identification and localization. However, due to complex deformation behaviors in a wide variety of landslides, the cumulative phase-gradient may still show irregular gradient patterns, which makes targets identifiable only in either the azimuth or range direction. Therefore, it is necessary to combine patterns obtained from both directions to improve the recognition rate. Merging detection results from both ascending and descending images also helps fill the monitoring gap due to the SAR imaging geometry (Liu et al., 2021).
As for our proposed deep-learning network, in the complicated application scenario with many interferences of confused background noises, some key structures and parameters actually play essential roles in deriving a promising detection result, which is worth discussing. First, an attention mechanism is a key factor for improving the detection accuracy, which endows the network with the ability to focus on the most representative feature (the coupled red and blue pattern) during the training process. In the comparison experiment, A-YOLOv3-R achieves the highest detection metric score with MAP 0.75, which increases 4% and 10% compared to those of the original YOLOv3 and A-YOLOv3-T (Table. 2). Besides the detection accuracy, the precise location of detection boxes is also highly concerned in practice. Here, regressive loss for bounding boxes determines the accuracy of detection boxes. Our experiment shows that A-YOLOv3-R trained by CIOU loss shows optimal detection performance with little boundary error to ground truth compared with the result obtained by the original YOLOv3 (Figure 6) as the CIOU loss not only considers the positions, but also the shape of both boxes.
The performance of a deep-learning-based method highly depends on the quality of training samples. Here, our preference is to increase the number of detections as much as we can even with the consequence of higher false-alarm rates (∼30% based on our validation with optical imagery). In other words, we prefer to keep all possible moving targets rather than miss someone with tiny signals. Therefore, we prepared a large amount of training samples by visual investigation not only in the study area but also other mountainous regions and labeled as many landslides as we could. The richness of various gradient features in the samples used in the network training plays an important role in the detection performance, which is essential for preventing misidentification and omission in practical applications. When humans are involved, inaccurate samples exist and affect the training of the network. For instance, the target we labeled may be an area with local deformation, but not necessarily a landslide. This is because a local subsidence area can also produce similar gradient patterns. Therefore, further analysis based on geomorphology with DEM and optical imagery are suggested to finally determine whether a detected target is a slow-moving landslide. Nevertheless, the proposed method can significantly reduce the amount of interactive work by focusing the investigation on the detected areas with local deformation, given the fact that most of the areas with deformation have been detected.
Although the phase gradients can qualitatively enhance the deformation signals based on the magnitude and scope of the gradient values, phase-gradient maps lack the quantitative information on the velocity or deformation series. The trained deep-learning network can only locate the deformation within a rectangular based on the phase-gradient characteristics and is not able to map the exact boundary of slow-moving landslides. However, we can then spend much less computational resources by focusing on the manual investigation using optical images and applying time-series InSAR analysis within those detected small areas to explore their spatial distribution and temporal behavior rather than the whole study region. This should be much faster and reliable because of large-scale errors, e.g., phase unwrapping errors, and tropospheric delays can be limited by referring the movement on the landslides to a nearby reference point. This will be the focus of our further work for the complete chain of large-scale landslide detection and analysis using InSAR.
In this work, we conduct phase-gradient stacking for enhancing local deformation signal that is sparsely distributed in a large area. Combined with the Attention-YOLOv3 network, we detect this type of signal automatically as slow-moving landslides. We applied the proposed approach in the ∼180,000 km2 mountainous region of southwestern China using Sentinel-1 data from both ascending and descending tracks acquired from 2014 to 2020 and identified 3,366 possible active landslides. We evaluated our results with results from standard time-series InSAR analysis, published inventory and interpretation from optical imagery. Although our method cannot quantify the velocity of the deformation, the phase-gradient patterns reveal many small and localized deformation areas, which are likely ignored from velocity maps derived from traditional multi-temporal InSAR methods. Our results imply that the detection of instable areas can be efficiently achieved from wrapped interferograms and by avoiding unwrapping large-scale interferograms. As for further work, a fast time-series analysis can be designed and deployed on small areas with dense detected targets for geohazard monitoring and risk assessment.
The training samples and results of phase gradient stacking for the entire study area are available at https://disk.pku.edu.cn:443/link/8BE6E38A668D99C582776A01A4B10685. The datasets presented in this study can be found in online repositories. The names of the repository/repositories and accession number(s) can be found in the article/Supplementary Material.
TW conceived the study. LF conducted the InSAR data processing and analysis. QZ designed the deep-learning network. WL and QX completed the validation. TW, QX and DG provided funding and supervising for the study. LF wrote the manuscript and it was edited by TW. All authors discuss the results and reviewed the manuscript.
This work is supported by the National Key Research and Development Program of China (2021YFC3000400), China Geological Survey (Grant No. DD20211365), and National Natural Science Foundation of China (Grant No. 41941019).
The authors acknowledge the course ‘English Presentation for Geophysical Research’ of Peking University (Course #01201110) for assistanc with improving the manuscript.
The authors declare that the research was conducted in the absence of any commercial or financial relationships that could be construed as a potential conflict of interest.
All claims expressed in this article are solely those of the authors and do not necessarily represent those of their affiliated organizations, or those of the publisher, editors or the reviewers. Any product that may be evaluated in this article, or claim that may be made by its manufacturer, is not guaranteed or endorsed by the publisher.
Bayer, B., Simoni, A., Mulas, M., Corsini, A., and Schmidt, D. (2018). Deformation responses of slow moving landslides to seasonal rainfall in the Northern Apennines, measured by InSAR. Geomorphology 308, 293–306. doi:10.1016/j.geomorph.2018.02.020
Bekaert, D. P. S., Handwerger, A. L., Agram, P., and Kirschbaum, D. B. (2020). InSAR-based detection method for mapping and monitoring slow-moving landslides in remote regions with steep and mountainous terrain: An application to Nepal. Remote Sens. Environ. 249, 111983. doi:10.1016/j.rse.2020.111983
Berardino, P., Fornaro, G., Lanari, R., and Sansosti, E. (2002). A new algorithm for surface deformation monitoring based on small baseline differential SAR interferograms. IEEE Trans. Geosci. Remote Sens. 40, 2375–2383. doi:10.1109/tgrs.2002.803792
Bochkovskiy, A., Wang, C.-Y., and Liao, H.-Y. M. (2020). YOLOv4: Optimal speed and accuracy of object detection. arXiv e-prints: arXiv:2004.10934.
Bontemps, N., Lacroix, P., Larose, E., Jara, J., and Taipe, E. (2020). Rain and small earthquakes maintain a slow-moving landslide in a persistent critical state. Nat. Commun. 11, 780. doi:10.1038/s41467-020-14445-3
Chaoying Zhao, C. Y., Kang, Y., Zhang, Q., Zhong, L., and Li, B. (2018). Landslide identification and monitoring along the jinsha river catchment (wudongde reservoir area), China, using the InSAR method. Remote Sens. 10, 993. doi:10.3390/rs10070993
Chen, C. W. (2001). Statistical-cost network-flow approaches to two-dimensional phase unwrapping for radar interferometry. Diss: Stanford University.
Chen, Q., Cheng, H. Q., Yang, Y. H., Liu, G. X., and Liu, L. Y. (2014). Quantification of mass wasting volume associated with the giant landslide Daguangbao induced by the 2008 Wenchuan earthquake from persistent scatterer InSAR. Remote Sens. Environ. 152, 125–135. doi:10.1016/j.rse.2014.06.002
Chen, X., Tessari, G., Fabris, M., Achilli, V., and Floris, M. (2020). “Comparison between PS and SBAS InSAR techniques in monitoring shallow landslides,” in Understanding and reducing landslide disaster risk. WLF 2020. ICL contribution to landslide disaster risk reduction. Editors N. Casagli, V. Tofani, K. Sassa, P. T. Bobrowsky, and K. Takara (Cham: Springer), 155–161. doi:10.1007/978-3-030-60311-3_17
Ciampalini, A., Raspini, F., Lagomarsino, D., Catani, F., and Casagli, N. (2016). Landslide susceptibility map refinement using PSInSAR data. Remote Sens. Environ. 184, 302–315. doi:10.1016/j.rse.2016.07.018
Dai, K. R., Li, Z. H., Tomás, R., Liu, G. X., Yu, B., Wang, X. W., et al. (2016). Monitoring activity at the Daguangbao mega-landslide (China) using Sentinel-1 TOPS time series interferometry. Remote Sens. Environ. 186, 501–513. doi:10.1016/j.rse.2016.09.009
Dai, K. R., Tie, Y. B., Xu, Q., Feng, Y., Zhuo, G. C., and Shi, X. L. (2020). Early identification of potential landslide geohazards in alpine-canyon terrain based on SAR interferometry—A case study of the middle section of Yalong River (in English). J. Radars 9 (3), 554–568. doi:10.12000/JR20012
Deepan, P., and Sudha, L. R. (2021). Effective utilization of YOLOv3 model for aircraft detection in Remotely Sensed Images. Mater. Today Proc. (3), 2214–7853. doi:10.1016/j.matpr.2021.02.831
Dini, B., Aaron, J., Manconi, A., De Palezieux, L., Leith, K., and Loew, S. (2020). Regional-scale investigation of preconditioning factors of rock slope instabilities in NW Bhutan. J. Geophys. Research-Earth Surf. 125, 404. doi:10.1029/2019jf005404
Dong, J., Liao, M. S., Xu, Q., Zhang, L., Tang, M. G., and Gong, J. Y. (2018). Detection and displacement characterization of landslides using multi-temporal satellite SAR interferometry: A case study of danba county in the Dadu river basin. Eng. Geol. 240, 95–109. doi:10.1016/j.enggeo.2018.04.015
Fan, X. M., Scaringi, G., Korup, O., West, A. J., Westen, C. J. v., Tanyas, H., et al. (2019). Earthquake‐induced chains of geologic hazards: Patterns, mechanisms, and impacts. Rev. Geophys. 57, 421–503. doi:10.1029/2018rg000626
Feng Zhao, F., Mallorqui, J. J., Iglesias, R., Gili, J. A., and Corominas, J. (2018). Landslide monitoring using multi-temporal SAR interferometry with advanced persistent scatterers identification methods and super high-spatial resolution TerraSAR-X images. Remote Sens. 10, 921. doi:10.3390/rs10060921
Ferretti, A., Prati, C., and Rocca, F. (2001). Permanent scatterers in SAR interferometry. IEEE Trans. Geosci. Remote Sens. 39, 8–20. doi:10.1109/36.898661
Festa, D., Bonano, M., Casagli, N., Confuorto, P., De Luca, C., Del Soldato, M., et al. (2022). Nation-wide mapping and classification of ground deformation phenomena through the spatial clustering of P-SBAS InSAR measurements: Italy case study. ISPRS J. Photogrammetry Remote Sens. 189, 1–22. doi:10.1016/j.isprsjprs.2022.04.022
Ghiasi, G., Lin, T.-Y., and Le, Q. V. (2018). “DropBlock: A regularization method for convolutional networks,” in Neural information processing systems, 10727–10737.
Girshick, R., Donahue, J., Darrell, T., and Malik, J. (2014). “Rich feature hierarchies for accurate object detection and semantic segmentation,” in Proceeding of the 2014 Ieee Conference on Computer Vision and Pattern Recognition (Cvpr), Columbus, OH, USA, June 2014 (IEEE), 580–587. doi:10.1109/cvpr.2014.81
Girshick, R. (2015). “Fast R-CNN,” in International conference on computer vision, 1440–1448. doi:10.1109/iccv.2015.169
Goodfellow, I., Bengio, Y., and Courville, A. (2016). Deep learning. Cambridge, MA: MIT Press. Available at: http://www.deeplearningbook.org/.
Handwerger, A. L., Fielding, E. J., Huang, M. H., Bennett, G. L., Liang, C. R., and Schulz, W. H. (2019). Widespread initiation, reactivation, and acceleration of landslides in the northern California coast ranges due to extreme rainfall. J. Geophys. Res. Earth Surf. 124, 1782–1797. doi:10.1029/2019jf005035
Herrera, G., Gutiérrez, F., García-Davalillo, J. C., Guerrero, J., Notti, D., Galve, J. P., et al. (2013). Multi-sensor advanced DInSAR monitoring of very slow landslides: The Tena Valley case study (Central Spanish Pyrenees). Remote Sens. Environ. 128, 31–43. doi:10.1016/j.rse.2012.09.020
Hilley, G. E., Bürgmann, R., Ferretti, A., Novali, F., and Rocca, F. (2004). Dynamics of slow-moving landslides from permanent scatterer analysis. Science 304, 1952–1955. doi:10.1126/science.1098821
Hooper, A., Segall, P., and Zebker, H. (2007). Persistent scatterer interferometric synthetic aperture radar for crustal deformation analysis, with application to Volcán Alcedo, Galápagos. J. Geophys. Res. 112, 763. doi:10.1029/2006jb004763
Hu, X., Wang, T., Pierson, T. C., Lu, L., Kim, J., and Cecere, T. H. (2016). Detecting seasonal landslide movement within the Cascade landslide complex (Washington) using time-series SAR imagery. Remote Sens. Environ. 187, 49–61. doi:10.1016/j.rse.2016.10.006
Hu, X., Bürgmann, R., Fielding, E. J., and Lee, H. (2020). Internal kinematics of the Slumgullion landslide (USA) from high-resolution UAVSAR InSAR data. Remote Sens. Environ. 125. doi:10.1016/j.rse.2020.112057
Huang, X. C., Wang, M., Han, B., Yu, T,B., and Jiang, Y. (2020). Study on early identification of landslide hazard in mountain valley area based on InSAR and optical remote sensing technology. IOP Conf. Ser. Earth Environ. Sci. 570, 062047. doi:10.1088/1755-1315/570/4/042049
Hungr, O., Leroueil, S., and Picarelli, L. (2014). The Varnes classification of landslide types, an update. Landslides 11, 167–194. doi:10.1007/s10346-013-0436-y
Jia, H. G., Zhang, H., Liu, L. Y., and Liu, G. X. (2019). Landslide deformation monitoring by adaptive distributed scatterer interferometric synthetic aperture radar. Remote Sens. 11, 273. doi:10.3390/rs11192273
Jiang, H. J., Feng, G. C., Wang, T., and Bürgmann, R. (2017). Toward full exploitation of coherent and incoherent information in Sentinel-1 TOPS data for retrieving surface displacement: Application to the 2016 Kumamoto (Japan) earthquake. Geophys. Res. Lett. 44, 1758–1767. doi:10.1002/2016gl072253
Jin, H. Y., Chen, X. H., Wu, P., Song, C., and Xia, W. J. (2021). Evaluation of spatial-temporal distribution of precipitation in mainland China by statistic and clustering methods. Atmos. Res. 262, 105772. doi:10.1016/J.ATMOSRES.2021.105772
Kingma, D. P., and Ba, J. L. (2015). “Adam: A method for stochastic optimization,” in International conference on learning representations. Available at: https://arxiv.org/abs/1412.6980v9.
Lacroix, P., Bièvre, G., Pathier, E., Kniess, U., and Jongmans, D. (2018). Use of Sentinel-2 images for the detection of precursory motions before landslide failures. Remote Sens. Environ. 215, 507–516. doi:10.1016/j.rse.2018.03.042
Lanari, R., Mora, O., Manunta, M., Mallorqui, J. J., Berardino, P., and Sansosti, E. (2004). A small-baseline approach for investigating deformations on full-resolution differential SAR interferograms. IEEE Trans. Geosci. Remote Sens. 42, 1377–1386. doi:10.1109/tgrs.2004.828196
Li, M. H., Zheng, W. M., Shi, S. W., and Xie, Z. (2008a). The revival mechanism and stability analysis to jiaju landslide of danba county in sichuan province. J. Mt. Sci. 26 (5), 6. doi:10.3969/j.issn.1008-2786.2008.05.011
Li, M. H., Zheng, W. M., and Chen, Q. G. (2008b). Development characteristic of geological hazard in danba county and its cause discussion. J. Nat. Disasters 17 (1), 49–53. doi:10.3969/j.issn.1004-4574.2008.01.009
Liang, C. R., Liu, Z., Fielding, E. J., and Burgmann, R. (2018). InSAR time series analysis of L-band wide-swath SAR data acquired by ALOS-2. IEEE Trans. Geosci. Remote Sens. 56, 4492–4506. doi:10.1109/tgrs.2018.2821150
Liu, X. J., Zhao, C. Y., Zhang, Q., Zhong, L., Li, Z. H., Yang, C. S., et al. (2021). Integration of Sentinel-1 and ALOS/PALSAR-2 SAR datasets for mapping active landslides along the Jinsha River corridor, China. Eng. Geol. 284. doi:10.1016/j.enggeo.2021.106033
Murray, K. D., Bekaert, D. P. S., and Lohman, R. B. (2019). Tropospheric corrections for InSAR: Statistical assessments and applications to the Central United States and Mexico. Remote Sens. Environ. 232, 111326. doi:10.1016/j.rse.2019.111326
Novellino, A., Cigna, F., Sowter, A., Ramondini, M., and Calcaterra, D. (2017). Exploitation of the Intermittent SBAS (ISBAS) algorithm with COSMO-SkyMed data for landslide inventory mapping in north-western Sicily, Italy. Geomorphology 280, 153–166. doi:10.1016/j.geomorph.2016.12.009
Petley, D. (2012). Global patterns of loss of life from landslides. Geology 40, 927–930. doi:10.1130/g33217.1
Price, E. J., and Sandwell, D. T. (1998). Small-scale deformations associated with the 1992 Landers, California, earthquake mapped by synthetic aperture radar interferometry phase gradients. J. Geophys. Res. 103, 27001–27016. doi:10.1029/98jb01821
Redmon, J., Divvala, S., Girshick, R., and Farhadi, A. (2016). “You only look once: Unified, real-time object detection,” in Computer vision and pattern recognition, 779–788. doi:10.1109/cvpr.2016.91
Redmon, J., and Farhadi, A. (2017). “YOLO9000: Better, faster, stronger,” in Computer vision and pattern recognition, 6517–6525. doi:10.1109/cvpr.2017.690
Redmon, J., and Farhadi, A. (2018). YOLOv3: An incremental improvement. arXiv e-prints, arXiv:1804.02767.
Ren, S. Q., He, K. M., Girshick, R., and Sun, J. (2015). Faster R-CNN: Towards real-time object detection with region proposal networks. Adv. Neural Inf. Process. Syst. 28, 28. doi:10.1002/dac.2990
Rezatofighi, H., Tsoi, N., Gwak, J., Sadeghian, A., Reid, I., and Savarese, S. (2019). “Generalized intersection over union: A metric and a loss for bounding box regression,” in Computer vision and pattern recognition, 658–666. doi:10.1109/cvpr.2019.00075
Schaefer, L. N., Wang, T., Escobar-Wolf, R., Oommen, T., Lu, L., Kim, J., et al. (2017). Three-dimensional displacements of a large volcano flank movement during the May 2010 eruptions at Pacaya Volcano, Guatemala. Geophys. Res. Lett. 44, 135–142. doi:10.1002/2016gl071402
Stumpf, A., Malet, J.-P., and Delacourt, C. (2017). Correlation of satellite image time-series for the detection and monitoring of slow-moving landslides. Remote Sens. Environ. 189, 40–55. doi:10.1016/j.rse.2016.11.007
Szegedy, C., Vanhoucke, V., Ioffe, S., Shlens, J., and Wojna, Z. (2016). “Rethinking the inception architecture for computer vision,” in Computer vision and pattern recognition, 2818–2826. doi:10.1109/cvpr.2016.308
Tang, C., Zhang, G., Hu, H. G., Wei, P. B., Duan, Z., and Qian, Y. X. (2020). An improved YOLOv3 algorithm to detect molting in swimming crabs against a complex background. Aquac. Eng. 91, 115. doi:10.1016/j.aquaeng.2020.102115
Woo, S., Park, J., Lee, J.-Y., and Kweon, I. S. (2018). “Cbam: Convolutional block Attention module,” in European conference on computer vision, 3–19. doi:10.1007/978-3-030-01234-2_1
Wu, Z. P., Wang, T., Wang, Y. J., Wang, R., and Ge, D. Q. (2022). Deep learning for the detection and phase unwrapping of mining-induced deformation in large-scale interferograms. IEEE Trans. Geosci. Remote Sens. 60, 1–18. doi:10.1109/TGRS.2021.3121907
Xu, Q., Li, W. L., Ju, Y. Z., Dong, X. J., and Peng, D. L. (2020a). Multitemporal UAV-based photogrammetry for landslide detection and monitoring in a large area: A case study in the heifangtai terrace in the loess plateau of China. J. Mt. Sci. 17, 1826–1839. doi:10.1007/s11629-020-6064-9
Xu, X. H., Sandwell, D. T., and Smith-Konter, B. (2020b). Coseismic displacements and surface fractures from sentinel-1 InSAR: 2019 ridgecrest earthquakes. Seismol. Res. Lett. 91, 1979–1985. doi:10.1785/0220190275
Xu, A. D., Zhao, Y. H., Wang, T., Ren, C. M., and Yue, H. (2021). Small fractures caused by the 2019 ridgecrest earthquake sequence: Insights from 3D coseismic displacement and uniaxial loading rock experiments. Front. Earth Sci. 9, 809. doi:10.3389/feart.2021.672809
Zhang, L., Liao, M. S., Dong, J., Xu, Q., and Gong, J. Y. (2018). Early detection of landslide hazards in mountainous areas of west China using time series SAR interferometry——a case study of danba, sichuan. Geomatics Inf. ence Wuhan Univ. 43, 2039–2049. doi:10.13203/j.whugis20180181
Zhang, Q., Wang, T., Pei, Y., and Shi, X. (2021). Selective kernel res-attention UNet: Deep learning for generating decorrelation mask with applications to TanDEM-X interferograms. IEEE J. Sel. Top. Appl. Earth Obs. Remote Sens. 14, 8537–8551. doi:10.1109/jstars.2021.3105703
Zhang, Y., and Zhang, L. (2020). Snow cover identification and area change in mountainous regions based on Sentinel-2 time series data. Chin. J. Ecol. 39, 2810–2820. doi:10.13292/j.1000-4890.202008.026
Zhao, C. Y., Lu, L., Zhang, Q., and de la Fuente, J. d. l. (2012). Large-area landslide detection and monitoring with ALOS/PALSAR imagery data over Northern California and Southern Oregon, USA. Remote Sens. Environ. 124, 348–359. doi:10.1016/j.rse.2012.05.025
Zheng, Z. H., Wang, P., Liu, W., Li, J. Z., Ye, R. G., and Ren, D. W. (2020). Distance-IoU loss: Faster and better learning for bounding box regression. AAAI Conf. Artif. Intell. 34 (07), 12993–13000. doi:10.1609/aaai.v34i07.6999
Zhu, Z., and Woodcock, C. E. (2012). Object-based cloud and cloud shadow detection in Landsat imagery. Remote Sens. Environ. 118, 83–94. doi:10.1016/j.rse.2011.10.028
Keywords: multi-temporal InSAR, phase-gradient stacking, attention-YOLOv3, landslide detection, geohazards
Citation: Fu L, Zhang Q, Wang T, Li W, Xu Q and Ge D (2022) Detecting slow-moving landslides using InSAR phase-gradient stacking and deep-learning network. Front. Environ. Sci. 10:963322. doi: 10.3389/fenvs.2022.963322
Received: 07 June 2022; Accepted: 27 July 2022;
Published: 31 August 2022.
Edited by:
Alexander Kokhanovsky, Max Planck Institute for Chemistry, GermanyCopyright © 2022 Fu, Zhang, Wang, Li, Xu and Ge. This is an open-access article distributed under the terms of the Creative Commons Attribution License (CC BY). The use, distribution or reproduction in other forums is permitted, provided the original author(s) and the copyright owner(s) are credited and that the original publication in this journal is cited, in accordance with accepted academic practice. No use, distribution or reproduction is permitted which does not comply with these terms.
*Correspondence: Teng Wang, d2FuZy50ZW5nQHBrdS5lZHUuY24=
Disclaimer: All claims expressed in this article are solely those of the authors and do not necessarily represent those of their affiliated organizations, or those of the publisher, the editors and the reviewers. Any product that may be evaluated in this article or claim that may be made by its manufacturer is not guaranteed or endorsed by the publisher.
Research integrity at Frontiers
Learn more about the work of our research integrity team to safeguard the quality of each article we publish.