 Qian Liu
 Anusha Srirenganathanmalarvizhi1,2
 Chaowei Yang
94% of researchers rate our articles as excellent or good
Learn more about the work of our research integrity team to safeguard the quality of each article we publish.
Find out more
ORIGINAL RESEARCH article
Front. Environ. Sci., 14 July 2022
Sec. Environmental Informatics and Remote Sensing
Volume 10 - 2022 | https://doi.org/10.3389/fenvs.2022.962891
This paper analyzes the spatiotemporal patterns of nitrogen dioxide (NO2) tropospheric vertical column densities (TVCDs) before and during the second wave of COVID-19 in India. The results indicate that the NO2 columns increase significantly in the reopening period before the second wave (Mar. 1 ∼ Apr. 20) in 2021, which exceed the levels of the same period in 2019. The relative difference from the mean of 2010–2019 is 18.76% higher in 2021 than that of 2019, during the reopening. The paper identifies Odisha, Madhya Pradesh, Chhattisgarh, Jharkhand and West Bengal as the five states with the largest increases in relative difference from 2019 to 2021, which are 33.81%, 29.83%, 23.86%, 30.01%, and 25.48% respectively. As illustrated by trends in the indices of industrial production (IIP), these unexpected increases in tropospheric NO2 can be attributed to reopening as well as elevated production across various sectors including electricity, manufacturing and mining. Analysis of NO2 TVCD levels alongside IIPs indicate a marked increase in industrial activity during the reopening period in 2021 than in the same time period in 2019. After the beginning of the second wave of COVID-19 (Apr. 21 ∼ Jun. 21), India re-implemented lockdown policies to mitigate the spread of the pandemic. During this period, the relative difference of total NO2 columns declined in India as well as in most individual study regions, when compared to 2019, due to the pandemic mitigation policies. The relative declines are as follows: 6.43% for the whole country and 14.25%, 22.88%, 4.57% and 7.89% for Odisha, Madhya Pradesh, Chhattisgarh and Jharkhan, respectively, which contain large industrial clusters. The change in relative difference in West Bengal from 2019 to 2021 is not significant during the re-lockdown period with a 0.04% increase. As with the first wave, these decreases in NO2 TVCD mainly due to the mitigation policies during the second wave.
The COVID-19 outbreak has brought unprecedented global changes since it was firstly reported at the end of 2019. India remains one of the most severely impacted countries across the globe, experiencing an even fiercer second wave in the first half of 2021 than that of 2020 (Dong et al., 2020). At the beginning of 2021, in response to decreasing COVID-19 cases, India gradually lifted mitigation policies and began to reopen its economy (Hale et al., 2021). However, COVID-19 infection rates started increasing again in April 2021, reaching a peak at the beginning of May 2021. To combat this second wave, the Indian government implemented prevention policies again and halted the reopening of the economy (Hale et al., 2021). This pattern of policy shifts and restrictions have crucial impacts on not only the Indian economy, but on the environment as well. Among environmental factors, tropospheric Nitrogen Dioxide (NO2) is one of the most important indicators of industrial production and transportation (Savtchenko and Khayat, 2021) as it is primarily emitted from fossil fuel consumption (Lu et al., 2019) and relatively short-lived in the atmosphere, thus remaining relatively close to its sources. NO2 tropospheric vertical column density (TVCD) retrieved from backscattered solar radiation observed by satellite sensors, such as the Ozone Monitoring Instrument (OMI) (Russell et al., 2012), has been widely used to monitor both long- and short-term changes in fuel consumption (Mijling et al., 2009; Duncan et al., 2015) including those introduced by COVID-19 mitigation policies all around the world (Pacheco et al., 2020).
Many recent studies have focused on NO2 changes introduced by COVID-19 first wave economic shutdowns and stay-at-home orders in India and around the world, illustrating that the NO2 levels reduced significantly due to these mitigation policies mitigation policies (Liu et al., 2020a; Bauwens et al., 2020; Liu et al., 2021a; Liu et al., 2021b; Nigam et al., 2021). Additionally, a few studies have illustrated the impact of the second wave of COVID-19 on air quality. A Conwave report (Concawe, 2021) demonstrated that the second wave lockdown was not as effective in reducing NO2 concentrations as similar measures corresponding to the first lockdown period in Europe. Some news sources have also reported that air pollution levels decreased during the second wave of COVID-19 over some regions. PM2.5 decreased by 42% during the second wave in Delhi, India compared to same period of 2019 (Kunal, 2021). It has also been noted that NO2 pollution in London showed less reduction during the second lockdown in London than the first one (Roncoroni, 2021). However, there has been little systematic research so far into tracking tropospheric NO2 shifts associated with both the economic reopening and recent second-wave prevention policies in India. Have NO2 TVCDs bounced back, or are they even exceeding pre-pandemic levels in India? Have mitigation efforts during the second wave had the same effects on NO2 columns as the first wave? These questions are of critical importance in India specifically, as air pollution levels–including tropospheric NO2—are some of the highest in the world resulting in 1.67 million deaths in 2019 (Pandey et al., 2021). Additionally, as NO2 spikes are usually a direct result of transportation and industrial production (Kim et al., 2013), which are often associated with human mobility and activity, policymakers can understand NO2 patterns as a proxy for human behaviors that might potentially increase COVID-19 risk. Although more and more people are fully vaccinated in many countries of the world and the strict pandemic mitigation policies are lifted in many regions nowadays, the COVID-19 still causes severe symptoms to those vulnerable communities and groups. Furthermore, some other countries are still executing strict lockdown and quarantine policies. Therefore, answers to these questions are crucial from the perspective of population and environmental health, as well as from an economic standpoint. Bolstering our understanding of the link between COVID-19 mitigation policies and NO2 levels in India will allow people to realize the potential of environmental regulations in rapidly improving air quality, and understand the connection between COVID-era public health concerns, economic activity, and the natural environment. These findings are vital to Indian policymaking as both environmental and pandemic threats continue to heighten and offer valuable reference for the influences in other countries. Therefore, this paper analyzes the spatiotemporal patterns of NO2 TVCD during the economic reopening and ‘re-lockdown’ periods associated with the second wave of COVID-19 in India. Post-pandemic patterns are then compared to that of 2019 to contextualize how shifts in behavior dictated by policies might be affecting these levels.
The rest of this paper is organized as follows: data and analytical methods are illustrated in section 2; section 3 introduces the statistical results, and discussions and conclusions are given in section 4.
The paper uses the Nitrogen Dioxide Product (OMNO2d) generated from the Ozone Monitoring Instrument (OMI) aboard NASA’s Earth Observing System’s (EOS) Aura satellite to quantitatively analyze the NO2 TVCDs in India. It is a level-3 product derived from pixel-level data with good quality which are then averaged into 0.25° global grids at a daily temporal resolution (Krotkov et al., 2016). This product contains NO2 TVCDs under all atmospheric conditions. This product contains NO2 TVCDs under all atmospheric conditions. And pixels with cloud coverage larger than 30% are screened and filtered in the data collection.
In addition to satellite observation of NO2 TVCDs, the paper also uses political and economic data to investigate the connection between NO2 columns, policy index and industrial production levels. India’s mitigation policy stringency data is provided by the Oxford COVID-19 Government Response Tracker2, which aims to track and compare policy responses around the world. And the indices of industrial production (IIP) for electricity, manufacturing and mining are downloaded from the Indian Ministry of Statistics and Programme Implementation website (http://mospi.nic.in/iip#). They are used to analyze the potential sources of NO2 patterns. The IIP is a measure that indicates output from different industrial sectors (Miron and Romer, 1990). It measures levels of production and capacity in sectors such as manufacturing, mining, electric, and gas industries, relative to a base year (Kenton, 2021). A higher monthly electricity index, for example, illustrates an increase in total production from the electric sector.
According to the COVID-19 stringency index shown in Supplementary Figure S1, India lifted most of the COVID-19 mitigation orders in March 2021 and tightened mitigation policies in late April when cases again began to rise (Hale et al., 2021). Accordingly, the paper divides the study period into two stages: the reopening period, Mar. 1 ∼ Apr. 20, when regulatory policies were eased; and the re-lockdown period, Apr. 21 ∼ Jun. 21, when these policies were again implemented. Additionally, the 10-years mean (2010–2019) of Indian NO2 TVCD is calculated, and pixels with annual averages less than 1 × 10¹⁵ mol/cm2 are excluded from all spatiotemporal analysis (Liu et al., 2020b; Liu et al., 2021b). Levels below this benchmark are considered not to be dominated by anthropogenic sources.
Changes in NO2 TVCD cannot be conclusively derived without adjusting for long-term trends (Misra et al., 2021). To account for this, we explore the NO2 spatiotemporal patterns associated with the second wave of COVID-19 by firstly computing the average NO2 TVCD of the two periods over OMI grid boxes in India for 2021 (
By using pixel values throughout the study period, the mean relative differences in each individual state as well as in India as a whole are computed. Next, the five states with the highest relative difference during the reopening period from 2019 to 2021 are selected for further analysis. We utilize the administration-boundary vector of each state and India to extract the OMI pixels within the specific region.
Additionally, in order to investigate the temporal patterns of tropospheric NO2 associated with the second wave in India, we firstly calculate the spatial mean of daily NO2 TVCD for 2021, 2019 and the mean of 2010–2019 over India, and each individual selected state through the study period (Mar. 1 ∼ Jun. 21). Then, the 7-days running averages of these three timeseries are calculated to smooth out fluctuations.
The calculation procedure is summarized in Figure 1.
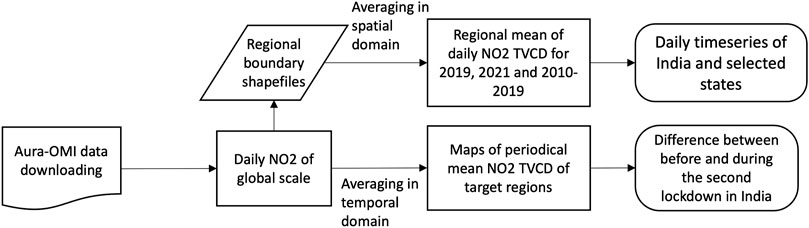
FIGURE 1. Flowchart of the spatiotemporal analysis procedure.
Across all states in India Odisha, West Bengal, Chhattisgarh, Madhya Pradesh and Jharkhand display the highest increases in relative difference from 2019 to 2021. Supplementary Table S1 demonstrates the relative differences from the mean of 2010–2019 in 2021 and 2019 during the reopening and re-lockdown periods over India and selected states. During the reopening stage from Mar.1∼Apr.20, the relative difference (±1
Later on, when pandemic regulations are gradually re-implemented by the end of April 2021, tropospheric NO2 reduces significantly. Across India and in most individual study states, decreasing relative differences are found during the re-lockdown period of the second wave, with a 6.43% decline for the whole country and 14.25%, 22.88%, 7.89%, and 4.57% declines for Odisha, Chhattisgarh, Jharkhand and Madhya Pradesh, individually. In addition, all decreased relative differences are statistically significant (above 0.01 significance level). One exception is West Bengal, where the data shows a statistically insignificant increase of 0.04% 2019 to 2021. However, considering that the 25.48% increase in NO2 TVCD from 2019 to 2021 during the reopening period, NO2 levels still drop by more than 25% following to re-lockdown policies (from 25.48% to 0.04%). Whereas, the overall reduction in India is smaller than that of the first wave in the research of Liu et al.12, which shows a ∼10% decrease for the entire country. The decreases in NO2 TVCD are due to the economic shutdown, as illustrated by comparing 2021 IIPs in May with those of 2019. The IIP of manufacturing is 16.42% lower in 2021 than in 2019, followed by declines experienced by the electricity and mining sectors of 8.48% and 1.91%. However, when compared with the 2020 IIP data, the 2021 values increase by 34.48%, 23.29% and 7.50% in May for manufacturing, mining and electricity respectively. This explains why the NO2 TVCDs decreases more during the first wave than in the second wave in India (10% vs. 6.43%). These increases in industrial productions have two causes: firstly, according to the investigation of Kar et al. (Kar et al., 2021), mitigation policies conducted during the second wave in India are not as stringent as those of the first wave. This has been cited as a result of increased administrative barriers, and thus weaker coordination between state and national institutes, leading to inadequate responses to the second wave (Kar et al., 2021). Secondly, essential industrial activity, such as vaccine production, could be another contributing element to increased industrial output during the second wave (Frayer, 2021). As mentioned in the introduction section, the second wave mitigation policies in Europe are also found to be not as effective as the first wave in reducing NO2 levels.
To further confirm the overall changes in tropospheric NO2 during the reopening and re-lockdown period, this study investigates the percentiles of 2021 and 2019 data during the two periods for each study region. Figure 2 presents the box plots of relative difference during the reopening (Mar. 1∼Apr. 20, Figure 2A) and re-lockdown period (Apr. 21 ∼ Jun. 21, Figure 2B) in 2021 and 2019. The dots indicate outliers in the data, which are identified by the interquartile range (IQR) method. The IQR is Q3-Q1 (difference between 75th percentile and 25th percentile), and any observations that are less than 1.5 times the IQR below Q1 or more than 1.5 times of IQR above Q3 are considered outliers. By comparing the box and whisker plots of 2021 and 2019, it becomes clear that all the percentiles of relative differences in 2021 are above those in 2019 during the reopening period in India and selected states. These significant increases in tropospheric NO2 correspond closely to the period of economic reopening. During the re-lockdown period, the 2021 boxes and whiskers of India and most study states fall below or back to 2019 levels during the re-lockdown period.
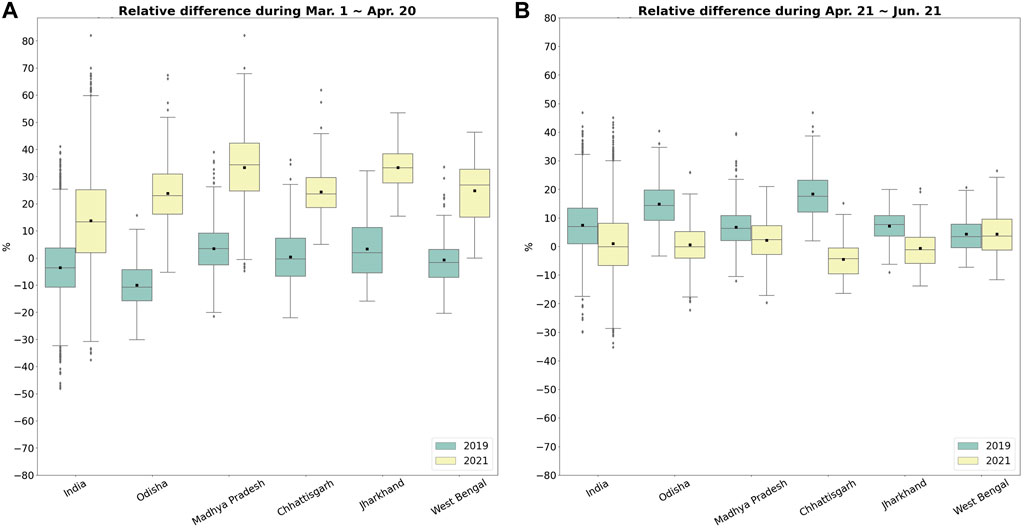
FIGURE 2. Box plots of NO2 relative difference from 10-years mean during (A) Mar. 1∼Apr. 20 and (B) Apr. 21∼Jun. 21 in 2021 and 2019. The dots indicate outliers in the data, which are identified by the interquartile range (IQR) method.
Figure 3 depicts the spatial distributions of NO2 TVCD relative differences during the reopening (Mar. 1∼Apr. 20, Figures 3A–C) period and re-lockdown (Apr. 21∼ Jun. 21, Figures 3D–F) period in 2021 and 2019. During the reopening period of 2019, most regions in northern and southern India show decreasing relative differences from the 10-years mean. Positive relative differences are distributed only over central India: in Madhya Pradesh, on the border of Uttar Pradesh and Bihar, in Jharkhand and in Chhattisgarh (Figure 3A). However, during the same period in 2021, the relative differences from the 10-years mean increase significantly over the majorities of central and eastern India (Figure 3B). The difference between 2021 and 2019 relative differences during the reopening, as exhibited in Figure 3C, show substantial increases in relative difference across almost all of the states in India, except a few sparse regions in the southern, northeastern and western corners. The regions with the largest increase in NO2 columns are concentrated in central India. As shown in Supplementary Figure S3, some of India’s major industrial clusters are located within these areas, including coal fields, major industrial districts in Odisha and Chhattisgarh, and evolving central industrial districts (Bhargava, 2015). Increased production in these industrial regions can be considered a major cause of high NO2 columns during reopening. While these regions show significantly changes in NO2 columns, large cities such as Delhi do not show such significant increases, indicating that other NO2 producing activities such as transportation have not increased much compared to 2019.
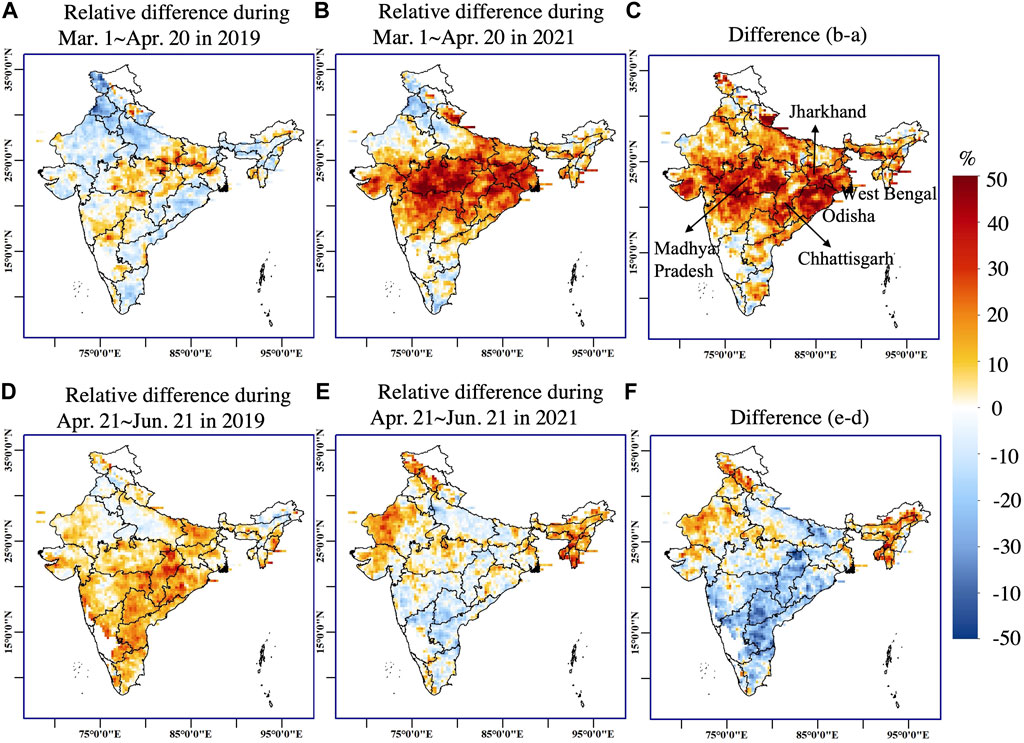
FIGURE 3. Spatial distributions of NO2 TVCD relative change during Mar. 1∼Apr. 20 in 2019 (A) and 2021 (B), and their difference (C); and during Apr. 21∼Jun. 21 in 2019 (D) and 2021 (E), and their difference (F). Pixels with 10-years means smaller than 1 ×10¹⁵ molec/cm2 are not plotted in the maps.
Further investigation into states with the most extreme NO2 increases give further insight into the why India on the whole experienced such marked NO2 spikes during reopening. Among the study states, Odisha had the largest increase in relative difference during the reopening phase from its 2019 level, at about 34%. Odisha has a history of poor air quality due to containing of a significant “industrial belt”, and is the largest producer of steel in the country, with a major plant in the city Rourkela (Government of Odisha, 2021). The dramatic increase in NO2 columns during reopening makes sense, given that we expect major resumption of industrial activities in a highly industrial region to contribute significant NO2 to the atmosphere. In Madhya Pradesh as well, industrial and commercial activities have increased in 2021 to make up for economic losses due to the pandemic throughout the previous year (TNN, 2021). Using these more extreme cases as a jumping off point–looking at changes in industrial production, as well as transportation trends before and after major lockdowns throughout 2020—can provide some explanation for these major fluctuations in NO2 levels across India.
In the re-lockdown period during the second wave of COVID-19, the majority of India demonstrates a decrease in relative difference from 2019 to 2021. As discussed in many previous studies, the shutdown of non-essential industry and quarantine orders reduce NO2 columns over industrial and transportation regions in India (Biswal et al., 2020; Biswas and Choudhury, 2020; Liu et al., 2021b). However, exceptions are found over the northwestern and northeastern edges, with NO2 TVCDs increasing in 2021 compared to 2019. This could be due to the fact that there are nearly no major industrial clusters within these two regions (Supplementary Figure S3), and therefore decreased industrial production would not have a significant impact on NO2 emission in these areas.
Figure 4 shows the 7-days moving average of NO2 TVCD alongside new daily COVID-19 cases over the study regions for 2021, 2019 as well as for the mean values for each day in 2010–2019. A significance level is calculated for the difference of 2021 and 2019 timeseries data for the two study periods. During the reopening period, the differences between the timeseries of 2021 and 2019 data across all study regions pass the 0.01 significance level (Figure 4). In other words, the NO2 TVCD is significantly higher in 2021 than 2019 in India and all the selected states. By comparing the 2021 timeseries of NO2 TVCD and daily confirmed new cases for the entire study period, COVID-19 cases can be expected to increase since NO2 columns start to reach a peak. This qualitative relationship is supported by the fact that the peaks of NO2 TVCD boosts are 1–1.5 months earlier than the spike of the second wave of COVID-19 across all study regions. These close connection between NO2 TVCD trends and the spread of the pandemic indicate that the economic and city re-openings have contributed greatly to the second outbreak of the virus. During the reopening period, political rallies, religious gatherings, festivals, and celebrations were held across India, in addition to increased industrial production (Biswas, 2021). Given these activities rely on transportation - thus leading to increased NO2 emission, while concurrently leading to closer contact and high COVID-19 risk–trends in NO2 TVCDs are a potential indicator of the spread of COVID-19.
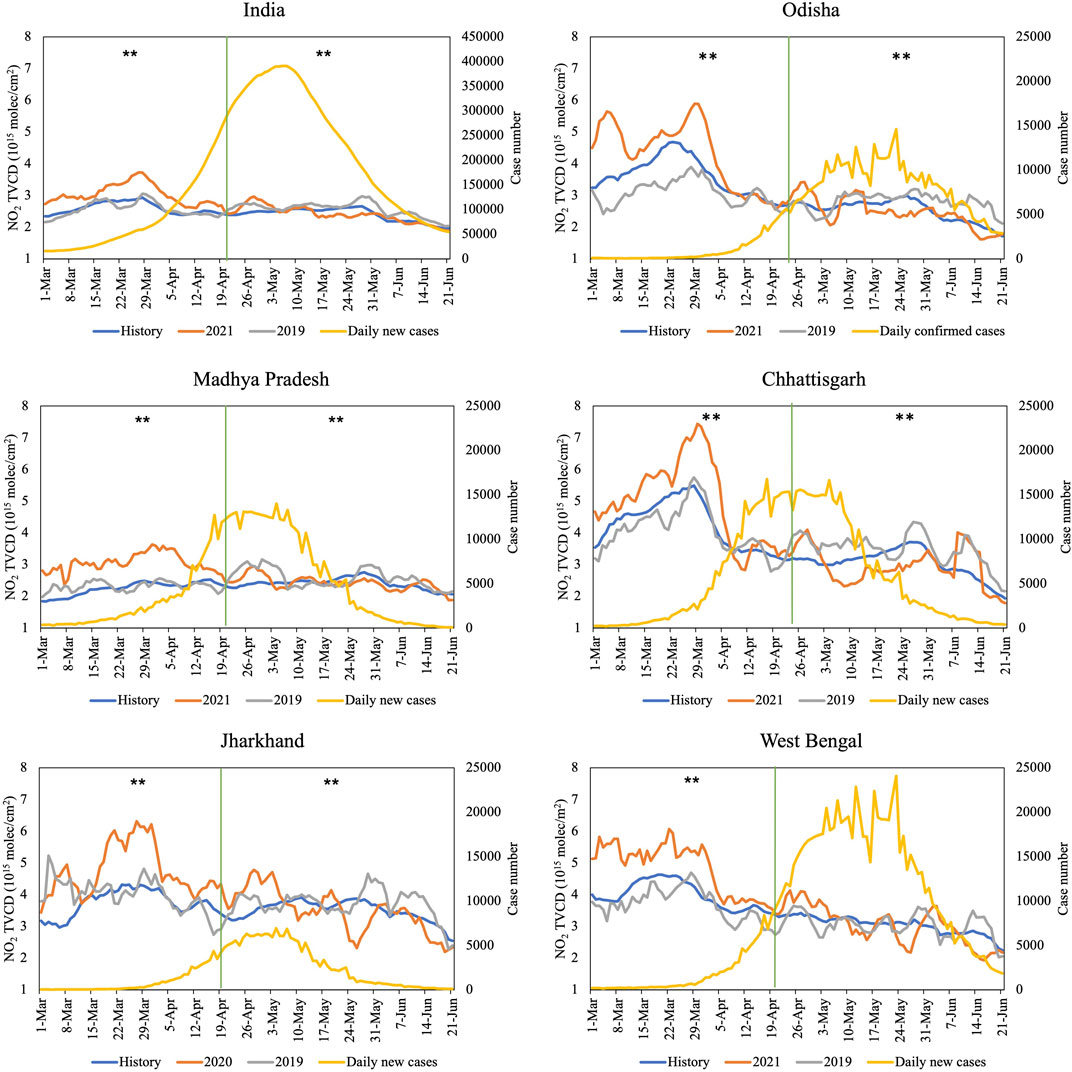
FIGURE 4. Seven-day moving averages of NO2 TVCD and daily new cases of COVID-19 over India and industrial states for 10-years mean (history), 2021 and 2019. ** indicates significant difference between 2021 and 2019 timeseries for each period at the 0.01 level (bilateral), and * indicates significant difference at the 0.05 level (bilateral). Points represent the midpoint of the 7-days interval. The vertical green-line indicates the start of the re-lockdown.
When lockdown orders commence around Apr. 20, 2021, the NO2 TVCD decreases significantly in most of the study regions (Figure 4). Consistent with the overall changes in relative differences discussed in section 3.1, the timeseries of 2021 is generally lower than 2019 during the re-lockdown period. However, although the impact of economic shutdown on NO2 TVCD during the second wave is in generally comparable with that of the first wave, the “speed” of NO2 response to these mitigation policies is much slower. The NO2 levels fall below the 2019 data right after the lockdown is implemented during the first wave (Liu et al., 2021b), whereas the distribution of NO2 columns starts to fall below the 2019 timeseries about 20 days after shutdown policies are implemented in the second wave. This delay in NO2 response is most likely due to the more lax execution of quarantine orders in response to the second wave, compared to very severe lockdowns imposed during the first wave (Chandra, 2021). Besides more lenient restrictions, increased essential industrial production, such as COVID-19 vaccine manufacturing, is another potential reason why NO2 TVCDs do not drop as quickly as they did following the first wave lockdown (Frayer, 2021).
This paper investigates the spatiotemporal patterns of NO2 TVCD before and during the second wave of COVID-19 in 2021 over India, and compares these results with the same period of 2019 and means of 2010–2019. During the reopening period in March and April of 2021, NO2 TVCD significantly increased over the majority of the country, specifically in states such as Odisha, West Bengal, Chhattisgarh, Madhya Pradesh and Jharkhand. Some of these states are home to major industrial clusters. As indicated by the analysis of indices of industrial production (IIP), higher levels of tropospheric NO2 are mainly caused by significant increases in industrial activity from 2019 to 2021. Since re-lockdown policies are implemented at the end of April 2021, the NO2 TVCDs decrease past 2019 levels. The overall reduction in NO2 during the second wave of COVID-19 is smaller than the first wave, and the response speed is relatively slow, with NO2 TVCDs dropping nearly 20 days after orders are imposed, whereas following the first wave, NO2 trends drop below those of 2019 immediately after the lockdown is imposed. These smaller declines in NO2 relative differences and delay in the response of NO2 patterns can be explained by a smaller reduction of industrial production during the second wave lockdown (Supplementary Figure S2), as well as the inexhaustive mitigation policies.
The extreme increase in industrial output during the reopening period, makes sense given that demand for coal and manufactural production is predicted to skyrocket throughout 2021 and the coming years, as electricity requirements continue to rise (FE Bureau, 2021). Due to these higher demands in industrial production, NO2 emissions are much higher during reopening period in 2021 than in 2019. As noted above in the context of Odisha and Madhya Pradesh, it is likely that states with large industrial centers are intentionally ramping up production to stimulate economic activity and job support amidst the economic recession that India is facing. Weaker mitigation policies following the second wave, are therefore not having the same effect on NO2 industrial emissions as they did in the first lockdown.
By comparing trends of tropospheric NO2 and COVID-19 infections, significant increases in NO2 columns are found right before the rebound of the pandemic. High tropospheric NO2 can reflect vibrant industrial activities, as well as transportation that signifies frequent close contact and increased spread of COVID-19. Therefore, the NO2 pattern can be considered an indicator of activities that could lead to an outbreak of the virus. In addition to public health concerns, these trends in NO2 concentration throughout different phases of the COVID-19 pandemic are crucial to policymakers as air quality in India continues to worsen. While the causes of this NO2 spike during economic reopening in India are provisional, increases in industrial production do indicate increased demand for things such as electricity. Thus, NO2 concentration levels, among other indications of reopening, should be understood as a sign of human activity approaching pre-pandemic normalcy. From a COVID-19 mitigation perspective, policymakers should be wary of these patterns, especially in light of another potential wave of COVID-19.
Although this paper considered a 10-years climatology to smooth out the influence introduced from seasonal variations, there are still some other potential parameters which may influence the patterns and trends of NO2 emissions, such as human mobilities, inner-city transportation and geographical changes. In the future, we will conduct more detailed study on these factors to isolate the influence of COVID-19 mitigation efforts more accurately.
Publicly available datasets were analyzed in this study. This data can be found here: https://disc.gsfc.nasa.gov/datasets/OMNO2_003/summary.
QL initial manuscript writing, methodology, formal analysis, writing the original draft. AS visualization and data analysis. KH review and writing discussion section. CY funding acquisition, methodology, supervising, review.
NSF, 1835507, I/UCRC: Collaborative Research: Center for Spatiotemporal Thinking Computing and Applications, funded the salary of the author NSF, 1841520, Phase II I/UCRC [George Mason University]: Center for Spatiotemporal Thinking, Computing and Applications, funded the salary of the author.
The authors declare that the research was conducted in the absence of any commercial or financial relationships that could be construed as a potential conflict of interest.
All claims expressed in this article are solely those of the authors and do not necessarily represent those of their affiliated organizations, or those of the publisher, the editors and the reviewers. Any product that may be evaluated in this article, or claim that may be made by its manufacturer, is not guaranteed or endorsed by the publisher.
The first author (QL) acknowledges the fnancial support provided by the NSF Spatiotemporal Innovation Center Covid-19 Rapid Response Task Force.
The Supplementary Material for this article can be found online at: https://www.frontiersin.org/articles/10.3389/fenvs.2022.962891/full#supplementary-material
Bauwens, M., Compernolle, S., Stavrakou, T., Müller, J. F., Van Gent, J., Eskes, H., et al. (2020). Impact of Coronavirus Outbreak on NO2 Pollution Assessed Using TROPOMI and OMI Observations. Geophys Res. Lett. 47 (11), e2020GL087978. doi:10.1029/2020GL087978
Bhanarkar, A., Goyal, S., Sivacoumar, R., and Chalapatirao, C. (2005). Assessment of Contribution of SO and NO from Different Sources in Jamshedpur Region, India. Atmos. Environ. 39 (40), 7745–7760. doi:10.1016/j.atmosenv.2005.07.070
Bhargava (2015). Manufacturing Industries in India: Major Industrial Regions. Available at: https://discover.hubpages.com/education/Manufacturing-Industries-In-India-Major-Industrial-Regions (Accessed date August 6, 2021).
Biswal, A., Singh, T., Singh, V., Ravindra, K., and Mor, S. (2020). COVID-19 Lockdown and its Impact on Tropospheric NO2 Concentrations over India Using Satellite-Based Data. Heliyon 6 (9), e04764. doi:10.1016/j.heliyon.2020.e04764
Biswas, M. S., and Choudhury, A. D. (2020). Impact of COVID-19 Control Measures on Trace Gases (NO2, HCHO and SO2) and Aerosols over india during Pre-monsoon of 2020. Taipei: Aerosol and Air Quality Research.20
Biswas, S. (2021). Covid-19: How India Failed to Prevent a Deadly Second Wave. BBC News. Available at: https://www.bbc.com/news/world-asia-india-56771766 (Accessed date August 6, 2021).
Chakraborty, P., Jayachandran, S., Padalkar, P., Sitlhou, L., Chakraborty, S., Kar, R., et al. (2020). Exposure to Nitrogen Dioxide (NO2) from Vehicular Emission Could Increase the COVID-19 Pandemic Fatality in India: A Perspective. Bull. Environ. Contam. Toxicol. 105 (2), 198–204. doi:10.1007/s00128-020-02937-3
Chandra, S. (2021). Why India’s Second COVID Surge Is So Much Worse Than the First, Scientific American. Available at: https://www.scientificamerican.com/article/why-indias-second-covid-surge-is-so-much-worse-than-the-first/(Accessed date July 27, 2021).
Concawe (2021). How Covid-19 Lockdown Affected Air Pollution in Europe —a Multi-City Analysis, Scientific American. Concawe Review. Available at: https://www.concawe.eu/wp-content/uploads/2.-How-Covid-19-lockdown-affected-air-quality.pdf (Accessed date July 27, 2021).30
Dong, E., Du, H., and Gardner, L. (2020). An Interactive Web-Based Dashboard to Track COVID-19 in Real Time. Lancet Infect. Dis. 20 (5), 533–534. doi:10.1016/s1473-3099(20)30120-1
Duncan, B. N., Lamsal, L. N., Thompson, A. M., Yoshida, Y., Lu, Z., Streets, D. G., et al. (2015). “A Space-Based, High-Resolution View of Notable Changes in Urban and Regional NO X Pollution Around the World (2005-2014),” in AGU Fall Meeting Abstracts, 2015, A23N–A04.
Fe Bureau, (2021). India CO2 Emission Set to Pass 2019 Levels in 2021 Financial Express. Available at: https://www.financialexpress.com/industry/india-co2-emission-to-surpass-2019-levels-in-2021-iea/2237685/(Accessed date July 27, 2021).
Frayer, L. (2021). India Is The World's Biggest Vaccine Maker. Yet Only 4% of Indians Are Vaccinated. Available at: https://www.npr.org/sections/goatsandsoda/2021/06/29/1011022472/india-is-the-worlds-biggest-vaccine-maker-yet-only-4-of-indians-are-vaccinated (Accessed date August 6, 2021).
Government of India (2021). IIP Data. Available at: http://mospi.nic.in/iip# (Accessed Date August 2, 2021).
Government of Odisha (2021). Planning and Convergence Department. Available at: http://www.desorissa.nic.in/pdf/Odisha%20Economic%20Survey%202020-21-1.pdf (Accessed Date August 2, 2021).
Hale, T., Angrist, N., Goldszmidt, R., Kira, B., Petherick, A., Phillips, T., et al. (2021). A Global Panel Database of Pandemic Policies (Oxford COVID-19 Government Response Tracker). Nat. Hum. Behav. 5 (4), 529–538. doi:10.1038/s41562-021-01079-8
Kar, S. K., Ransing, R., Arafat, S. M. Y., and Menon, V. (2021). Second Wave of COVID-19 Pandemic in India: Barriers to Effective Governmental Response. EClinicalMedicine 36, 100915. doi:10.1016/j.eclinm.2021.100915
Kenton, W. (2021). Industrial Production Index (IPI). Investopedia. Available at: https://www.investopedia.com/terms/i/ipi.asp#:∼:text=The%20industrial%20production%20index%20(IPI)%20measures%20levels%20of%20production%20and,the%20end%20of%20every%20March (Accessed date July 27, 2021).
Kim, N. K., Kim, Y. P., Morino, Y., Kurokawa, J.-i., and Ohara, T. (2013). Verification of NOx Emission Inventory over South Korea Using Sectoral Activity Data and Satellite Observation of NO2 Vertical Column Densities. Atmos. Environ. 77, 496–508. doi:10.1016/j.atmosenv.2013.05.042
Krotkov, N. A., McLinden, C. A., Li, C., Lamsal, L. N., Celarier, E. A., Marchenko, S. V., et al. (2016). Aura OMI Observations of Regional SO<sub>2</sub> and NO<sub>2</sub> Pollution Changes from 2005 to 2015. Atmos. Chem. Phys. 16 (7), 4605–4629. doi:10.5194/acp-16-4605-2016
Kunal, K. (2021). Delhi Breathes Easy as Covid-19 Lockdown Lowers Pollution Levels Again. India Today. Available at: https://www.indiatoday.in/cities/delhi/story/delhi-breathes-easy-as-covid-19-lockdown-lowers-pollution-levels-again-1810546-2021-06-03 (Accessed date July 27, 2021).
Liu, F., Page, A., Strode, S. A., Yoshida, Y., Choi, S., Zheng, B., Lamsal, L. N., Li, C., Krotkov, N. A., Eskes, H., van der A, R., Veefkind, P., Levelt, P. F., Hauser, O. P., and Joiner, J. (2020). Abrupt Decline in Tropospheric Nitrogen Dioxide over China after the Outbreak of COVID-19. Sci. Adv. 6 (28), eabc2992. doi:10.1126/sciadv.abc2992
Liu, Q., Harris, J. T., Chiu, L. S., Sun, D., Houser, P. R., Yu, M., et al. (2021a). Spatiotemporal Impacts of COVID-19 on Air Pollution in California, USA. Sci. Total Environ. 750, 141592. doi:10.1016/j.scitotenv.2020.141592
Liu, Q., Malarvizhi, A. S., Liu, W., Xu, H., Harris, J. T., Yang, J., et al. (2021b). Spatiotemporal Changes in Global Nitrogen Dioxide Emission Due to COVID-19 Mitigation Policies. Sci. Total Environ. 776, 146027. doi:10.1016/j.scitotenv.2021.146027
Liu, Q., Sha, D., Liu, W., Houser, P., Zhang, L., Hou, R., et al. (2020). Spatiotemporal Patterns of COVID-19 Impact on Human Activities and Environment in Mainland China Using Nighttime Light and Air Quality Data. Remote Sens. 12 (10), 1576. doi:10.3390/rs12101576
Lu, H., Yao, A., Yao, C., Chen, C., and Wang, B. (2019). An Investigation on the Characteristics of and Influence Factors for NO2 Formation in Diesel/methanol Dual Fuel Engine. Fuel 235, 617–626. doi:10.1016/j.fuel.2018.08.061
Mijling, B., Van Der A, R. J., Boersma, K. F., Van Roozendael, M., De Smedt, I., and Kelder, H. M. (2009). Reductions of NO2 Detected from Space during the 2008 Beijing Olympic Games. Geophys. Res. Lett. 36 (13), 103. doi:10.1029/2009gl038943
Miron, J. A., and Romer, C. D. (1990). A New Monthly Index of Industrial Production, 1884-1940. J. Eco. Hist. 50 (2), 321–337. doi:10.1017/s0022050700036469
Misra, P., Takigawa, M., Khatri, P., Dhaka, S. K., Dimri, A. P., Yamaji, K., et al. (2021). Nitrogen Oxides Concentration and Emission Change Detection during COVID-19 Restrictions in North India. Sci. Rep. 11 (1), 1–11. doi:10.1038/s41598-021-87673-2
Nigam, R., Pandya, K., Luis, A. J., Sengupta, R., and Kotha, M. (2021). Positive Effects of COVID-19 Lockdown on Air Quality of Industrial Cities (Ankleshwar and Vapi) of Western India. Sci. Rep. 11 (1), 1–12. doi:10.1038/s41598-021-83393-9
Pacheco, H., Díaz-López, S., Jarre, E., Pacheco, H., Méndez, W., and Zamora-Ledezma, E. (2020). NO2 Levels after the COVID-19 Lockdown in Ecuador: A Trade-Off between Environment and Human Health. Urban Clim. 34, 100674. doi:10.1016/j.uclim.2020.100674
Pandey, A., Brauer, M., Cropper, M. L., Balakrishnan, K., Mathur, P., Dey, S., et al. (2021). Health and Economic Impact of Air Pollution in the States of India: the Global Burden of Disease Study 2019. Lancet Planet. Health 5 (1), e25–e38. doi:10.1016/S2542-5196(20)30298-9
Roncoroni, S. (2021). Covid-19 Restrictions Have provided the Set for a Unique Experiment: what Happens to Air Pollution when a Large City Grinds to a Halt? Available at: https://www frontier-economics.com/uk/en/news-and-articles/articles/article-i8518-how-covid-19-lockdowns-have-affected-air-quality-in-london/#(Accessed date August 6, 2021).
Russell, A. R., Valin, L. C., and Cohen, R. C. (2012). Trends in OMI NO<sub>2</sub> Observations over the United States: Effects of Emission Control Technology and the Economic Recession. Atmos. Chem. Phys. 12 (24), 12197–12209. doi:10.5194/acp-12-12197-2012
Savtchenko, A. K., and Khayat, M. G. (2021). NO2 Anomalies - Economy Attribution and Rapid Climate Response. Atmos. Environ. 254, 18351. doi:10.1016/j.atmosenv.2021.118351
Keywords: India, COVID-19, second wave, reopening, NO2 TVCD
Citation: Liu Q, Srirenganathanmalarvizhi A, Howell K and Yang C (2022) Tropospheric Nitrogen Dioxide Increases Past Pre-Pandemic Levels Due to Economic Reopening in India. Front. Environ. Sci. 10:962891. doi: 10.3389/fenvs.2022.962891
Received: 06 June 2022; Accepted: 23 June 2022;
Published: 14 July 2022.
Edited by:
Tianhai Cheng, Institute of Remote Sensing and Digital Earth (CAS), ChinaReviewed by:
Mingyue Lu, Nanjing University of Information Science and Technology, ChinaCopyright © 2022 Liu, Srirenganathanmalarvizhi, Howell and Yang. This is an open-access article distributed under the terms of the Creative Commons Attribution License (CC BY). The use, distribution or reproduction in other forums is permitted, provided the original author(s) and the copyright owner(s) are credited and that the original publication in this journal is cited, in accordance with accepted academic practice. No use, distribution or reproduction is permitted which does not comply with these terms.
*Correspondence: Chaowei Yang, Y3lhbmczQGdtdS5lZHU=
Disclaimer: All claims expressed in this article are solely those of the authors and do not necessarily represent those of their affiliated organizations, or those of the publisher, the editors and the reviewers. Any product that may be evaluated in this article or claim that may be made by its manufacturer is not guaranteed or endorsed by the publisher.
Research integrity at Frontiers
Learn more about the work of our research integrity team to safeguard the quality of each article we publish.