 Meng Huang
 Xinchi Li1
 Wei Tu
94% of researchers rate our articles as excellent or good
Learn more about the work of our research integrity team to safeguard the quality of each article we publish.
Find out more
ORIGINAL RESEARCH article
Front. Environ. Sci., 16 August 2022
Sec. Environmental Informatics and Remote Sensing
Volume 10 - 2022 | https://doi.org/10.3389/fenvs.2022.962410
This article is part of the Research TopicTowards Sustainable Urban Development: Use of Geographic Big Data for Spatial PlanningView all 25 articles
Bus exterior advertising plays a significant role in outdoor advertising, since it provides frequent exposure to a large number of residents. Traditional route selection methods are generally based on a rough estimation, for example, the number of total passengers of a bus route or the geographical features along the bus route. Targeted bus exterior advertising remains a challenge as little is known about the characteristics of the people along the bus route. In this study, we are aiming at determining a set of bus routes for a given ad category to maximize advertising effectiveness, by mining multiple data sources, including mobile phone data, bus GPS data, smart card data (SCD), and land use data. Specifically, we first estimated the distribution of potential target audiences using mobile phone data and land use data. Two optimization models are proposed considering different advertising requirements. For well-established brands that audiences are familiar with, a wide coverage-oriented bus route selection model is proposed to maximize the coverage of potential target audiences. For new brands that require a high level of exposure before they become recognizable, a deep coverage-oriented bus route selection model is proposed to maximize the total exposure times of the ads. Both models were demonstrated with a case study in Shenzhen, China to explicitly present the outcomes of the models and the differences between them. The calculation results show that the wide coverage-oriented model achieves an average of 84.8% improvement compared with baseline 1 which selects the bus routes with the most passengers, while an average of 9.2% improvement compared with baseline 2 which selects the bus route with the maximum coverage of the target area in reaching more potential target audiences. The exposure intensity of the deep coverage-oriented model is almost 3.7 times of the wide coverage-oriented model. The proposed models provide new options for advertisers to select a suitable advertising strategy according to their needs.
According to a recent market report, Out-of-home (OOH) advertising is the only traditional media category that has shown consistent revenue growth, and the revenue is expected to grow by 4% each year (JCDecaux 2020). Outdoor advertising is still a highly competitive and effective way to reach potential consumers despite the emergence of many new media, e.g., online advertising. The most common form of outdoor advertising is billboards, but transit advertising is becoming more and more popular, especially in countries with high traffic and pedestrian densities. As an important subset of outdoor advertising, transit advertising contains static transit advertising (e.g., bus stop advertising) and moving transit advertising (e.g., bus interior advertising, bus exterior advertising) (Roux 2014). In this study, we focus on bus exterior advertising. Exterior advertisements can be displayed on the side, front, and rear of the bus, offering advertisers high exposure. In addition to the common outdoor advertising advantages, the mobility of the bus makes it possible to reach mass audiences with broad coverage and targeted capabilities.
While an advantage of transit advertising is the ability to provide exposure to a large number of people, some audiences may not be interested in the content of the ad, and therefore it will not very effective in reaching these people. Exist studies have demonstrated that targeted advertising is effective to attract audience’ attention and increase the effectiveness of the advertising campaigns (Tam and Ho 2006; Tucker 2014). Hence, to launch a successful advertising campaign, the key is to maximize the ads’ exposure to the audiences who may be interested in the ads. Bus exterior ads will target different audiences depending on the route it follows. The audience of bus exterior advertising includes pedestrians in the streets, bus riders, and people in nearby cars, which is almost the most complex audience component to measure (Małecki et al., 2019). Traditional methods usually simplified the number of audiences to the number of passengers taken by a bus (Zhang et al., 2017a; Zhang D. et al., 2017b). However, the traditional methods ignore the pedestrians, and people in nearby cars, who are also an important part of the audience. In addition, they did not consider the interests of the audiences and were unable to achieve targeted advertising. There are also some studies selecting bus routes based on functional regions or categories of POIs that a bus route covers (Zhang X. et al., 2017c). For example, clothing ads prefer to be placed on the bus routes passing through many department stores and clothing stores. This method only considers the geographical features along the bus route, ignoring the audience flow difference in different areas. In short, there is still a lack of effective methods for estimating the number of audiences who are interested in the content of the bus ads.
Different advertising campaigns often have various marketing strategies and priorities. Reach and frequency are two fundamental metrics when planning an advertising campaign. Reach is the number of target audiences that are potentially exposed to the ad campaign. Frequency is the number of times an audience is likely to be exposed to an ad during a marketing campaign (STRATEGUS 2022). For well-established brands, audiences are very familiar with these brands, fewer exposure times can still bring a successful outcome (Tellis 1988), so reach is the priority in this case. As a result, the goal of advertisers is to cover as many target audiences as possible. In this case, it’s more suitable to choose longer bus routes as they can cover a larger area and more audiences. From the perspective of location theory, this problem can be solved based on the maximal covering location problem (MCLP). Church and ReVelle (1974) first proposed the MCLP, intending to maximize service coverage by a limited number of facilities, and it has achieved many successful applications, such as suggesting locations for health facilities (Bennett et al., 1982), ambulances (Saydam and McKnew 1985), urban fire stations (Murray 2013), and bike sharing stations (Xu et al., 2016). Different from the advertising strategies for well-established brands, new brands usually require a high level of exposure before they become recognizable and acceptable, because of consumer inertia and selective information processing (Tellis 1988). As a result, frequency is the priority in this case. The goal of advertisers is to achieve high exposure times for target audiences. In this case, it inclines to select shorter bus routes. The bus runs serval times a day along the fixed route, so bus exterior ads are exposed to the same area serval times a day. Different buses run different numbers of times a day due to different route lengths. Namely, different bus routes will have different exposure intensities to an area. Intuitively, shorter bus routes run more times a day and have higher exposure intensity to areas along the routes. When selecting a set of bus routes for advertising, the selected routes may overlap. If the travel demand between two bus stops on one bus route can be served by another bus route, it is defined as route overlapping (Deng and Yan 2019). The higher the degree of overlap, the more times an area is covered. From the perspective of location theory, this is a multiple coverage problem. Daskin and Stern (1981) developed the first model considering multiple coverages, which is regarded as an extension of the location set covering problem (LSCP) (Toregas et al., 1971). One of the objectives of this model is to maximize the number of times that demand is covered beyond a single facility. Then in 1986, an extension of the MCLP considering multiple coverages was proposed (Hogan and ReVelle 1986). This model is known as the backup coverage location problem (BCLP) to maximize both primary and secondary service coverage. Several other multiple coverage models have been proposed for ambulance service planning (Gendreau et al., 1997), cybersecurity planning (Zheng et al., 2019), and the recovery of infrastructure systems after disasters (Iloglu and Albert 2020).
Traditional outdoor advertising has mainly depended on demographic data (Cronin 2008), video data (Zhang et al., 2012; Zhang et al., 2013) to estimate the number of audiences. Nowadays, an amount of geolocated data becomes available, such as GPS data, smart card data, and mobile phone data. They allow advertisers to understand their audiences better and provide possibilities to achieve targeted outdoor advertising. And there are a growing number of studies leveraging trajectory data for outdoor advertising in recent years. For example, Lai et al. (2017) have mined local interests from social media data and used them for targeted advertising in the subway stations. Wang et al. (2019) have inferred users’ trip purposes, and traffic conditions based on vehicle trajectory data and used them to quantify advertisement influence spread. Lou et al. (2020) extracted potential customers’ information from their vehicular trajectories and proposed an advertising strategy for roadside billboard advertising. Huang et al. (2021) have inferred audiences’ interests from their mobile internet usage and then combined their trajectories from the mobile phone data to select the most promising place for advertising. But most existing studies focus on the general form of outdoor advertising, i.e., digital screens, and billboards. Limited efforts and attention are paid to the targeted bus exterior advertising by using trajectory data.
Different advertising campaigns often have different marketing strategies and different priorities. Established brands need only reminder advertising, while new brands need more exposure (Tellis 1988). However, to the best of our knowledge, no such studies have considered these two different advertising needs when selecting bus routes for advertising. In this study, we are aiming at determining a set of bus routes for a given ad category, which can maximize advertising effectiveness, by mining multiple data sources, including mobile phone data, SCD, bus GPS data, and land use data. Specifically, we first estimate the distribution of potential target audiences from mobile phone data and land use data. Then two optimization models are proposed considering different advertising needs.
The investigated area of this study is the city of Shenzhen, China. Shenzhen is located in the Pearl River Delta, South China. It covers an area of approximately 2000 km2 with 18 million people. After 40 years of rapid urbanization, Shenzhen has become one of the most developed and innovative cities in China. Currently, it encompasses 10 administrative districts (Figure 1). Among these districts, the south areas of Shenzhen, i.e., Luohu, Futian, and Nanshan districts, are concentrated with commercial, financial, and high-tech companies and are considered the central city, while the other districts include four suburban districts (Baoan, Longhua, Yantian, and Longgang), and three outer suburban districts (Pingshan, Guangming, and Dapeng). According to a recent survey, about 55.6% of passengers in Shenzhen have chosen to travel by bus due to its convenience and low fare of it (Yang et al., 2019b). Public transportation makes a significant contribution to people’s daily commute in Shenzhen. The popularity of public transportation in Shenzhen makes it an ideal place for this study.
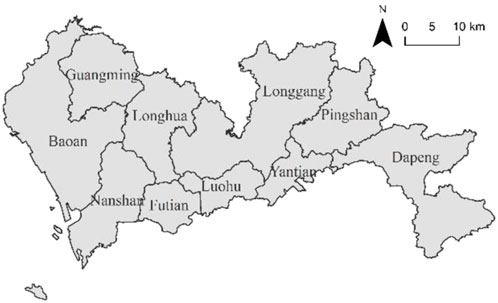
FIGURE 1. Study area of Shenzhen.
Five types of data are utilized in this study, i.e. mobile phone location data, land use data, bus network data, bus GPS data, and smart card data. According to the role of the data, they can be classified into two categories. The first category is used to estimate the potential target audience distribution, including mobile phone location data and land use data. The other category is multi-source bus data, including bus network data, bus GPS data, and smart card data. These data are used to acquire some attributes of the bus routes, i.e. average number of running times per day, and average passenger number. If the timetable of the bus route is available, the advertisers don’t have to use the bus GPS data to acquire the average number of running times per route. In practical application scenarios, the data to use depends on the precision requirements and the available dataset. A brief introduction of the dataset is given below.
The mobile phone location data used in this study was acquired from a main mobile phone operator in China. About 16 million mobile phone users were collected in this dataset during a typical workday in 2012. The data was passively recorded, when a mobile phone user had a mobile phone activity, or active update, i.e., regular location updates and periodic location updates. In this dataset, the interval of the records is approximately 1 h. Table 1 shows examples of the data. Each record comprises an anonymous user ID, recording time, the ID of the mobile phone tower, and the latitude and longitude of the corresponding mobile phone tower. In total, there were 5,940 unique mobile phone towers in this dataset.
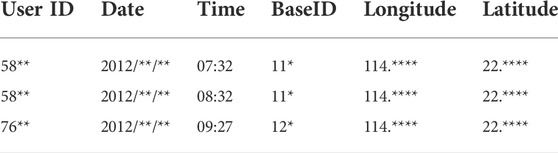
TABLE 1. Sample records of mobile phone location data.
The land use data of Shenzhen was obtained for the same year as the mobile phone location data. The dataset includes six land-use types (Figure 2), which are commercial (e.g., retail, wholesale), industrial (e.g., factories, industrial parks), residential, public (e.g., schools, hospitals), transport, and special lands (e.g., water bodies, green space) (Yang et al., 2019a).
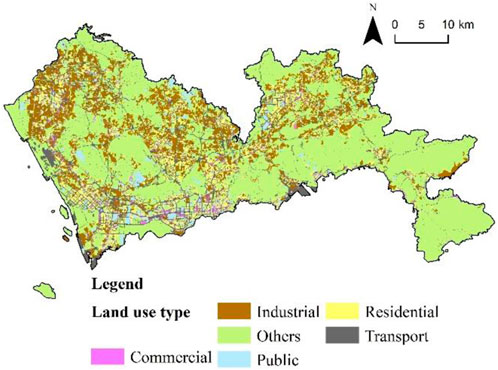
FIGURE 2. Land use in Shenzhen.
The bus network data including bus stations and bus routes were acquired from the Gaode API. The Gaode map is the leading map service provider in China. As of September 2014, there were 874 bus routes and 51,606 bus stations in Shenzhen. Bus stops with the same name but belonging to different routes are merged into one-stop. Accordingly, a total of 4,602 bus stops were generated. The bus routes include the main-line routes, branch routes, express routes, and some special routes. Since we only consider bus routes that people usually take in their daily commute, these special routes such as peak-time routes, travel routes, and intercity bus routes are excluded. The remaining 794 routes are used as candidate routes for advertising, which is shown in Figure 3. The maximum length of the remaining routes is 101.5 km and the average length is 20.1 km.
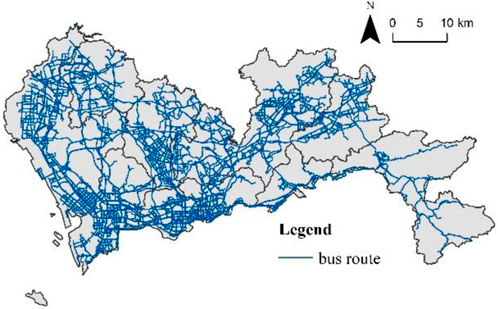
FIGURE 3. Spatial distribution of bus routes in Shenzhen.
The GPS trajectory data was collected from bus vehicles with GPS equipment reporting real-time location at certain intervals. The used dataset was provided by the transport operation command center (TOCC) of Shenzhen, from September 24 to September 30 in 2014. Each record includes the fields of vehicle id, time, longitude, latitude, speed, equipment status, etc. Due to data availability, there is a mismatch between the period of bus GPS data and the mobile phone data. However, as the effects of the two datasets are independent and we focus on the methodology in this study, we expect this mismatch will have a limited impact.
The SCD was also provided by TOCC and was in the same period as GPS data. The SCD is mixed with both metro and bus transactions. Transactions from the metro were ignored, since we only focus on bus exterior advertising. Passengers only need to tap smart cards for boarding in Shenzhen, so each SCD record only contains the user id, the boarding time, and the id of the bus boarded. Both the boarding and alighting stops cannot be derived directly.
The framework of this study is shown in Figure 4. The study area was divided into grids. The mobile phone location data and land use data were first used to estimate the potential target audience distribution (Section 3.2). Then the weight of each grid was defined by the number of potential target audiences inside. The targeted bus exterior advertising problem is formulated as a grid coverage problem. Considering different advertising needs, two models are proposed. Specifically, for well-established brands, a wide coverage-oriented bus route selection model is proposed to maximize the coverage of the potential target audience (Section 3.3). While for new brands or products, a deep coverage-oriented bus route selection model is proposed to maximize the total exposure times (Section 3.4).
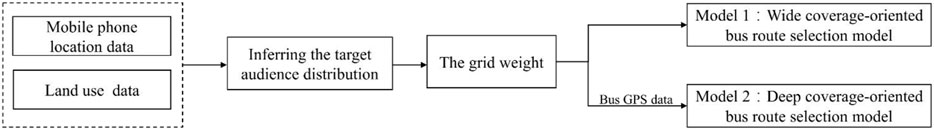
FIGURE 4. Framework of this study.
Different from other facilities, such as hospitals and schools, the influence range of bus exterior advertising is not fixed. It depends on many factors, such as the size of the ad, traffic volume, and bus speed. For simplification, we divided the study area into grids of the same size and used the grids that the bus passes through as the influence range of bus exterior advertising.
The importance of each grid is based on the number of potential target audiences inside. Irrelevant audiences are ignored, since we aim to deliver ads to the audience with a strong preference for ads’ contents. To achieve this goal, this study first identified the total audience inside each grid by using mobile phone location data. Then the interests of audiences were inferred by land-use data. Existing studies have already verified that a given land use type has a close relationship with the type of activity performed at that location (Widhalm et al., 2015; Tu et al., 2017). In this study, we used the type of land use where the audiences were located to infer their activities, thereby inferring the types of ads they might be interested in. For example, the people located in the educational land may be teachers and students conducting educational activities, so it is assumed that they are more likely to be interested in education-related ads. We assume that the land use category and the bus exterior ad category conform to the same set C. For instance, we may have C = {education, industry, transportation, …}. For a given advertising category, the corresponding target audiences are those located in the same category of land use. Each grid can be represented in the form below:
Where
Within each grid, we assume that people are uniformly distributed. Hence, the number of target audiences of each advertising category can be estimated based on the composition of the land use and total audiences in each grid, which can be formulated as:
Where
In this study, we divided the advertising campaigns into two categories. For the first category, the advertisers aim at covering as many target audiences as possible. The more eyes see their ads, the more potential to reach their goals. The cost of each bus route for advertising is assumed the same for simplification. Hence, for the first category campaign, the problem is to select a set of bus routes to place the ad of category n that can maximize the exposure to the target audiences. This problem can be solved based on the MCLP, which we term wide coverage-oriented bus route selection model in this study. The bus routes can be seen as facilities providing ad content as a service to people around them. The potential target audiences can be seen as the demands in the model that need to be covered. Each bus route’s influence range is represented by the grids that the bus passes through. Once the audiences are located within the influence range, they are declared as covered. Each grid is weighted by the average number of target audiences inside to reflect its importance. Before introducing the mathematical formulation of this problem, consider the following notations:
For a given advertising category, the model is stated as follows:
The objective of the model is to maximize the coverage of demands (i.e. target audiences). Eq. 4 tracks whether demand is covered by at least one selected route or not. Eq. 5 defines the number of routes to be selected is p. Eq. 6 indicates that a route is either selected or not. Eq. 7 indicates that a demand grid is either covered or not.
For the second category of the campaign, the advertisers want to have high exposure or repetition times to target audiences to improve branding and increase consumer acceptance. This strategy is often used for new brands or products. For this category of campaign, every exposure is counted. The problem is to select a set of bus routes to place the ad of category n that would maximize the total exposure times to users who are interested in n. However, the relationship between ad repetition and an audience’s reception of the ad is not monotonic. Ad effectiveness is believed to increase at low levels of repetition and then decrease as ad repetition increases (Berlyne 1970; Campbell and Keller 2003). Therefore, it is necessary to limit the maximum exposure times of ads to avoid adverse consequences caused by excessive exposure. For bus exterior ads, the multiple exposures for an area come from two parts, i.e. the overlapping of different routes and the multiple round trips of the bus in a day. To select a set of bus routes that can maximize the ad exposure times for a satisfactory ad influence, we propose a maximal multiple coverage model, which we term deep coverage-oriented bus route selection model.
Before continuing, it is necessary to consider the following notations:
The maximum allowed exposure times of an ad to each grid is defined by MaxEx. MaxEx is pre-specified to avoid adverse consequences caused by excessive exposure. For example, setting MaxEx = 2 means that only primary and secondary coverage are considered and additional coverage is not taken into account.
Using the above notations, the model is defined as follows:
The objective of the deep coverage-oriented bus route selection model is to maximize the total exposure times of the ads. Constraints Eq. 9 track whether demand is covered by at least one selected route or not. Constraints Eq. 10 specify an upper bound on the number of times each grid can be covered. Constraint Eq. 11 defines that the p bus routes are to be selected. Constraint Eq. 12 indicates that a route is either selected or not. Constraints Eq. 13 impose integer and non-negativity requirements on
In general, two strategies have been used to solve the above location optimization problem, exact methods, and heuristics. Exact methods, for example, enumeration, branch-and-bound, and linear programming, guarantee the optimal solutions. Some exact approaches have been incorporated into commercial packages such as CPLEX, and Gurobi (Mu and Tong 2020). However, for large-scale data, the computational effort increases dramatically, and solving these problems exactly can be difficult or impossible, so advanced heuristic methods such as genetic algorithms, and Tabu searches, become essential (Tu et al., 2014). Heuristic methods seek to obtain near-optimal solutions at relatively low computational cost and are suitable for large-sized problems (Tong and Murray 2017). The selection of the algorithm depends on the size of the problem, the efficiency and precision requirements of the problem.
As mentioned in Section 3.2, we first divided the study area into equal-size grids and used the grids that a bus passed through as the influence range of bus exterior advertising for simplification. As to the grid size, we used 500 m × 500 m mesh grids based on related research (Yang et al., 2016). In total, there were 8,293 grids in the study area, and each grid was tagged with a unique Grid ID.
The mobile phone records were first mapped onto the grids based on the spatial relation of the grid and mobile phone tower. The operation time of Shenzhen’s public transport was from 6:00 a.m. to 11:00 p.m., so only the records during this period were considered. As the interval of this dataset was approximately 1 h, the number of distinct audiences in each grid per hour was acquired. Then the average audience volume of each grid during this period was calculated, which is shown in Figure 5. It is shown that the spatial distribution of the population in the study area was heterogeneous. People were concentrated in the central urban districts of Futian, Nanshan, and Luohu, while few people were located in Longgang, Pingshan, and Dapeng.
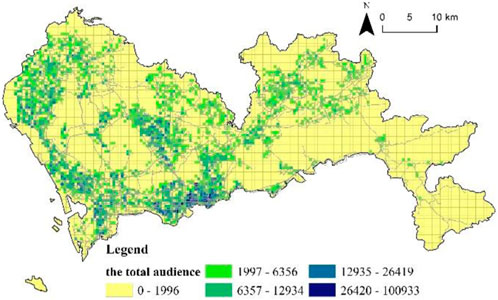
FIGURE 5. The distribution of total audience.
After obtaining the total audiences in each grid, the number of potential target audiences of each advertising category was calculated. We first overlapped the land use data with the grids to obtain the proportions of various land-use types in each grid. Then the number of target audiences of each advertising category was calculated based on Eq. 2. The results are shown in Figure 6. It indicates that the spatial distribution differs over different audience categories. The industrial audiences were concentrated in Baoan, Longhua district, while target audiences of commercial ads were mainly located in Luohu, Futian district. The residential audiences and the transportation audiences were both densely located in Nanshan, Luohu, and Futian districts, but the distribution of transportation audiences was more uniform overall.
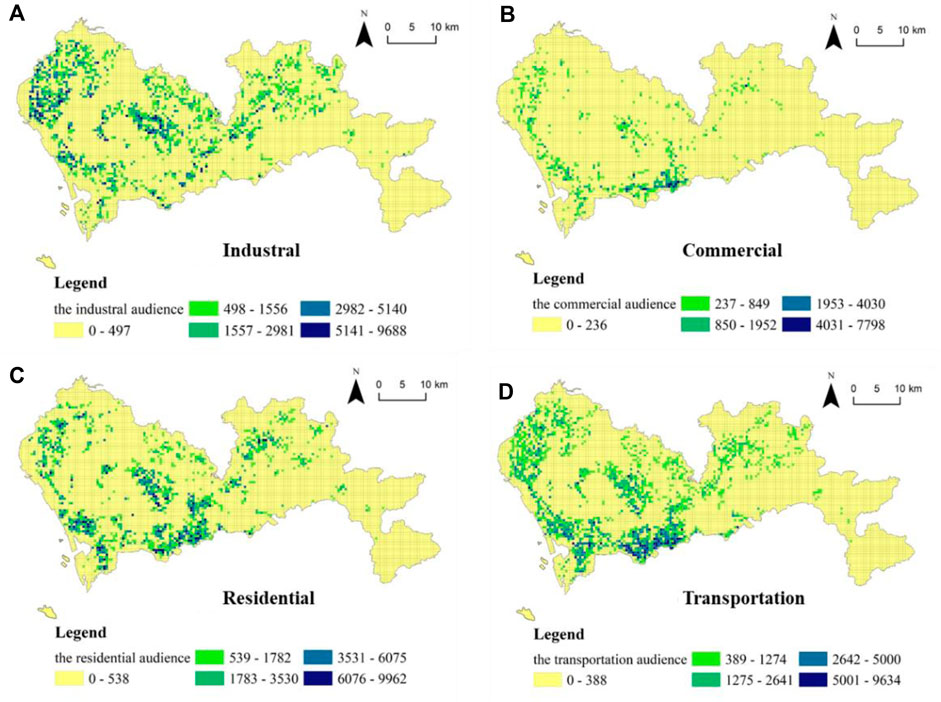
FIGURE 6. Potential target audience distribution for (A) Industral ads, (B) Commercial ads, (C) Residential ads, (D) Transportation ads.
To evaluate the effectiveness of the proposed bus route selection models (Section 3.3 and Section 3.4) respectively, we compared them with two commonly utilized methods:
(1) The first method selects the bus routes with the most passengers (Zhang et al., 2017a). This method is referred to as “baseline 1” hereafter.
(2) The second method selects the bus route with the maximum coverage of the target area, namely, the land use type of the area that matches the category of the ads (Zhang X. et al., 2017c). We denote this method as “baseline 2” hereafter.
The performance indicators to describe the effectiveness of a model include the coverages of the potential target audience and the average daily coverage times of each grid. The target audience within each covered grid was accumulated to acquire the total covered target audiences.
In summary, four models were involved in this study, namely, the two proposed models and two baselines. All the models were implemented in Python 2.7.2, using ArcPy for ArcGIS 10.1 and solved by Gurobi.
The first experiment was to compare the wide coverage-oriented bus route selection model with the two baselines. For each advertising category, namely, industrial, residential, commercial, and transportation, a fixed number of routes (p = 5) was selected. The target audience coverage results achieved by these three models were compared.
As mentioned in Section 2.2, bus passengers only need to tap smart cards for boarding in Shenzhen. Both the boarding and alighting stops cannot be derived directly. Before applying baseline 1, the bus ridership has to be extracted. In this study, each SCD record was first linked to the bus GPS trajectory based on the id of the bus. Then the boarding time was used to estimate the boarding location from the GPS trajectory. Following the direction of the bus route, the boarding location was assigned to the closest bus stop on the bus route. Accordingly, a total of 15,119,857 bus ridership were generated from bus SCD. Then baseline 1 selected bus routes with the most passengers, and the selected bus routes are shown in Figure 7. For different categories of ads, baseline 1 selected the same bus routes. Most of the selected bus routes were located in the Futian, Luohu, and Nanshan districts, which were the central part of Shenzhen. The average length of the selected bus route was 39.5 km.
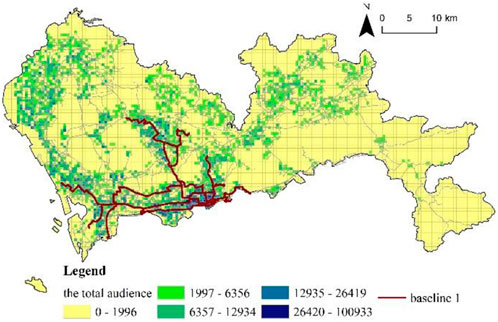
FIGURE 7. The selected routes of baseline 1.
For the wide coverage-oriented model and baseline 2, the selected routes of each category are shown in Figure 8. Table 2 summarizes the coverage values of the various methods for all the categories. Specifically, for industrial ads, the wide coverage-oriented model covered 24.1% of the target audience, which was the highest. Baseline 2 covered 23.4% of the target audience, while baseline 1 covered only 8.4% of the target audience. As to the spatial distribution of the routes, both the wide coverage-oriented model and baseline 2 selected routes concentrated in Baoan, Longgang, and Longhua districts, which have many factories and industrial parks. The average length of the selected routes of baseline 2 was 80.4 km and was the longest, while the average length of the wide coverage-oriented model was 59.7 km. These two methods have three shared routes. For commercial ads, the wide coverage-oriented model covered 41.1% of the target audience and the average length of the selected routes was 48.9 km. Most of the routes passed through Luohu, Futian districts, where there were many shopping centers and financial institutions. For residential ads, the wide coverage-oriented model still covered the highest proportion of target audiences, at 29.2%; followed by baseline 2, at 26.7%; baseline 1 at 18.0%. The average length of the selected bus routes of the wide coverage-oriented model was 56.0 km, passing through many large communities, such as Taoyuan Village, Taoyuan Ju, and Yitian Village. For transportation ads, the wide coverage-oriented model covered 29.4% of the target audience and was the highest. The selected routes passed through many transportation hubs such as Shenzhen East Railway Station, Pingshan Railway Station, and Baoan Passenger Transport Center.
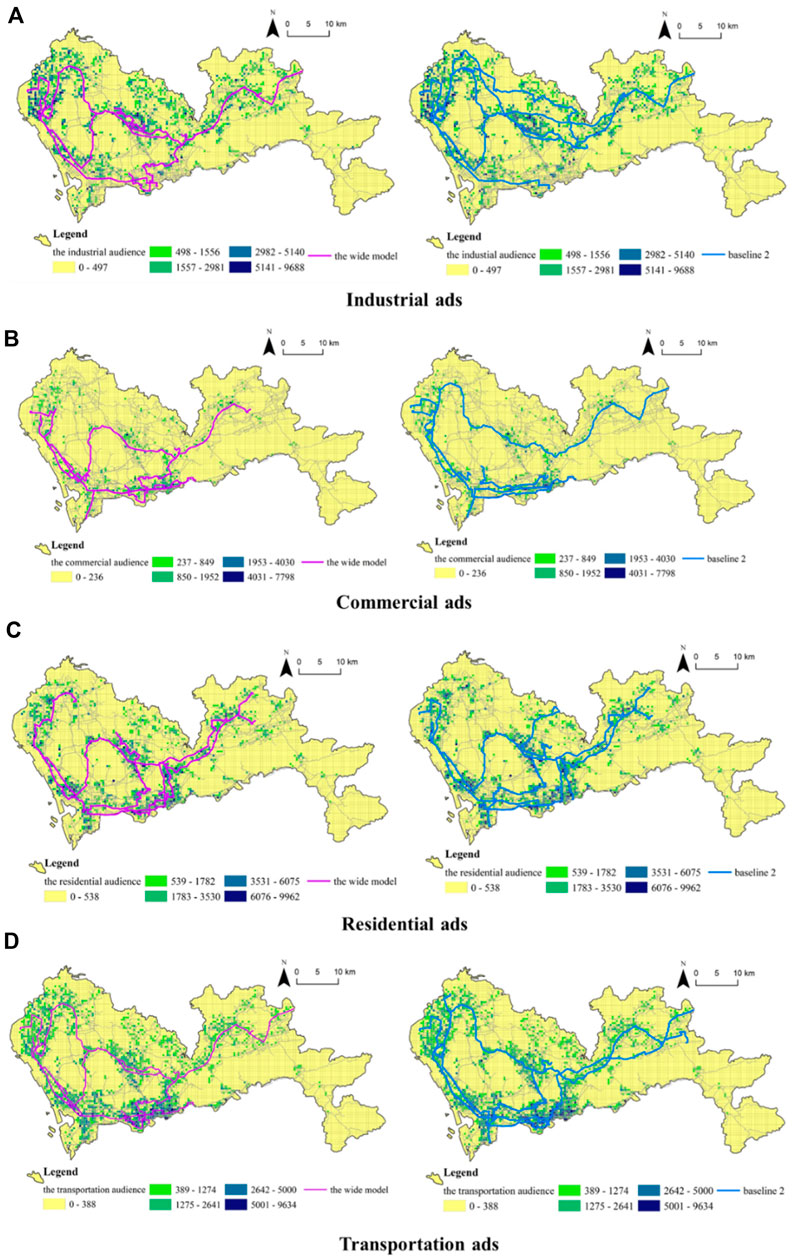
FIGURE 8. The selected bus routes of the wide coverage-oriented model and baseline 2 for (A) Industrial ads, (B) Commercial ads, (C) Residential ads, (D) Transportation ads.
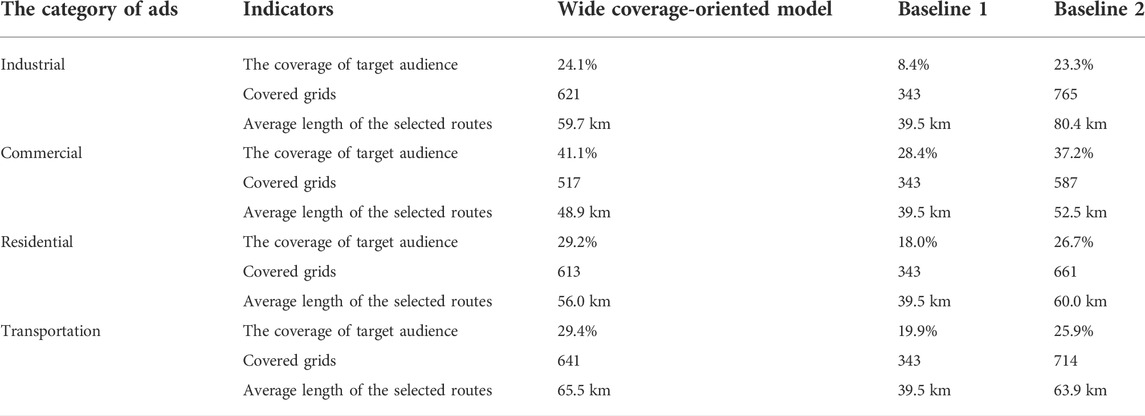
TABLE 2. Evaluation of the wide coverage-oriented model.
In summary, for all the categories, the wide coverage-oriented bus route selection model achieved the highest coverage results, followed by baseline 2 and then baseline 1. The wide coverage-oriented model achieved an average of 84.8% improvement compared with baseline 1, while an average of around 9.2% improvement compared with baseline 2 in reaching more target audience. Though the average length of the selected routes of the wide coverage-oriented model was not the longest, it has the ability to cover more target audiences.
The second experiment was to compare the deep coverage-oriented bus route selection model with the wide coverage-oriented model. For each advertising category, a fixed number of routes (p = 5) were selected. The MaxEx was set to 30. The number of the daily running times of each bus was inferred by matching the GPS coordinates of the bus to the stops along the bus route. Then the average number of running times of each bus route was calculated. The coverages of the target audience and the average daily coverage times of each grid were utilized as the performance indicators.
For all categories, the selected bus routes calculated by the deep coverage-oriented model are shown in Figure 9. The average coverage times of each grid and the corresponding histogram for all the categories of ads are shown in Figure 10. Table 3 summarizes the coverage values of the wide and deep coverage-oriented models for all the categories of ads. Specifically, for industrial ads, 80% of the selected routes were located in the Baoan district, which was the industrial center in Shenzhen with a high concentration of electronics factories. These routes passed through many industrial parks, such as Fuqiao industrial park, Haosi industrial park, and so on. As shown in Table 3, the selected routes of the deep coverage-oriented model were much shorter than those of the wide coverage-oriented model, but the average number of daily coverage times of a grid was 15.2, which was much higher than that of the wide coverage-oriented model. Most grids were covered between 13 and 15 times, and few grids have maximum coverage of 27 times due to route overlap. For commercial ads, the routes were mainly located in the Nanshan, Futian, and Luohu districts, passing through Shenzhen Stock Exchange, PICC Property Insurance, and other financial institutions. The average length of the selected routes was 24.5 km, which was much shorter than that of the wide coverage-oriented model. The deep coverage-oriented model covered 27% target audience, and each grid has an average of 12.1 times coverage. The grid coverage times were mainly concentrated in the two intervals of 5–7 and 19–20. For residential ads, the selected routes were distributed in the Futian, Luohu, Longhua, and Baoan districts, passing through many large residential areas. The average length of the selected routes was 18.7 km. Though this model only covered 14.4% of the target audience, the average coverage times of each grid was 15.2. The maximum grid coverage times was 26, located in Longhua district. For transportation ads, the average length of the selected routes was 33.3 km, and 17.6% of the target audiences were covered. The average grid coverage times was 9.6, which was much higher than that of the wide coverage-oriented model. Most of the grids were covered in the range of 5–7 times and the maximum grid coverage times was 26.
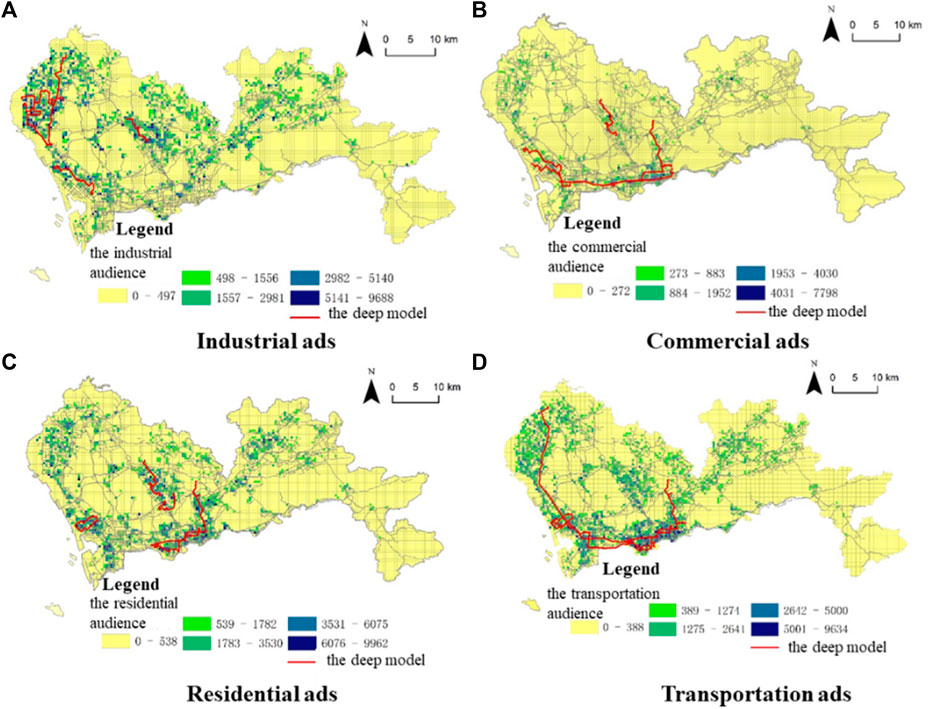
FIGURE 9. The selected bus routes of the deep coverage-oriented model for (A) Industrial ads, (B) Commercial ads, (C) Residential ads, (D) Transportation ads.
FIGURE 10. The average coverage times of each grid for (A) Industrial ads, (B) Commercial ads, (C) Residential ads, (D) Transportation ads.
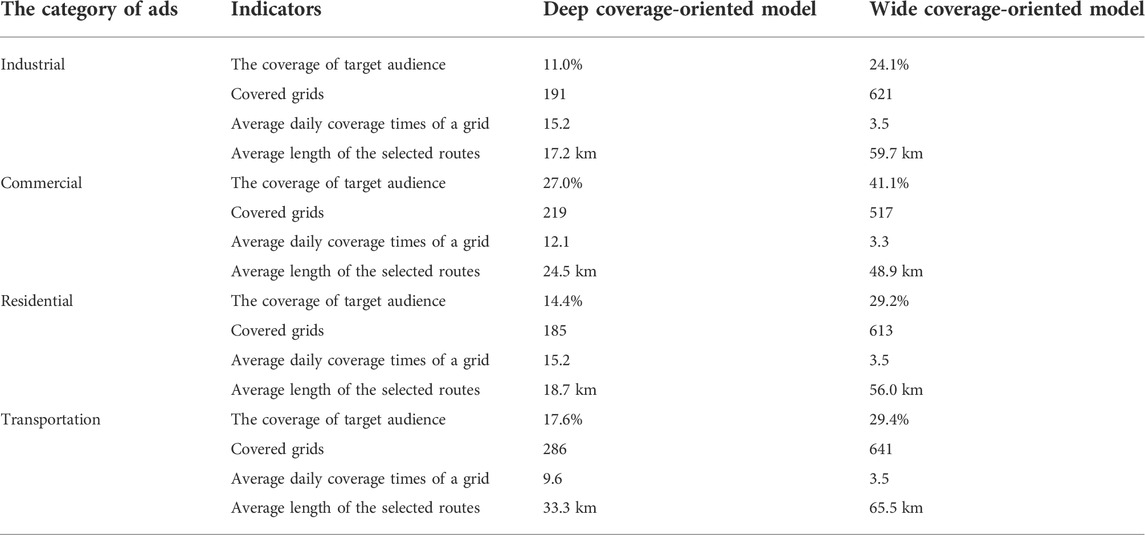
TABLE 3. Evaluation of the deep coverage-oriented model.
In summary, for all the categories of ads, the deep coverage-oriented model achieved higher grid coverage times but lower target audience coverage compared with the wide coverage-oriented model. The average grid coverage times of the deep coverage-oriented model have been increased by an average of 3.7 times. This model can achieve high exposure intensity to areas along the bus routes.
Although bus exterior advertising plays a significant role in outdoor advertising, the analytical methods to optimize bus exterior advertising strategies are limited. Traditional methods are generally based on a rough estimation, for example, the number of total passengers of a bus route or the geographical features along the bus route. It remains a challenge to accurately select a bus route for targeted advertising.
In this study, we demonstrated how the geolocated data, i.e., mobile phone location data, and bus GPS data can be combined with location models to provide suggestions for the bus route selection for exterior advertising. The audience number along the bus route was first estimated by using mobile phone data. Then the category of ads that the audience may be interested in was inferred by using land-use data. Considering various advertising needs, two optimization models have been proposed. Specifically, for well-established brands, a wide coverage-oriented bus route selection model was proposed to maximize the coverage of the potential target audience. While for new brands or products, a deep coverage-oriented bus route selection model was proposed to maximize the total exposure times of the ads. Since untried new brands often require a high level of exposure before they become recognizable and acceptable.
A case study using mobile phone data, SCD, and bus GPS data in Shenzhen, China was adopted to evaluate the two proposed models and the differences between the two models were explicitly investigated. If the data of other cities are available, the proposed workflow and methods can also be applied. For the wide coverage-oriented model, it tended to choose longer routes. This model can achieve a higher proportion of audience coverage, but lower exposure intensity to the areas along the road. For the deep coverage-oriented model, it tended to select shorter routes with a high daily running times. Though this model covered fewer target audiences compared with the wide coverage-oriented model, the average grid coverage times of the deep coverage-oriented model have been increased by an average of 3.7 times. These two models have different priorities for selecting routes, and advertisers can choose the appropriate model according to their needs and marketing scenarios. We trust the proposed models can help advertising planners make better use of transit advertising.
There are also some limitations of this work. Firstly, the interests of the audience are now inferred by using land-use data due to the limited data. In the future, a more precise user interest profile can be constructed by integrating more data sources, such as social media data, mobile internet usage data. Secondly, the impact of traffic flow and travel speed on the exposure strength of ads is not considered in this study. Obviously, larger traffic flow and lower travel speed would increase the travel time of buses through the road. Therefore, the opportunity of the ad being viewed by the audience is also increased. The traffic condition mined from bus GPS data can further be incorporated into the models for more precise results. Thirdly, now the coverage requirements in the models come from an overall perspective, which may lead to unbalanced grid coverage, e.g., most ad exposures are concentrated in few grids. More specific and fine-grained coverage requirements in the time and space domain from the advertisers can be considered in the future, such as the coverage times per hour, to make ad exposure more reasonable and effective. Lastly, due to ability constraints, we evaluate our method by comparing it with two baselines in this study. It would be of great interest if a real advertising campaign can be launched in the future to evaluate our methods.
The original contributions presented in the study are included in the article/supplementary material, further inquiries can be directed to the corresponding author.
MH: Conceptualization, Methodology, Writing the original draft. XL: Methodology, review and editing. WT: Data acquisition, review and editing. MY: Conceptualization, review and editing.
The authors declare that the research was conducted in the absence of any commercial or financial relationships that could be construed as a potential conflict of interest.
All claims expressed in this article are solely those of the authors and do not necessarily represent those of their affiliated organizations, or those of the publisher, the editors and the reviewers. Any product that may be evaluated in this article, or claim that may be made by its manufacturer, is not guaranteed or endorsed by the publisher.
Bennett, V. L., Eaton, D. J., and Church, R. L. (1982). Selecting sites for rural health workers. Soc. Sci. Med. 16 (1), 63–72. doi:10.1016/0277-9536(82)90424-5
Berlyne, D. E. (1970). Novelty, complexity, and hedonic value. Percept. Psychophys. 8 (5), 279–286. doi:10.3758/bf03212593
Campbell, M. C., and Keller, K. L. (2003). Brand familiarity and advertising repetition effects. J. Consumer Res. 30 (2), 292–304. doi:10.1086/376800
Church, R., and ReVelle, C. (1974). Papers of the regional science association, 101–118.The maximal covering location problem
Cronin, A. M. (2008). Mobility and market research: Outdoor advertising and the commercial ontology of the city. Mobilities 3 (1), 95–115. doi:10.1080/17450100701797349
Daskin, M. S., and Stern, E. H. (1981). A hierarchical objective set covering model for emergency medical service vehicle deployment. Transp. Sci. 15 (2), 137–152. doi:10.1287/trsc.15.2.137
Deng, Y., and Yan, Y. (2019). Evaluating route and frequency design of bus lines based on data envelopment analysis with network epsilon-based measures. J. Adv. Transp., 1–12. doi:10.1155/2019/5024253
Gendreau, M., Laporte, G., and Semet, F. (1997). Solving an ambulance location model by tabu search. Locat. Sci. 5 (2), 75–88. doi:10.1016/s0966-8349(97)00015-6
Hogan, K., and ReVelle, C. (1986). Concepts and applications of backup coverage. Manag. Sci. 32 (11), 1434–1444. doi:10.1287/mnsc.32.11.1434
Huang, M., Fang, Z., Weibel, R., Zhang, T., and Huang, H. (2021). Dynamic optimization models for displaying outdoor advertisement at the right time and place. Int. J. Geogr. Inf. Sci. 35 (6), 1179–1204. doi:10.1080/13658816.2020.1823396
Iloglu, S., and Albert, L. A. (2020). A maximal multiple coverage and network restoration problem for disaster recovery. Operations Res. Perspect. 7, 100132. doi:10.1016/j.orp.2019.100132
JCDecaux, (2020). Why advertise in out-of-home. [online]. Available from: https://www.jcdecaux-cityscape.hk/hong-kong/media/why-advertise-ooh (Accessed 0430 2022, 2022).
Lou, K., Yang, Y., Wang, E., Liu, Z., Baker, T., and Bashir, A. K. (2020). Reinforcement learning based advertising strategy using crowdsensing vehicular data. IEEE Trans. Intell. Transp. Syst. 22 (7), 4635–4647. doi:10.1109/tits.2020.2991029
Małecki, K., Jankowski, J., and Szkwarkowski, M. (2019). Modelling the impact of transit media on information spreading in an urban space using cellular automata. Symmetry 11 (3), 428. doi:10.3390/sym11030428
Mu, W., and Tong, D. (2020). On solving large p-median problems. Environ. Plan. B Urban Anal. City Sci. 47 (6), 981–996. doi:10.1177/2399808319892598
Murray, A. T. (2013). Optimising the spatial location of urban fire stations. Fire Saf. J. 62, 64–71. doi:10.1016/j.firesaf.2013.03.002
Roux, T. (2014). The effectiveness of car advertising media: Perceptions of generation-Y consumers. Mediterr. J. Soc. Sci. 5 (20), 1877. doi:10.5901/mjss.2014.v5n20p1877
Saydam, C., and McKnew, M. (1985). Applications and implementation a separable programming approach to expected coverage: An application to ambulance location. Decis. Sci. 16 (4), 381–398. doi:10.1111/j.1540-5915.1985.tb01490.x
STRATEGUS (2022). Reach vs frequency: Are you prioritizing the right metrics? [online]. Available from: https://www.strategus.com/blog/reach-vs-frequency-prioritizing-the-right-metrics (Accessed 0217, 2022).
Tam, K. Y., and Ho, S. Y. (2006). Understanding the impact of web personalization on user information processing and decision outcomes. MIS Q. 30 (4), 865. doi:10.2307/25148757
Tellis, G. J. (1988). Advertising exposure, loyalty, and brand purchase: A two-stage model of choice. J. Mark. Res. 25 (2), 134. doi:10.2307/3172645
Tong, D., and Murray, A. T. (2017). “Location analysis: Developments on the horizon,” in Regional research Frontiers - vol. 2: Methodological advances, regional systems modeling and open sciences. Editors R. Jackson, and P. Schaeffer (Cham: Springer International Publishing), 193–208.
Toregas, C., Swain, R., ReVelle, C., and Bergman, L. (1971). The location of emergency service facilities. Operations Res. 19 (6), 1363–1373. doi:10.1287/opre.19.6.1363
Tu, W., Cao, J., Yue, Y., Shaw, S. L., Zhou, M., Wang, Z., et al. (2017). Coupling mobile phone and social media data: A new approach to understanding urban functions and diurnal patterns. Int. J. Geogr. Inf. Sci. 31 (12), 2331–2358. doi:10.1080/13658816.2017.1356464
Tu, W., Fang, Z., Li, Q., Shaw, S. L., and Chen, B. (2014). A bi-level Voronoi diagram-based metaheuristic for a large-scale multi-depot vehicle routing problem. Transp. Res. Part E Logist. Transp. Rev. 61, 84–97. doi:10.1016/j.tre.2013.11.003
Tucker, C. E. (2014). Social networks, personalized advertising, and privacy controls. J. Mark. Res. 51 (5), 546–562. doi:10.1509/jmr.10.0355
Widhalm, P., Yang, Y., Ulm, M., Athavale, S., and Gonzalez, M. C. (2015). Discovering urban activity patterns in cell phone data. Transportation 42 (4), 597–623. doi:10.1007/s11116-015-9598-x
Xu, Y., Shaw, S. L., Fang, Z., and Yin, L. (2016). Estimating potential demand of bicycle trips from mobile phone data—an anchor-point based approach. ISPRS Int. J. Geoinf. 5 (8), 131. doi:10.3390/ijgi5080131
Yang, X., Fang, Z., Xu, Y., Shaw, S. L., Zhao, Z., Yin, L., et al. (2016). Understanding spatiotemporal patterns of human convergence and divergence using mobile phone location data. ISPRS Int. J. Geoinf. 5 (10), 177. doi:10.3390/ijgi5100177
Yang, X., Fang, Z., Yin, L., Li, J., Lu, S., and Zhao, Z. (2019a). Revealing the relationship of human convergence–divergence patterns and land use: A case study on shenzhen city, China. Cities 95, 102384. doi:10.1016/j.cities.2019.06.015
Yang, X., Lu, S., Zhao, W., and Zhao, Z. (2019b). Exploring the characteristics of an intra-urban bus service network: A case study of shenzhen, China. ISPRS Int. J. Geoinf. 8 (11), 486. doi:10.3390/ijgi8110486
Zhang, C., Wang, H., and Xiong, H. (2017). An automatic approach for transit advertising in public transportation systems. In IEEE international conference on data mining, 181183–211188.
Zhang, D., Guo, L., Nie, L., Shao, J., Wu, S., and Shen, H. T. (2017b). Targeted advertising in public transportation systems with quantitative evaluation. ACM Trans. Inf. Syst. 35 (3), 1–29. doi:10.1145/3003725
Zhang, X. L., Weng, W. G., and Yuan, H. Y. (2012). Empirical study of crowd behavior during a real mass event. J. Stat. Mech. 2012 (08), P08012. doi:10.1088/1742-5468/2012/08/p08012
Zhang, X. L., Weng, W., Yuan, H., and Chen, J. (2013). Empirical study of a unidirectional dense crowd during a real mass event. Phys. A Stat. Mech. its Appl. 392 (12), 2781–2791. doi:10.1016/j.physa.2013.02.019
Zhang, X., Wan\g, Y., and Lv, P. (2017c). “Ibbas: A visual analytics system of large-scale traffic data for bus body advertising,” in 2017 18th international conference on parallel and distributed computing, applications and technologies (Taipei: PDCAT), 18-20, 67–74.
Keywords: bus exterior advertising, mobile phone data, maximal coverage location problem, multiple coverage problem, targeted advertising
Citation: Huang M, Li X, Tu W and Yang M (2022) Multisource data integration for targeted bus exterior advertising. Front. Environ. Sci. 10:962410. doi: 10.3389/fenvs.2022.962410
Received: 06 June 2022; Accepted: 07 July 2022;
Published: 16 August 2022.
Edited by:
Ying Jing, Zhejiang University, ChinaReviewed by:
Xiping Yang, Shaanxi Normal University, ChinaCopyright © 2022 Huang, Li, Tu and Yang. This is an open-access article distributed under the terms of the Creative Commons Attribution License (CC BY). The use, distribution or reproduction in other forums is permitted, provided the original author(s) and the copyright owner(s) are credited and that the original publication in this journal is cited, in accordance with accepted academic practice. No use, distribution or reproduction is permitted which does not comply with these terms.
*Correspondence: Meng Huang, aHVhbmdtMTZAY2hpbmF0ZWxlY29tLmNu
Disclaimer: All claims expressed in this article are solely those of the authors and do not necessarily represent those of their affiliated organizations, or those of the publisher, the editors and the reviewers. Any product that may be evaluated in this article or claim that may be made by its manufacturer is not guaranteed or endorsed by the publisher.
Research integrity at Frontiers
Learn more about the work of our research integrity team to safeguard the quality of each article we publish.