
95% of researchers rate our articles as excellent or good
Learn more about the work of our research integrity team to safeguard the quality of each article we publish.
Find out more
ORIGINAL RESEARCH article
Front. Environ. Sci. , 01 September 2022
Sec. Environmental Informatics and Remote Sensing
Volume 10 - 2022 | https://doi.org/10.3389/fenvs.2022.957339
This article is part of the Research Topic Advanced Big SAR Data Analytics and Applications View all 8 articles
 Zhongcheng Cao
 Teng Wang*
Loess deposits are widely distributed in western and central China. Because loess is wet-collapsible, loess mass is prone to failure after water infiltration. Heifangtai, composed of two adjacent typical loess platforms located in the Loess Plateau beside the Yellow River, has experienced hundreds of landslides in the past few decades. Here, we derived surficial time-series deformation, velocity, and amplitude of seasonality from the Sentinel-1 SAR images acquired from October 2014 to March 2021 in the Heifangtai region and studied their relation with precipitation, temperature, and irrigation applying wavelet analysis. The decomposed velocities show that not only a large amount of along-slope deformation occurred surrounding the terrace but also a significant subsidence in the residential area in the middle of the platform was observed. The high-seasonality areas are distributed along the Yellow River and on the terrace consistent with other water sources, e.g., springs and irrigation, revealing a promotion of a periodic water-involved process on deformation in loess. Through the wavelet analysis, we found that the temperature is almost in phase with the uplift velocity when the temperature is below the freezing point. The precipitation precedes the surface displacement of ∼1 to 2 months for water penetration. The comparison between irrigation volumes and averaged displacements suggests that irrigation also plays a role in promoting subsidence from March to October but uplift in winter due to frost heave. We highlight that the retrogressions of the terraces in this region may be accelerated by both natural and anthropogenic factors. Careful monitoring and water management are highly recommended for the safety of local residences and infrastructures.
Loess soil is widely distributed in western and central China, accounting for 6.44% of China’s land area, especially in the Loess Plateau (Gao, 1996; Li et al., 2018b). Because of its collapsibility, slopes formed by loess soil is prone to failure when water is infiltrated in, causing tremendous landslide hazards (Wang et al., 2013; Peng et al., 2015). Heifangtai, located 42 km west of Lanzhou, the capital city of Gansu Province, is a highly landslide-prone area with ∼200 landslides distributed around its edges, posing huge threats to lives and infrastructures in and around the terraces (Liu et al., 2019).
The periodic recurrence of slope failure in Heifangtai is characterized by generation of new landslides on the concave topography of old ones, namely, retrogressive failure mode (Pan et al., 2017). Considering the different locations of the failure in slope, the landslides here can be divided into two categories, i.e., loess landslides and loess-bedrock landslides. A large number of springs from seepage on the slope toe indicate a complex hydrology inside the platform. By accommodating numerous undergoing landslides, Heifangtai became a natural laboratory for studying the mechanism of loess failure. In particular, owing to the large volume of water infiltration and subsequent change of hydraulic equilibrium, numerical simulation, remote-sensing, and on-site monitoring along with soil experiments have been densely applied to monitor and investigate these loess landslides. From a microscopic point of view, through the experiment on loess samples from Heifangtai, Fan et al. (2017) found that perennial water infiltration can facilitate loss of soil shear strength by processes such as salt leaching and mineral dissolution. Furthermore, the decreasing soil cohesion combining with increasing moisture content directly leads to instability on loess slope (Gu et al., 2019b). These experiments partially explain the impact of frequent water infiltration on loess mass. From the scale of individual loess landslides, hydraulic equilibrium plays a predominant role (Pan et al., 2017; Cui et al., 2018; Peng et al., 2019). According to the 2D slope simulation of the intermittent water infiltration activities, Hou et al. (2018) concluded that the most effective strategy for preventing landslides in Heifangtai is to restrain the total influx from human activities (e.g., irrigation). Since 2012, a real-time monitoring and warning system has been launched for landslides in Heifangtai (Xu et al., 2020), which can effectively alert the residents and reduce the loss of people and property before the occurrence of landslides.
Interferometric Synthetic Aperture Radar (InSAR) technology has been widely used to measure small surface deformation because of its high precision, resolution, and broad coverage (Massonnet and Feigl, 1998; Chatterjee et al., 2006; Perissin and Wang, 2011; Peng et al., 2017; Shi et al., 2019b; Shi et al., 2021). The sparse coverage of vegetation due to the arid climates (Guo et al., 2015) and widely distributed surface deformation make the Heifangtai region suitable for InSAR technology. In particular, variant time-series InSAR methods allow for measuring millimeter-level surface deformation along the line-of-sight (LOS) direction with a high spatial coverage when the impacts such as atmospheric effects and unwrapping errors are minimized (Ferretti et al., 2001; Berardino et al., 2002; Hooper et al., 2004; Ferretti et al., 2007; Ferretti et al., 2011). Among these methods, the Small BAseline Subset (SBAS) approach has been generally applied for extracting the displaced series in the natural terrain with sufficiently redundant interferometric pairs. Previous studies employing the SBAS method in Heifangtai exhibit unique advantages of InSAR observations and demonstrate its potential on the monitoring of loess landslides (Liao et al., 2011; Herrera et al., 2013; Tong and Schmidt, 2016). Especially, Shi et al. (2019a) qualitatively studied the InSAR-derived time-series deformation with the levels of groundwater and suggest that the rise of groundwater level may seriously decrease the stability of loess slopes. However, a convincing quantitative study of the coupling relationship between surface displacement and hydrological parameters, such as irrigation volume, rainfall, and temperature, has not yet been presented to the best knowledge of the authors. In general, most of the analysis between InSAR-derived time series and hydrological parameters is qualitative, hindering our understanding of the roles of water cycle in determining the spatial–temporal pattern of surface deformation on the loess terraces like Heifangtai.
Wavelet transform is a powerful tool that allows for quantitative analysis of time-series data especially when confronting the non-stationary signals in nature (Torrence and Compo, 1998). For such a signal, the wavelet analysis is preferred to conventional Fourier analysis because of its capability of uncovering frequency features at different times and frequencies (Grinsted et al., 2004). To study the temporal behavior of landslides, Tomás et al. (2015) found that the Huangtupo slope is affected by an annual displacement periodicity controlled by rainfall and reservoir water level through a wavelet tool. Liu et al. (2021) studied the influence of rainfall on the deformation of a landslide using the wavelet analysis and found a strong positive correlation between them and a lag time of about 45 days. The powerful capability in revealing the relation between deformation and its controlling factors promote us to investigate the complex deformation occurring in the Heifangtai region using wavelet tools.
Here, we first obtain the surficial displacements and velocities estimated from the Sentinel-1 SAR dataset by the employment of the LiCSBAS package (Morishita et al., 2020). Then, we combine wavelet and time-series InSAR analysis methods to quantitatively study the relations between time-series data, including displacements and velocities, and potential factors facilitating the surface movement—irrigation, air temperature, and precipitation records. The fitting parameter of periodic term from time-series data is interpreted and then used as a proxy of intensities of hydrological activities.
The Heifangtai region is in the immediate northern vicinity of the Yellow River and comprises two loess platforms, Heitai and Fangtai (Figure 1). The Heitai platform, with an area of ∼12 km2, is much larger than the Fangtai platform to its west with an area of ∼1.7 km2 (Meng et al., 2019). Heifangtai is formed by the long-term erosion from undercutting of the river in the context of strong uplift of the adjacent Tibetan Plateau (Liu et al., 2019). It has a flat relief on the platform and steep slope of ∼60 degrees at the margins. From the bottom, the terrace can be divided into four strata, i.e., mudstone (bedrock), alluvial deposit (mainly pebbles), clay, and aeolian Malan loess (Xu et al., 2011), which have different hydrological characteristics. In the hydrological perspective, the terrace can also be reckoned as two main strata approximately. The upper layer is mainly made up of Malan loess symbolized by collapsibility with a thickness of ∼30–50 m. The lower layer is constituted by mudstone, clay, and pebbles and thus can be reckoned integrally as an aquitard for the following analysis (Gu et al., 2019a). The layer below is characterized by an oblique relief with gradually decreasing elevations from west to east, forming a gentle slope beneath the underground water table (Peng et al., 2019).
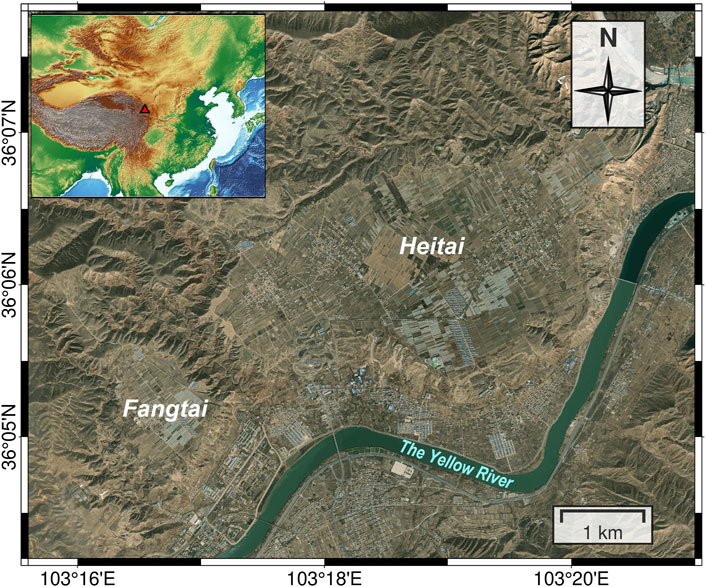
FIGURE 1. Landscape of Heifangtai and its location indicated as a red triangle in the inset.
Since 1968, residents began to migrate to Heifangtai due to the construction of nearby hydroelectric stations, namely, Liujiaxia, Yanguoxia, and Bapanxia dams on the Yellow River. Since then, the groundwater level within the terrace has been rising vigorously accompanying the growing water-intensive agriculture due to pumping irrigation from the Yellow River. Together with rainfall, the systematic settlement on the platforms causes high landslide activities at its margins (Gu et al., 2019a). We derive surface velocity maps for the Heifangtai region and focus our time-series analysis on the Heitai platform, where more residences are settled surround with numerous active landslides.
From the irrigation data from Xu et al.,(2013) (Figure 2), the pumping irrigation is primarily carried out from March to May and in November on the platform (Cui et al., 2018). This is evidently due to the uneven distribution of precipitation that about 300 mm annual rainfall sharply concentrated in the period from April to October (Figure 3). Given the continental monsoon climates in this region, the shallow soil is under frozen temperature in November, and the thaw occurs in March in the following year as shown by the daily minimum air temperature in Figure 3. The precipitation and temperature data are derived from the meteorological station numbered 52983 at an altitude of 1874 m, located at 35.87°N and 104.15°E.
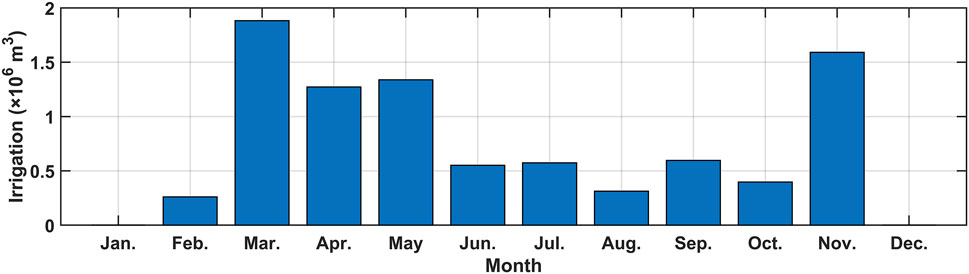
FIGURE 2. Monthly irrigation volumes in Heifangtai, data are retrieved from Xu et al. (2013).
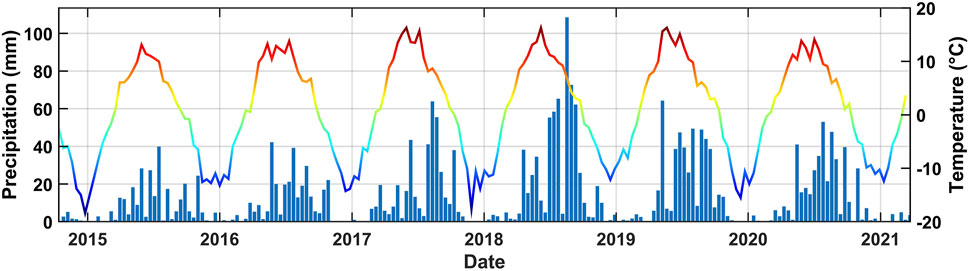
FIGURE 3. Precipitation in millimeter per 12 days (blue bars, left vertical axis) and minimum air temperature (colored line, right vertical axis) per day in Celsius degrees.
We employ Sentinel-1 A/B C-band SAR images from the European Space Agency (ESA) to precisely measure the time-series displacements of Heifangtai. We collected 157 ascending and 135 descending SAR images with a minimum revisit period of 12 days, spanning from October 2014 to March 2021, to generate interferograms (Figure 4). We adopt the ASTER digital elevation model (DEM) with spatial resolution of 30 m × 30 m for the elimination of topographic phases in the interferograms.
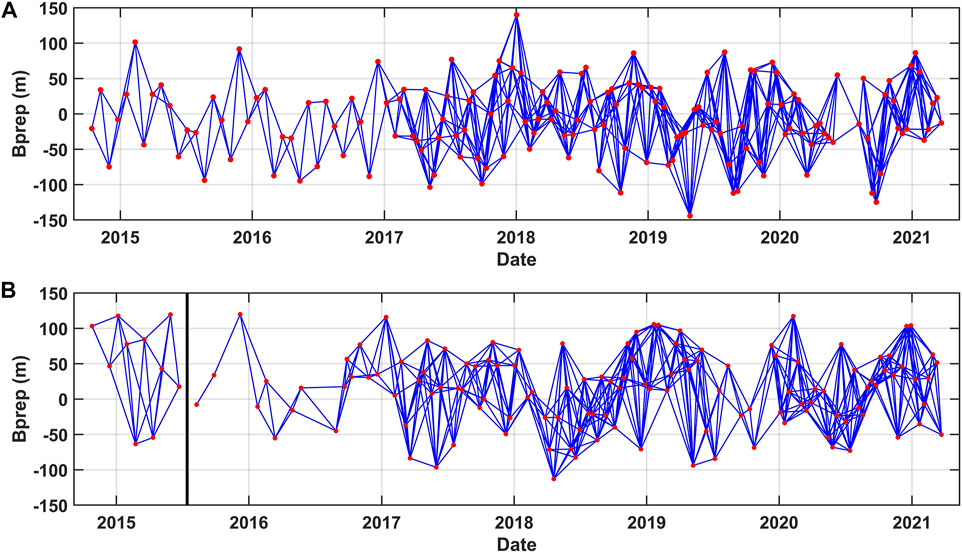
FIGURE 4. Baseline network for Sentinel-1 SAR images, indicated as red dots, from (A) ascending track and (B) descending track. Blue lines represent all the interferograms used in the time-series analysis after removing the ones with low coherence and/or unacceptable unwrapping errors. Bprep is a perpendicular baseline and black thick line in (B) indicates a gap.
The flow chart of generating and analyzing the time-series deformation can be divided into two major parts: 1) InSAR processing for extracting time-series surface deformation (Figure 5 “part 1”) and 2) wavelet analysis between time-series deformation and hydrological parameters (Figure 5 “part 2”).
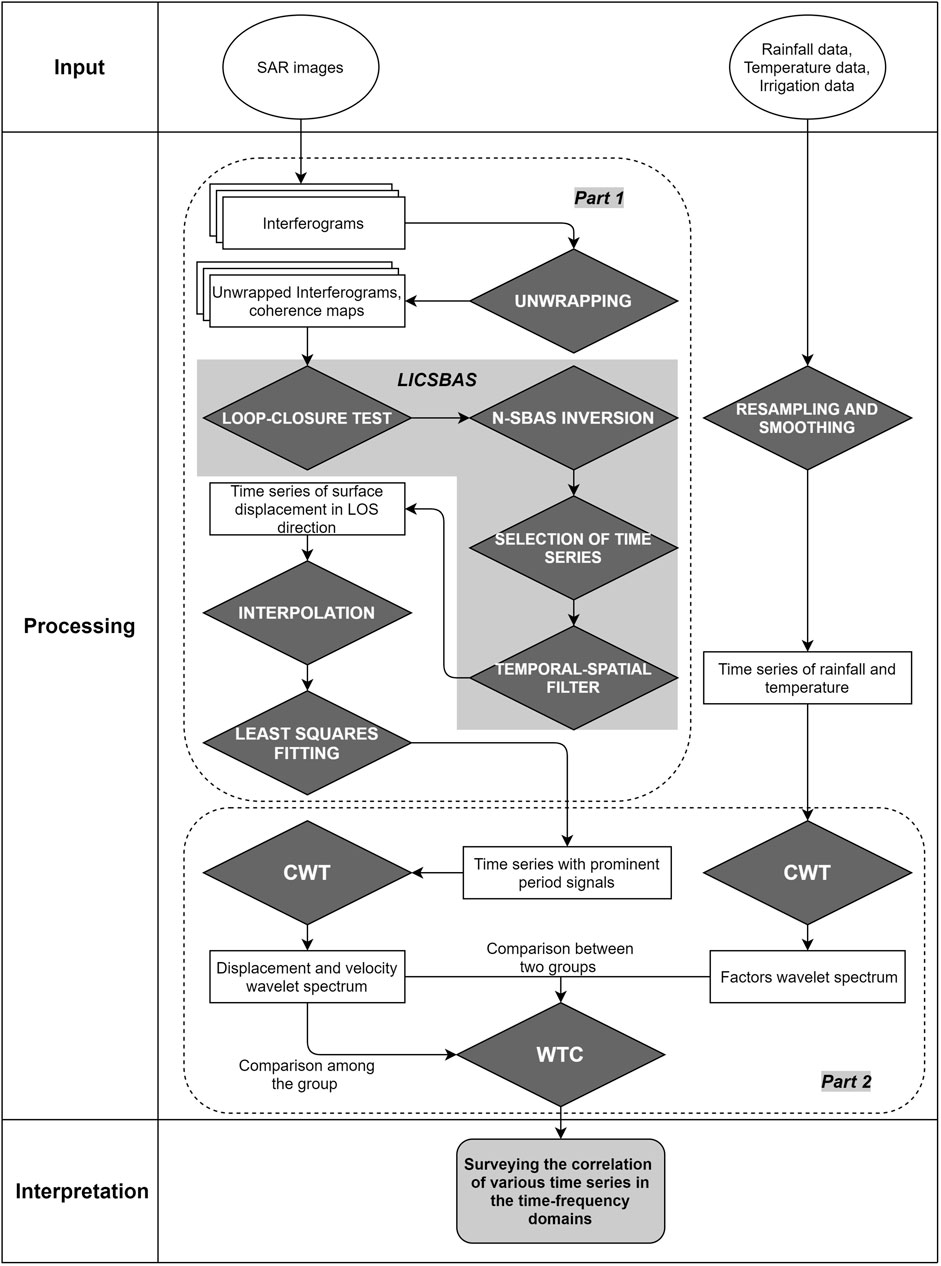
FIGURE 5. Flow chart of data processing, including time-series InSAR and wavelet analysis. Two groups of data, time series of surface displacement derived from the InSAR and hydrological dataset such as precipitation and temperature, are analyzed jointly. The block in gray is the processing implemented by the open-source LiCSBAS (Morishita et al., 2020).
We processed all the Sentinel-1 SAR images using the burst-based Sentinel-1 processor (Jiang et al., 2017). The coregistration and reference-phase removal were achieved using the ASTER 30 m-resolution DEM. Then, 651 interferograms for the ascending track and 621 interferograms for the descending track were generated with temporal baselines less or equal to 72 days. To balance the trade-off between the signal-to-noise ratio and the resolution, we set the multi-look factor as 2 × 8 pixels in azimuth and range, resulting in a spatial spacing of ∼40 m. The Goldstein filter was applied on each interferogram for enhancing data reliability and accuracy (Goldstein and Werner, 1998). All interferograms were unwrapped using SNAPHU (statistical-cost, network-flow algorithm for phase unwrapping) software (Chen and Zebker, 2000). The spatial filter to depress noise can degrade the spatial resolution; thus, it is important to carefully determine the size of filter windows when investigating small landslides. Nevertheless, we applied the spatial filtering for two reasons: 1) instead of individual landslides, we focus on the correlation between surface deformation and its triggering factors and 2) Heitai is a small loess terrace with an area of ∼12 km2, and therefore plenty of landslides whose surficial characteristics are inherently undetectable by multi-looked interferograms (40 m spacing size in our study).
We used the open-source LiCSBAS package (Morishita et al., 2020) to retrieve time-series deformation around the Heifangtai region. We set the thresholds of the average temporal coherence as 0.2, the RMS of loop closure as 1.8 (Biggs et al., 2007), the standard deviation of velocities as 100 mm/yr, the spatiotemporal consistency (STC) as 5 mm, and the RMS of residuals in the small baseline (SB) inversion as 3.5 mm for masking low-quality pixels and removing interferograms with large unwrapping errors.
After retrieving time-series deformation, we applied a parametric fitting on the time-series signals for deriving the velocity and identifying the areas with prominent oscillations (seasonal fluctuations) (Cohen-Waeber et al., 2018). The temporal model of displacement for each pixel is written as
where c1, c2, c3, c4, and c5 are the coefficients for the function and
We employed a continuous wavelet transform (CWT) to achieve a time–frequency-dependent representation on the time-series signal for revealing the periodical phenomena occurring at different time and frequency scales (Labat, 2010). Assuming that we have a discrete sequence Xn(n), n = 0, …, and N-1 with fixed sampling interval Δt, its CWT is defined as (Qiang et al., 2007)
where * indicates the complex conjugation and ψ is a designated wavelet. The transformation is represented as the convolution between the input sequence and a normalized wavelet that is scaled by the coefficients. For revealing the feature of localized periodicity, Morlet wavelet, a plane wave-modulated by a Gaussian function, is introduced (Tomás et al., 2015). It is defined as
where
To measure, in the time–frequency domain, the magnitude of covariance of the CWTs obtained from two different sequences, the wavelet coherence (WTC) is applied. By analogy with the Fourier-squared coherence, the wavelet coherence is estimated through the cross-wavelet spectrum (analogous to Fourier cross-spectrum) normalized by individual CWTs computed from the time-series signals to be analyzed (Baddoo et al., 2015). The definition is given by (Torrence and Webster, 1999)
where WnXY is a cross-wavelet spectrum for two different time-series signals X and Y and S[*] is a smoothing operator (Torrence and Webster, 1998). The result of WTC is a two-dimensional matrix (time–frequency domain), within which the values range from 0 to 1 because of normalization. Also, the high values are situated at areas where highly localized similarity between the two CWTs exists. The detailed information about the wavelet toolbox employed can be found in Grinsted et al. (2004).
The argument (phase) extracted from the cross-wavelet spectrum is also a useful tool for measuring the phase shift (i.e., time lag) between two time series at a specific time and frequency, which can be obtained by
where T is the period and
After fitting the deformation series derived from the LiCSBAS software, we obtained the ascending and descending LOS velocity maps of the Heifangtai area (Figure 6). Combined with the ascending and descending geometries, the deformation velocities along the east and vertical directions are also estimated in the Heifangtai area (Figures 6C,D). As InSAR is insensitive to the north–south deformation inherently, the contribution of the deformation in the north–south direction can be neglected in general (Samsonov et al., 2013). Although agricultural regions are decorrelated at the center of the Heitai platform, some cottages (W1, M1, and M3) and greenhouses (M2) exhibit relatively high coherence, providing sufficient density of coherent targets covering the part of the settlement area (Figure 6), where the overall vertical velocities show long-term subsidence with velocities of 6–22 mm/yr (Figure 6C), in agreement with the previous field survey of more than 1.5 m subsidence on a water tank (Zhang and Wang, 2018) and numerical simulation of subsidence of ∼1.00–1.99 m in 30 years (Hou et al., 2019).
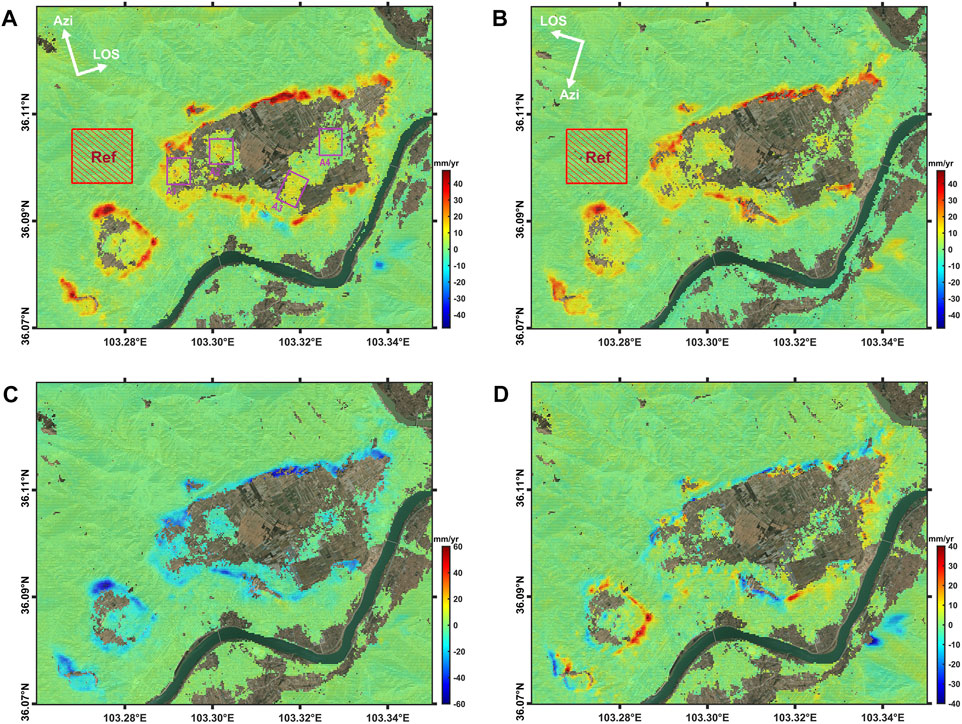
FIGURE 6. Spatial pattern overlaying the optic image for the mean velocities in (A) ascending LOS direction, (B) descending LOS direction, (C) vertical direction, and (D) east–west direction. In (A,B), red means moving away from the satellite and blue means moving toward the satellite along the radar’s LOS direction as indicated at top left. In (C,D), red indicates the upward movement and eastward movement, respectively. The reference area is selected to be far from the terraces and the Yellow River denoted as ‘Ref’. A1, A2, A3, and A4 in purple boxes are the four regions on the Heitai platform with evident subsidence.
Along the edges, subsidence ranging from 8–63 mm/yr corresponds to locations where landslides occur frequently (Figure 6C). It is to be noted that part of the southeastern margin is missing because SAR cannot illuminate this area along the descending geometry (Figure 6B), while ascending data clearly show that this part also moves away from the satellite along the radar’s LOS direction. This is a common phenomenon that large deformation is mainly concentrated along the edges of the loess platform, consistent with previous studies (Peng et al., 2018; Zhou et al., 2020). On the edges of terraces and on the east bank of the Yellow River, (Figure 6D), east–west horizontal deformations are also apparent, with the motion directions related to the slope geometries. For example, on the east edge of the Heitai platform, horizontal deformations are mainly toward the east, while on the west edge and some isolated slopes on the north and south edges, the horizontal displacements are mainly toward the west. The locations with largest subsidence rates (∼60 mm/yr) are at the north edge of the terrace, indicating strong downward motion along the slop facing to the north.
Because the ascending data have higher temporal sampling rate and higher data quality than the descending data (Figure 4), we applied the time-series analysis for the ascending data. We employed the amplitudes of seasonal deformation, namely, coefficient c1 in Eq. 1 to represent the level of seasonality in this region (Figure 7) and the root-mean-square error (RMSE) of model fitting (i.e., Eq. 1). It clearly shows that except for a small area south of the Heitai terrace, most of the study region exhibits low RMSE (e.g., less than 8 mm). Intuitively, a zone with high seasonal amplitudes (bright areas with magnitudes larger than 3 mm) is notably distributed along the flat banks of the Yellow River, yet accompanying with negligible LOS velocities (smaller than 3 mm/yr). This feature implies that the mechanism of driving this deformation pattern is a seasonal factor, likely related to the freeze–thaw cycles. In addition to those regions, moderate seasonal amplitudes with magnitude of ∼2 to 3 mm appear on the platform, associated with large LOS velocities.
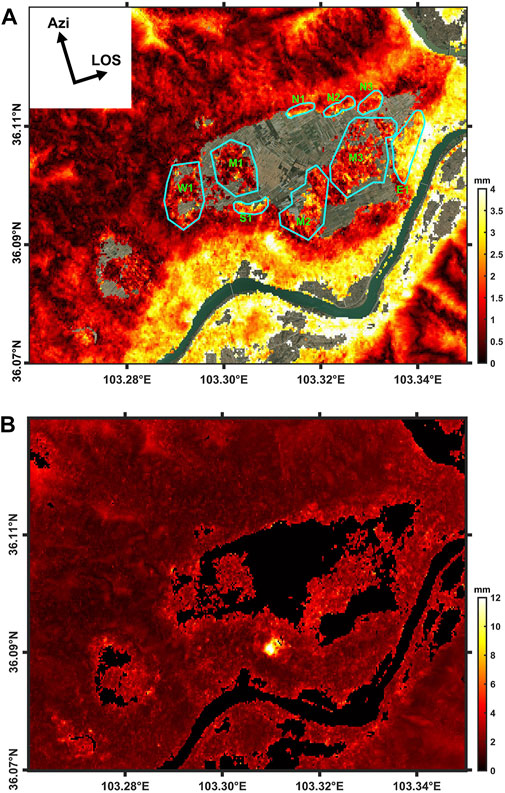
FIGURE 7. Spatial pattern of the amplitudes of seasonality (A) derived from time-series deformation from the ascending track, along with the root-mean-square error (RMSE) of model fitting (B). Nine areas on the platform with prominent values on amplitudes are enclosed with cyan solid lines, namely, W1 (west), M1-3 (middle), E1 (east), N1-3 (north), and S1 (south) according to their location in the terrace. The averaged time-series of pixels in those regions are prepared for the wavelet analysis.
We marked nine typical areas, with prominent seasonal amplitudes, around and inside the Heitai platform to further investigate their temporal behaviors (Figure 7). Among them, W1, M1, and M2 are villages, and M3 is a greenhouse located at the center of the platform. These areas are adjacent to agricultural fields; thus, their moderate seasonal displacements are likely controlled by irrigation activities. The others (E1, S1, N1, N2, and N3) correspond to active landslides at the margins and with nearby springs exuded from groundwater. Their time-series deformations (Figure 8) are clearly dominated by a quasi-linear component reaching about −100 mm with only one exception, N1 reaching −244 mm in approximately 6.5 years. E1 shows the most pronounced signal for seasonal amplitude in comparison with the others on slope.
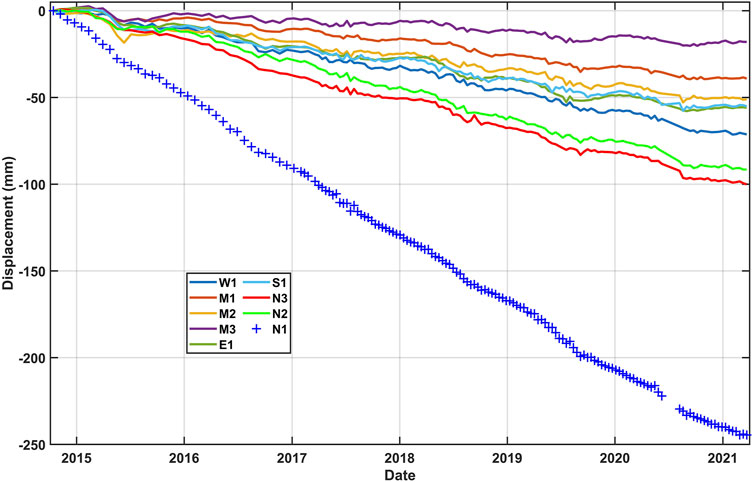
FIGURE 8. Time-series deformation from October 2014 to March 2021 along the ascending LOS for the regions enclosed in Figure 7. A negative value indicates moving away from the satellite. Time series from N1 is depicted as discrete points to reveal the acquisition dates of all the images.
We conducted the CWT to the precipitation records, daily minimum air temperatures, and detrended displacement of E1 and S1 to show their time-frequency features before studying their mechanisms. The CWT is expressed as a two-dimensional graph, i.e., continuous wavelet power spectrums with two axes as the proxies of time instant and period (or frequency) of specific pattern (Figure 9). Therefore, the location with a high value of modulus in the CWT generally indicates a localized signal that significantly resembles the frequency-specific wavelet.
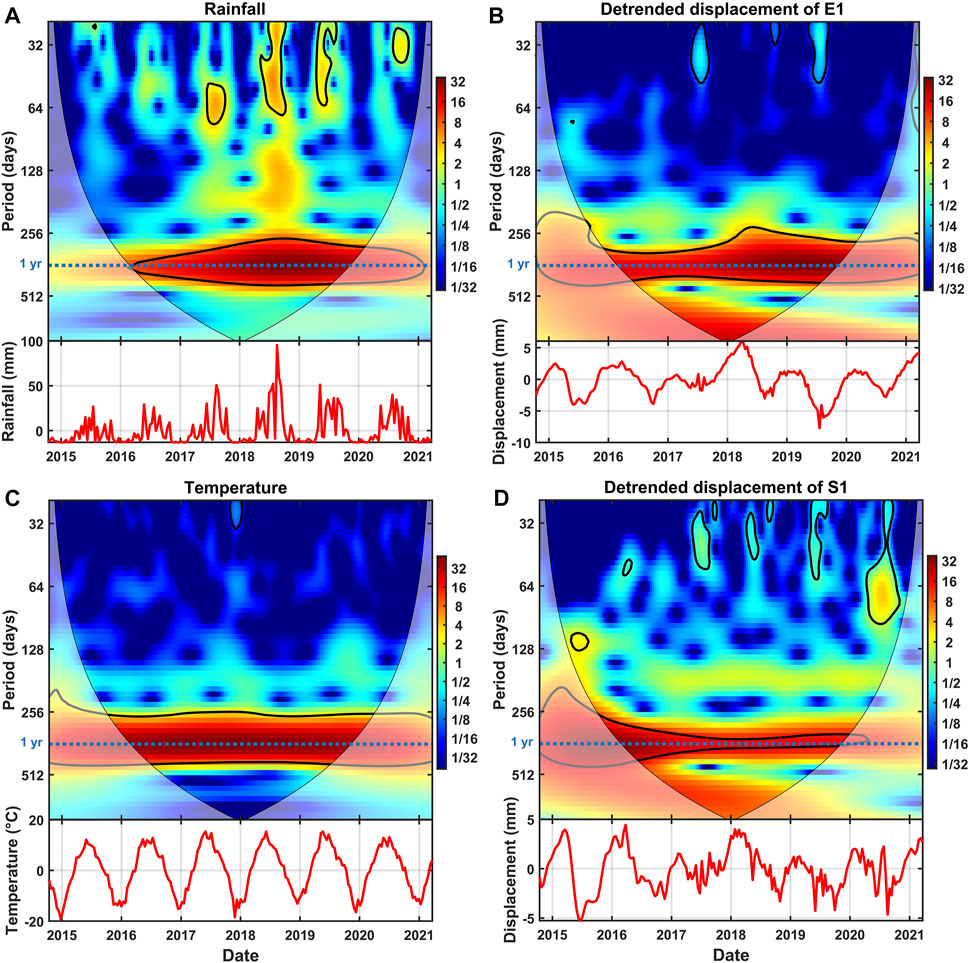
FIGURE 9. Continuous wavelet power spectrums for different time-series data: (A) precipitation, (B) detrended displacement of E1, (C) air temperature, and (D) detrended displacement of S1. The positive values in deformation time series mean approaching to the satellite. The thick black contours indicate the 5% significant level against red noise. The areas with half-transparent masks designate the cone of influence (COI) where the results are unreliable due to the nonnegligible edge effects. We use the same style for Figures 10–12.
A high common power can be observed at the period of 1 year (365 days), highlighted by the blue dotted line spanning the whole phases for all the signals. The phenomenon means that all the analyzed time-series signals have obvious cyclic fluctuation. In addition, some areas with a period of 32–128 days have relatively high power during the mid-year of 2017–2020 in the graph of detrended displacement of S1, the cause of which needs further investigation.
For further understanding the underlying mechanism of deformation, the time-series velocities along the LOS direction are estimated from smoothed displacement sequences. The velocity time series of W1, S1, M1, and M2 are illustrated in Figure 10. Unlike the displacements exhibiting one strip of high power around the period of 1 year, the CWTs of velocities for those four regions have a prominent feature with double-strips around the periods of 1 and a half year. It suggests that those time-series velocities, being a sum of superposition of two major periodic components, may have originated from different hydromechanically processes.
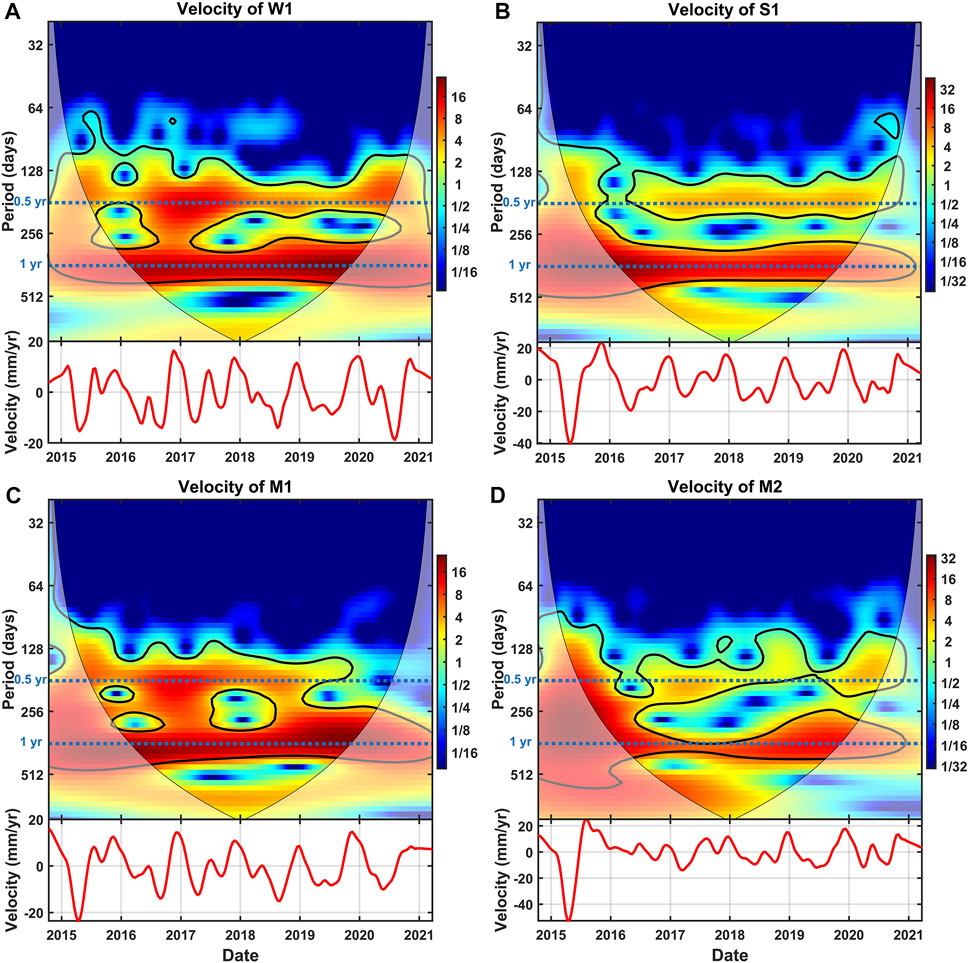
FIGURE 10. Continuous wavelet power spectrums for the time-series velocities estimated from displacements: (A) W1, (B) S1, (C) M1, and (D) M2. Positive values in velocity means approaching to the satellite.
The WTC between deformation (or velocity) and records of precipitation and temperature allows for recognizing the roles of these hydrological factors in controlling the deformation of loess landslides and for quantitatively estimating the time lag for the hydrological process to effect. Figures 11A–D show the WTCs between precipitation and detrended deformation series of W1, S1, M1, and M2. A significantly high common power can be identified at the period around 1 year (blue dash lines), indicating a significant correlation between the two time-series records at the period of 1 year. According to Eq. 5, average time lags between rainfall and detrended deformation at the period of 1 year are 52, 34.5, 48, and 35 days on W1, S1, M1, and M2, respectively. It suggests that rainfall contributes to the motion of landslides both on the platform (W1, M1, and M2) and at its margins (S1), although irrigation dominates the long-term deformation in the Heitai platform (Gu et al., 2019a; Zhuang et al., 2020). Some other regions also show high correlation such as the signals during the mid-year of 2019 around the period of 32–64 days and that during the whole year of 2018 around the period of 128 days (Figure 11D). For a more systematic measurement of the phase shift, temporal-dependent time lags are extracted from all the WTCs between rainfall and displacements at an approximate period of 1 year and then plotted in Figure 11E. Most of these results reflect that the response time of deformation to rainfall is slowly increasing with time.
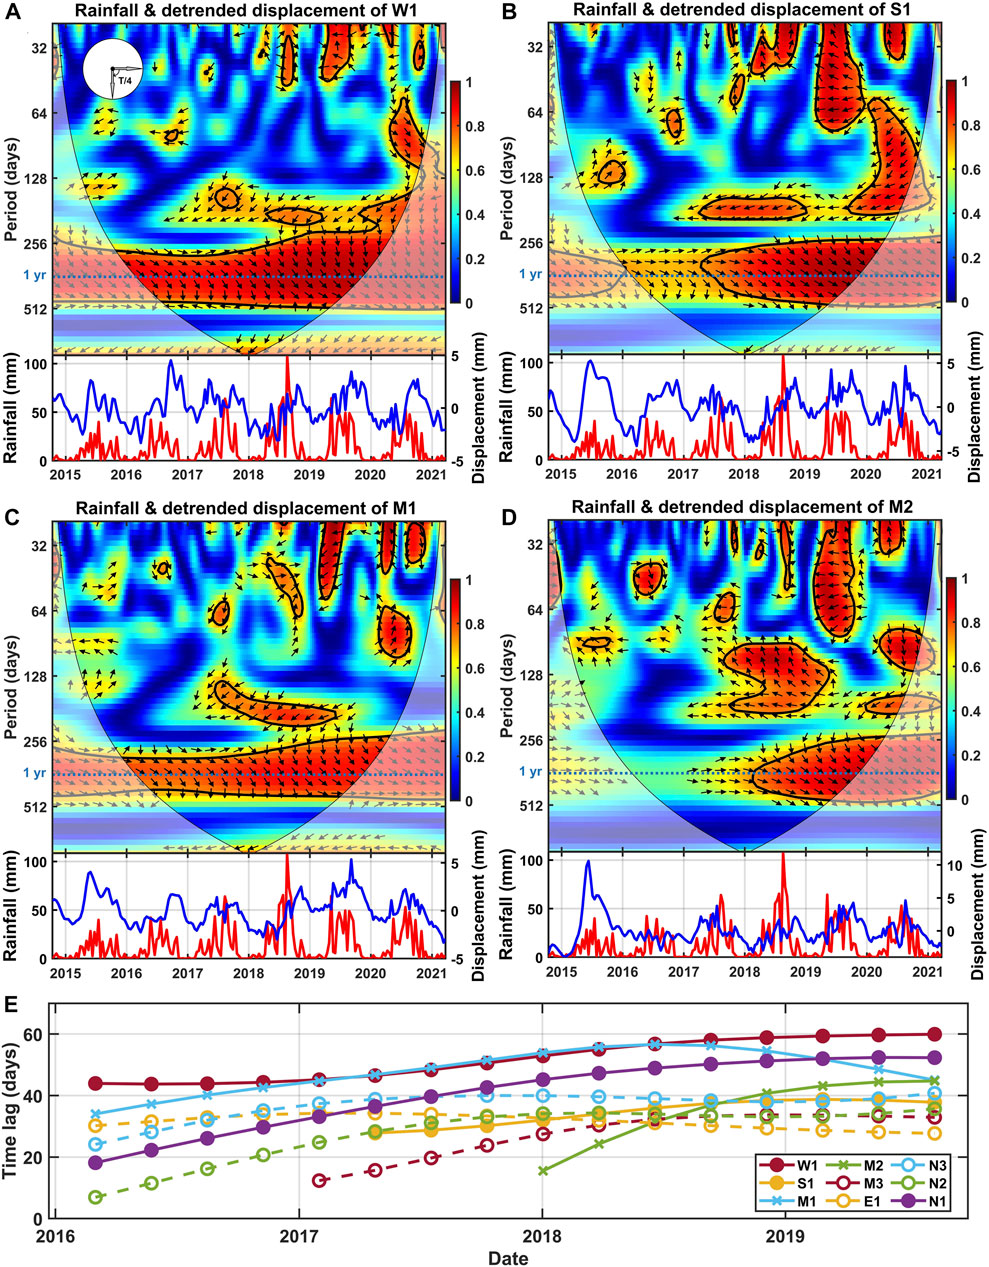
FIGURE 11. Wavelet coherence (A–D) and progression of time lag (E) on different pairs of time-series data. (A–D) show wavelet coherence between precipitation (red lines) and the displacement (blue lines) of W1, S1, M1, and M2 and variations of the time lag between them, respectively. The time-series displacements have been multiplied by −1 for better comparison, so the negative increment in displacements means approaching to the satellite. It is to be noted that only the data outside the COI and in the black thick contours are reliable. The dotted line in blue corresponds to the period of 1 year. Red curve in (A–D) corresponds to precipitation, and blue curve corresponds to displacement. The black thick contours indicate the 5% significant level against red noise, in which the signals show high localized correlation. A relative phase shift is shown as a black arrow with in-phase pointing right and antiphase pointing left. The arrow pointing down indicates that the first time series leads to the second time series with 90 degrees (T/4), as shown at the upper left of (A).
Because temperature determines the speeds of freeze and thaw cycles in the winter–spring season, WTC analysis between surficial velocities and minimum air temperature may better expose their relations. Our results actually show very high WTC values around the period of 1 year, implying a significant correlation between the two time series. This highly correlated pattern is clearly represented from the remarkable consistence between the two time-series data (Figures 4A–D), particularly when the temperature below the frozen point. Their average time lags at the period of 1 year are much smaller than the values derived from precipitation data with time-series displacements, indicating a nearly in-phase relationship, i.e., no time lag for most of the pairs in view of the 1-year cycle. Different from precipitation, time lags between air temperature and velocities are decreasing and approximating zero (Figure 12E).
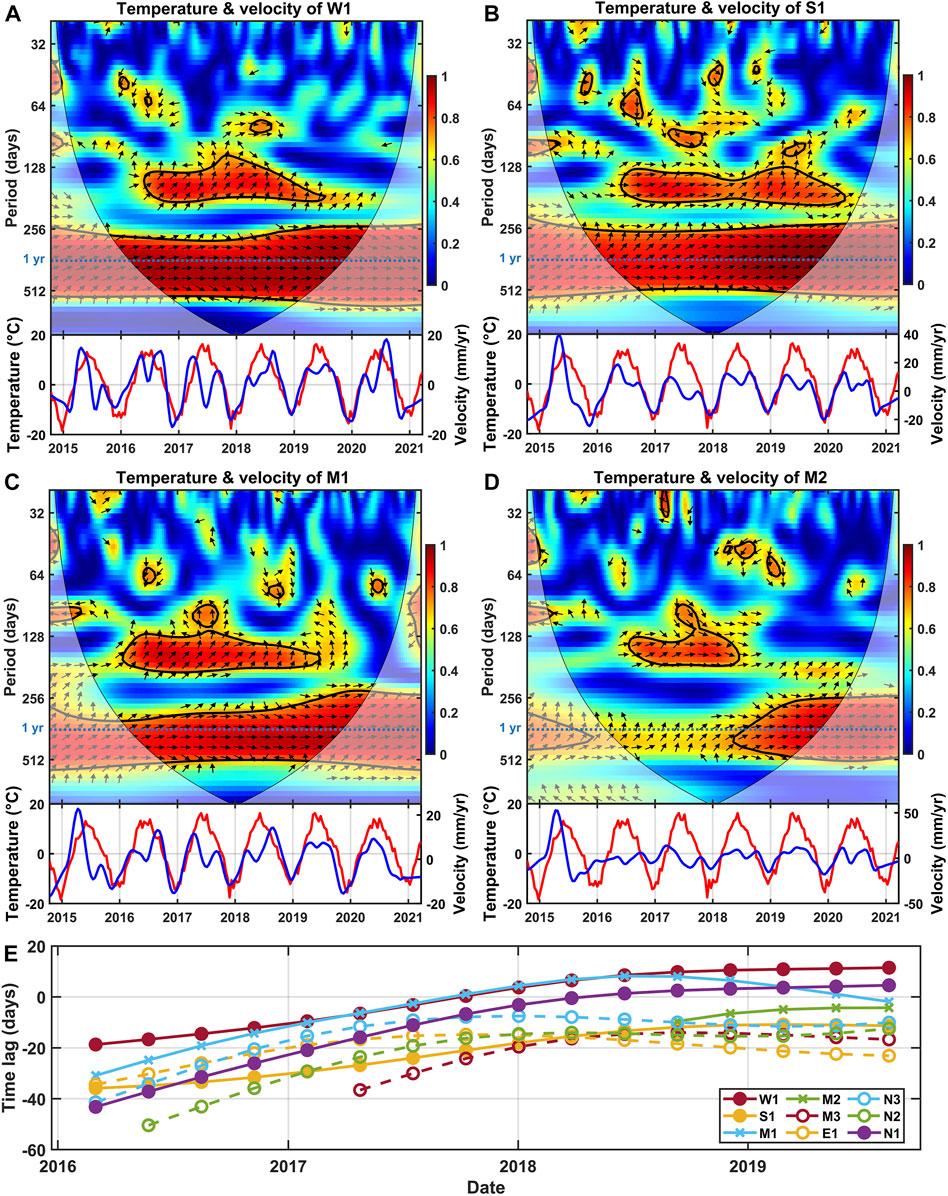
FIGURE 12. Wavelet coherence on different pairs of time series: (A) temperature and the velocity of W1, (B) temperature and the velocity of S1, (C) temperature and the velocity of M1, (D) temperature and the velocity of M2, and (E) variations of time lag: that at the period of 1 year between minimum air temperature and each velocity form the regions labeled in Figure 7. All sequences are extracted from the areas outside the COI and in the black thick contours. The dotted line in blue corresponds to the period of 1 year. The time series of velocities (blue line) have been multiplied by −1 for a better comparison. The negative value in velocity means approaching the satellite. Relative phase shift is shown as a black arrow with in-phase pointing right and anti phase pointing left. The arrow pointing down indicates that the first time series leads the second time series with 90 degrees (T/4), see also the caption of Figure 11.
Loess landslides and their kinetics mechanism in Heifangtai terraces have been comprehensively investigated through various measurements, experiments, and simulations (Xu et al., 2013; Fan et al., 2017; Liu et al., 2018; Qi et al., 2018; Zhang and Wang, 2018; Zhuang et al., 2020). The spatial pattern of the velocity fields derived here are in good agreement with those from previous studies (Liu et al., 2018). However, these studies focused on the deformation of landslides distributed along the margin of the terrace, neglecting the subsidence in its middle. Nevertheless, our results reveal a systematic subsidence with velocities of ∼10 to 20 mm/yr, concentrated to the residential areas (Figure 6C), where relatively high coherence exists. We infer that similar long-term subsidence may be widely distributed on the platform, as they share the same geological and hydrological settings with these coherent targets. Consequently, continued monitoring of the infrastructure and cottages on the liquefied loess terrace is highly recommended. In addition, rapid subsidence and divergent east–west displacements are observed around the Heitai and Fangtai terraces, clearly indicating the retrogression process of these loess terraces. The fastest subsidence concentrates in the northern margins with rates over 60 mm/yr for both terraces, suggesting a faster retrogression to the north than the other margins in this region (Figure 6C). The rapid along-slope deformation occurring around the loess terraces not only pose a threat to human life settled on them but also imply the shrinking of terrace area in a long-term perspective.
Loess material is well-known for its high porosity of accommodating water, and the variations of surficial displacement are thus strongly coupled with water-involved processes such as freeze–thaw cycle (Li et al., 2018a) and periodic water infiltration. Therefore, the spatial distribution of amplitudes of seasonal deformation actually can be used to indicate the degree with which water is involved (Neely et al., 2021) (Figure 7). From our result, it is surprising to see that the belt across the Yellow River exhibits the highest seasonality. Given its very small velocity and flat terrain, we propose the freeze–thaw cycle to explain its mechanism. The high amplitude of seasonal deformation is probably attributed to the shallow water content in the sediments forming banks of the Yellow River, indicating that the distance to the water source may affect the level of seasonal perturbation.
At the margins of Heitai, we find that the eastern margin exhibits a much large seasonal amplitude than other margins. Previous studies have shown that the stratum beneath the loess mass tilted to the east, causing the ground water to gravitationally seep from west to east. The resulted water concentration thus explains the observed higher amplitudes of seasonal deformation on the east margin.
The fluctuations of the precipitation can change the hydrological equilibrium of loess terraces, introducing the periodicity in the time-series displacements. Our CWT analysis on all the selected areas shows evident seasonality at the period of 1 year, and the time-series displacements are highly correlated with the precipitation records, clearly revealing the essential role of precipitation in triggering/accelerating the motion of landslides. The 20 to 55 days of time lag between time-series deformation and rainfall indicates the response time for the infiltration process from the surface to the stratum. Another interesting relationship is between deformation velocities and the temperature. We find that low temperatures are always accompanied by a high value of uplifting velocities in winter. As the Heifangtai region is deep interior on the Loess Plateau, seasonal frozen soil results in frost heave, causing ground lifting that was captured by the InSAR data. Different from precipitation, the response time of velocity to temperature is almost in-phase, particularly in winter, indicating that the frost heave process occurs much faster than infiltration (Figure 12). We also observe a gradual increasing time-lag between displacements to rainfalls and a decreasing time-lag between velocities to temperature (Figures 11E, 12E). Whether they are due to the boundary effect of wavelet analysis or a continual change of the hydrological property is still unclear.
In addition to natural factors, irrigation on the Heitai terraces also plays an important role in controlling the spatial and temporal patterns of surficial deformation. However, because only the annual allocation of irrigation volume is available, we are not able to apply the wavelet analysis to investigate the relation between displacements and irrigation. Instead, we normalize the detrended and averaged annual displacements from 2015 to 2020 and plot them with the monthly irrigation volumes in Figure 13. The results reveal a reasonable correlation between deformation and irrigation volume, suggesting a direct and primary controlling role of irrigation on surficial deformation. Interestingly, deformation in winter has robustly lifted together with irrigation in November. We infer that irrigation in winter may amplify the frost heave, enhancing the uplift we observed in winter. Another interesting finding is the mismatch of the onset between M2 and the other areas, which are highlighted in Figure 12B. The initial movement in M2 is about 1 month earlier than that of the selected areas, while immediately after the large volume of irrigation in March. Because M2 is the only location where irrigation is directly carried out, this 1 month early onset of accelerating displacement implies a connected groundwater system where water seeps from the areas directly irrigated to the residential areas nearby. Moreover, as the chronic irrigation infiltrates a large amount of water into the platform, it may intensify the frost heave on the slopes at its margins, reducing their stability and finally causing mudflows or landslides that endanger the residents.
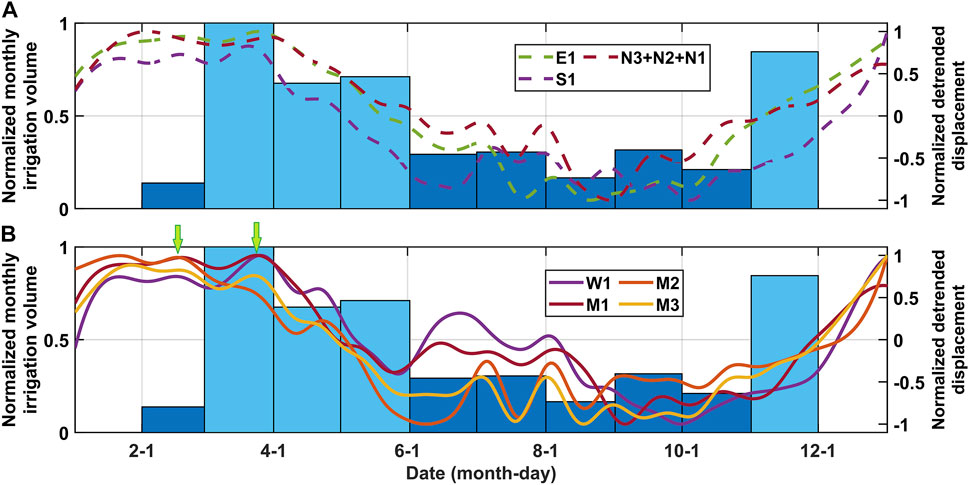
FIGURE 13. Annual allocation of crop irrigation (blue bars, left vertical axes) against detrended displacements (colored lines, right vertical axes). (A) Regions at the edge and (B) regions upon the platform shown in Figure 7. Light blue bars correspond to months with greater volume of irrigation in marked comparison with the others in mazarine. It is to be noted that no irrigation in January and December is carried out. Because displacements of N1, N2, and N3 close to each other are highly correlated, a substitute of sum from them is done. Green arrows in (B) highlight the time mismatch of onset between M2 and the others.
For the explanation of characteristics of the time series we observed, we propose that the displacements are mainly attributed to two potential processes, one is the annual freeze–thaw cycle of soil moisture (Henry, 2007; Li et al., 2018a) because of prominent temperate continental climate covering this region, and the other is collapse of loess due to water seepage (Cui et al., 2018). Both of these have a significant impact on the stability of loess mass. Specifically, chronic water seepage causes long-term subsidence in time-series displacements that has a cyclical rate approximately covarying with the intensity of water volume. On the other hand, expansion of frozen soils due to seasonal frost heave is a common condition in cold regions (Miao et al., 2020). When the temperature drops below the frozen temperature, an upward component immediately appears in time-series displacement that can be verified from the wavelet analysis between temperature and deformation velocity series. In brief, the combination of these two processes introduces a continued subsidence and seasonal variation in the surficial deformation. Considering that the freeze–thaw cycle can widely change the geotechnical properties (Peppin and Style, 2013; Yang et al., 2015; Zhou et al., 2018), along with the heavy irrigation activity since 1970s, monitoring network construction and water management is highly required for maintaining a sustainable environment in the Heifangtai region.
In this work, we obtained the time-series displacements and velocities of in the Heifangtai region from October 2014 to March 2021 from Sentinel-1 SAR image response to temperature, precipitation, and irrigation volume. Our results show systematic subsidence on the terraces, which may pose damage on residential infrastructures. The amplitudes of seasonal deformation are used as a proxy of intensities of hydrological activities. High amplitudes are found to be adjacent to the Yellow River and be well-coincident to other water sources, e.g., springs. From the CWT and WTC analyses, we identify that precipitation precedes displacement by about 1–2 months, while the WTC between temperature and velocities time series show a nearly in-phase relationship. The comparison between monthly irrigation volumes and average annual time-series displacements showed that the displacements were proportional to irrigation (Figure 13) from March to October, indicating the important role of irrigation on seasonal deformation. Our study demonstrates the advantages of wavelet tools in the analysis of a non-stationary process in natural combined with time-series InSAR analysis. However, we only carried out correlation analysis between surficial deformation and some hydrological parameters. Further study focusing on their controlling mechanism is critical for better understanding loess collapse and guidance on forecasting landslides. We highlight that the rapid retrogressions of the terraces in this region may be accelerated by both the natural and anthropogenic factors and need careful consideration for local residences.
The raw data supporting the conclusions of this article will be made available by the authors, without undue reservation.
TW conceived the study. ZC conducted the InSAR data processing and wavelet analysis. TW provided funding and supervising for the study. ZC wrote the manuscript reviewed and edited by TW. All authors discuss and interpret the results and the manuscript.
This work was supported by the China Geological Survey (Grant No. DD20211365) and the National Key Research and Development Program of China (2021YFC3000400).
Authors would like to express their gratitude to the European Space Agency (ESA) for providing the Sentinel-1 images for this study.
The authors declare that the research was conducted in the absence of any commercial or financial relationships that could be construed as a potential conflict of interest.
All claims expressed in this article are solely those of the authors and do not necessarily represent those of their affiliated organizations, or those of the publisher, the editors, and the reviewers. Any product that may be evaluated in this article, or claim that may be made by its manufacturer, is not guaranteed or endorsed by the publisher.
Baddoo, T., Guan, Y., Zhang, D., and Andam-Akorful, S. (2015). Rainfall variability in the huangfuchuang watershed and its relationship with ENSO. Water 7 (12), 3243–3262. doi:10.3390/w7073243
Berardino, P., Fornaro, G., Lanari, R., and Sansosti, E. (2002). A new algorithm for surface deformation monitoring based on small baseline differential SAR interferograms. IEEE Trans. Geosci. Remote Sens. 40 (11), 2375–2383. doi:10.1109/tgrs.2002.803792
Biggs, J., Wright, T., Lu, Z., and Parsons, B. (2007). Multi-interferogram method for measuring interseismic deformation: Denali Fault, Alaska. Geophys. J. Int. 170 (3), 1165–1179. doi:10.1111/j.1365-246X.2007.03415.x
Chatterjee, R. S., Fruneau, B., Rudant, J. P., Roy, P. S., Frison, P.-L., Lakhera, R. C., et al. (2006). Subsidence of Kolkata (Calcutta) city, India during the 1990s as observed from space by differential synthetic aperture radar interferometry (D-InSAR) technique. Remote Sens. Environ. 102 (1-2), 176–185. doi:10.1016/j.rse.2006.02.006
Chen, C. W., and Zebker, H. A. (2000). Network approaches to two-dimensional phase unwrapping: intractability and two new algorithms. J. Opt. Soc. Am. A 17 (3), 401–414. doi:10.1364/josaa.17.000401
Cohen-Waeber, J., Bürgmann, R., Chaussard, E., Giannico, C., and Ferretti, A. (2018). Spatiotemporal patterns of precipitation-modulated landslide deformation from independent component analysis of InSAR time series. Geophys. Res. Lett. 45 (4), 1878–1887. doi:10.1002/2017gl075950
Cui, S.-h., Pei, X.-j., Wu, H.-y., and Huang, R.-q. (2018). Centrifuge model test of an irrigation-induced loess landslide in the Heifangtai loess platform, Northwest China. J. Mt. Sci. 15 (1), 130–143. doi:10.1007/s11629-017-4490-0
Fan, X., Xu, Q., Scaringi, G., Li, S., and Peng, D. (2017). A chemo-mechanical insight into the failure mechanism of frequently occurred landslides in the Loess Plateau, Gansu Province, China. Eng. Geol. 228, 337–345. doi:10.1016/j.enggeo.2017.09.003
Farge, M. (1992). Wavelet transforms and their applications to turbulence. Annu. Rev. Fluid Mech. 24, 395–458. doi:10.1146/annurev.fl.24.010192.002143
Ferretti, A., Prati, C., and Rocca, F. (2001). Permanent scatterers in SAR interferometry. IEEE Trans. Geosci. Remote Sens. 39 (1), 8–20. doi:10.1109/36.898661
Ferretti, A., Savio, G., Barzaghi, R., Borghi, A., Musazzi, S., Novali, F., et al. (2007). Submillimeter accuracy of InSAR time series: Experimental validation. IEEE Trans. Geosci. Remote Sens. 45 (5), 1142–1153. doi:10.1109/tgrs.2007.894440
Ferretti, A., Fumagalli, A., Novali, F., Prati, C., Rocca, F., and Rucci, A. (2011). A new algorithm for processing interferometric data-stacks: SqueeSAR. IEEE Trans. Geosci. Remote Sens. 49 (9), 3460–3470. doi:10.1109/tgrs.2011.2124465
Gao, G. (1996). The distribution and geotechnical properties of loess soils, lateritic soils and clayey soils in China. Eng. Geol. 42 (1), 95–104. doi:10.1016/0013-7952(95)00056-9
Goldstein, R. M., and Werner, C. L. (1998). Radar interferogram filtering for geophysical applications. Geophys. Res. Lett. 25 (21), 4035–4038. doi:10.1029/1998gl900033
Grinsted, A., Moore, J. C., and Jevrejeva, S. (2004). Application of the cross wavelet transform and wavelet coherence to geophysical time series. Nonlinear Process. Geophys. 11 (5/6), 561–566. doi:10.5194/npg-11-561-2004
Gu, T.-f., Zhang, M.-s., Wang, J.-d., Wang, C.-x., Xu, Y.-j., and Wang, X. (2019a). The effect of irrigation on slope stability in the Heifangtai Platform, Gansu Province, China. Eng. Geol. 248, 346–356. doi:10.1016/j.enggeo.2018.10.026
Gu, T., Wang, J., Wang, C., Bi, Y., Guo, Q., and Liu, Y. (2019b). Experimental study of the shear strength of soil from the Heifangtai platform of the Loess Plateau of China. J. Soils Sediments 19 (10), 3463–3475. doi:10.1007/s11368-019-02303-9
Guo, P., Meng, X., Li, Y., Chen, G., Zeng, R., and Qiao, L. (2015). Effect of large dams and irrigation in the upper reaches of the Yellow River of China, and the geohazards burden. Proc. Geologists'. Assoc. 126 (3), 367–376. doi:10.1016/j.pgeola.2015.03.009
Henry, H. A. L. (2007). Soil freeze–thaw cycle experiments: Trends, methodological weaknesses and suggested improvements. Soil Biol. Biochem. 39 (5), 977–986. doi:10.1016/j.soilbio.2006.11.017
Herrera, G., Gutiérrez, F., García-Davalillo, J. C., Guerrero, J., Notti, D., Galve, J. P., et al. (2013). Multi-sensor advanced DInSAR monitoring of very slow landslides: The Tena Valley case study (Central Spanish Pyrenees). Remote Sens. Environ. 128, 31–43. doi:10.1016/j.rse.2012.09.020
Hooper, A., Zebker, H., Segall, P., and Kampes, B. (2004). A new method for measuring deformation on volcanoes and other natural terrains using InSAR persistent scatterers. Geophys. Res. Lett. 31 (23). doi:10.1029/2004gl021737
Hou, X., Vanapalli, S. K., and Li, T. (2018). Water infiltration characteristics in loess associated with irrigation activities and its influence on the slope stability in Heifangtai loess highland, China. Eng. Geol. 234, 27–37. doi:10.1016/j.enggeo.2017.12.020
Hou, X., Vanapalli, S. K., and Li, T. (2019). Wetting-induced collapse behavior associated with infiltration: A case study. Eng. Geol. 258, 105146. doi:10.1016/j.enggeo.2019.105146
Jiang, H., Feng, G., Wang, T., and Bürgmann, R. (2017). Toward full exploitation of coherent and incoherent information in Sentinel-1 TOPS data for retrieving surface displacement: Application to the 2016 Kumamoto (Japan) earthquake. Geophys. Res. Lett 44 (4), 1758–1767. doi:10.1002/2016gl072253
Labat, D. (2010). Cross wavelet analyses of annual continental freshwater discharge and selected climate indices. J. Hydrol. 385 (1-4), 269–278. doi:10.1016/j.jhydrol.2010.02.029
Li, G., Wang, F., Ma, W., Fortier, R., Mu, Y., Mao, Y., et al. (2018a). Variations in strength and deformation of compacted loess exposed to wetting-drying and freeze-thaw cycles. Cold Regions Sci. Technol. 151, 159–167. doi:10.1016/j.coldregions.2018.03.021
Li, X. A., Li, L., Song, Y., Hong, B., Wang, L., and Sun, J. (2018b). Characterization of the mechanisms underlying loess collapsibility for land-creation project in shaanxi Province, China—a study from a micro perspective. Eng. Geol. 249, 77–88. doi:10.1016/j.enggeo.2018.12.024
Liao, M., Tang, J., Wang, T., Balz, T., and Zhang, L. (2011). Landslide monitoring with high-resolution SAR data in the Three Gorges region. Sci. China Earth Sci. 55 (4), 590–601. doi:10.1007/s11430-011-4259-1
Liu, X., Zhao, C., Zhang, Q., Peng, J., Zhu, W., and Lu, Z. (2018). Multi-temporal loess landslide inventory mapping with C-X- and L-band SAR datasets—a case study of Heifangtai loess landslides, China. Remote Sens. 10 (11), 1756. doi:10.3390/rs10111756
Liu, X., Zhao, C., Zhang, Q., Yang, C., and Zhu, W. (2019). Heifangtai loess landslide type and failure mode analysis with ascending and descending Spot-mode TerraSAR-X datasets. Landslides 17 (1), 205–215. doi:10.1007/s10346-019-01265-w
Liu, Y., Qiu, H., Yang, D., Liu, Z., Ma, S., Pei, Y., et al. (2021). Deformation responses of landslides to seasonal rainfall based on InSAR and wavelet analysis. Landslides 19 (1), 199–210. doi:10.1007/s10346-021-01785-4
Massonnet, D., and Feigl, K. L. (1998). Radar interferometry and its application to changes in the Earth's surface. Rev. Geophys. 36 (4), 441–500. doi:10.1029/97rg03139
Meng, Q., Xu, Q., Wang, B., Li, W., Peng, Y., Peng, D., et al. (2019). Monitoring the regional deformation of loess landslides on the Heifangtai terrace using the Sentinel-1 time series interferometry technique. Nat. Hazards (Dordr). 98 (2), 485–505. doi:10.1007/s11069-019-03703-3
Miao, Q., Niu, F., Lin, Z., Luo, J., and Liu, M. (2020). Comparing frost heave characteristics in cut and embankment sections along a high-speed railway in seasonally frozen ground of Northeast China. Cold Regions Sci. Technol. 170, 102921. doi:10.1016/j.coldregions.2019.102921
Morishita, Y., Lazecky, M., Wright, T., Weiss, J., Elliott, J., and Hooper, A. (2020). LiCSBAS: An open-source InSAR time series analysis package integrated with the LiCSAR automated sentinel-1 InSAR processor. Remote Sens. 12 (3), 424. doi:10.3390/rs12030424
Neely, W. R., Borsa, A. A., Burney, J. A., Levy, M. C., Silverii, F., and Sneed, M. (2021). Characterization of groundwater recharge and flow in California's san joaquin valley from InSAR-observed surface deformation. Water Resour. Res. 57 (4), e2020WR028451. doi:10.1029/2020WR028451
Pan, P., Shang, Y.-q., Lü, Q., and Yu, Y. (2017). Periodic recurrence and scale-expansion mechanism of loess landslides caused by groundwater seepage and erosion. Bull. Eng. Geol. Environ. 78 (2), 1143–1155. doi:10.1007/s10064-017-1090-8
Peng, J., Fan, Z., Wu, D., Zhuang, J., Dai, F., Chen, W., et al. (2015). Heavy rainfall triggered loess–mudstone landslide and subsequent debris flow in Tianshui, China. Eng. Geol. 186, 79–90. doi:10.1016/j.enggeo.2014.08.015
Peng, W., Wang, Q., and Cao, Y. (2017). Analysis of ocean tide loading in differential InSAR measurements. Remote Sens. 9 (2), 101. doi:10.3390/rs9020101
Peng, D., Xu, Q., Liu, F., He, Y., Zhang, S., Qi, X., et al. (2018). Distribution and failure modes of the landslides in Heitai terrace, China. Eng. Geol. 236, 97–110. doi:10.1016/j.enggeo.2017.09.016
Peng, D., Xu, Q., Zhang, X., Xing, H., Zhang, S., Kang, K., et al. (2019). Hydrological response of loess slopes with reference to widespread landslide events in the Heifangtai terrace, NW China. J. Asian Earth Sci. 171, 259–276. doi:10.1016/j.jseaes.2018.12.003
Peppin, S. S. L., and Style, R. W. (2013). The physics of frost heave and ice-lens growth. Vadose Zone J. 12 (1), vzj2012.0049. doi:10.2136/vzj2012.0049
Perissin, D., and Wang, T. (2011). Time-series InSAR applications over urban areas in China. IEEE J. Sel. Top. Appl. Earth Obs. Remote Sens. 4 (1), 92–100. doi:10.1109/jstars.2010.2046883
Qi, X., Xu, Q., and Liu, F. (2018). Analysis of retrogressive loess flowslides in Heifangtai, China. Eng. Geol. 236, 119–128. doi:10.1016/j.enggeo.2017.08.028
Qiang, Z., Xu, C. Y., Jiang, T., and Wu, Y. (2007). Possible influence of ENSO on annual maximum streamflow of the Yangtze River, China. J. Hydrol. 333 (2-4), 265–274. doi:10.1016/j.jhydrol.2006.08.010
Samsonov, S., d’Oreye, N., and Smets, B. (2013). Ground deformation associated with post-mining activity at the French–German border revealed by novel InSAR time series method. Int. J. Appl. Earth Observ. Geoinf. 23, 142–154. doi:10.1016/j.jag.2012.12.008
Shi, X., Xu, Q., Zhang, L., Zhao, K., Dong, J., Jiang, H., et al. (2019a). Surface displacements of the Heifangtai terrace in Northwest China measured by X and C-band InSAR observations. Eng. Geol. 259, 105181. doi:10.1016/j.enggeo.2019.105181
Shi, X., Yang, C., Zhang, L., Jiang, H., Liao, M., Zhang, L., et al. (2019b). Mapping and characterizing displacements of active loess slopes along the upstream Yellow River with multi-temporal InSAR datasets. Sci. Total Environ. 674, 200–210. doi:10.1016/j.scitotenv.2019.04.140
Shi, X., Hu, X., Sitar, N., Kayen, R., Qi, S., Jiang, H., et al. (2021). Hydrological control shift from river level to rainfall in the reactivated Guobu slope besides the Laxiwa hydropower station in China. Remote Sens. Environ. 265, 112664. doi:10.1016/j.rse.2021.112664
Tomás, R., Li, Z., Lopez-Sanchez, J. M., Liu, P., and Singleton, A. (2015). Using wavelet tools to analyse seasonal variations from InSAR time-series data: a case study of the Huangtupo landslide. Landslides 13 (3), 437–450. doi:10.1007/s10346-015-0589-y
Tong, X., and Schmidt, D. (2016). Active movement of the Cascade landslide complex in Washington from a coherence-based InSAR time series method. Remote Sens. Environ. 186, 405–415. doi:10.1016/j.rse.2016.09.008
Torrence, C., and Compo, G. P. (1998). A practical guide to wavelet analysis. Bull. Am. Meteorol. Soc. 79 (1), 61–78. doi:10.1175/1520-0477(1998)079<0061:apgtwa>2.0.co;2
Torrence, C., and Webster, P. J. (1998). The annual cycle of persistence in the El Nino/Southern Oscillation. Q. J. R. Meteorological Soc. 124, 1985–2004. doi:10.1256/smsqj.55009
Torrence, C., and Webster, P. J. (1999). Interdecadal changes in the ENSO--monsoon system. J. Clim. 12, 2679–2690. doi:10.1175/1520-0442(1999)012<2679:icitem>2.0.co;2
Wang, J.-J., Liang, Y., Zhang, H.-P., Wu, Y., and Lin, X. (2013). A loess landslide induced by excavation and rainfall. Landslides 11 (1), 141–152. doi:10.1007/s10346-013-0418-0
Xu, L., Dai, F. C., Gong, Q. M., Tham, L. G., and Min, H. (2011). Irrigation-induced loess flow failure in Heifangtai platform, north-west China. Environ. Earth Sci. 66 (6), 1707–1713. doi:10.1007/s12665-011-0950-y
Xu, L., Dai, F., Tu, X., Tham, L. G., Zhou, Y., and Iqbal, J. (2013). Landslides in a loess platform, North-West China. Landslides 11 (6), 993–1005. doi:10.1007/s10346-013-0445-x
Xu, Q., Peng, D., Zhang, S., Zhu, X., He, C., Qi, X., et al. (2020). Successful implementations of a real-time and intelligent early warning system for loess landslides on the Heifangtai terrace, China. Eng. Geol. 278, 105817. doi:10.1016/j.enggeo.2020.105817
Yang, Z., Still, B., and Ge, X. (2015). Mechanical properties of seasonally frozen and permafrost soils at high strain rate. Cold Regions Sci. Technol. 113, 12–19. doi:10.1016/j.coldregions.2015.02.008
Zhang, F., and Wang, G. (2018). Effect of irrigation-induced densification on the post-failure behavior of loess flowslides occurring on the Heifangtai area, Gansu, China. Eng. Geol. 236, 111–118. doi:10.1016/j.enggeo.2017.07.010
Zhang, Y., Meng, X. M., Dijkstra, T. A., Jordan, C. J., Chen, G., Zeng, R. Q., et al. (2020). Forecasting the magnitude of potential landslides based on InSAR techniques. Remote Sens. Environ. 241, 111738. doi:10.1016/j.rse.2020.111738
Zhou, Z., Ma, W., Zhang, S., Mu, Y., and Li, G. (2018). Effect of freeze-thaw cycles in mechanical behaviors of frozen loess. Cold Regions Sci. Technol. 146, 9–18. doi:10.1016/j.coldregions.2017.11.011
Zhou, Q., Xu, Q., Peng, D., Fan, X., Ouyang, C., Zhao, K., et al. (2020). Quantitative spatial distribution model of site-specific loess landslides on the Heifangtai terrace, China. Landslides 18 (3), 1163–1176. doi:10.1007/s10346-020-01551-y
Keywords: loess terrace, InSAR time-series analysis, wavelet analysis, seasonal displacements, phase shift
Citation: Cao Z and Wang T (2022) Water-temperature controlled deformation patterns in Heifangtai loess terraces revealed by wavelet analysis of InSAR time series and hydrological parameters. Front. Environ. Sci. 10:957339. doi: 10.3389/fenvs.2022.957339
Received: 31 May 2022; Accepted: 08 August 2022;
Published: 01 September 2022.
Edited by:
Jun Hu, Central South University, ChinaReviewed by:
Wu Zhu, Chang’an University, ChinaCopyright © 2022 Cao and Wang. This is an open-access article distributed under the terms of the Creative Commons Attribution License (CC BY). The use, distribution or reproduction in other forums is permitted, provided the original author(s) and the copyright owner(s) are credited and that the original publication in this journal is cited, in accordance with accepted academic practice. No use, distribution or reproduction is permitted which does not comply with these terms.
*Correspondence: Teng Wang, d2FuZy50ZW5nQHBrdS5lZHUuY24=
Disclaimer: All claims expressed in this article are solely those of the authors and do not necessarily represent those of their affiliated organizations, or those of the publisher, the editors and the reviewers. Any product that may be evaluated in this article or claim that may be made by its manufacturer is not guaranteed or endorsed by the publisher.
Research integrity at Frontiers
Learn more about the work of our research integrity team to safeguard the quality of each article we publish.