 Siming Liu1
 Junguo Shi
 Muhammad Mohsin
 Sobia Naseem
- 1Institute for Optimization and Decision Analytics, Liaoning Technical University, Fuxin, China
- 2Institute for Optimization and Decision Analytics, Liaoning Technical University, Fuxin, China
- 3School of Finance and Economics, Jiangsu University, Zhenjiang, China
- 4School of Finance and Economics, Jiangsu University, Zhenjiang, China
- 5School of Business, Hunan University of Humanities, Science and Technology, Loudi, China
- 6School of Finance and Economics, Jiangsu University, Zhenjiang, China
This research aims to identify the periodical impact of industrial development, renewable energy, economic growth, and gross capital formation on environmental deterioration in BRICS countries. The analytical procedure is based on the annual data from 1995 to 2020. The selected econometric methods which are used to determine the relationship among exogenous and endogenous variables are panel unit-root tests for stationarity check, Johansen co-integration test for co-integration relationship, and FMOLS and quantile regression for long-run relationship. The empirical research findings confirm a significant positive association of environmental deterioration with industrial development, GDP, and GCF, while a significant negative relationship was observed between CO2 emission and renewable energy. The BRICS group of countries should be more focused on environmentally friendly technological development as they are concerned with economic growth. Renewable energy resources positively impact the environmental quality, so backward resources should be replaced with renewable energy resources to attain double impacts, that is, the reduction of CO2 emission with the reduction of oldfangled resources and increase in the environmental quality with the aggrandizement of renewable energy resources. Based on key findings and implications of the sectorial and whole economic growth of BRICS countries, this research suggests some policy implications for reducing toxic CO2 emissions and enhancing the quality of the environment.
1 Introduction
Global temperature rise (relative to pre-industrial levels) is anticipated to exceed the 2015 Paris Agreement’s 1.5°C targets by 2,100. To successfully bend the temperature curve toward 1.5°C, the Intergovernmental Panel on Climate Change (IPCC) estimates that global emissions must be cut in half over the next decade, with net-zero emissions reached by the middle of the century. Global warming of approximately 2.7°C over pre-industrial levels is projected due to current policy regimes being implemented around the world. Global warming will be limited to 2.4°C by nationally determined contributions (NDCs). The Climate Action Tracker (CAT), an impartial analysis tool, evaluates a country’s performance in terms of current policies, pledges, and ambitions to reduce global warming to 1.5°C (Naseem et al., 2021a; Jamil et al., 2021). It gives countries direction on whether they need to do more in climate action by revealing the existence and extent of departure from the planned global warming goal. On the other hand, the CAT examines projected performance based on multiple assumptions, leaving the potential for ambiguity in such assessments. Various governments’ pledges and ambitions, such as the NDCs and long-term net-zero aims, are projected to keep warming to 2.1°C. Global warming is expected to reduce to 1.8°C under the optimistic scenario that 140 countries have already committed to net-zero targets and those contemplating it keep their promises. However, the considerable gap between what governments offer (securities and targets) and what they achieve is concerning (Naseem et al., 2021b; Mohsin et al., 2022a; Sarfraz et al., 2022). This disparity—governments failing to deliver on declared commitments and targets—raises doubts about the optimistic projections’ reality. The existing literature on environmental sustainability from a global perspective is presented in Table 1 with minor research details. Table 1 has also enlightened the uniqueness of this research work.
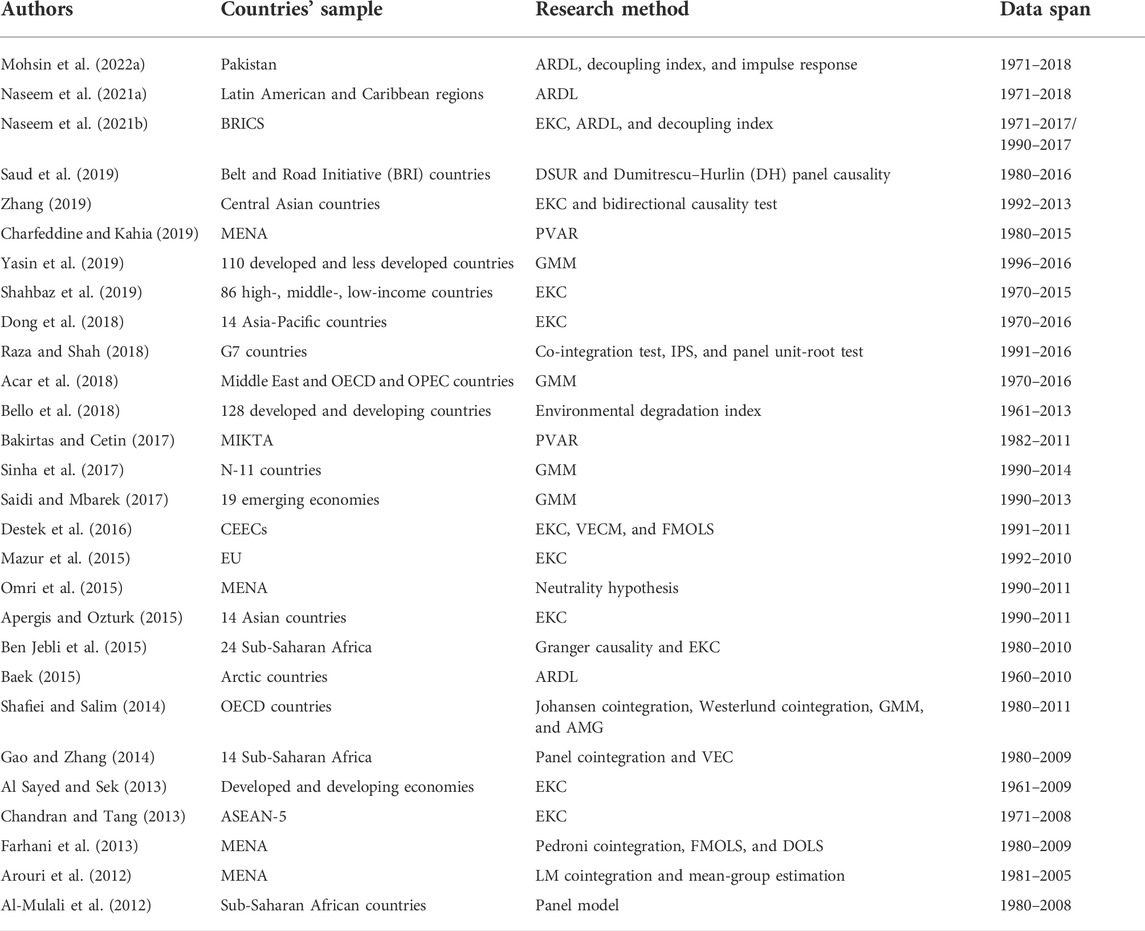
TABLE 1. Panel studies on environments with different econometric methods.
The selection of BRICS countries for this research can be understood as the BRICS countries—Brazil, Russia, India, China, and South Africa—with a combined population of 3.2 billion people loom prominently in any discussion about the world’s chances of avoiding climate disaster. They are not the world’s poorest economies, but their per capita GDP is just 20% of the European Union’s and only 13% of that of the G7 (Jamil et al., 2021). These five countries are responsible for more than half of the G20’s overall emissions (Ahmad & Zheng, 2021; Nathaniel et al., 2021). Modernization raises the demand for energy services, leading to a rise in greenhouse gas (GHG) emissions if all other factors remain constant. But not everything is equal: BRICS emissions are roughly four times higher per dollar of GDP than the EU and G7 economies, highlighting the strategic linkages between economic development, energy productivity, and decarbonization. The BRICS Earth Index for 2019 is −95%, meaning that their emissions increased by nearly the same amount they needed to decrease to meet their long-term net-zero goals. China and India account for 82% of all BRICS emissions (Ullah & Nasim, 2021; Wang, 2021). Both countries saw rises across the board in 2019 and do not expect their emissions to decline until 2030. The BRICS countries have emphasized the importance of cooperation in adopting the UN Convention on Biological Diversity’s post-2020 Global Biodiversity Framework. They have regularly used their G20 position to nudge the bloc to consider deep-rooted reforms on climate change, energy efficiency, environmental assessment benchmarking, and energy security. Since the group’s formation, the BRICS summits have made various forward-looking commitments on climate change. The BRICS reaffirmed their cooperation in the fight against climate change at the seventh iteration of the BRICS Environment Ministerial in August 2021, held ahead of the 15th meeting of the Conference of the Parties (COP) to the Convention on Biological Diversity in October and the Glasgow Climate Change Conference (COP26) in November (Chien et al., 2021; Liu et al., 2021).
The primary causes for a drop in greenhouse gas emissions in Brazil in 2019 were emission reductions in the electricity and building sectors. However, they were still less than half of what would have been required to meet their 2030 objective. Furthermore, because it excludes the impact of deforestation, the Earth Index understates the “say-do” divide in Brazil. Unsustainable logging of the rainforest added 9.5% to Brazil’s net emissions in 2020, more than five times the reductions made in all other industries in 2019. Russia’s economy was one of the most GHG-intensive economies in the G20 in 2019, owing to the country’s high reliance on oil and gas, low energy efficiency, and antiquated technology and infrastructure (Chishti et al., 2021; Zhao et al., 2021). In 2019, emission reductions were four times lower than their mediocre aim. Today, Russia appears bound for a profound and lengthy economic collapse, with uncertain implications for its climate change response, given the harsh sanctions it faces as a result of its invasion of Ukraine. India has the lowest per capita GDP of the G20, a population of 1.4 billion people, an 80% fossil fuel-dependent power sector, and the lowest industrial and agricultural energy productivity of the G20 (Chishti et al., 2021; Zhao et al., 2021). On the other hand, increased carbon-free electricity supply and greater energy efficiency, notably in the development and use of new biofuels, offer unrivalled opportunities for decarbonization. India’s recent economic stimulus investment focuses on solar photovoltaic and battery development. However, continuous investment in old and new coal-fired power plants is hampered. Renewable energy and vehicle electrification are expanding quicker in China than any place in the world, but coal-fired power is growing faster than anywhere else. Even when measured against China’s long-term goal of net-zero emissions by 2060, the real consequence was a massive 434-megatonne rise in GHG emissions in 2019, earning an Earth Index of −133%.
Chinese clean-tech may be assisting other nations in decarbonization (especially since it ceased granting financing to develop coal power plants abroad last year). Still, it is locking in emissions growth until 2030 or later by building additional coal-fired power plants at home. South Africa, a latecomer to BRICS and the group’s weakest economy, saw its emissions rise in every sector in 2019, earning the country a −62% Earth Index. South Africa is a coal-dependent country, with the electricity industry accounting for 41% of the country’s greenhouse gas emissions in 2019 (Ganda, 2021; Li et al., 2021). South Africa has abundant renewable energy resources, including one of the world’s most extraordinary solar regimes. The Renewable Energy Independent Power Producer Procurement Program, which started slowly, with only 5.5 megawatts of solar photovoltaic energy by 2020, is currently rapidly expanding, with a target of 8,400 megawatts of solar generation by 2030, enough to power 1.5 million households. The cost of climate change is rapidly increasing for BRICS, for all countries (Chien et al., 2021; Liu et al., 2021). They are more vulnerable and unprepared to deal with the storms, floods, and droughts accompanying global warming. The most cost-effective decarbonization options are concentrated in the BRICS countries and other developing economies, underlining the importance of boosting investment flows to these rising economies.
This research’s uniqueness and glistening greenness can be elaborated as novel, employing an approach to actual knowledge in environmental-economic development. The leading focus of this research is to check the influence of industrial development, economic growth, and renewable energy on environmental deterioration, and the BRICS group of countries are perfect for this research because most of them are industry-based economies. The maximum possible data range from 1995 to 2020 is approached to widen the study and comprehensively explore the periodical relationship among variables. FMOLS and quantile regression are employed to check the nature relationship and behavior of variables toward each other. In this age of digitalization, economic growth and energy use are compulsory parts of each other. In contrast, oldfangled energy resources are not environmentally friendly as per the existing research work on renewable energy as environmentally friendly energy resources motivate to consider a variable to check its impact on BRICS environmental quality. The environmental damages are elaborated as CO2 emissions, which embody environmental excellence and ease to calculate for environmentalists.
2 Data description and econometric methodology
2.1 Data description
This research is based on the annual data series of BRICS countries from 1995 to 2020, extracted from the World Development Indicator (WDI) and the Our World Data (OWD). In this research, environmental deterioration is a dependent variable which is presented as CO2 emission with four independent variables, that is, industrial development (IND), renewable energy (RE), economic growth (GDP), and gross capital formation (GCF). The minor details of variables are presented in Table 2, and the abbreviation columns cover the abbreviation of the primary model of this research.
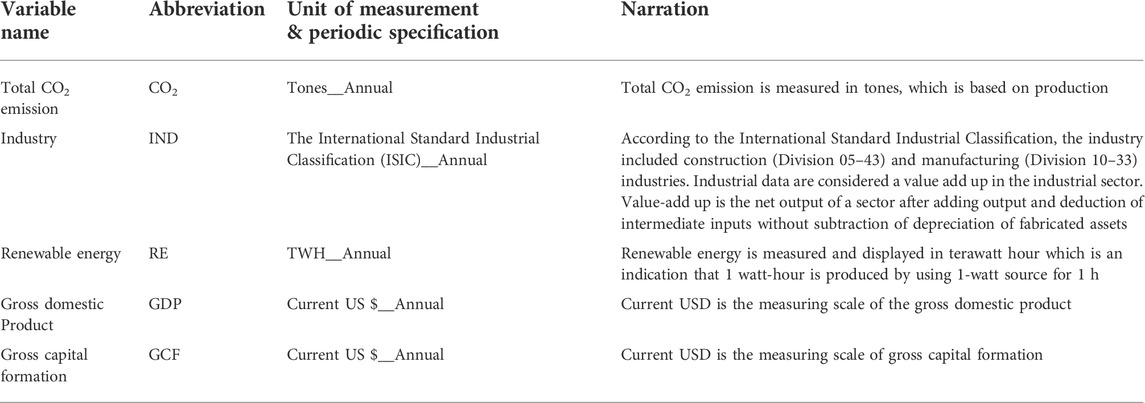
TABLE 2. Data description.
2.2 Econometric methodology
This research will analyze the relationship between environmental deterioration, industrial sector, renewable energy, gross domestic product, and gross capital formation of BRICS countries. The primary model of running research is presented as follows:
The primary research model is presented in Eq. 1 with dependent and independent variable declaration. Environmental deterioration (CO2 emission) is considered a dependent variable that will indicate the BRICS countries’ environmental damages, whereas industries, renewable energy, GDP, and GCF are independent variables. The last acronym
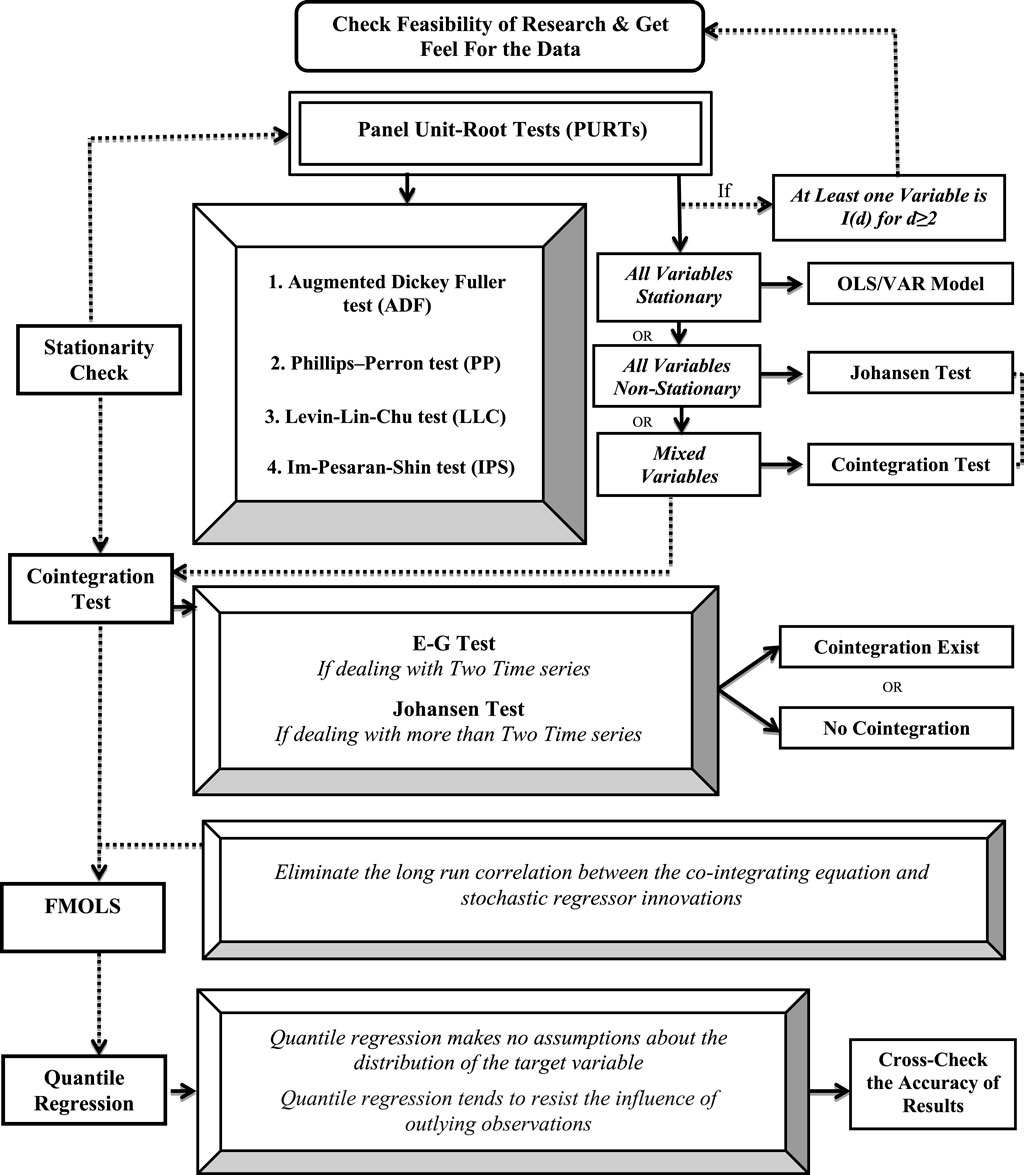
FIGURE 1. Analytical procession of research.
2.2.1 Unit-root test
The unit-root tests are employed to check the stationarity in a time series. The stationarity of the time series is confirmed if the time period shifting does not cause a change in the data distribution shape, while the existence of the unit root indicates the non-stationarity of the time series. The unit-root presence in the time series makes the systematic pattern unpredictable which disturbs the accuracy of the results by generating spurious regression (high R2 value) and errant behavior (T-ratio does not follow the t-distribution). Some renowned econometric methods check the unit root at the level and first difference to normalize the data series for other analytical processes (Choi, 2001). The basic fundamental equation of the unit-root test is as follows:
In Eq. 2,
The augmented Dickey–Fuller (ADF) test is based on linear regression, which is applicable to serial correlation. The ADF deals with more extensive and complex models. The standard equation of the ADF test is generated by using a basic equation after subtraction of
Eq. 3 is designed with the inclusion of two new signs in Eq. 2, that is,
The Phillips–Perron (PP) test is a modified form of the Dickey–Fuller test, which overcomes the errors’ issues of autocorrelation and heteroskedasticity.
In Eq. 4,
The Levin–Lin–Chu (LLC) test estimates of
The second set of coefficients with an analogy of
Proxies are attained by standardizing
The standard error estimates by
The Im–Pesaran–Shin (IPS) test determines individual unit root processes with varying values of
Hypothetical approaches to the IPS test are
The ith value is reordered if necessary for the interpretation of non-zero fraction of the individual processes’ stationarity (Shin & Lee, 2008).
2.2.2 Johansen Fisher panel co-integration method
The Johansen Fisher panel co-integration method assures the accuracy of the co-integration relationship of more than three or more time series by approaching the maximum likelihood estimation (MLE). The Johansen co-integration method is divided into two parts, that is, trace and maximum eigenvalue. The first part trace is from linear algebra while the second part maximum eigenvalue approaches a special scalar (Wallace & Warner, 1993). A special scalar means when the matric is multiplied with a vector and the same vector is obtained as an output, along with a new scalar, the scalar is known as an eigenvalue. Both parts of it determine the presence of co-integration. On the basis of the vector auto-regression (VAR), the equational structure of Johansen co-integration is as follows:
In Eq. 9,
In Eq. 10, the coefficient matrix is represented by
2.2.3 Fully modified ordinary least square (FMOLS)
The FMOLS is a semi-parametric correction approach that eliminates long-run correlation problems between stochastic regressor innovation and the co-integration equation. FMOLS estimation is an unbiased and efficient mixture of asymptotic series (Phillips & Hansen, 1990). The preliminary estimation of symmetric and one-sided long-run covariance matrices of the residuals is determined by the FMOLS. The FMOLS estimation equation is given as follows:
In Eq. 11,
2.2.4 Quantile regression
The quantile regression is used to check the conditional median and other quantiles. The QR is an extended form of linear regression because it is robust against outliers of data which overcome the demerits of linear regression (Ferrando et al., 2017). The QR is more reliable due to its conditional quantile function which determines conditional central tendency and statistical dispersion (Gyamfi et al., 2022). The heterogeneous effect does not disturb the results while running the quantile regression (Fitzenberger et al., 2022). The equation of quantile regression is given as follows:
In Eq. 12, the dependent variables are presented as
Eq. 13 is designed to measure the reduction in median absolute deviation by regular quantization. By following the fundamental structure of the quantile regression, the equation of this research is designed as shown in Eq. 14.
In Eq. 14, CO2 emission is representative of the environmental condition of the BRICS countries, coefficients indicated by
3 Empirical results
The analytical process starts with the panel unit-root tests (PURTs), which are fundamentally used to check the stationarity and normal distribution of data series. The results of four selected unit-root tests are presented in Table 3. In Table 3, the selected tests are abbreviated as the augmented Dickey–Fuller (ADF), the Phillips–Perron (PP), the Levin–Lin–Chu (LLC), and the Im–Pesaran–Shin (IPS) tests. At the same time, integration levels are also presented as level I (0) and the first difference I (1). The selected variables under PURTs are significant at first difference with 1, 5 and 10% confidence levels. The significance of all variables at first difference allowed moving the following process of the Johansen co-integration test.

TABLE 3. Unit-root test.
The results of the co-integration test are presented in Table 4. The Johansen co-integration test reported two types of results, that is, first trace statistics and second maximum eigenvalue
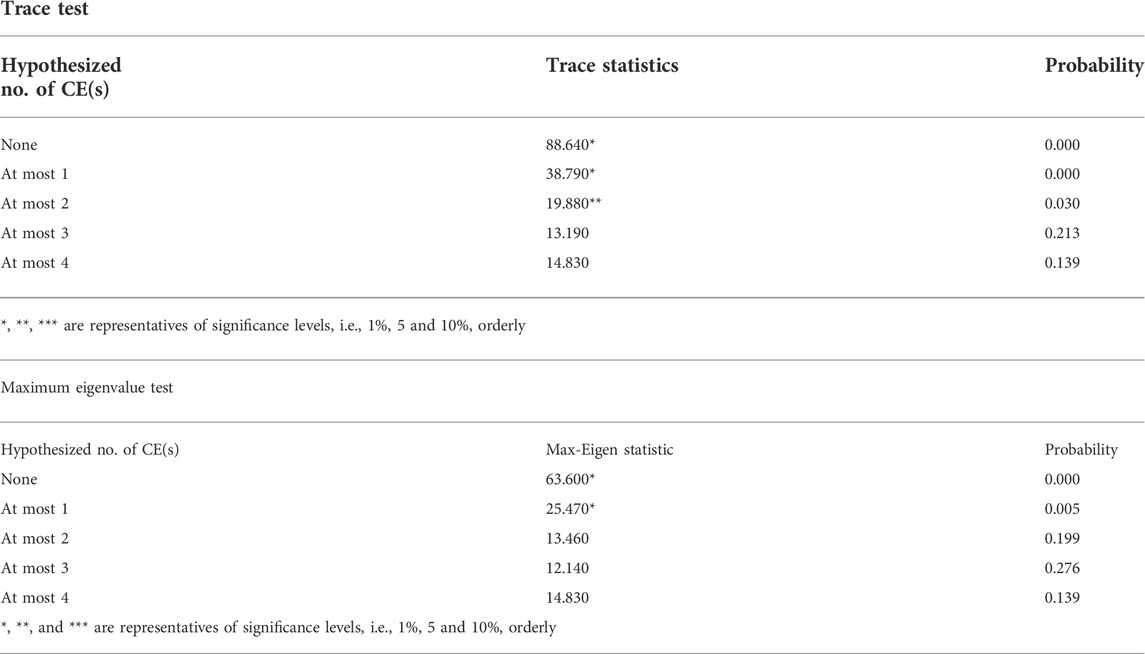
TABLE 4. Johansen Fisher panel cointegration test.
In Table 5, the results of the fully modified ordinary least square (FMOLS) are presented, indicating the panel’s long-run elasticity. The FMOLS is the most accurate and acceptable method to check the long-run relationship among variables with the existence of simultaneity biases, serial correlation, and non-exogeneity. All selected variables are significant at a 1% level with positive and negative signs. Industrial development (IND), economic development (GDP), and gross capital formation (GCF) are positively significant, while renewable energy (RE) is negatively significant (Naseem et al., 2021b). The coefficient values of variables are industrial development (9.00E-02), renewable energy (−2.68E-03), economic development (6.41E-05), and gross capital formation (8.01E-13), which indicates the contribution of variables to CO2 emission. The standard errors and t-statistics are also presented for comprehensive result coverage. Industrial development, economic growth, and gross capital formation positively increase CO2 emission, and renewable energy negatively contributes to CO2 emission (Asongu et al., 2019; Li et al., 2021). The negative contribution of renewable energy to CO2 emission confirms the advantages of renewable energy as it is inexhaustible, environmentally friendly, reliable, and is resilient in nature. The positive contribution of industrial development, economic growth, and gross capital formation toward CO2 emission is genuine. Industrial development becomes the reason for different toxic emissions, including CO2 emission, a more proficient element of environmental deterioration. The economic growth of BRICS countries negatively contributes to environmental destruction because of compromising on the environment and focusing on the economic development of these countries (Temiz Dinç & Akdoğan, 2019; Sasmaz et al., 2020). The gross capital formation is close to GDP, both reacting the same toward environmental deterioration. The results of the FMOLS are shown in Figure 2.
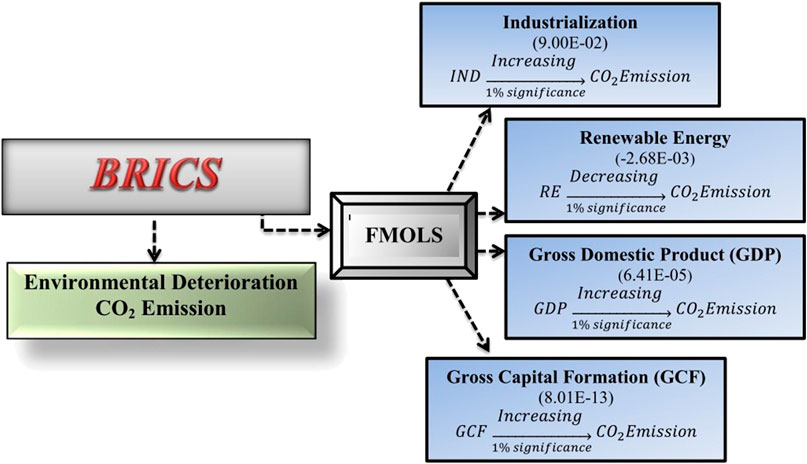
FIGURE 2. Results of fully modified FMOLS.

TABLE 5. Estimated fully modified ordinary least square (FMOLS).
Table 6 presents the quantile regression results by considering CO2 emission dependence and the rest of the four variables, that is, independent variables. Renewable energy is negatively significant from the 1st to 9th quantile at 1% except for the 9th quantile because the 9th quantile is significant at a 5% significance level. The negative sign of renewable energy confirmed the negative relationship between renewable energy and CO2 emission (Asongu et al., 2019; Li et al., 2021). Industrial development, GDP, and GCF show a sign of positivity with their coefficients. The 7th and 9th quantiles of industrial development are significant at 5%, while the 9th quantile of GDP is significant at 10%. The 9th quantile of GCF is positively insignificant. As per the FMOLS results, renewable energy contributes to environmental deterioration while industrial development, GDP, and GCF contribute positively (Yikun et al., 2021). The quantile regression results also confirmed the exact behavior of variables toward the environment. The results of quantile regression are also presented in graphical form in Figure 3.

TABLE 6. Quantile regression with dependent variable CO2 emission.

FIGURE 3. Results of the quantile regression process.
4 Discussion
This is a long-running and nuanced discussion, but one significant point is that economic development should improve human well-being and quality of life not maximize GDP. Human well-being is determined by “human capital” (e.g., health and knowledge), “social capital” (e.g., family, friends, and social networks), and “natural capital” (i.e., ecosystems and the benefits they provide)—none of which are necessarily connected with GDP. GDP is only a measure of that means, and sectorial development is merely a means to that objective. GDP reflects the expenses of economic activity rather than the rewards with its positive association with CO2 emission. Increased industrial material consumption will certainly lower environmental quality beyond a certain point. Attempts to quantify these contributions using alternative measures of economic success often conclude that despite rises in GDP, environmental quality is not improving or even dropping in rich countries. As a result, rising per capita income in developing countries is expected to promote well-being but not environmental sustainability. Industrial consumption entails moving to goods or services with a lower environmental impact, which is related and complementary. Purchasing “greener items,” increasing spending on “services” rather than produced things, or joining arrangements like energy service contracting and car-sharing schemes are possibilities. Although data to back such assertions are typically inadequate, these practices are regularly claimed to have environmental benefits. A shift away from an unsustainable environment can be achieved by increasing green industrial development and green gross capital formation, particularly if it involves better service standards, significant transportation, or the construction of resource-intensive infrastructure such as telecommunications networks.
A shift to an industrial-oriented economy could increase carbon emissions (while increasing the carbon intensity of GDP) because of the production’s heavy reliance on manufactured goods and commodities. Despite this, most BRICS countries pay little attention to such risks and provide limited tools for minimizing the adverse effects. The preceding reasons point to a tension between reducing energy usage and carbon emissions in absolute terms while maintaining economic growth and enhancing the use of renewable energy. Green industrial consumption and production can lower the environmental impacts connected with each commodity or service and is the preferable option for achieving sustainability. However, the success of this strategy will be determined by the size of any related rebound effects. Industrial consumption habits are also shaped by factors such as the pursuit of status through the acquisition of symbolic “positional goods” (which creates a never-ending zero-carbon emission). An effective strategy will lower costs by reducing the demand for typical energy and other resources while also stimulating the increasing demand for renewable energy. A collective agreement between BRICS countries on ambitious, binding, and ever more restrictive targets will be required to address environmental problems like climate change at national and international levels.
5 Conclusion
Rapid industrial development and economic growth in BRICS countries have increased environmental challenges. Continuous economic growth necessitates increased energy use, primarily from fossil fuels, and thus increases greenhouse gas (GHG) emissions. Despite accounting for a substantial fraction of worldwide GHG emissions, carbon dioxide (CO2) emissions may not be sufficient to duplicate and investigate the complete environmental damage. This research has addressed environmental deterioration and its leading damaging factors, that is, industrial development, renewable energy, economic growth, and gross capital formation, by using the panel unit-root tests, Johansen co-integration test, FMOLS, and quantile regression. The group of BRICS countries comprises Brazil, Russia, India, China, and South Africa. The empirical finding confirmed the long-run relationship among the variables. Industrial development, GDP, and GCF positively contributed to CO2 emission, while renewable energy negatively contributes to toxic CO2 emission. The BRICS group of countries has industry-based economies which directly damage the environment and contribute to global environmental deterioration. Renewable energy comprises environmentally friendly resources that negatively contribute to toxic emissions of greenhouse gases and enhance the quality of environment-economic development.
5.1 Practical implications and future direction
The BRICS group of countries is considered a rapidly growing economy globally. They are keenly concerned about their economic growth if they include environmental sustainability in the priority list of economic growth, so they will be able to avoid the after-effects of environmental damages. According to economists and environmentalists, the medium growth of an economy with environmental sustainability is more effective and efficient than the high growth rate of an economy with environmental damage. This research considered BRICS countries with FMOLS and quantile regression. This research can be extended by comparing BRICS, G-7, and G-20 countries with the second generation of econometric methodologies in the future. Environmental damage costs the survival of human beings. Once environmental resources are destroyed, artificial resources that are not alternative to the original are generated. Artificial environmental resources are not cost-effective compared to working on the savage of original resources. Environmental sustainability has become a global concern today, and BRICS countries should also focus on it as an individual and a whole group. The government of BRICS countries should encourage environmentalists and policymakers to arrange workshops, seminars, and conferences for people’s awareness of environmental sustainability. The energy sectors should replace the toxic emitted energy resources with renewable, environmentally friendly energy resources.
Data availability statement
Publicly available datasets were analyzed in this study. These data can be found at: https://databank.worldbank.org/source/world-development-indicators#.
Author contributions
All authors listed have made a substantial, direct, and intellectual contribution to the work and approved it for publication.
Conflict of interest
The authors declare that the research was conducted in the absence of any commercial or financial relationships that could be construed as a potential conflict of interest.
Publisher’s note
All claims expressed in this article are solely those of the authors and do not necessarily represent those of their affiliated organizations, or those of the publisher, the editors, and the reviewers. Any product that may be evaluated in this article, or claim that may be made by its manufacturer, is not guaranteed or endorsed by the publisher.
References
Acar, Y., Gürdal, T., and Ekeryılmaz, Ş. (2018). Environmental Kuznets Curve for CO2 emissions: An analysis for developing, Middle East, OECD and OPEC countries. Environ. Socio-economic Stud. 6 (4), 48–58. doi:10.2478/environ-2018-0027
Ahmad, M., and Zheng, J. (2021). Do innovation in environmental-related technologies cyclically and asymmetrically affect environmental sustainability in BRICS nations? Technol. Soc. 67, 101746. doi:10.1016/j.techsoc.2021.101746
Al Sayed, A. R., and Sek, S. K. (2013). Environmental kuznets curve: Evidences from developed and developing economies. Appl. Math. Sci. 7 (22), 1081–1092. doi:10.12988/ams.2013.13098
Al-Mulali, U., and Sab, C. N. B. C. (2012). The impact of energy consumption and CO2 emission on the economic growth and financial development in the Sub Saharan African countries. Energy 39 (1), 180–186. doi:10.1016/j.energy.2012.01.032
Apergis, N., and Ozturk, I. (2015). Testing environmental Kuznets curve hypothesis in Asian countries. Ecol. Indic. 52, 16–22. doi:10.1016/j.ecolind.2014.11.026
Arouri, M. E. H., Youssef, A. B., M'henni, H., and Rault, C. (2012). Energy consumption, economic growth and CO2 emissions in Middle East and North African countries. Energy policy 45, 342–349. doi:10.1016/j.enpol.2012.02.042
Asongu, S. A., Iheonu, C. O., and Odo, K. O. (2019). The conditional relationship between renewable energy and environmental quality in sub-Saharan Africa. Environ. Sci. Pollut. Res. 26 (36), 36993–37000. doi:10.1007/s11356-019-06846-9
Baek, J. (2015). Environmental kuznets curve for CO2 emissions: The case of arctic countries. Energy Econ. 50, 13–17. doi:10.1016/j.eneco.2015.04.010
Bakirtas, I., and Cetin, M. A. (2017). Revisiting the environmental kuznets curve and pollution haven hypotheses: MIKTA sample. Environ. Sci. Pollut. Res. 24 (22), 18273–18283. doi:10.1007/s11356-017-9462-y
Bello, M. O., Solarin, S. A., and Yen, Y. Y. (2018). The impact of electricity consumption on CO2 emission, carbon footprint, water footprint and ecological footprint: The role of hydropower in an emerging economy. J. Environ. Manag. 219, 218–230. doi:10.1016/j.jenvman.2018.04.101
Ben Jebli, M., Ben Youssef, S., and Ozturk, I. (2015). The role of renewable energy consumption and trade: Environmental kuznets curve analysis for sub-saharan Africa countries. Afr. Dev. Rev. 27 (3), 288–300. doi:10.1111/1467-8268.12147
Chandran, V. G. R., and Tang, C. F. (2013). The impacts of transport energy consumption, foreign direct investment and income on CO2 emissions in ASEAN-5 economies. Renew. Sustain. Energy Rev. 24, 445–453. doi:10.1016/j.rser.2013.03.054
Charfeddine, L., and Kahia, M. (2019). Impact of renewable energy consumption and financial development on CO2 emissions and economic growth in the mena region: A panel vector autoregressive (pvar) analysis. Renew. energy 139, 198–213. doi:10.1016/j.renene.2019.01.010
Cheung, Y. W., and Lai, K. S. (1995). Lag order and critical values of the augmented Dickey–Fuller test. J. Bus. Econ. Statistics 13 (3), 277–280. doi:10.1080/07350015.1995.10524601
Chien, F., Anwar, A., Hsu, C. C., Sharif, A., Razzaq, A., Sinha, A., et al. (2021). The role of information and communication technology in encountering environmental degradation: Proposing an SDG framework for the BRICS countries. Technol. Soc. 65, 101587. doi:10.1016/j.techsoc.2021.101587
Chishti, M. Z., Ahmad, M., Rehman, A., and Khan, M. K. (2021). Mitigations pathways towards sustainable development: Assessing the influence of fiscal and monetary policies on carbon emissions in BRICS economies. J. Clean. Prod. 292, 126035. doi:10.1016/j.jclepro.2021.126035
Choi, I. (2001). Unit root tests for panel data. J. Int. money Finance 20 (2), 249–272. doi:10.1016/S0261-5606(00)00048-6
Destek, M. A., Balli, E., and Manga, M. (2016). The relationship between CO2 emission, energy consumption, urbanization and trade openness for selected CEECs. Res. World Econ. 7 (1), 52–58. doi:10.5430/rwe.v7n1p52
Dong, K., Sun, R., Li, H., and Liao, H. (2018). Does natural gas consumption mitigate CO2 emissions: Testing the environmental Kuznets curve hypothesis for 14 Asia-Pacific countries. Renew. Sustain. Energy Rev. 94, 419–429. doi:10.1016/j.rser.2018.06.026
Farhani, S., Shahbaz, M., and Arouri, M. E. H. (2013). Panel analysis of CO2 emissions, GDP, energy consumption, trade openness and urbanization for MENA countries. MPRA 2013, 1–19. Available at: https://mpra.ub.uni-muenchen.de/id/eprint/49258.
Ferrando, L., Ferrer, R., and Jareño, F. (2017). Interest rate sensitivity of S panish industries: A quantile regression approach. Manch. Sch. 85 (2), 212–242. doi:10.1111/manc.12143
Fitzenberger, B., Koenker, R., Machado, J., and Melly, B. (2022). Economic applications of quantile regression 2.0. Empir. Econ. 62 (1), 1–6. doi:10.1007/s00181-021-02186-1
Ganda, F. (2021). The environmental impacts of human capital in the BRICS economies. J. Knowl. Econ. 13, 611–634. doi:10.1007/s13132-021-00737-6
Gao, J., and Zhang, L. (2014). Electricity consumption–economic growth–CO2 emissions nexus in sub‐saharan Africa: Evidence from panel cointegration. Afr. Dev. Rev. 26 (2), 359–371. doi:10.1111/1467-8268.12087
Gyamfi, B. A., Onifade, S. T., Nwani, C., and Bekun, F. V. (2022). Accounting for the combined impacts of natural resources rent, income level, and energy consumption on environmental quality of G7 economies: A panel quantile regression approach. Environ. Sci. Pollut. Res. 29 (2), 2806–2818. doi:10.1007/s11356-021-15756-8
Jamil, K., Liu, D., Gul, R. F., Hussain, Z., Mohsin, M., Qin, G., et al. (2021). Do remittance and renewable energy affect CO2 emissions? An empirical evidence from selected G-20 countries. Energy & Environ. 2021, 0958305X211029636. doi:10.1177/0958305X211029636
Levin, A., Lin, C. F., and Chu, C. S. J. (2002). Unit root tests in panel data: Asymptotic and finite-sample properties. J. Econ. 108 (1), 1–24. doi:10.1016/S0304-4076(01)00098-7
Li, Q., Cherian, J., Shabbir, M. S., Sial, M. S., Li, J., Mester, I., et al. (2021). Exploring the relationship between renewable energy sources and economic growth. The case of SAARC countries. Energies 14 (3), 520. doi:10.3390/en14030520
Liu, Y., Sohail, M. T., Khan, A., and Majeed, M. T. (2021). Environmental benefit of clean energy consumption: Can BRICS economies achieve environmental sustainability through human capital? Environ. Sci. Pollut. Res. 29, 6766–6776. doi:10.1007/s11356-021-16167-5
Maddala, G. S., and Wu, S. (1999). A comparative study of unit root tests with panel data and a new simple test. Oxf. Bull. Econ. Stat. 61 (S1), 631–652. doi:10.1111/1468-0084.0610s1631
Mazur, A., Phutkaradze, Z., and Phutkaradze, J. (2015). Economic growth and environmental quality in the European Union countries–is there evidence for the environmental Kuznets curve? Int. J. Manag. Econ. 45 (1), 108–126. doi:10.1515/ijme-2015-0018
Merlin, M. L., and Chen, Y. (2021). Analysis of the factors affecting electricity consumption in DR Congo using fully modified ordinary least square (FMOLS), dynamic ordinary least square (DOLS) and canonical cointegrating regression (CCR) estimation approach. Energy 232, 121025. doi:10.1016/j.energy.2021.121025
Mohsin, M., Naseem, S., Sarfraz, M., and Azam, T. (2022b). Assessing the effects of fuel energy consumption, foreign direct investment and GDP on CO2 emission: New data science evidence from Europe & Central Asia. Fuel 314, 123098. doi:10.1016/j.fuel.2021.123098
Mohsin, M., Naseem, S., Sarfraz, M., Zia-Ur-Rehman, M., and Baig, S. A. (2022a). Does energy use and economic growth allow for environmental sustainability? An empirical analysis of Pakistan. Environ. Sci. Pollut. Res. 2022, 1–12. doi:10.1007/s11356-022-19600-5
Naseem, S., Hui, W., Sarfraz, M., and Mohsin, M. (2021a). Repercussions of sustainable agricultural productivity, foreign direct investment, renewable energy, and environmental decay: Recent evidence from Latin America and the caribbean. Front. Environ. Sci. 563. doi:10.3389/fenvs.2021.784570
Naseem, S., Mohsin, M., Zia-Ur-Rehman, M., Baig, S. A., and Sarfraz, M. (2021b). The influence of energy consumption and economic growth on environmental degradation in BRICS countries: An application of the ARDL model and decoupling index. Environ. Sci. Pollut. Res. 29, 13042–13055. doi:10.1007/s11356-021-16533-3
Nathaniel, S. P., Yalçiner, K., and Bekun, F. V. (2021). Assessing the environmental sustainability corridor: Linking natural resources, renewable energy, human capital, and ecological footprint in BRICS. Resour. Policy 70, 101924. doi:10.1016/j.resourpol.2020.101924
Omri, A., Daly, S., Rault, C., and Chaibi, A. (2015). Financial development, environmental quality, trade and economic growth: What causes what in MENA countries. Energy Econ. 48, 242–252. doi:10.1016/j.eneco.2015.01.008
Peláez, R. F. (1995). The Fisher effect: Reprise. J. Macroecon. 17 (2), 333–346. doi:10.1016/0164-0704(95)80105-7
Perron, P., and Ng, S. (1996). Useful modifications to some unit root tests with dependent errors and their local asymptotic properties. Rev. Econ. Stud. 63 (3), 435. doi:10.2307/2297890
Raza, S. A., and Shah, N. (2018). Testing environmental kuznets curve hypothesis in G7 countries: The role of renewable energy consumption and trade. Environ. Sci. Pollut. Res. 25 (27), 26965–26977. doi:10.1007/s11356-018-2673-z
Saidi, K., and Mbarek, M. B. (2017). The impact of income, trade, urbanization, and financial development on CO2 emissions in 19 emerging economies. Environ. Sci. Pollut. Res. 24 (14), 12748–12757. doi:10.1007/s11356-016-6303-3
Sarfraz, M., Mohsin, M., and Naseem, S. (2022). A blessing in disguise: New insights on the effect of COVID-19 on the carbon emission, climate change, and sustainable environment. Environ. Sci. Pollut. Res. 29, 29651–29662. doi:10.1007/s11356-021-17507-1
Sasmaz, M. U., Sakar, E., Yayla, Y. E., and Akkucuk, U. (2020). The relationship between renewable energy and human development in oecd countries: A panel data analysis. Sustainability 12 (18), 7450. doi:10.3390/su12187450
Saud, S., Chen, S., and Haseeb, A. (2019). Impact of financial development and economic growth on environmental quality: An empirical analysis from belt and road initiative (BRI) countries. Environ. Sci. Pollut. Res. 26 (3), 2253–2269. doi:10.1007/s11356-018-3688-1
Shafiei, S., and Salim, R. A. (2014). Non-renewable and renewable energy consumption and CO2 emissions in oecd countries: A comparative analysis. Energy Policy 66, 547–556. doi:10.1016/j.enpol.2013.10.064
Shahbaz, M., Mahalik, M. K., Shahzad, S. J. H., and Hammoudeh, S. (2019). Does the environmental K uznets curve exist between globalization and energy consumption? G lobal evidence from the cross‐correlation method. Int. J. Fin. Econ. 24 (1), 540–557. doi:10.1002/ijfe.1678
Shin, D. W., and Lee, O. (2008). Unit root tests for panel MTAR model with cross-sectionally dependent error. Metrika 67 (3), 315–326. doi:10.1007/s00184-007-0135-6
Sinha, A., Shahbaz, M., and Balsalobre, D. (2017). Exploring the relationship between energy usage segregation and environmental degradation in N-11 countries. J. Clean. Prod. 168, 1217–1229. doi:10.1016/j.jclepro.2017.09.071
Temiz Dinç, D., and Akdoğan, E. C. (2019). Renewable energy production, energy consumption and sustainable economic growth in Turkey: A vecm approach. Sustainability 11 (5), 1273. doi:10.3390/su11051273
Ullah, S., and Nasim, A. (2021). Do firm-level sustainability targets drive environmental innovation? Insights from BRICS economies. J. Environ. Manag. 294, 112754. doi:10.1016/j.jenvman.2021.112754
Wallace, M. S., and Warner, J. T. (1993). The Fisher effect and the term structure of interest rates: Tests of cointegration. Rev. Econ. Statistics 75, 320. doi:10.2307/2109438
Wang, X. (2021). Determinants of ecological and carbon footprints to assess the framework of environmental sustainability in BRICS countries: A panel ardl and causality estimation model. Environ. Res. 197, 111111. doi:10.1016/j.envres.2021.111111
Yasin, I., Ahmad, N., and Chaudhary, M. A. (2019). Catechizing the environmental-impression of urbanization, financial development, and political institutions: A circumstance of ecological footprints in 110 developed and less-developed countries. Soc. Indic. Res. 147, 621–649. doi:10.1007/s11205-019-02163-3
Yikun, Z., Gul, A., Saleem, S., Shabbir, M. S., Bilal, K., Abbasi, H. M., et al. (2021). The relationship between renewable energy sources and sustainable economic growth: Evidence from SAARC countries. Environ. Sci. Pollut. Res. 28 (25), 33390–33399. doi:10.1007/s11356-021-12795-z
Zhang, S. (2019). Environmental kuznets curve revisit in central asia: The roles of urbanization and renewable energy. Environ. Sci. Pollut. Res. 26, 23386–23398. doi:10.1007/s11356-019-05600-5
Keywords: BRICS, environmental deterioration, industrial development, renewable energy, economic growth, gross capital formation, FMOLS, quantile regression
Citation: Liu S, Gao L, Hu X, Shi J, Mohsin M and Naseem S (2022) Does industrial eco-innovative development and economic growth affect environmental sustainability? New evidence from BRICS countries. Front. Environ. Sci. 10:955173. doi: 10.3389/fenvs.2022.955173
Received: 28 May 2022; Accepted: 11 July 2022;
Published: 29 August 2022.
Edited by:
Munir Ahmad, Ningbo University of Finance and Economics, ChinaReviewed by:
Muhammad Nawaz, National College of Business Administration and Economics, PakistanMuhammad Afaq Haider Jafri, Beijing University of Technology, China
Copyright © 2022 Liu, Gao, Hu, Shi, Mohsin and Naseem. This is an open-access article distributed under the terms of the Creative Commons Attribution License (CC BY). The use, distribution or reproduction in other forums is permitted, provided the original author(s) and the copyright owner(s) are credited and that the original publication in this journal is cited, in accordance with accepted academic practice. No use, distribution or reproduction is permitted which does not comply with these terms.
*Correspondence: Xuhua Hu, eHVodWFodUAxNjMuY29t; Sobia Naseem, c29iaWFzYWxhbWF0NEBnbWFpbC5jb20=