- 1College of Geographic Science, Hunan Normal University, Changsha, China
- 2Key Laboratory of Geospatial Big Data Mining and Application, Changsha, China
- 3CCCC Water Resources and Hydropower Construction CO. LTD., Ningbo, China
- 4Ningbo Shanghang Surveying and Mapping CO. LTD., Ningbo, China
As a geomorphic process persistently occurring over the earth’s surface, soil erosion is one of the most serious environmental problems in the world nowadays, seriously threatening agriculture, natural resources, and ecosystem environments. Monitoring surface deformation associated with soil erosion will help to understand the dynamics of erosion process and the erosion mechanism. In this article, an improved small baseline subset interferometric synthetic aperture radar (SBAS-InSAR) technique is proposed to monitor the surface deformation over the wind-water erosion crisscross region in the Loess Plateau, China. In particular, a new deformation model considering both of the internal factors and external factors of soil erosion is introduced into the SBAS-InASR algorithm. The results show that the cumulative deformation is close to −200 mm during the investigated period. The deformation rate caused by precipitation is between −0.03 and 0.02 mm/mm. When the wind erosion factor changes by 1 unit, the deformation range is approximately −0.3–0.2 mm. Also, researchers found that the surface deformation is highly correlated to precipitation and wind. The root mean square errors (RMSEs) of the residual deformations estimated from the proposed model are smaller than those estimated from the conventional linear and period models, demonstrating that the proposed method is more suitable to model and analyze the surface deformation in wind-water erosion crisscross region.
Introduction
Surface deformation associated with soil erosion is a geomorphic process in which soil particles are separate from their primary location to another (Cai et al., 2019). It is a widespread and major environmental threat to our ecological system (Wang et al., 2013; Sun et al., 2014). The Loess Plateau has long been suffering from serious soil erosion, where over 60% of land has been subject to soil surface deformation (Shi and Shao, 2000; Zhu et al., 2021). Characterized by wide area, high intensity, obvious region, and medium sand collection, soil erosion in the Loess Plateau affects agricultural production, pollutes water resources, and causes serious harm to ecological, economic, and social environment (Liu and Liu, 2010). Also, especially, the ecological environment in wind-water erosion crisscross surfers serious wind and water erosion, alternately. If not prevented, irreversible desertification could occur. Due to the serious erosion and the transport in the geomantic compound erosion area, the Yellow River flowing through this area has become one of the world’s famous rivers with high sand content (Ta, Wang, and Jia, 2014).
The consequence of soil erosion is that the topography changes of the erosion area, thus damaging the integrity of the ground, resulting in land quality degradation, triggering collapse, landslides, debris flows, and other geological disasters (Vrieling et al., 2008; Mao et al., 2021). However, the conventional methods, including in site observation, isotope tracer technique, and model estimation technique, cannot directly obtain topographical changes associated with soil erosion. Interferometric synthetic aperture radar (InSAR) technology can not only obtain a wide range of high precision digital elevation model (DEM) (Zebker and Goldstein, 1986), but also monitor small topographic changes from millimeter to meter (Gabriel et al., 1989). With the advantages of wide spatial coverage, high resolution, and accurate precision, InSAR had been widely applied to monitor surface deformation (Massonnet et al., 1994; Hooper et al., 2007). Also, especially with the development of multi-temporal InSAR (MT-InSAR) algorithms (Ferretti et al., 2001; Berardino et al., 2002), the time series InSAR models proposed by the predecessors proved it in the monitoring the surface deformation associated with natural hazards and human activity (Hooper et al., 2007; Liu et al., 2012; Mason et al., 2015; Zhou et al., 2017; Shi et al., 2019; Li et al., 2022). Regarding soil erosion, Smith et al. (2000) employed InSAR to monitor the terrain changes caused by flood events. Other scholars mostly focus on large soil erosion events, such as landslides and debris flow erosion (Liu and Liu, 2010; Roering et al., 2009). Zhang et al. (2021) employed MT-InSAR to monitor the regional soil erosion events caused by lake surface change in East Dongting Lake.
In addition to the classical linear deformation model, the most commonly used models are to consider the surface deformation from the perspective of mathematical models, such as the hyperbolic model, spline function, seasonal model, and polynomial model (Kim et al., 2010; Liu and Liu, 2010; Hetland et al., 2012; Li et al., 2015). Some scholars also related the deformation process to the physical causes. Liu et al. (2012) inverted the seasonal thawing deformation and active layer thickness of frozen soil according to the law of conservation of water quality. Next, Li et al. (2015) employed the one-dimensional heat transfer model of soils to the surface deformation over permafrost frozen soil region in southern Qinghai-Tibet Plateau. However, these mathematical or physical models do not consider the environmental factors about deformable object.
The physical environment factors and mathematical models are integrated to monitor the surface deformation associated with soil erosion in Loess Plateau. The deformation of wind-water erosion crisscross regions can generally be ascribed to several reasons, including wind erosion, water erosion, and own internal erosion. The existing mathematical or physical models are obviously unsuitable for the monitoring of the systematic and regional soil erosion. A deviation between the estimated deformation and the actual deformation would be found due to the difference in the use of the model. Therefore, to improve the monitoring accuracy of surface deformation over the wind-water erosion crisscross region of the Loess Plateau, this study focuses on establishing an appropriate deformation model based on the SBAS-InSAR algorithm and the meteorological factors in order.
Study Area and Datasets
Study Area
The Kuye River watershed is a typical wind-water erosion crisscross area. Sui et al. (2009) employed the sediment yield data observed by three gauging stations in the Kuye River basin to analyze erosion status. Researchers found that the average monthly sediment concentration during the study period in the Kuye River is up to 125.34 kg/m3 and occurs in July. Next, Liu and Liu. (2010) used the universal soil loss equation method to evaluate the changes in the distribution of erosion sensitivity in the Loess Plateau in northern Shaanxi in 2000 and 2007. The results revealed that the risk of erosion was reduced in some areas of the Kuye River basin, but the possibility of moderate and high soil erosion remained in most areas. Based on long-term observation data (50 years) from 38 hydrological stations in the middle reaches of the Yellow River, Gao et al. (2016) concluded that a strong correlation was found among the improvement of soil erosion in the Loess Plateau, the adoption of soil and water conservation measures, and the change of land use patterns.
As shown in Figure 1, the study area is located in the southwest of Kuye River watershed, which is characterized as high altitude in the northwest and low altitude in the southeast. The ground is flat with fine sand, which is vulnerable to the wind erosion. Kuye River, as an important tributary of the middle reaches of the Yellow River, originates from Badinggou, Dongsheng City, flows southeast through Ordos and Yulin City, and finally inflows into the Yellow River from Shamaotou Village, Shenmu City. The total area of the Kuye River watershed is 8,706 km2, including 4,635 km2 in Inner Mongolia Autonomous Region and 4,071 km2 in Shaanxi Province. The trunk stream is 242 km long, including 94 km in Inner Mongolia Autonomous Region and 148 km in Shaanxi Province.
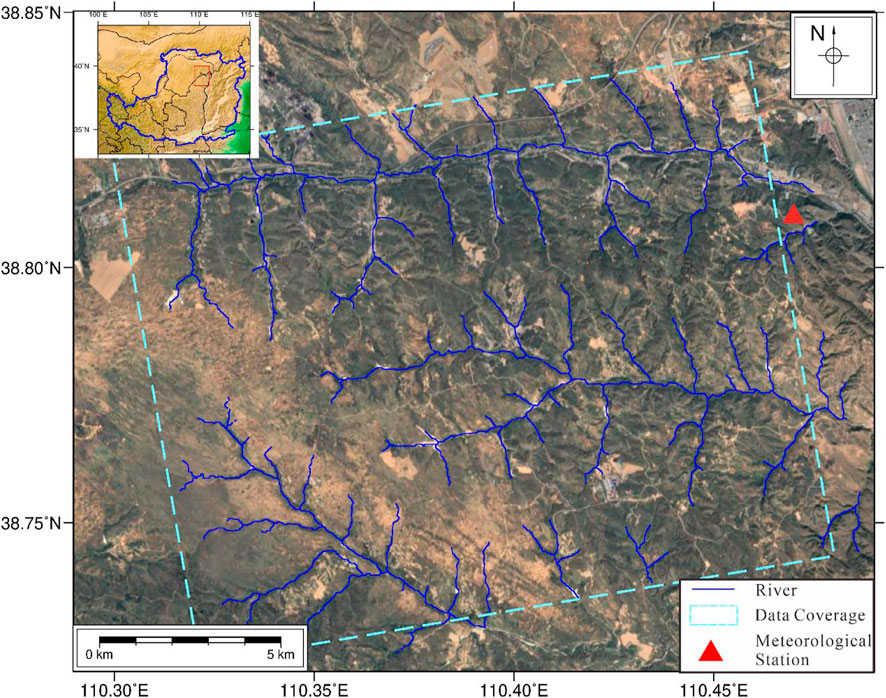
FIGURE 1. Optical image of the study area. Dashed blue rectangle outlines the coverage of the selected Sentinel-1A images. Solid blue line indicates the distribution of ditches. Red triangle indicates the location of Shenmu meteorological station. The inset shows the approximation the area location in the Loess Plateau.
The study area demonstrates a simple water system structure, and the watershed system is distributed in a tree shape. Part of the terrain is hilly and gully loess region, while part of the terrain belongs to wind-sand grass beach area. The surface is covered by loess, and the vegetation coverage such as woodland and grassland is less than 10%. Moreover, this study area is located in the north temperate zone, is characterized by high temperature in summer, low temperature in winter, and a large temperature difference between day and night. The perennial average temperature is 8.1°C, with the highest monthly average temperature occurring in July. The average annual precipitation is about 350–450 mm. The precipitation is rare and concentrated by rainstorm that takes up a significant proportion of the annual precipitation. Most of the runoff in the Loess Platueau is from precipitation, with an annual runoff of about 760 million m3. The runoff is extremely uneven, which is cut off for about two-thirds of 1 year. The precipitation and runoff in flood season (i.e., from June to September) account for 76.6% and 59.2% of the annual precipitation and runoff, respectively. It is one of the main sources of flood in the north main stream of the Yellow River.
The surface deformation in the region is mainly caused by wind-water erosions and internal factors (e.g., tectonic activity of the Loess Plateau, broken and mostly bare topography, loose loss structure, many pores, and vertical cracks), and the erosion types are different in different climatic regions, land forms, and periods. The soil erosion in the watershed is severe, with an area of about 8,305 km2 and an average erosion modulus of 12,227 t/km2/a over the years (Liu and Liu, 2010). In severe areas, the soil erosion is as high as 20,000–40,000 t/km2/a, making it a national key soil erosion control area. The Kuye River carries a large amount of sediment, which is one of the main sources of sediment of the Yellow River. The average annual sediment transport volume of the Yellow River reaches 110 million tons, accounting for 6.9% of the total sediment transport volume of the Yellow River watershed. Moreover, erosion is becoming more and more serious due to the rapid development of the coal industry in the Kuye River watershed.
Used Datasets
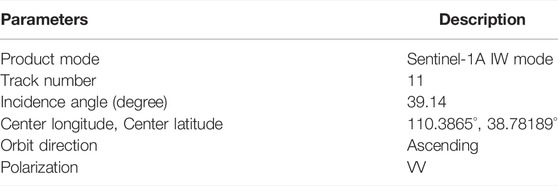
Sentinel-1A is a medium resolution C-band satellite launched by the European Space Agency (ESA) in 2014. Table 1 shows the specific parameters of the Sentinel-1A images used in the study. An advantage of Sentinel-1A is that the satellite’s return cycle is only 12 days. With the launch of Sentinel-1B in 2016, a temporal resolution of 6 days could be approached. Also, unfortunately, the Sentinel-1B data are unavailable. The Sentinel-1A/1B data are available free of charge to users around the world. Next, totally 98 Sentinel-1A ascending images acquired from 16 May 2016 to 3 December 2019 were collected for the investigation of soil erosion in this area (Track 113). The spatial coverage of these images is about 250 km × 250 km, which is cropped according to the study area (as marked by the dashed cyan-blue rectangle in Figure 1). In addition, the SRTM DEM data with a resolution of 30 m is used for the basic processing of SAR data.
In addition to the Sentinel-1A images, in order to analyze the surface deformation response to the variations of water erosion and wind erosion, the daily precipitation data, wind speed, air temperature, and air humidity are of great significance. The meteorologic data of Shenmu meteorologic station are employed in this study (see Figure 1 for location). The original form of these meteorological data is recorded daily. In this article, the data are extended to the time period value at the same interval as the Sentinel-1A data. Next, the precipitation data are achieved by averaging, and the wind speed is selected by the maximum value according to the acquisition period of the Sentinel-1A data.
Methodology
Accounting for Internal Factors
The primary loess of the Loess Plateau is aeolian deposits in the cold and wet climate of the Quaternary glaciation, and the secondary loess is transformed from the primary loess by flood and alluvium. In the past few thousand years, the Loess Plateau experienced several soil erosion. As an important tributary of the Yellow River, the Kuye River is located in an arid and semi-arid area. The vegetation in the basin is sparse. It has been threatened by drought for a long time, coupled with the impact of human activities. Therefore, the ecological environment is very fragile, and soil erosion is extremely serious. The tectonic activity of the Loess Plateau and the composition of loess sand grains, broken and mostly bare topography, loose loss structure, many pores, and vertical cracks can all be considered as internal factors. The seasonal model (Li et al., 2015) and the polynomial model (Zhao et al., 2016) had been used to describe the deformation caused by these internal factors. Assuming that the deformation caused by internal factors in a short time is proportional to time, thus, a linear model is applied to evaluate the deformation caused by internal environmental factors.
Assuming that the internal deformation model is represented by Eq. 1:
where
Accounting for External Factors
The soil erosion in the wind-water erosion crisscross region of the Loess Plateau mainly includes wind erosion and water erosion. The characteristic of water erosion is that the surface water is used as the driving force to scour the soil. With respect to wind erosion, the wind lifts up the sand particles, which leave their original position and float to another place. Next, severe soil erosion is taking place in the Kuye River watershed, and this process is caused by the combination of the external environmental factors, such as rainfall, runoff, air humidity, and wind speed. Therefore, the influence of these external factors should be considered when constructing the deformation model over wind-water erosion crisscross region. The following deformation model is employed:
where
where
The calculation of wind erosion climatic factor index (
where
where
Improved Small Baseline Subset Interferometric Synthetic Aperture Radar Algorithm by Considering Internal External Factors
By comprehensively considering the internal and external factors of soil erosion in the loess area, the following deformation model can be constructed, as follows:
The SBAS-InSAR algorithm inherits the advantages of the conventional D-InSAR, where an appropriate combination of differential interferograms is produced by SAR data pairs based on baseline threshold values (Berardino et al., 2002; Hooper, 2008; Chen et al., 2018).
Assuming interferogram
where
where
If
The residual phase component caused by high pass deformation and atmospheric artifact are calculated by subtracting the estimated low pass deformation and the topographic error phase from the original interferograms. Since the terrain in the study area is relatively flat with an average slope of about 6°, the atmospheric phase components are characterized by high spatial correlation but notably low temporal correlation. Next, subsequently, nonlinear deformation component was separated through spatial and temporal bandpass filtering (Li et al., 2015). However, the atmospheric phase components can be temporally correlated for steep terrains. The alternative methods can be found in Dong et al. (2019). To finish, a
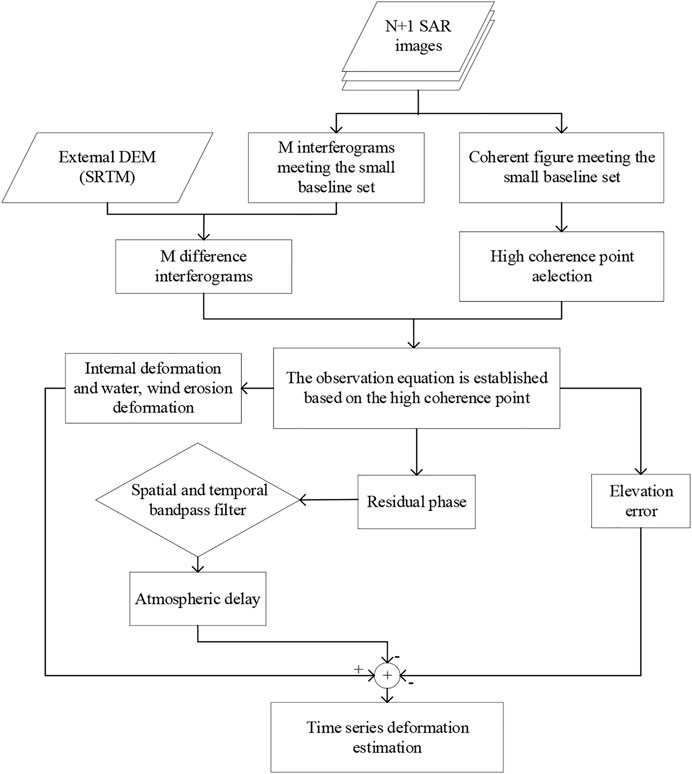
FIGURE 2. Flow chart of the improved small baseline subset interferometric synthetic aperture radar (SBAS-InSAR) algorithm.
Results
The improved SBAS-InSAR algorithm is applied to estimate soil erosion in wind-water erosion crisscross region. In order to reduce the amount of calculation, the acquired Sentinel-1A data needs to be clipped first. In this study, only three bursts of Sentinel-1A data are required. The two-pass D-InSAR processing is adopted to generate the differential interferograms from the 98 images. By setting the perpendicular baseline smaller than 80 m and the temporal baseline shorter than 90 days, a total of 465 small baseline interferograms are obtained. The temporal and perpendicular baselines are shown in Figure 3. The SRTM DEM is used to simulate topographic phases subtracted from the interferograms. In addition, multi-looking operation with five looks in the range and one in the azimuth direction is conducted to improve the differential interferograms, and to further suppress the phase noise, the interferograms are filtered with the improved Goldstein filter (Li et al., 2015). The minimum cost flow method is used for phase unwrapping in each interferogram.
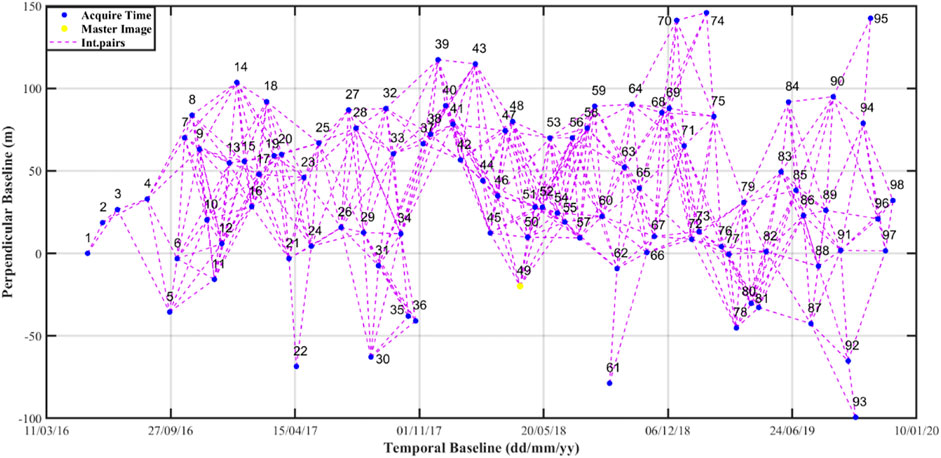
FIGURE 3. Temporal and perpendicular baselines of the study periods. Blue dots represent the image acquisitions, and yellow dots represent the super master images. Purple dashed lines represent interferometric pairs.
Figure 4 shows the estimations of the model coefficients of the wind-water erosion crisscross zone of the Loess Plateau retrieved from the improved SBAS-InSAR algorithm. Figure 4A shows the deformation rate caused by the change of the internal environment. Researchers found that the deformation caused by the internal environment is mainly distributed in the agglomerations. The areas with the highest rate are located in the Liudaogou, Erdaogou, Haojialiangzi, and Sidaogou areas, with an average annual deformation rate of about −20 mm/a. This is expected since, in these areas, the soil structure is loose, vegetation is scarce, and the serious changes occurs in regional land use patterns. In addition, obvious deformation phenomena occur in the Haizegou, Nanmengou, and Nangou areas. The annual deformation rate is about −15 mm/a. Also, these areas are with relatively fragile geological backgrounds, due to land use changes and human activities.
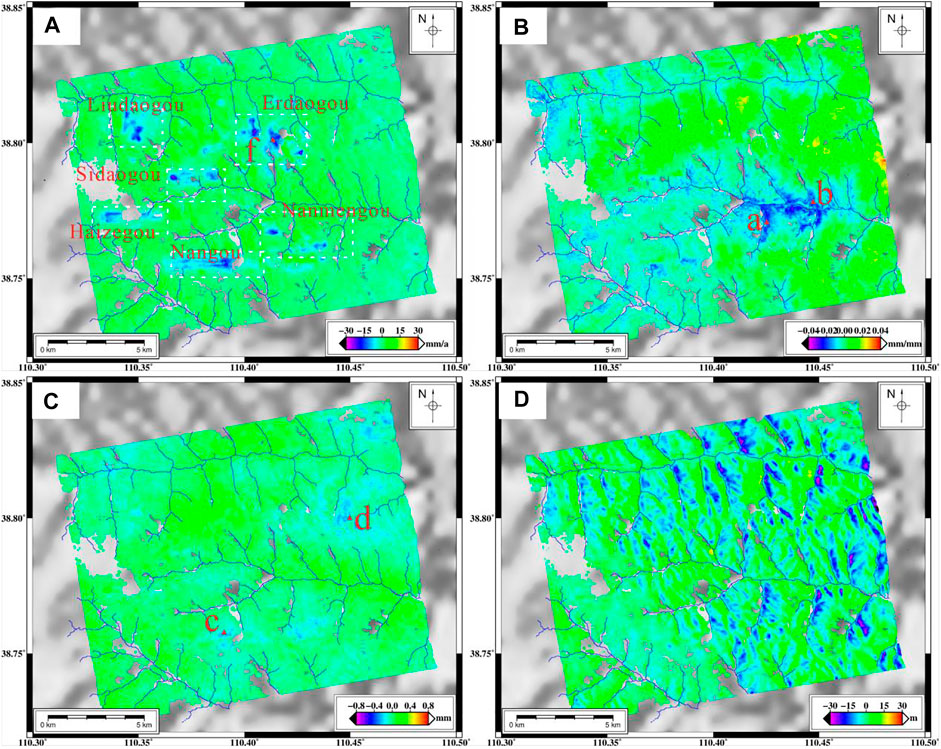
FIGURE 4. Estimated coefficients of the improved deformation model in Eq. 4 and DEM errors over the coherent areas. (A)
Figures 4B,C are the estimated parameters of water erosion factor and wind erosion factor, respectively. As show in Figure 4B, the water erosion deformation in the wind-water erosion crisscross region ranges from −0.03 to 0.02 mm/mm. This means that when the rainfall is 1 mm, the ground will undergo deformation of from −0.03 to 0.02 mm along the LOS direction. It can be clearly seen that the distribution of water erosion is more consistent with the rivers in the region, and the severely eroded areas are basically on both banks of the river. The wind erosion deformation is shown in Figure 4C. When the wind erosion factor is 1, the surface deformation ranges from −0.2 to 0.3 mm. Next, Figure 4D shows the topographic residual calculated from the improved model, with more than 95% in the terrain residual error of the area being between −15 and 10 m. This meets the accuracy of SRTM DEM. In addition, it can be seen that the terrain residual error is basically located on the east side of gully, which may be related to the fact that the local water flow scours from northwest to southeast.
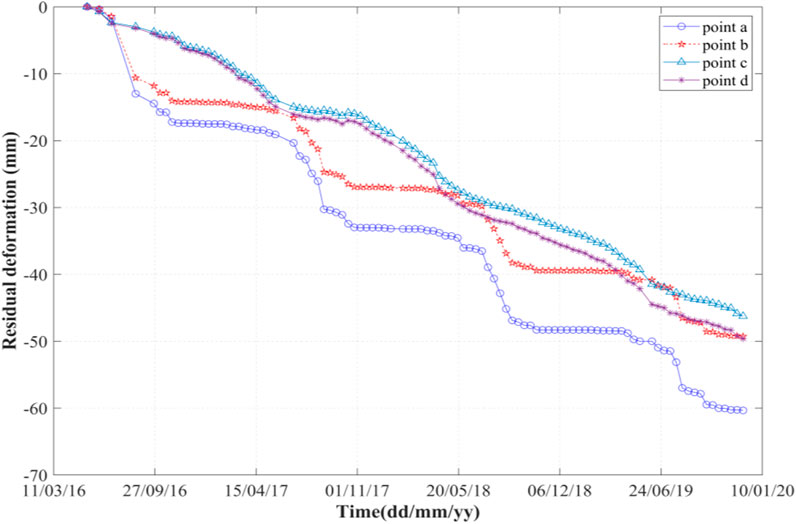
In order to show the more detailed time series deformation, the time series of the deformation is over the four feature points located on both sides of the river valley, flat land, sandy land to analyze the deformation evolution. Also, specifically, feature points a and b are located on both sides of the Nanmengou Valley, respectively, in which the deformation time series is shown in Figure 5. The cumulative deformation of point a exceeds −60 mm, and point b is about −48 mm. Next, we can find that the deformation cause with water erosion of the selected two characteristic points changes significantly seasonally. From April to October, the water erosion is accelerating during this period, and surface deformation is basically stable during the other months. This is consistent with the changes of the precipitation. In addition, researchers also found that the deformation time series caused by erosion could be divided into three stages, including the slow erosion stage from April to June, the rapid erosion stage from June to August, and the decelerated erosion stage form August to October. Among them, the summer deformation variable of 2016 is the most obvious, where the feature point a exceeds −17 mm, but in 2017, 2018, and 2019, the summer deformation variable of point a is basically the same, about −11 mm. For point b, the summer deformation of 2016 is about −13 mm, and in 2017, 2018, and 2019, the summer deformation of point a is basically the same, about −10 mm. Next, spatially, researchers found that water erosion deformation is related to gully rivers in the study region. Next, the water erosion deformation calculated is near to the gully river, and most of them are consistent with the distribution of gully rivers in the Loess Plateau. Moreover, this phenomenon becomes more obvious as it is closer to the river.
With respect to the wind erosion, two feature points (point c and point d in Figure 4C) located on flat and sandy lands are selected to study the time series deformation. As shown in Figure 5, the wind erosion also changes periodically over time. However, unlike the water erosion deformation, the wind erosion deformation occurs earlier each year and lasts longer, especially in the April–June annual deformation acceleration. Also, this period is the most obvious period of the wind erosion on the Loess Plateau. The deformation rate slows down in the summer every year, especially in the summer of 2017, which basically remains unchanged. This is due to the decrease in wind erosion factors in 2017, resulting in a decrease in wind erosion deformation. Comparing the feature points c and d, the deformation rate in the previous period is basically the same. In the summer of 2017, the gap in the deformation variable began to increase, and the gap further expanded in the summer of 2018. Then, the deformation of the two feature points basically changed at a uniform rate. In the summer of 2019, the difference in deformation between the two feature points has been further expanded.
Discussion
Model Validation
In the existing SBAS-InSAR research, the linear model and period models are the most commonly used. However, the linear model and period models are usually inaccurate for the estimation of the deformation under complex background conditions. Therefore, this study introduces the physical factors on the basis of the linear model to estimate the surface deformation of the wind-water erosion crisscross region on the Loess Plateau. Since the field data are unavailable in this area, the method of comparing residual deformation proposed in Zhao et al. (2016) is used to verify the performance of the proposed model. The method points out that if the surface deformation time series can be accurately described by a proposed model in a short time, the residual deformation approaches to 0 mm. In other words, if the residual deformation is closer to 0, the accuracy of the model is higher.
Therefore, the results from the proposed model are compared to those from the linear and period models. Figure 6 shows the calculated residual deformations of three selected feature points (f, a, and d in Figure 4) in the severe internal environmental deformation area, severe water erosion area, and severe wind erosion area, respectively. It can be found in Figure 6 that, in terms of the selected three feature points, the residual deformations calculated by the proposed model are generally smaller than those of the linear and period models.
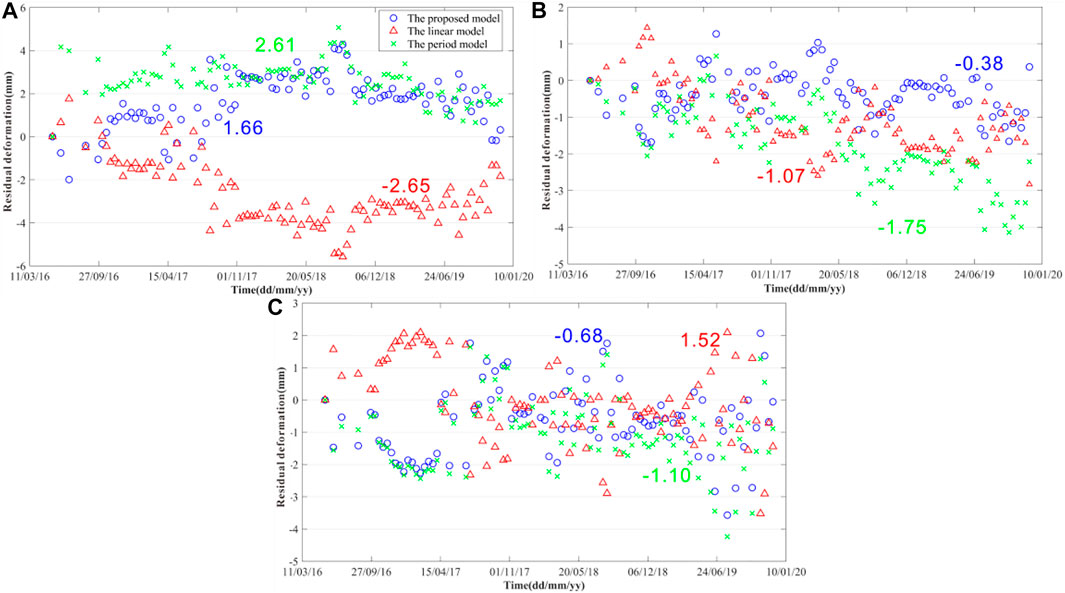
FIGURE 6. Residual deformations of the three feature points retrieved from the proposed model (blue circle), linear model (red triangle), and period model (green cross). The color number represents the average value of the residual deformation of the corresponding model, respectively. (A) point f, (B) point a, and (C) point d.
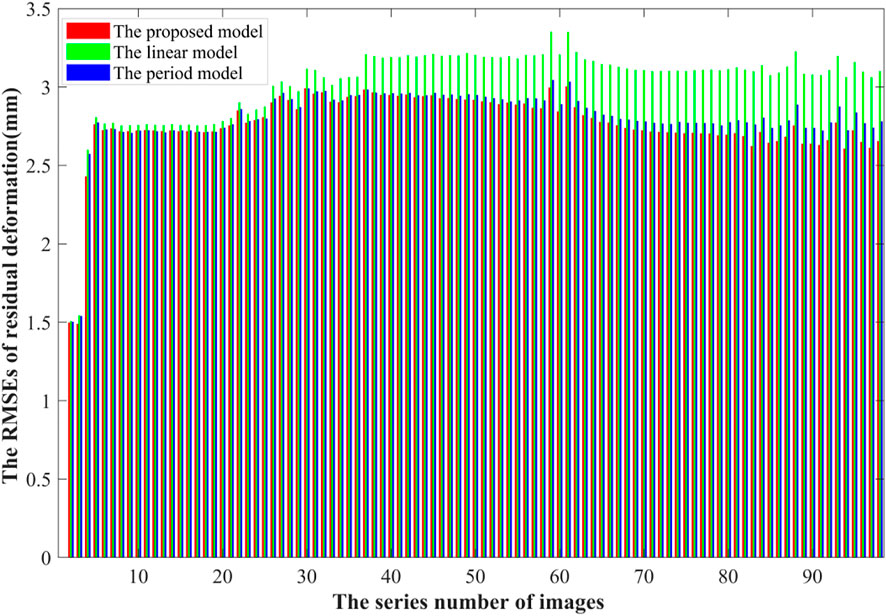
Figure 7 shows the root mean squares errors (RMSEs) of the residual deformations of the 98 images. Here, the true value of residual deformation is considered to be 0. It can be seen that the proposed model is improved to a certain extent compared with the linear and the periodic models. Also, especially, as the image acquisition data increases, the longer the time interval from the first image, and the greater the RMSEs of residual deformation of linear model.
In addition, it is worth noting that the meteorological factors used in this study also show a one-year cyclical change. This explains the small difference between the residual deformations calculated by the periodic model and the proposed model. Also, it is worth noting that an obvious error jump is found between the third image and the fourth image. This is because a 48-day interval exists between the third image and the fourth image, which indicates that the large interval of image acquisition will cause serious change of residual deformation.
Correlation Analysis Based on Precipitation and Wind Erosion
Using the method proposed in this study, the time series of surface deformation caused by soil erosion in the area can also be obtained. In order to analyze the influence degree of water and wind erosion, the correlation between surface deformation and the time series of precipitation and wind erosion was analyzed. Figure 8A shows the correlation coefficients between deformation and precipitation. On both banks of rivers and ditches, the deformation and the precipitation are basically negatively correlated, with a correlation coefficient between −0.95 and −0.6. This indicated that at this place, the greater the rainfall, the more obvious the soil erosion. The correlation coefficient of the feature points between deformation and precipitation reaches −0.92, as shown in Figure 8C. In addition, obvious positive correlations are found between deformation and rainfall in some areas, which means that with the increase of rainfall, the surface of the areas is uplifted. This is because the loess lost in the ditches accumulates in the northeastern part of the study area and the south bank of the river ditches.
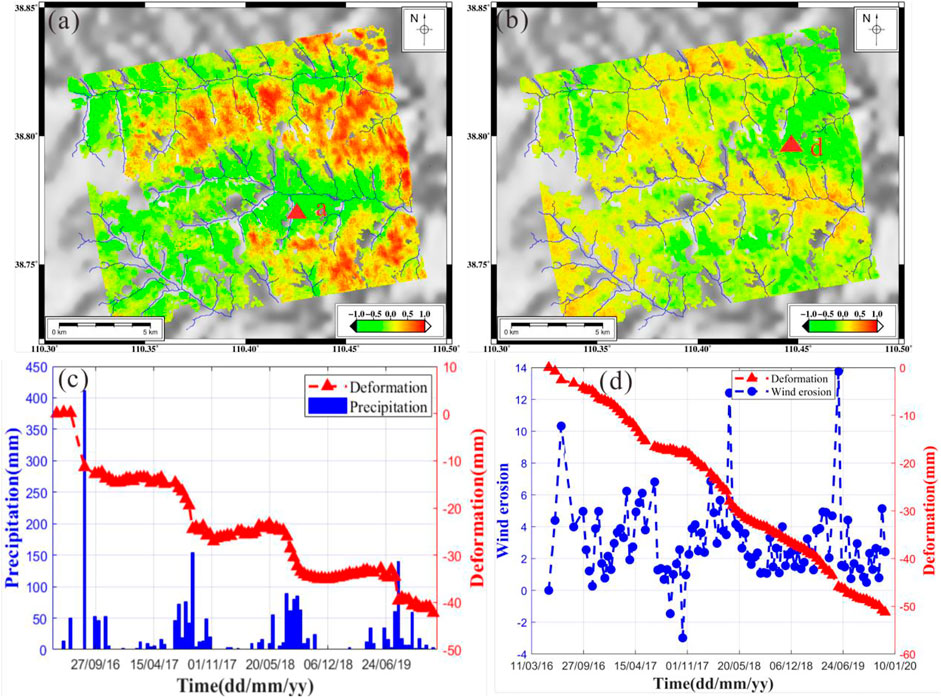
FIGURE 8. Correlation between deformation and external factor. (A) Correlation coefficient of soil erosion and precipitation, (B) correlation coefficient of soil erosion and wind erosion, (C) correlation analysis between soil erosion and precipitation at point a, (D) correlation analysis between soil erosion and wind erosion at point (D).
It can be seen from Figure 8B that the area with negative correlation of wind erosion is mainly located in the eastern side of the study area, which is approximately −0.5. Also, this area exhibits many terrain valleys and basically no vegetation coverage on the surface. Figure 8D shows that the correlation coefficient of wind erosion point d is −0.61, indicating that the wind erosion demonstrates a negative correlation with the selected point. In addition, researchers found that the deformation of the wind erosion area is accelerated, which shows that the severe wind-soil erosion on the Loess Plateau leads to continuous of soil erosion events for a period of time.
Conclusion
This study employed 98 Sentinel-1A SAR images from June 2016 to December 2019, and it constructed an improved SBAS-InSAR model based on the meteorological factors (mainly rainfall and wind erosion) for the wind-water erosion crisscross region. Using the proposed model, the deformations caused by the internal and external environment factors are estimated for the Kuye River watershed, respectively. By comparing the proposed model with the conventional linear and period models, researchers found that the RMESs of the residual deformation of the proposed model are smaller than those of the linear and period models. Next, it is obvious that the surface deformation over the study area is correlated with precipitation and wind erosion. Researchers demonstrated that the deformation model proposed in this study is suitable for the monitoring of surface deformation in the wind-water erosion crisscross region, which will benefit the interpretation of the surface deformation caused by soil erosion.
However, the proposed model still demonstrates some weakness. First, only the observation data recorded by the Shenmu Meteorological Station can be used, which will degrade the performance of the proposed model in the monitoring soil erosion deformation. Second, the surface deformation in wind-water erosion crisscross region is complex, and geological activity and mining activity can also cause the surface deformation, in addition to the water and wind erosion.
Data Availability Statement
The original contributions presented in the study are included in the article/supplementary material, and further inquiries can be directed to the corresponding authors.
Author Contributions
QS conceived and designed the study; HZ performed the experiments; LH and CH contributed to the analysis and discussions of the results; HZ and QS drafted the manuscript. All authors reviewed and approved the manuscript.
Funding
This study is supported by the Hunan Natural Science Foundation and the Construction Project of Yunnan Geological Disaster Identification Center (2021) Yuncaizihuan (2021) No. 22.
Conflict of Interest
Author HZ is employed by CCCC Water Resources and Hydropower Construction CO. LTD. and Ningbo Shanghang Surveying and Mapping CO. LTD.
The remaining authors declare that the research was conducted in the absence of any commercial or financial relationships that could be construed as a potential conflict of interest.
Publisher’s Note
All claims expressed in this article are solely those of the authors and do not necessarily represent those of their affiliated organizations, or those of the publisher, the editors, and the reviewers. Any product that may be evaluated in this article, or claim that may be made by its manufacturer, is not guaranteed or endorsed by the publisher.
Acknowledgments
Copernicus Sentinel data 2016-2019 processed by the European Space Agency (ESA) were retrieved from the ASF Distributed Active Archive Center (DAAC) (https://vertex.daac.asf.alaska.edu/). The meteorological data are provided by the China Meteorological Data Service Center (http://data.cma.cn). The quality of the manuscript was greatly improved by the comments from two reviewers.
References
Berardino, P., Fornaro, G., Lanari, R., and Sansosti, E. (2002). A New Algorithm for Surface Deformation Monitoring Based on Small Baseline Differential SAR Interferograms. IEEE Trans. Geosci. Remote Sens. 40 (11), 2375–2383. doi:10.1109/tgrs.2002.803792
Cai, J., Zhou, Z., Liu, J., Wang, H., Jia, Y., and Xu, C.-Y. (2019). A Three-Process-Based Distributed Soil Erosion Model at Catchment Scale on the Loess Plateau of China. J. Hydrology 578, 124005. doi:10.1016/j.jhydrol.2019.124005
Chen, G., Zhang, Y., Zeng, R., Yang, Z., Chen, X., Zhao, F., et al. (2018). Detection of Land Subsidence Associated with Land Creation and Rapid Urbanization in the Chinese Loess Plateau Using Time Series InSAR: A Case Study of Lanzhou New District. Remote Sens. 10 (2), 270. doi:10.3390/rs10020270
Chepil, W. S., Siddoway, F. H., and Armbrust, D. V. (1962). Climatic Factor for Estimating Wind Erodibility Fields. J. Soil Water Conservation 17 (4), 162–165.
Dong, J., Zhang, L., Liao, M., and Gong, J. (2019). Improved Correction of Seasonal Tropospheric Delay in InSAR Observations for Landslide Deformation Monitoring. Remote Sens. Environ. 233, 111370. doi:10.1016/j.rse.2019.111370
Ferretti, A., Prati, C., and Rocca, F. (2001). Permanent Scatterers in SAR Interferometry. IEEE Trans. Geosci. Remote Sens. 39 (1), 8–20. doi:10.1109/36.898661
Gabriel, A. K., Goldstein, R. M., and Zebker, H. A. (1989). Mapping Small Elevation Changes over Large Areas: Differential Radar Interferometry. J. Geophys. Res. 94 (B7), 9183–9191. doi:10.1029/jb094ib07p09183
Gao, Z., Zhang, L., Zhang, X., Cheng, L., Potter, N., Cowan, T., et al. (2016). Long-term Streamflow Trends in the Middle Reaches of the Yellow River Basin: Detecting Drivers of Change. Hydrol. Process. 30 (9), 1315–1329. doi:10.1002/hyp.10704
Hetland, E. A., Musé, P., Simons, M., Lin, Y. N., Agram, P. S., and DiCaprio, C. J. (2012). Multiscale InSAR Time Series (MInTS) Analysis of Surface Deformation. J. Geophys. Res. Solid Earth 117 (B2), B02404. doi:10.1029/2011jb008731
Hooper, A. (2008). A Multi‐temporal InSAR Method Incorporating Both Persistent Scatterer and Small Baseline Approaches. Geophys. Res. Lett. 35 (16). doi:10.1029/2008gl034654
Hooper, A., Segall, P., and Zebker, H. (2007). Persistent Scatterer Interferometric Synthetic Aperture Radar for Crustal Deformation Analysis, with Application to Volcán Alcedo, Galápagos. J. Geophys. Res. Solid Earth 112 (B7). doi:10.1029/2006jb004763
Li, Y., Li, Y., Liang, K., Li, H., and Jiang, W. (2022). Coseismic Displacement and Slip Distribution of the 21 May 2021 Mw 6.1 Earthquake in Yangbi, China Derived From InSAR Observations. Front. Environ. Sci. 10, 857739. doi:10.3389/fenvs.2022.857739
Li, Z., Zhao, R., Hu, J., Wen, L., Feng, G., Zhang, Z., et al. (2015). InSAR Analysis of Surface Deformation over Permafrost to Estimate Active Layer Thickness Based on One-Dimensional Heat Transfer Model of Soils. Sci. Rep. 5 (1), 15542–15549. doi:10.1038/srep15542
Liu, L., and Liu, X. H. (2010). Sensitivity Analysis of Soil Erosion in the Northern Loess Plateau. Procedia Environ. Sci. 2, 134–148. doi:10.1016/j.proenv.2010.10.017
Liu, L., Schaefer, K., Zhang, T., and Wahr, J. (2012). Estimating 1992–2000 Average Active Layer Thickness on the Alaskan North Slope from Remotely Sensed Surface Subsidence. J. Geophys. Res. Earth Surf. 117 (F1), 1005. doi:10.1029/2011jf002041
Mao, Z., Hu, S., Wang, N., and Long, Y. (2021). Precision Evaluation and Fusion of Topographic Data Based on UAVs and TLS Surveys of a Loess Landslide. Front. Earth Sci. 9, 1273. doi:10.3389/feart.2021.801293
Mason, D. C., Garcia-Pintado, J., Cloke, H. L., and Dance, S. L. (2015). The Potential of Flood Forecasting Using a Variable-Resolution Global Digital Terrain Model and Flood Extents from Synthetic Aperture Radar Images. Front. Earth Sci. 3, 43. doi:10.3389/feart.2015.00043
Massonnet, D., Feigl, K., Rossi, M., and Adragna, F. (1994). Radar Interferometric Mapping of Deformation in the year after the Landers Earthquake. Nature 369 (6477), 227–230. doi:10.1038/369227a0
Shi, H., and Shao, M. (2000). Soil and Water Loss from the Loess Plateau in China. J. Arid Environ. 45 (1), 9–20. doi:10.1006/jare.1999.0618
Shi, X., Yang, C., Zhang, L., Jiang, H., Liao, M., Zhang, L., et al. (2019). Mapping and Characterizing Displacements of Active Loess Slopes along the Upstream Yellow River with Multi-Temporal InSAR Datasets. Sci. Total Environ. 674, 200–210. doi:10.1016/j.scitotenv.2019.04.140
Smith, L. C., Alsdorf, D. E., Magilligan, F. J., Gomez, B., Mertes, L. A. K., Smith, N. D., et al. (2000). Estimation of Erosion, Deposition, and Net Volumetric Change Caused by the 1996 Skeiðarársandur Jökulhlaup, Iceland, from Synthetic Aperture Radar Interferometry. Water Resour. Res. 36 (6), 1583–1594. doi:10.1029/1999wr900335
Sun, W., Shao, Q., Liu, J., and Zhai, J. (2014). Assessing the Effects of Land Use and Topography on Soil Erosion on the Loess Plateau in China. Catena 121, 151–163. doi:10.1016/j.catena.2014.05.009
Ta, W., Wang, H., and Jia, X. (2014). Aeolian Process-Induced Hyper-Concentrated Flow in a Desert Watershed. J. Hydrology 511, 220–228. doi:10.1016/j.jhydrol.2014.01.034
Vrieling, A., de Jong, S. M., Sterk, G., and Rodrigues, S. C. (2008). Timing of Erosion and Satellite Data: A Multi-Resolution Approach to Soil Erosion Risk Mapping. Int. J. Appl. Earth Observation Geoinformation 10 (3), 267–281. doi:10.1016/j.jag.2007.10.009
Wang, L., Huang, J., Du, Y., Hu, Y., and Han, P. (2013). Dynamic Assessment of Soil Erosion Risk Using Landsat TM and HJ Satellite Data in Danjiangkou Reservoir Area, China. Remote Sens. 5 (8), 3826–3848. doi:10.3390/rs5083826
Zebker, H. A., and Goldstein, R. M. (1986). Topographic Mapping from Interferometric Synthetic Aperture Radar Observations. J. Geophys. Res. 91 (B5), 4993–4999. doi:10.1029/jb091ib05p04993
Zhang, H., Sun, Q., and Hu, J. (2021). Analysis of Surface Deformation in East Dongting Lake Based on 2016-2019 Sentinel-1A Dataset. J. Sensors 2021, 5524057. doi:10.1155/2021/5524057
Zhao, R., Li, Z.-w., Feng, G.-c., Wang, Q.-j., and Hu, J. (2016). Monitoring Surface Deformation over Permafrost with an Improved SBAS-InSAR Algorithm: With Emphasis on Climatic Factors Modeling. Remote Sens. Environ. 184, 276–287. doi:10.1016/j.rse.2016.07.019
Zhou, L., Guo, J., Hu, J., Li, J., Xu, Y., Pan, Y., et al. (2017). Wuhan Surface Subsidence Analysis in 2015-2016 Based on Sentinel-1A Data by SBAS-InSAR. Remote Sens. 9 (10), 982. doi:10.3390/rs9100982
Keywords: InSAR, soil erosion, Loess Plateau, wind-water erosion crisscross region, meteorological factors
Citation: Sun Q, Zhang H, Huang L and He C (2022) Monitoring Surface Deformation Associated With Soil Erosion in Loess Plateau With an Improved Small Baseline Subset Interferometric Synthetic Aperture Radar Algorithm. Front. Environ. Sci. 10:953442. doi: 10.3389/fenvs.2022.953442
Received: 26 May 2022; Accepted: 20 June 2022;
Published: 25 July 2022.
Edited by:
Changwook Lee, Kangwon National University, South KoreaReviewed by:
Jie Dong, Wuhan University, ChinaHongdong Fan, China University of Mining and Technology, China
Copyright © 2022 Sun, Zhang, Huang and He. This is an open-access article distributed under the terms of the Creative Commons Attribution License (CC BY). The use, distribution or reproduction in other forums is permitted, provided the original author(s) and the copyright owner(s) are credited and that the original publication in this journal is cited, in accordance with accepted academic practice. No use, distribution or reproduction is permitted which does not comply with these terms.
*Correspondence: Qian Sun, c2FuZHJhQGh1bm51LmVkdS5jbg==; Heng Zhang, emhhbmdoZW5nQGh1bm51LmVkdS5jbg==
 Qian Sun
 Heng Zhang
 Long Huang
 Caihong He