 Chenxi Li1Ruiying Min1
 Xihui Gu1,2,3*
 Aminjon Gulakhmadov4,5Sijia Luo1Ruihan Liu1Louise J. Slater6Fenghua Xie1*
 Dongdong Kong1
 Jianyu Liu7Yanan Li8,9
- 1Department of Atmospheric Science, School of Environmental Studies, China University of Geosciences, Wuhan, China
- 2Collaborative Innovation Center for Western Ecological Safety, Lanzhou University, Lanzhou, China
- 3Key Laboratory of Geospatial Technology for Middle and Lower Yellow River Regions (Henan University), Ministry of Education, Kaifeng, China
- 4Research Center of Ecology and Environment in Central Asia, Xinjiang Institute of Ecology and Geography, Chinese Academy of Sciences, Urumqi, China
- 5Institute of Water Problems, Hydropower and Ecology of the National Academy of Sciences of Tajikistan, Dushanbe, Tajikistan
- 6School of Geography and the Environment, University of Oxford, Oxford, United Kingdom
- 7Hubei Key Laboratory of Critical Zone Evolution, School of Geography and Information Engineering, China University of Geosciences, Wuhan, China
- 8Zhengzhou Tourism College, Zhengzhou, China
- 9College of Environment and Planning, Henan University, Key Laboratory of Geospatial Technology for Middle and Lower Yellow River Region, Kaifeng, China
Both moist heatwaves (HWs) and heavy precipitation events (HP) have increased in both frequency and magnitude over China in recent decades. However, the relationship between HW and HP and changes in the lagged coincidence of events (i.e., the occurrence of an HP event several days after an HW event, noted HWHP) remain unknown. We show here that HWHP events account for nearly one-third of HP events over China in summer, with high values in North China, Northeast China, and the East arid zone. HWHP events assessed using the heat index and the wet-bulb temperature methods increased by 45.25 and 23.97% from 1961 to 2019, respectively. These concurrent HWHP events tend to be spatially clustered, and the areas affected simultaneously have grown significantly. The increase in HW is the major driver of these changes in HWHP events, except in the western arid zone and North China. Our findings provide an understanding of the spatiotemporal changes in HWHP events over China and their implications for disaster mitigation.
Highlights
• In China, one-third of heavy precipitation events in summer are preceded by a moist heatwave event.
• Sequential heatwave–heavy precipitation (HWHP) events have increased by 45.25 and 23.97% from 1961 to 2019, as measured by heat index and wet-bulb temperature, respectively.
• HWHP events tend to cluster in space and the areas affected have grown significantly.
Introduction
Human-induced warming intensifies extreme weather events (Rogelj et al., 2016; Diffenbaugh et al., 2017; Gillett et al., 2021). As two of the most common and destructive weather extremes, heatwaves (HWs) and heavy precipitation (HP) have long been major concerns (Fischer and Knutti, 2015; Donat et al., 2016; Alizadeh et al., 2020; Shiogama et al., 2021) because both have caused significant losses to society, economy, and human health (Fischer and Knutti, 2015; Wahl et al., 2015; Butler, 2020; Vicedo-Cabrera et al., 2021). HWs characterized by extreme air temperature over a prolonged period of time have been observed and projected to increase rapidly (Perkins et al., 2012; Chen et al., 2018; Perkins-Kirkpatrick and Lewis, 2020; Zhang and Zhou, 2020). For example, the probability of mega-heatwaves in Europe has increased five-fold (Schiermeier, 2019). Extreme heat stress, on the other hand, which integrates temperature and humidity, is more closely related to human health and has a faster rising rate than temperature-based HWs (Li et al., 2018, Li C et al., 2020; Freychet et al., 2020; Zhang et al., 2021). In addition to HWs, HP is becoming heavier and more frequent under climate change (Fischer and Knutti, 2016; Hu et al., 2016; Hu et al., 2017; Hu et al., 2019; Myhre et al., 2019; Kirchmeier-Young and Zhang, 2020). For example, 100-years intense precipitation events over North America, as assessed over the period 1961–2010, are expected to occur every 2.5 years on average with +3°C of warming (Kirchmeier-Young and Zhang, 2020).
Although changes in HWs and HP have been investigated individually at global and regional scales, few studies have focused on sequential heatwave–heavy precipitation (HWHP) events (i.e., an HP event occurring within several days after an HW event) (Lombardo and Ayyub, 2015; Zhang and Villarini, 2020; Chen et al., 2021; Liao et al., 2021; Wu et al., 2021; You and Wang, 2021; Gu et al., 2022; Ning et al., 2022). In the last decade, rare rainstorms tightly following the record-breaking HWs have been reported in some areas. On June 29, 2012, Washington DC in America experienced a record-breaking hot–humid HW in the daytime followed by a rare rainstorm in the nighttime. This HWHP event killed at least 13 people (https://en.wikipedia.org/wiki/2012_North_American_heat_wave). On July 10, 2017, a record-breaking rainstorm hit Paris, France, with rainfall equivalent to 27-days amount falling in 2 hours, followed by a HW event, which swept across Europe (https://www.bbc.com/news/world-europe-40554842). On May 27, 2019, a record-breaking HW lasting for several days in northeastern China ended with heavy precipitation (http://www.china.org.cn/china/2019-05/23/content_74813919.htm). Given that both HWs and HP are becoming more extreme and more frequent, the increased risk of HW accompanied by HP is expected to rise. Thus, these HWHP events have been the topic of recent studies (Lombardo and Ayyub, 2015; Zhang and Villarini, 2020; Chen et al., 2021; Liao et al., 2021; Wu et al., 2021; You and Wang, 2021; Gu et al., 2022; Ning et al., 2022).
In recent decades, China has experienced numerous deadly HWs and severe HP events (Yu et al., 2022). The number of HW-related deaths in China has increased four-fold from 1990 to 2019, and the extreme wet-bulb temperature with consideration of humidity in North China is projected to exceed the threshold that people may tolerate during the period 2070–2100 (Kang and Eltahir, 2018). Zhang and Zhou (2020) indicated that HP in China would increase by 6.52% per 1°C warming. Since both HWs and HP over China occur mostly in summer (June–August), joint events are highly likely. Although recent studies have investigated compound flooding and hot extremes over China (Wu et al., 2021; You and Wang, 2021; Gu et al., 2022; Ning et al., 2022), the following questions remain unknown:
• Do sequential HWHP events cluster in space, and if so, do these clusters expand or contract?
• Are the changes in HWHP events driven by changes in HWs, HP events, or both?
Data and Methods
In Situ Weather Observations and Homogenous Climate Regions
The National Meteorological Information Center of China Meteorological Administration provides in situ daily weather observations at 2,481 stations since 1951. This observation dataset has been quality-controlled before it was released. First, the instruments and methods to measure these observations conform to the demands of Specifications for Surface Meteorological Observation (GB/T 35,221–2017) set by China Meteorological Administration. Second, the data quality is systematically checked and validated, such as checking outliers in climatology, stations, and regions, and internal, temporal, and spatial consistencies of time series, according to the Guidelines on the quality control of surface climatological data (Ren et al., 2015; Cao et al., 2016). These stations measure precipitation (units: mm), surface air temperature (SAT, units: °C), and relative humidity (RH, units: %). We use the following criteria to select stations for the following analyses: 1) data availability covers 1961–2019; 2) the percentage of missing data during the summer of 1961–2019 is no more than 0.5%; and 3) the maximum consecutive missing days are no more than 31 days during 1961–2019. A total of 1,776 stations are selected for our analyses based on these criteria. If the consecutive missing days are no more than 2 days, the missing values are filled by the mean of their adjacent values. If the consecutive missing days are more than 2 days, the missing values are linearly interpolated based on the neighboring stations (Zhang et al., 2011). We expect the gap filling has limited impacts on the analyses because most of these 1,776 stations have few missing values in precipitation, SAT, and RH as shown in Figure 1. It should be noted that inhomogeneity exists in these observed values, especially in RH (Li Z. et al., 2020; Freychet et al., 2020). We used the RHtestsV4 software package (https://github.com/ECCC-CDAS/RHtests) to homogenize the daily observations (Xu et al., 2013; Kong et al., 2020).
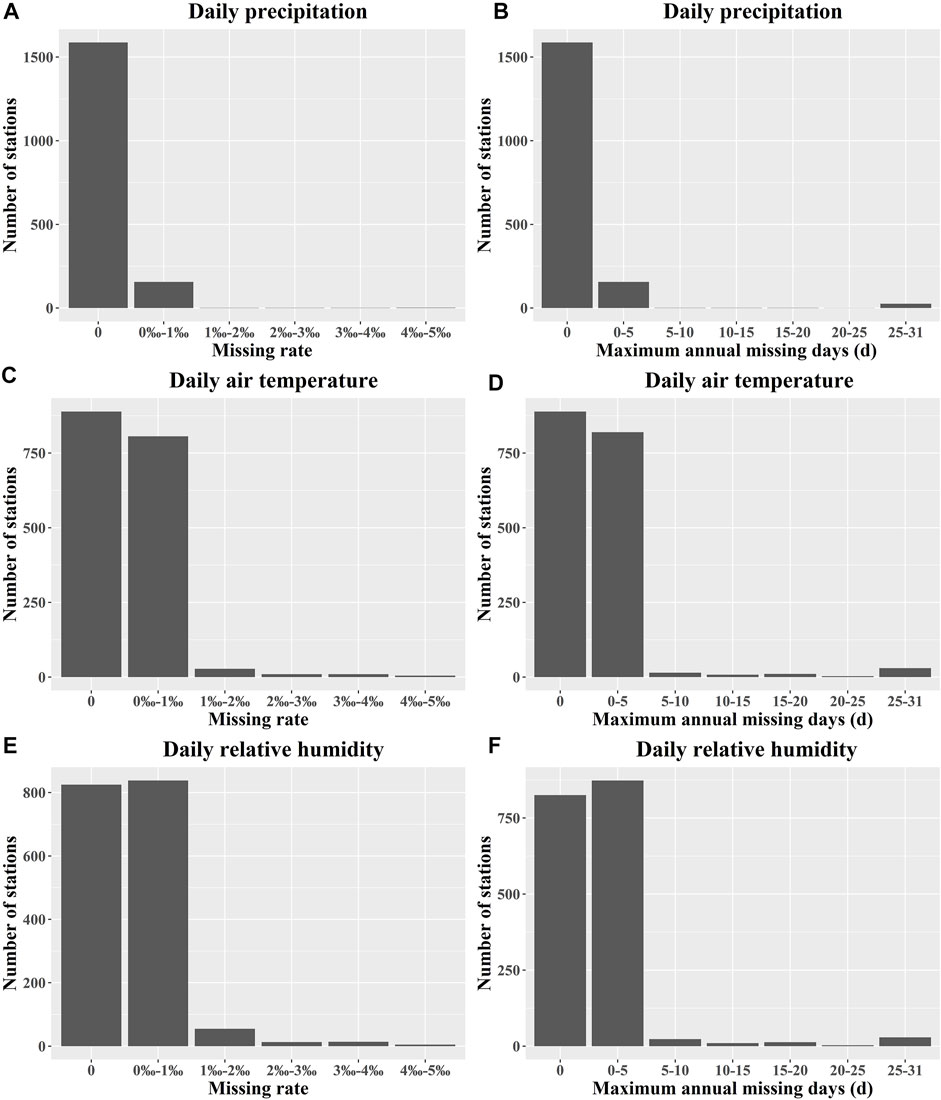
FIGURE 1. Missing rate and maximum annual missing days of daily precipitation (A,B), surface air temperature [SAT; (C,D)], and relative humidity [RH; (E,F)] at 1,776 stations over China during 1961–2019.
Considering the complex topography and diverse climate types, we apply the region divisions from Zhang and Lin (1985) to subdivide China into eight regions. The homogenous climatic regions were determined based on heat and moisture and have been widely used in previous studies (Xiao et al., 2013; Gu et al., 2017). The eight regions are West arid zone (WAZ), East arid zone (EAZ), Northeast China (NEC), North China (NC), Central China (CC), South China (SC), Southwest China (SWC), and Qinghai–Tibet Plateau (QTP) (Figure 3A). Each region shares a homogenous climatic feature.
Identification of HW and HP Events
The heat index (HI, in °C) and wet-bulb temperature (TW, in °C) are the two most widely used indicators to evaluate moist heat stress (Kang and Eltahir, 2018; Li et al., 2018; Luo and Lau, 2018; Kong et al., 2020; Zhang and Villarini, 2020; Vicedo-Cabrera et al., 2021). HI is calculated based on the Rothfusz regression (https://www.wpc.ncep.noaa.gov/html/heatindex_equation.shtml):
When
When
When
It should be noted that the HI and SAT in Eqs. 1–4 are in Fahrenheit degrees (
The TW is calculated as follows (Stull, 2011):
In Eqn. 5, TW and SAT are in °C. Both HI and TW include temperature and humidity. Hot and humid conditions lead to high HI and TW [Figure 2; (Li et al., 2018; Luo and Lau, 2018)]. Compared with TW, HI is more sensitive to change in SAT, especially under high humidity conditions (Figure 2).
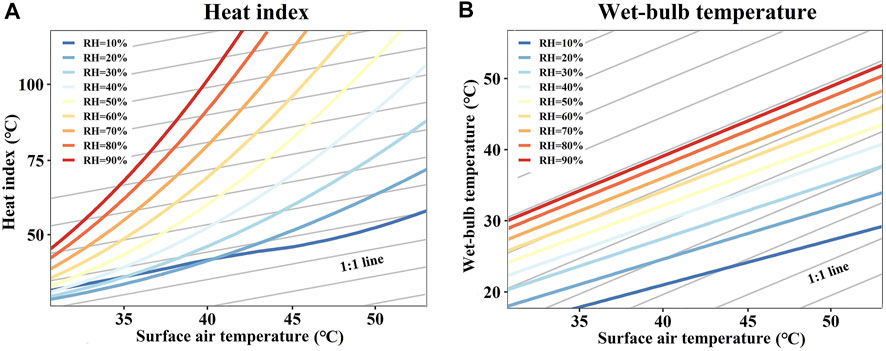
FIGURE 2. Relations between heat index [HI; (A)]/wet-bulb temperature [TW; (B)] and SAT under different RH levels. The relations are computed from our data and are also shown in previous studies (Li et al., 2018; Luo and Lau, 2018).
The 95th percentile of daily HI/TW during the period 1961–1990 is used as the threshold for HW identification. A day with HI/TW above the threshold is defined as a hot and humid day, and consecutive hot and humid days (>= 3 days) are defined as an HW event. HW events identified in HI/TW are noted as HW_HI/HW_TW. Both HW_HI and HW_TW mainly occur in summer (June–August; Supplementary Figures S1, S2). Therefore, we focus on the HWHP events in summer.
HP events in China are defined as the days with total 24-h precipitation above 50 mm in the China Meteorological Administration (http://www.cma.gov.cn/2011xzt/kpbd/rainstorm/2018050901/201805/t20180509_468007.html). However, this definition would lead to few HP events identified in northwestern China. Considering the regional differences in precipitation amounts, we take the 95th percentile of non-zero precipitation during the period 1961–1990 as the threshold and identify HP events in the same way that we used to identify HW events.
Identification of Sequential Heatwave–Heavy Precipitation Events
An HW_HI/HW_TW event occurring prior to an HP event, within a given time window, is defined as an HWHP event (noted as HWHP_HI and HWHP_TW, respectively) (Lombardo and Ayyub, 2015; Zhang and Villarini, 2020; Chen et al., 2021; Liao et al., 2021; Wu et al., 2021; You and Wang, 2021; Gu et al., 2022; Ning et al., 2022). The window is chosen as 3 days in this study, which is the same as previous studies (Lombardo and Ayyub, 2015; Zhang and Villarini, 2020; Chen et al., 2021; Liao et al., 2021; Wu et al., 2021; You and Wang, 2021; Gu et al., 2022; Ning et al., 2022). In the following analyses, we also examine whether our results are sensitive to the choice of the time window (e.g., 2, 4, and, 7 days).
The co-occurrence of HW and HP can occur by chance and be described as a Poisson process. We use event coincidence analysis (ECA) to test whether the encounter of both event types is by chance or not (He and Sheffield, 2020; Zhang and Villarini, 2020):
where
The lagged coincidence between HW and HP is significantly different from a Poisson process if the p-value is less than 0.05.
Spatial Autocorrelation, Temporal Trend, and Distribution Test
Moran’s I index is used to examine the spatial autocorrelation of HW, HP, and HWHP events (Moran, 1948; Moran, 1950; Alizadeh et al., 2020). The value of Moran’s I is between -1 and 1. Positive/negative Moran’s I values indicate a spatial clustering of similar/dissimilar values. The non-parametric modified Mann-Kendall method (Hamed and Ramachandra Rao, 1998) is used to test the presence of trends in the frequency of these events. The two-sample Kolmogorov–Smirnov (K–S) test is used to detect whether there is a significant difference in the empirical cumulative distribution functions (CDFs) of these events between two periods (Alizadeh et al., 2020).
Attribution of Changes in Sequential HWHP Events
The relative contributions of HW and HP to changes in HWHP events are estimated by using partial least squares regression (PLSR) (Wold et al., 2001; Luedeling et al., 2009; Guo et al., 2013). The variable importance in the projection (VIP) in PLSR indicates the relative importance of HW and HP to the changes in HWHP. Variables with a VIP value >1 are more important for HWHP changes. The PLSR model goodness of fit is evaluated by the coefficient of determination (R2).
Results and Discussion
Contributions of HWHP Events to Total HP Events
We identify HWHP events during the summer of 1961–2019 by setting the lagged time as 3 days (Figure 3). About one-third of HP events are preceded by HWs over China (i.e., 33.30% for HWHP_HI and 32.38% for HWHP_TW; Figures 3A,C). This percentage is generally consistent with the percentage found in the Central United States, where 28.9% of floods on average are preceded by HWs (Zhang and Villarini, 2020). One HWHP event for every three HP events on average indicates that the potential disaster risks of these “preconditioned” events are unneglectable in China. The ECA method indicates that the occurrences of HWHP_HI/HWHP_TW events are not due to chance in 48.25%/60.19% of stations at the 0.05 significance level, suggesting that the lagged coincidence of HW and HP events is statistically associated at a fair number of stations. These stations are mainly found in northern China, including North China, Northeast China, and the East arid zone. Supplementary Figures S3, S4 reveal that the spatial patterns of HWHP events are consistent when setting the time lag between events as 2, 4, or 7 days, and when choosing 50 mm as the threshold to define HP events.
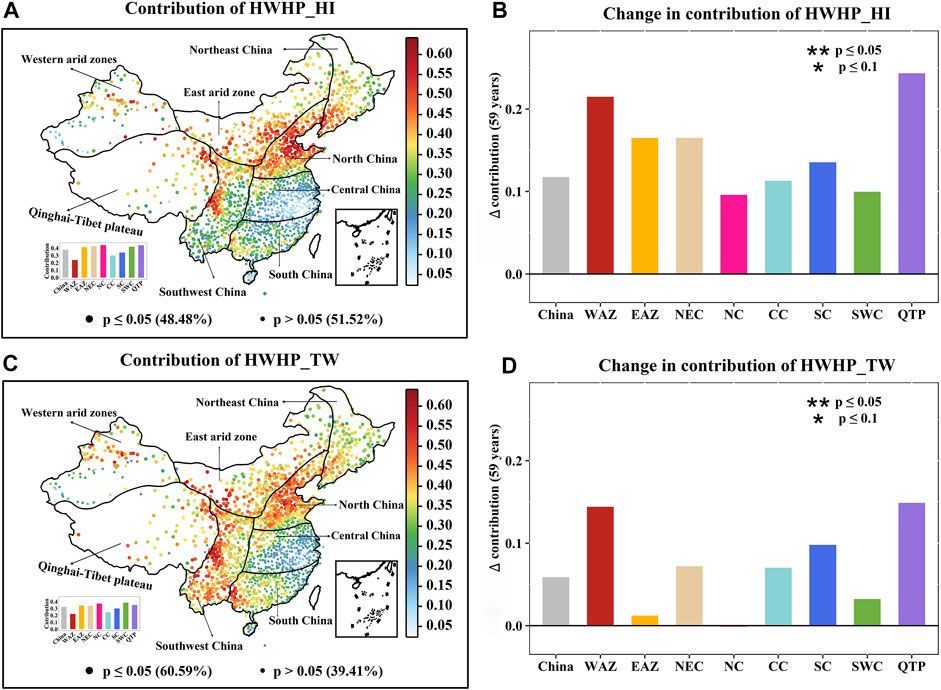
FIGURE 3. Fractional contributions of heatwave–heavy precipitation (HWHP) events to total heavy precipitation (HP) events in summer during 1961–2019. Heat index-based HWHP events are noted as HWHP_HI (A,B); wet-bulb temperature-based HWHP events as HWHP_TW (C,D). In (A) and (C), colored dots indicate the fractional contributions, and large dots indicate that lagged coincidence between HW and HP is significantly different from a Poisson process (p < 0.05). In (B) and (D), “
Fractional contributions of HWHP to HP events are unevenly distributed in space. Stations with high fractional contributions are mainly located in North China (43%/37% for HWHP_HI/HWHP_TW), Northeast China (40%/34%), and the East arid zone (39%/34%), while low values are found in central China (23%/24%), South China (28%/30%) and the West arid zone (22%/22%) (Figures 3A,C). The spatial patterns of fractional contributions are consistent with those shown in previous studies (Wu et al., 2021; You and Wang, 2021; Ning et al., 2022). The linkage between hot–humid HW and HP events is preliminarily explained as follows: HWs warm the atmosphere (characterized by high sensible heat) and provide abundant vapor (high specific humidity), and then enhance the atmospheric instability (large convective available potential energy), which favors the formation of HP (Zhang and Villarini, 2020; You and Wang, 2021). In northern China, rainstorms are usually tied to the local concentration of humidity caused by non-uniform saturation (Yang et al., 2007; Gao et al., 2010). Warm–wet moisture gradually accumulates in the low-level atmosphere during HW events, and dry–cold air intrusions in the middle and upper levels enhance the vertical movement and cause strong convection (Shuai and Shou-Ting, 2006; Shuai et al., 2009), resulting in moisture convergence at the bottom and divergence at the top (Yu et al., 2011; Shouting et al., 2018). The rainstorms in central China and South China are associated with different generation mechanisms from northern China (Shouting et al., 2018). In South China, tropical cyclones play an important role in causing HP events (Zhang et al., 2017; Wang et al., 2020), and in central China, HP events are mainly caused by the Meiyu front (Ding and Chan, 2005). The two weather systems reduce the association between HW and HP events, leading to lower fractional contributions of HWHP to HP events in the two regions. You and Wang (2021) compared the convective available potential energy (CAPE), convective inhibition (CIN), and vertically integrated moisture divergence (VIMD) in the 1 day prior to the HP events between with HW and without HW. They found that both northeastern and southeastern parts of China experienced higher CAPE in HP with HW events than that without HW events, while the CIN in southeastern China is also higher, suppressing the moist convection in this region despite higher CAPE. Because rainstorm generation mechanisms vary in different regions of China, the physical processes explaining the HWHP events should be further explored by considering local weather conditions. We should also keep in mind that a HWHP event may also rise by chance, an HP event may coincidently occur after an HW event (without cause and effect), such as the events that occurred at the stations not passing the ECA test (Figures 3A,C).
In comparison with the spatial pattern of the fractional contributions, more striking is the significantly increasing trends, showing that more and more HP events are linked with HW events in each year over the past 6 decades (Figures 3B,D). Specifically, the fractional contribution of HWHP_HI/HWHP_TW in China increased from 27%/29% to 40%/36% during 1961–2019, respectively. These increasing trends are detected in all sub-regions, especially for HWHP_HI, and in the western arid zone (from 12%/15% to 33%/29%) and the Qinghai–Tibet Plateau (from 26%/28% to 50%/42%).
Spatiotemporal Changes in HWHP Events
We therefore examine temporal trends in the frequency of HW, HP, and HWHP events (Figure 4; Table 1). China is experiencing more frequent moist heat stress extremes (0.32 event/decade and 0.14 event/decade for HW_HI and HW_TW, respectively, correspondingly, p < 0.05 and p < 0.1) (see inset panels with trend line in Figures 4A,B); and also see (Luo and Lau, 2018; Kong et al., 2020). However, this increase is not significant in North China (0.11/-0.01 event/decade) and central China (0.13/−0.08 event/decade) (Figures 4A,B), and the increase is weaker in TW-based HWs. This difference in North and central China may be associated with the slight increase in air temperature and the significant decrease in relative humidity in summer in the two regions (Supplementary Figure S5). The widespread decreases in relative humidity (Supplementary Figure S5) mean that the increases in HW_TW are not as intense as the increases in HW_HI since TW is more sensitive to these decreases in relative humidity than HI (see the exponential/linear relations between HI/TW and SAT under different relative humidity levels; Figure 2). HP events have become more frequent over China (0.048 event/decade, p < 0.05; Figure 4C). Central China, South China, and the western arid zone have witnessed increasing frequencies of HP events of 0.17, 0.09, and 0.11 event/decade, respectively, (p < 0.05, 0.1, and 0.05), while North China and the East arid zone on the contrary have seen decreases (of −0.05 and −0.01 event/decade, respectively). The spatial pattern of change in HP events is consistent with the pattern found in previous studies (Ren et al., 2015; Ren et al., 2016; Gu et al., 2017).
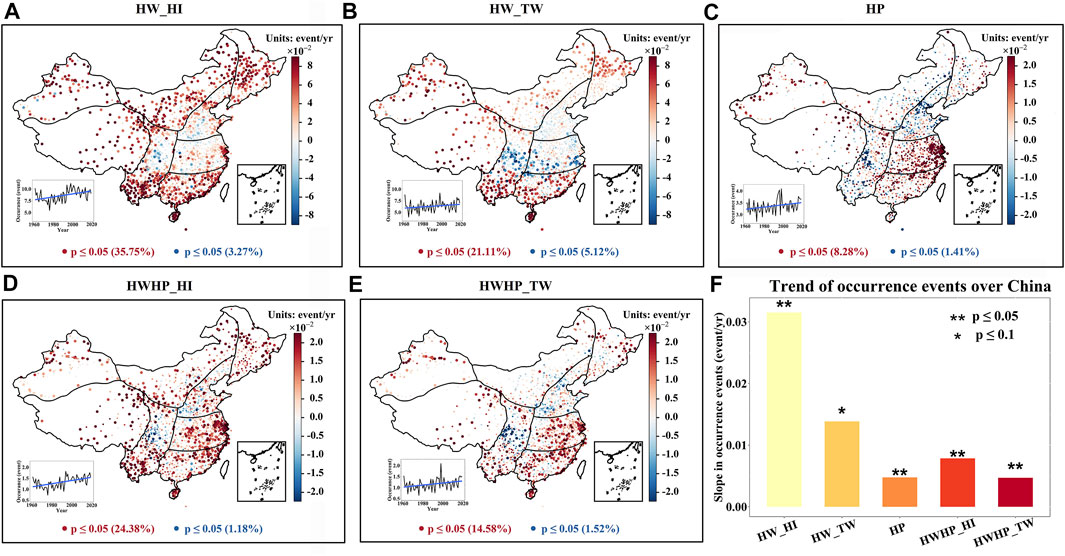
FIGURE 4. Maps showing trends in the frequency of heat index-based HWs (HW_HI) (A), wet-bulb temperature-based HWs (HW_TW) (B), HP (C), HWHP_HI (D), and HWHP_TW (E). In (A–E), the line charts indicate the temporal changes in the frequency of these events over China. Correspondingly, the slopes of the trends are shown as bar plots in panel F.
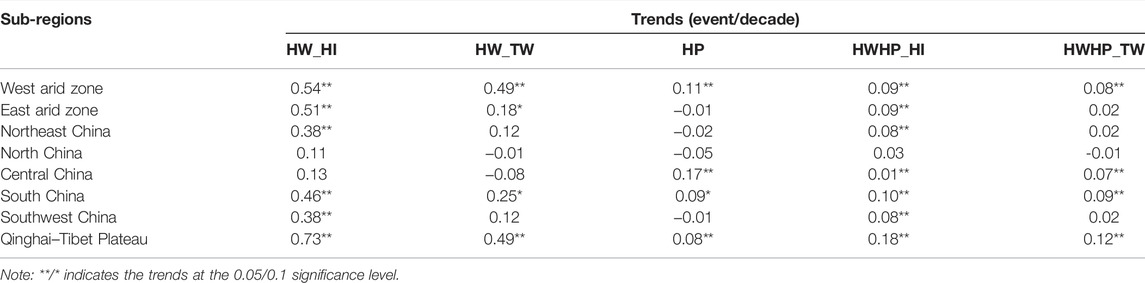
TABLE 1. Trends in the frequency of HW_HI, HW_TW, HP, HWHP_HI, and HWHP_TW in each region during 1961–2019.
Alongside these increases in the number of HWs and HP events over China, both HWHP_HI and HWHP_TW events have also significantly increased by 0.08 event/decade (i.e., 45.25% from 1961 to 2019) and 0.05 event/decade (23.97%), respectively, (p < 0.05). The regions with widespread increases in HWHP events are the western arid zone (0.09/0.08 event/decade; 117.98%/94.61%), Qinghai–Tibet Plateau (0.18/0.12 event/decade; 70.31%/49.07%), Northeast China (0.08/0.02 event/decade; 51.61%/27.67%), Central China (0.01/0.07 event/decade; 71.35%/50.91%), and South China (0.10/0.09 event/decade; 59.35%/48.67%) (Figures 4D,E; Table 1). The spatial pattern of changes in HWHP events is consistent with that of HW events (Figures 4D,E), implying that trends in HWs play a more important role in the changes in HWHP over China. However, HWs are not always the dominant driver of changes in HWHP events. For example, central China has no changes in HWs but faces increasing threats of HWHP events because of the increase in HP events. The most prominent increases of HWHP events in central China are found in the Yangtze River Delta, a highly urbanized area (Figures 4D,E). Urbanization on the one hand enhances rainstorms (Jiang et al., 2020; Wang et al., 2021) and on the other hand accelerates the increases in intense heat stress (Luo and Lau, 2018; Kong et al., 2020), resulting in an increased probability of lagged coincidence between HW and HP. Wu et al. (2021) further quantified the contribution of urbanization to increased HWHP events in South China and indicated that the contribution of urbanization is 40.91%.
We also notice that the temporal evolution of HW, HP, and HWHP events is not a monotonous trend but exhibits a step-like change (see the line graphs in Figures 4D,E). The frequency of these events fluctuates at a higher level after the year 2000. Therefore, we evaluate the changes of average frequencies during 2000–2019 relative to 1961–1980 (Figure 5). The spatial change patterns of these events are consistent between Figures 4, 5, indicating that the increases in these events are not sensitive to the methods of detection.
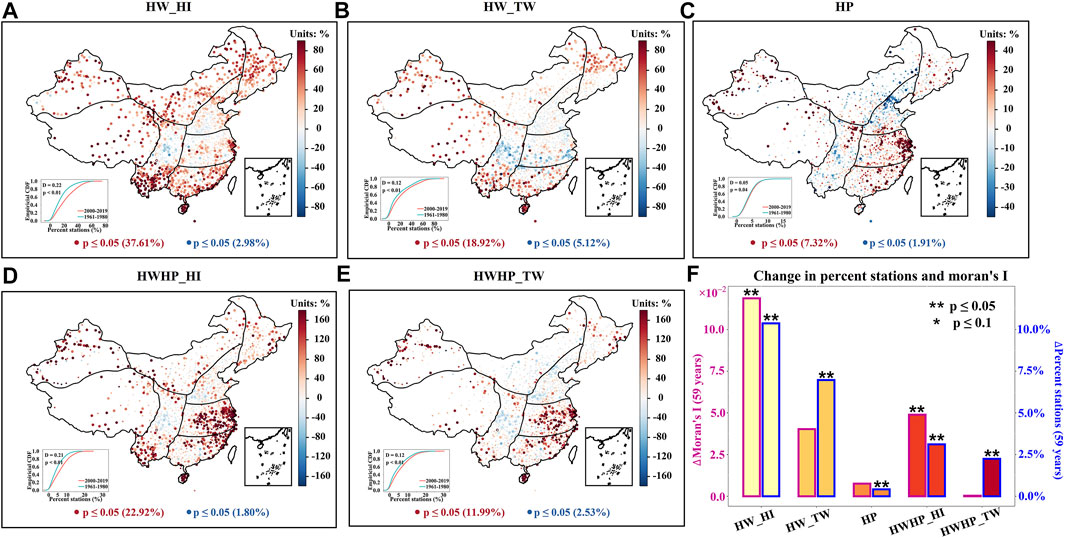
FIGURE 5. Maps showing changes in average frequencies of HW_HI (A), HW_TW (B), HP (C), HWHP_HI (D), and HWHP_TW (E) during 2000–2019 relative to 1961–1980. In (A–E), large dots indicate that the changes are significant at the 95% level, as detected by the Student’s t test. Red and blue curves are the empirical cumulative distribution functions (CDFs) of the percentage of stations experiencing an event (HWs/HP/HWHP) synchronously during 2000–2019 and 1961–1980, respectively. Correspondingly, trends in the annual percent of stations during 1961–2019 are shown as bar plots with a blue border in panel (F). Trends in Moran’s I index of these events are shown as bar plots with a red border.
Spatial Clustering and Changes in the Extent of HWHP Events
In addition to the frequency of these events, any spatial clustering and/or changes in the extent of HWHP events is likely to affect the extent of associated disasters (Fischer et al., 2013). Changes in the spatial extent of these events during 2000–2019 relative to 1961–1980 are estimated by changes in the empirical CDFs of the percentages of stations that have an event (HW, HP, or HWHP) synchronously on the same day; (see Figures 5A–E). The upper tail of the CDF for HW and HWHP events moves significantly to the right during 2000–2019, suggesting that China has witnessed spatial expansions of HWs and HWHP events in recent 20 years. These spatial expansions are confirmed by the significantly increasing trends in the annual percentage of stations experiencing a given type of event (Figure 5F; Table 2). These spatial expansions can be observed in most regions, except for North China (Figures 6b1–b8).
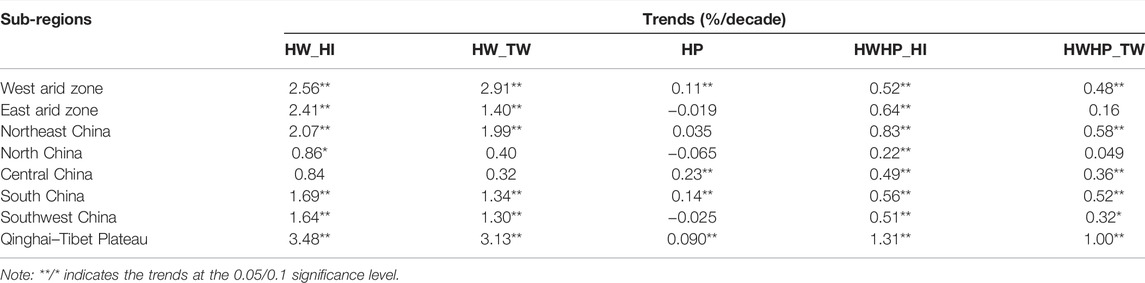
TABLE 2. Trends in the percent of stations in concurrent HWs/HP/HWHP synchronously in each region during 2000–2019.
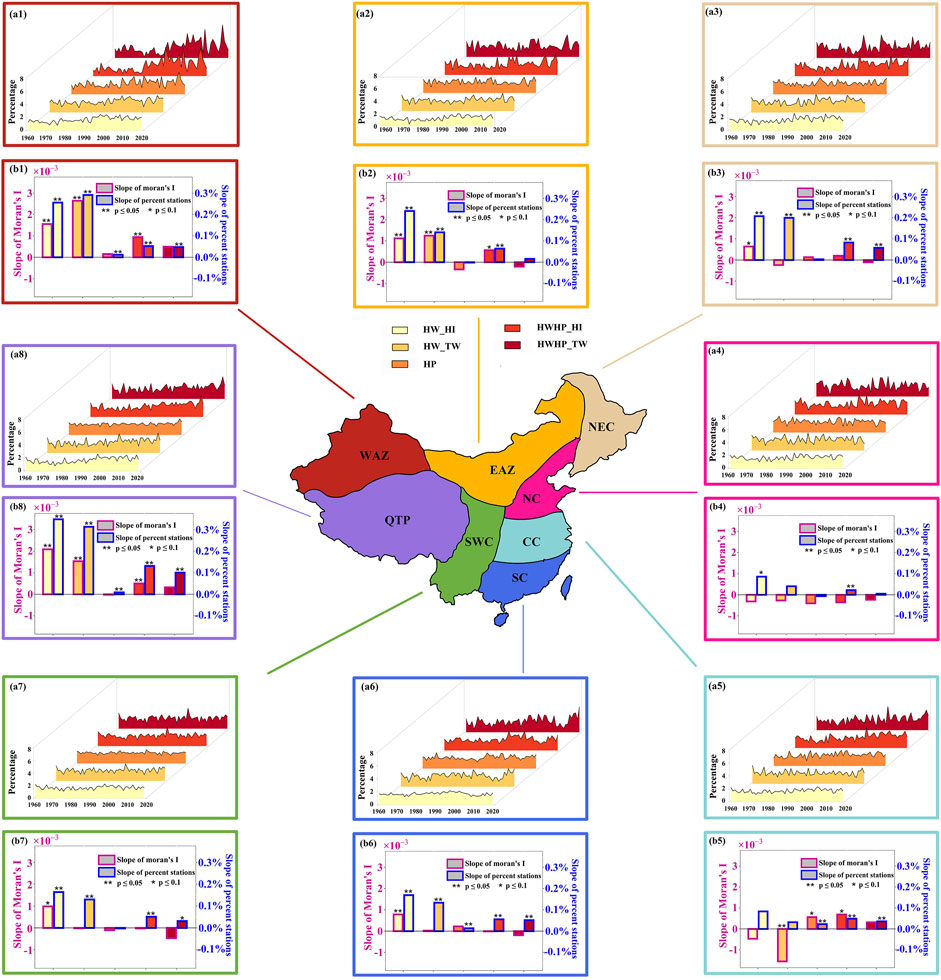
FIGURE 6. Changes in HWs, HP, and HWHP events in each region during 1961–2019. Temporal evolutions of the regional average frequency of HW_HI, HW_TW, HP, HWHP_HI, and HWHP_TW are shown in (A1–A8). Panels (B1–B8) are the same as Figure 5F but for each region.
The spatial clustering of these events is evaluated by Moran’s I index (Figure 5F; Table 3). China and most regions show no trend in Moran’s I for HP events. However, the spatial clustering of HW_HI and HWHP_HI shows significantly positive trends with increases in Moran’s I index of 0.07 and 0.03 from 1961 to 2019, respectively. This implies that HI-based HWs are the major contributor to the spatial clustering of HWHP_HI events. We also notice that there are stark differences in the changes of Moran’s I index among the different regions of China (Figures 6b1–b8). The western arid zone and the Qinghai–Tibet Plateau are the two regions where changes in Moran’s I index are consistent with those found in China. Overall, the areas with concurrent HWHP events occurring simultaneously are expanding and tend to be clustering, especially for HI-based HWHP events.
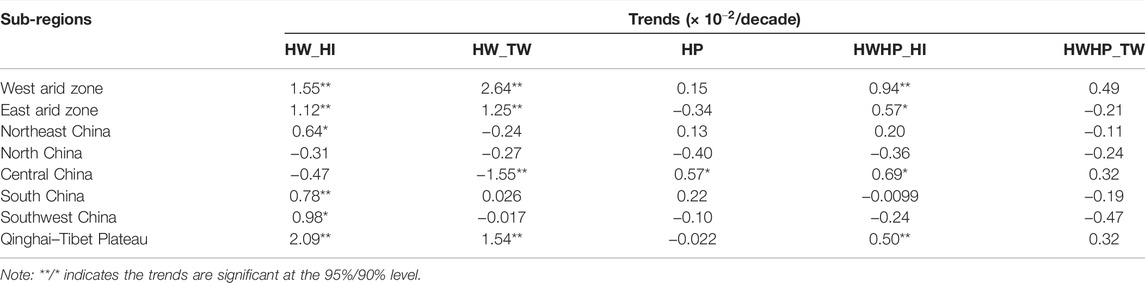
TABLE 3. Trends in Moran’s I index of HW_HI, HW_TW, HP, HWHP_HI, and HWHP_TW in each region during 1961–2019.
Since both HWs and HP affect the spatial and temporal features of HWHP events, we employ the PLSR method to quantify the relative contributions of HWs or HP events to HWHP changes in each region (Table 4). The attribution results show that HWHP changes can be classified into three categories: HWHP events driven by HWs, events driven by HP, and events driven by both HWs and HP. In the West arid zone, changes in HWHP_HI/HWHP_TW events are mainly driven by HP events with a relative contribution of 57.02%/54.60%, respectively, (Table 4; also see Figure 6a1 for significant increases in both HP and HWHP events in recent decades). In North China, there are no trends in HW and HP; they jointly lead to slight changes in HWHP events (Figure 6a4), and their relative contributions are almost half–half. In the other regions, HW tends to play a more important role in driving the HWHP events. South China for example is a typical region where HW is the dominant driver of the increases in HWHP events (Figure 6a6) with a relative contribution of more than 60% (Table 4). Chen et al. (2021) found the increased sequential flood-heatwave events across China and indicated that increased HW events dominate the increased compound events. Gu et al. (2022) projected increases in bivariate compound flood-heatwave hazards globally under future warming and attributed these increases to enhancing HW events.
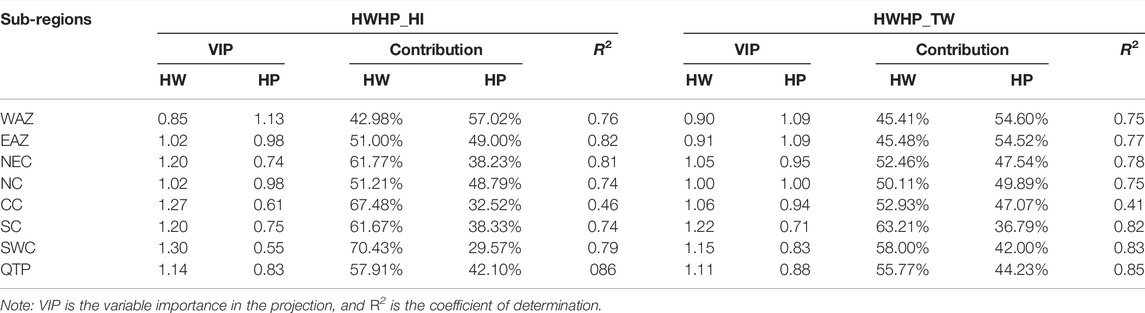
TABLE 4. Attribution of the changes in HWHP events to HW and HP based on the partial least squares regression (PLSR) method.
Conclusion
Sequential heatwave–heavy precipitation (HWHP) events can amplify the damages caused by individual heatwaves (HWs) and heavy precipitation (HP) events. Herein, we show that HP events preceded by moist HWs [identified from the heat index (HI) and wet-bulb temperature (TW), respectively] account for one-third of all summer HP events over China. The fractional contribution of HWHP to HP events is increasing both in China and in all sub-regions during 1961–2019. High (low) fractional contributions are found in North China, Northeast China, and East arid zone (central China and South China). China is experiencing significant increases in HWHP events with increasing rates of 45.25 and 23.97% for HI- and TW-based events, respectively. The most prominent increases in HWHPs are found in central China (with increases of 71.35 and 50.91% over 1961–2019 as measured by HWHP_HI and HWHP_TW, respectively). In the last 2 decades, the areas with concurrent HWHP events occurring synchronously have been expanding. In addition, we find the spatial clustering of concurrent HWHP events has increased; further work could assess changes in the contiguous spatial extent of individual events, and how they might evolve in the future with climate change. As HWHP events can put social system services and public health at risk, mitigation measures could be developed to alleviate the potential damages caused by increasing HWHP events.
Data Availability Statement
Publicly available datasets were analyzed in this study. This data can be found here: weather observations at 2,481 stations across China are obtained from the National Meteorological Science Data Center (http://data.cma.cn/en). This dataset is now unavailable for public download. Due to data licensing restrictions, we are not authorized to share original data but to provide the processed data that are associated with all the results in this study (available at https://doi.org/10.5281/zenodo.5174963).
Author Contributions
XG and FX design this study, CL conducts the data calculation and writes the first draft, CL and RM conduct the visualization, XG, FX, and LS review and editing the final draft, and all authors contribute to the interpretations of results.
Funding
The following projects support this study: the National Key R&D Program of China (Grant 2018YFA0605603), the National Natural Science Foundation of China (Grant Nos. U1911205, 41901041, and 42001042), the Fundamental Research Funds for the Central Universities (lzujbky-2021-kb12), and Open Fund of Key Laboratory of Geospatial Technology for the Middle and Lower Yellow River Regions (Henan University), and Ministry of Education (GTYR202003).
Conflict of Interest
The authors declare that the research was conducted in the absence of any commercial or financial relationships that could be construed as a potential conflict of interest.
Publisher’s Note
All claims expressed in this article are solely those of the authors and do not necessarily represent those of their affiliated organizations, or those of the publisher, the editors, and the reviewers. Any product that may be evaluated in this article, or claim that may be made by its manufacturer, is not guaranteed or endorsed by the publisher.
Supplementary Material
The Supplementary Material for this article can be found online at: https://www.frontiersin.org/articles/10.3389/fenvs.2022.951392/full#supplementary-material
References
Alizadeh, M. R., Adamowski, J., Nikoo, M. R., AghaKouchak, A., Dennison, P., and Sadegh, M. (2020). A Century of Observations Reveals Increasing Likelihood of Continental-Scale Compound Dry-Hot Extremes. Sci. Adv. 6, eaaz4571. doi:10.1126/sciadv.aaz4571
Butler, E. E. (2020). Heavy Rain, Come Today. Nat. Clim. Chang. 10, 805–806. doi:10.1038/s41558-020-0834-9
Cao, L., Zhu, Y., Tang, G., Yuan, F., and Yan, Z. (2016). Climatic Warming in China According to a Homogenized Data Set from 2419 Stations. Int. J. Climatol. 36, 4384–4392. doi:10.1002/joc.4639
Chen, Y. D., Li, J., Zhang, Q., and Gu, X. (2018). Projected Changes in Seasonal Temperature Extremes across China from 2017 to 2100 Based on Statistical Downscaling. Glob. Planet. Change 166, 30–40. doi:10.1016/j.gloplacha.2018.04.002
Chen, Y., Liao, Z., Shi, Y., Tian, Y., and Zhai, P. (2021). Detectable Increases in Sequential Flood‐Heatwave Events across China during 1961-2018. Geophys. Res. Lett. 48, e2021GL092549. doi:10.1029/2021GL092549
Diffenbaugh, N. S., Singh, D., Mankin, J. S., Horton, D. E., Swain, D. L., Touma, D., et al. (2017). Quantifying the Influence of Global Warming on Unprecedented Extreme Climate Events. Proc. Natl. Acad. Sci. U.S.A. 114, 4881–4886. doi:10.1073/pnas.1618082114
Ding, Y., and Chan, J. C. L. (2005). The East Asian Summer Monsoon: An Overview. Meteor. Atmos. Phys. 89, 117–142. doi:10.1007/s00703-005-0125-z
Donat, M. G., Lowry, A. L., Alexander, L. V., O’Gorman, P. A., and Maher, N. (2016). More Extreme Precipitation in the World's Dry and Wet Regions. Nat. Clim. Change 6, 508–513. doi:10.1038/nclimate2941
Fischer, E. M., and Knutti, R. (2015). Anthropogenic Contribution to Global Occurrence of Heavy-Precipitation and High-Temperature Extremes. Nat. Clim. Change 5, 560–564. doi:10.1038/nclimate2617
Fischer, E. M., and Knutti, R. (2016). Observed Heavy Precipitation Increase Confirms Theory and Early Models. Nat. Clim. Change 6, 986–991. doi:10.1038/nclimate3110
Fischer, E. M., Beyerle, U., and Knutti, R. (2013). Robust Spatially Aggregated Projections of Climate Extremes. Nat. Clim. Change 3, 1033–1038. doi:10.1038/nclimate2051
Freychet, N., Tett, S. F. B., Yan, Z., and Li, Z. (2020). Underestimated Change of Wet‐Bulb Temperatures over East and South China. Geophys. Res. Lett. 47, e2019GL086140. doi:10.1029/2019GL086140
Gao, S., Yang, S., and Chen, B. (2010). Diagnostic Analyses of Dry Intrusion and Nonuniformly Saturated Instability during a Rainfall Event. J. Geophys. Res. 115, D02102. doi:10.1029/2009JD012467
Gillett, N. P., Kirchmeier-Young, M., Ribes, A., Shiogama, H., Hegerl, G. C., Knutti, R., et al. (2021). Constraining Human Contributions to Observed Warming since the Pre-industrial Period. Nat. Clim. Chang. 11, 207–212. doi:10.1038/s41558-020-00965-9
Gu, X., Zhang, Q., Singh, V. P., and Shi, P. (2017). Changes in Magnitude and Frequency of Heavy Precipitation across China and its Potential Links to Summer Temperature. J. Hydrol. 547, 718–731. doi:10.1016/j.jhydrol.2017.02.041
Gu, L., Chen, J., Yin, J., Slater, L. J., Wang, H. M., Guo, Q., et al. (2022). Global Increases in Compound Flood‐Hot Extreme Hazards under Climate Warming. Geophys. Res. Lett. 49, e2022GL097726. doi:10.1029/2022GL097726
Guo, L., Dai, J., Ranjitkar, S., Xu, J., and Luedeling, E. (2013). Response of Chestnut Phenology in China to Climate Variation and Change. Agric. For. Meteorol. 180, 164–172. doi:10.1016/j.agrformet.2013.06.004
Hamed, K. H., and Ramachandra Rao, A. (1998). A Modified Mann-Kendall Trend Test for Autocorrelated Data. J. Hydrol. 204, 182–196. doi:10.1016/S0022-1694(97)00125-X
He, X., and Sheffield, J. (2020). Lagged Compound Occurrence of Droughts and Pluvials Globally over the Past Seven Decades. Geophys. Res. Lett. 47, e2020GL087924. doi:10.1029/2020GL087924
Hu, Z., Hu, Q., Zhang, C., Chen, X., and Li, Q. (2016). Evaluation of Reanalysis, Spatially Interpolated and Satellite Remotely Sensed Precipitation Data Sets in Central Asia. J. Geophys. Res. Atmos. 121, 5648–5663. doi:10.1002/2016JD024781
Hu, Z., Zhou, Q., Chen, X., Qian, C., Wang, S., and Li, J. (2017). Variations and Changes of Annual Precipitation in Central Asia over the Last Century. Int. J. Climatol. 37, 157–170. doi:10.1002/joc.4988
Hu, Z., Chen, X., Chen, D., Li, J., Wang, S., Zhou, Q., et al. (2019). "Dry Gets Drier, Wet Gets Wetter": A Case Study over the Arid Regions of Central Asia. Int. J. Climatol. 39, 1072–1091. doi:10.1002/joc.5863
Jiang, X., Luo, Y., Zhang, D.-L., and Wu, M. (2020). Urbanization Enhanced Summertime Extreme Hourly Precipitation over the Yangtze River Delta. J. Clim. 33, 5809–5826. doi:10.1175/JCLI-D-19-0884.1
Kang, S., and Eltahir, E. A. B. (2018). North China Plain Threatened by Deadly Heatwaves Due to Climate Change and Irrigation. Nat. Commun. 9, 2894. doi:10.1038/s41467-018-05252-y
Kirchmeier-Young, M. C., and Zhang, X. (2020). Human Influence Has Intensified Extreme Precipitation in North America. Proc. Natl. Acad. Sci. U.S.A. 117, 13308–13313. doi:10.1073/pnas.1921628117
Kong, D., Gu, X., Li, J., Ren, G., and Liu, J. (2020). Contributions of Global Warming and Urbanization to the Intensification of Human‐Perceived Heatwaves over China. J. Geophys. Res. Atmos. 125, e2019JD032175. doi:10.1029/2019JD032175
Li, J., Chen, Y. D., Gan, T. Y., and Lau, N.-C. (2018). Elevated Increases in Human-Perceived Temperature under Climate Warming. Nat. Clim. Change 8, 43–47. doi:10.1038/s41558-017-0036-2
Li, C., Sun, Y., Zwiers, F., Wang, D., Zhang, X., Chen, G., et al. (2020a). Rapid Warming in Summer Wet Bulb Globe Temperature in China with Human-Induced Climate Change. J. Clim. 33, 5697–5711. doi:10.1175/JCLI-D-19-0492.1
Li, Z., Yan, Z., Zhu, Y., Freychet, N., and Tett, S. (2020b). Homogenized Daily Relative Humidity Series in China during 1960-2017. Adv. Atmos. Sci. 37, 318–327. doi:10.1007/s00376-020-9180-0
Liao, Z., Chen, Y., Li, W., and Zhai, P. (2021). Growing Threats from Unprecedented Sequential Flood‐Hot Extremes across China. Geophys. Res. Lett. 48, e2021GL094505. doi:10.1029/2021GL094505
Lombardo, F. T., and Ayyub, B. M. (2015). Analysis of Washington, DC, Wind and Temperature Extremes with Examination of Climate Change for Engineering Applications. ASCE-ASME J. Risk Uncertain. Eng. Syst. Part A Civ. Eng. 1, 04014005. doi:10.1061/AJRUA6.0000812
Luedeling, E., Hale, A., Zhang, M., Bentley, W. J., and Dharmasri, L. C. (2009). Remote Sensing of Spider Mite Damage in California Peach Orchards. Int. J. Appl. Earth Observation Geoinformation 11, 244–255. doi:10.1016/j.jag.2009.03.002
Luo, M., and Lau, N. C. (2018). Increasing Heat Stress in Urban Areas of Eastern China: Acceleration by Urbanization. Geophys. Res. Lett. 45, 13060–13069. doi:10.1029/2018GL080306
Moran, P. A. P. (1948). The Interpretation of Statistical Maps. J. R. Stat. Soc. Ser. B Methodol. 10, 243–251. doi:10.1111/j.2517-6161.1948.tb00012.x
Moran, P. A. P. (1950). Notes on Continuous Stochastic Phenomena. Biometrika 37, 17–23. doi:10.1093/biomet/37.1-2.17
Myhre, G., Alterskjær, K., Stjern, C. W., Hodnebrog, Ø., Marelle, L., Samset, B. H., et al. (2019). Frequency of Extreme Precipitation Increases Extensively with Event Rareness under Global Warming. Sci. Rep. 9, 16063. doi:10.1038/s41598-019-52277-4
Ning, G., Luo, M., Zhang, W., Liu, Z., Wang, S., and Gao, T. (2022). Rising Risks of Compound Extreme Heat‐precipitation Events in China. Intl J. Climatol. doi:10.1002/joc.7561
Perkins, S. E., Alexander, L. V., and Nairn, J. R. (2012). Increasing Frequency, Intensity and Duration of Observed Global Heatwaves and Warm Spells. Geophys. Res. Lett. 39, L20714. doi:10.1029/2012GL053361
Perkins-Kirkpatrick, S. E., and Lewis, S. C. (2020). Increasing Trends in Regional Heatwaves. Nat. Commun. 11, 3357. doi:10.1038/s41467-020-16970-7
Ren, G., Ren, Y., Zhan, Y., Sun, X., Liu, Y., Chen, Y., et al. (2015). Spatial and Temporal Patterns of Precipitation Variability over Mainland China: II: Recent Trends. Adv. Water Sci. 26, 451–465. doi:10.14042/j.cnki.32.1309.2015.04.001
Ren, G., Liu, Y., Sun, X., Zhang, L., Ren, Y., Xu, Y., et al. (2016). Spatial and Temporal Patterns of Precipitation Variability Over Mainland China: Ⅲ: Causes for Recent Trends. Adv. Water Sci. 27 (3), 327–348. doi:10.14042/j.cnki.32.1309.2016.03.001
Rogelj, J., den Elzen, M., Höhne, N., Fransen, T., Fekete, H., Winkler, H., et al. (2016). Paris Agreement Climate Proposals Need a Boost to Keep Warming Well below 2 °C. Nature 534, 631–639. doi:10.1038/nature18307
Schiermeier, Q. (2019). Climate Change Made Europe's Mega-Heatwave Five Times More Likely. Nature 571, 155. doi:10.1038/d41586-019-02071-z
Shiogama, H., Fujimori, S., Hasegawa, T., Takahashi, K., Kameyama, Y., and Emori, S. (2021). How Many Hot Days and Heavy Precipitation Days Will Grandchildren Experience that Break the Records Set in Their Grandparents' Lives? Environ. Res. Commun. 3, 061002. doi:10.1088/2515-7620/ac0395
Shouting, G., Yushu, Z., and Lingkun, R. (2018). A Review on the Formation Mechanisms and Forecast Methods for Torrential Rain in China. Chin. J. Atmos. Sci. 42, 833–846. doi:10.3878/j.issn.1006-9895.1802.17277
Shuai, Y., and Shou-Ting, G. (2006). Modified Richardson Number in Non-uniform Saturated Moist Flow. Chin. Phys. Lett. 23, 3003–3006. doi:10.1088/0256-307x/23/11/033
Shuai, Y., Xiaopeng, C., and Lingkun, R. (2009). Analyses of Dry Intrusion and Instability during a Heavy Rainfall Event that Occurred in Northern China. Atmos. Ocean. Sci. Lett. 2, 108–112. doi:10.1080/16742834.2009.11446779
Stull, R. (2011). Wet-Bulb Temperature from Relative Humidity and Air Temperature. J. Appl. Meteorol. Climatol. 50, 2267–2269. doi:10.1175/JAMC-D-11-0143.1
Vicedo-Cabrera, A. M., Scovronick, N., Sera, F., Royé, D., Schneider, R., Tobias, A., et al. (2021). The Burden of Heat-Related Mortality Attributable to Recent Human-Induced Climate Change. Nat. Clim. Chang. 11, 492–500. doi:10.1038/s41558-021-01058-x
Wahl, T., Jain, S., Bender, J., Meyers, S. D., and Luther, M. E. (2015). Increasing Risk of Compound Flooding from Storm Surge and Rainfall for Major US Cities. Nat. Clim. Change 5, 1093–1097. doi:10.1038/nclimate2736
Wang, L., Yang, Z., Gu, X., and Li, J. (2020). Linkages between Tropical Cyclones and Extreme Precipitation over China and the Role of ENSO. Int. J. Disaster Risk Sci. 11, 538–553. doi:10.1007/s13753-020-00285-8
Wang, J., Chen, F., Doan, Q.-V., and Xu, Y. (2021). Exploring the Effect of Urbanization on Hourly Extreme Rainfall over Yangtze River Delta of China. Urban Clim. 36, 100781. doi:10.1016/j.uclim.2021.100781
Wold, S., Sjöström, M., and Eriksson, L. (2001). PLS-regression: a Basic Tool of Chemometrics. Chemom. Intelligent Laboratory Syst. 58, 109–130. doi:10.1016/S0169-7439(01)00155-1
Wu, S., Chan, T. O., Zhang, W., Ning, G., Wang, P., Tong, X., et al. (2021). Increasing Compound Heat and Precipitation Extremes Elevated by Urbanization in South China. Front. Earth Sci. 9, 475. doi:10.3389/feart.2021.636777
Xiao, M., Zhang, Q., Singh, V. P., and Chen, X. (2013). Regionalization-based Spatiotemporal Variations of Precipitation Regimes across China. Theor. Appl. Climatol. 114, 203–212. doi:10.1007/s00704-013-0832-1
Xu, W., Li, Q., Wang, X. L., Yang, S., Cao, L., and Feng, Y. (2013). Homogenization of Chinese Daily Surface Air Temperatures and Analysis of Trends in the Extreme Temperature Indices. J. Geophys. Res. Atmos. 118, 9708–9720. doi:10.1002/jgrd.50791
Yang, S., Gao, S., and Wang, D. (2007). Diagnostic Analyses of the Ageostrophic $\vec {Q}$ Vector in the Non-uniformly Saturated, Frictionless, and Moist Adiabatic Flow. J. Geophys. Res. 112, D09114. doi:10.1029/2006JD008142
You, J., and Wang, S. (2021). Higher Probability of Occurrence of Hotter and Shorter Heat Waves Followed by Heavy Rainfall. Geophys. Res. Lett. 48, e2021GL094831. doi:10.1029/2021GL094831
Yu, Z., Xiaopeng, C. U. I., and Shouting, G. A. O. (2011). A Study of Structure of Mesoscale Systems Producing a Heavy Rainfall Event in North China. Chin. J. Atmos. Sci. 35, 945–962.
Yu, X., Gu, X., Kong, D., Zhang, Q., Cao, Q., Slater, L. J., et al. (2022). Asymmetrical Shift toward Less Light and More Heavy Precipitation in an Urban Agglomeration of East China: Intensification by Urbanization. Geophys. Res. Lett. 49, e2021GL097046. doi:10.1029/2021GL097046
Zhang, J., and Lin, Z. (1985). Climate in China. Shanghai: Shanghai Scientifc and Technical Publishers. (in Chinese).
Zhang, W., and Villarini, G. (2020). Deadly Compound Heat Stress‐Flooding Hazard across the Central United States. Geophys. Res. Lett. 47, e2020GL089185. doi:10.1029/2020GL089185
Zhang, W., and Zhou, T. (2020). Increasing Impacts from Extreme Precipitation on Population over China with Global Warming. Sci. Bull. 65, 243–252. doi:10.1016/j.scib.2019.12.002
Zhang, Q., Singh, V. P., Li, J., and Chen, X. (2011). Analysis of the Periods of Maximum Consecutive Wet Days in China. J. Geophys. Res. 116, D23106. doi:10.1029/2011JD016088
Zhang, Q., Gu, X., Shi, P., and Singh, V. P. (2017). Impact of Tropical Cyclones on Flood Risk in Southeastern China: Spatial Patterns, Causes and Implications. Glob. Planet. Change 150, 81–93. doi:10.1016/j.gloplacha.2017.02.004
Keywords: heatwaves, heavy precipitation, lagged concurrent extremes, spatial clustering, China
Citation: Li C, Min R, Gu X, Gulakhmadov A, Luo S, Liu R, Slater LJ, Xie F, Kong D, Liu J and Li Y (2022) Substantial Increase in Heavy Precipitation Events Preceded by Moist Heatwaves Over China During 1961–2019. Front. Environ. Sci. 10:951392. doi: 10.3389/fenvs.2022.951392
Received: 23 May 2022; Accepted: 08 June 2022;
Published: 05 July 2022.
Edited by:
Zengyun Hu, Chinese Academy of Sciences (CAS), ChinaReviewed by:
Peng Sun, Anhui Normal University, ChinaJunqiang Yao, China Meteorological Administration, China
Copyright © 2022 Li, Min, Gu, Gulakhmadov, Luo, Liu, Slater, Xie, Kong, Liu and Li. This is an open-access article distributed under the terms of the Creative Commons Attribution License (CC BY). The use, distribution or reproduction in other forums is permitted, provided the original author(s) and the copyright owner(s) are credited and that the original publication in this journal is cited, in accordance with accepted academic practice. No use, distribution or reproduction is permitted which does not comply with these terms.
*Correspondence: Xihui Gu, Z3V4aEBjdWcuZWR1LmNu; Fenghua Xie, eGZoNTU3N0AxMjYuY29t