 Liudan Jiao
 Fengyan Wu
 Yu Zhang
 Xiaosen Huo
95% of researchers rate our articles as excellent or good
Learn more about the work of our research integrity team to safeguard the quality of each article we publish.
Find out more
ORIGINAL RESEARCH article
Front. Environ. Sci. , 22 July 2022
Sec. Environmental Systems Engineering
Volume 10 - 2022 | https://doi.org/10.3389/fenvs.2022.950562
This article is part of the Research Topic Sustainable Construction for Coordinated Urban-Rural Development View all 4 articles
China’s transportation sector suffers from excessive energy consumption and serious pollutant emissions. There is increasing pressure to improve energy and environmental efficiency (EEE). This paper researches the EEE of transportation systems in 255 Chinese cities from 2015 to 2019 with the assistance of the super-efficiency SBM model. Research results show that the five-year average EEE of the Chinese transportation system is 0.4420, indicating an overall low performance, with most regions still needing improvement. There are significant differences in the transportation system EEE between cities, with Guangzhou, Maoming, and Zhoushan ranking in the top three, and Heihe, Xining, and Taiyuan in the bottom. Cities with a better economic base, developed water systems and more relevant policy documents do better in energy use and environmental protection compared to other cities. Moreover, the development of the transportation systems is uneven, with noticeable regional differences. The general trend is that cities located in the eastern have better transportation systems EEE than cities in other economic zones. The findings should have a far-reaching impact on the sustainable development of cities. It also provides an essential reference for the research on EEE efficiency of transportation systems in China and other countries.
Economic globalization promotes the continuous economic growth of all countries in the world (Patel and Rietveld, 2021). Since the “reform and opening up” policy was launched in 1978, China’s economy has developed rapidly (Fan et al., 2019; Yang et al., 2019). However, rapid economic growth has resulted in the cost of high energy consumption and high pollution emissions (Kurniawan et al., 2021; Xiong and Xu, 2021). Chinese energy use is much higher than developed countries and the world average (Chen et al., 2018; Koondhar et al., 2021). Among all industries, transportation has the highest energy consumption and environmental pollution (Chen et al., 2018; Zhao et al., 2022). The International Energy Agency (IEA) reported that in 2019, 24.46% of the world’s energy consumption was by the global transportation sector. This sector was the second-worst greenhouse gas emitter worldwide, accounting for 24.64% of global CO2 emissions (International Energy Agency, 2019). Similarly, the Chinese transportation industry is also facing colossal energy consumption problems. According to the “2020 China Energy Statistical Yearbook,” the total energy consumption of the transportation, warehousing, and postal industries has nearly doubled from 244.6 million tons of standard coal in 2009 to 439.09 million tons of standard coal in 2019. Massive energy consumption and pollution emissions have severely restricted China’s economic growth and sustainable social development (Zhang et al., 2020). The considerable transportation demand in the future will stimulate more infrastructure investment and energy consumption (Zhang et al., 2020; Zhu et al., 2020). Reducing energy consumption is of great significance to realising urban sustainable development goals.
In recent years, China’s energy consumption has continued to rise. The environmental quality is deteriorating and has become the focus of government and society. The “14th Five-Year Plan” Comprehensive Work Plan for Energy Conservation and Emission Reduction issued by the State Council proposes that by 2025, the national energy consumption per unit of GDP will be reduced by 13.5% compared with 2020. The emission of various pollutants will be strictly controlled. Although the Chinese government has implemented various policies and measures, the problems of China’s energy consumption and pollutant emissions are still prominent (Wei et al., 2021). Improving energy efficiency and reducing environmental pollution has become an urgent issue for the Chinese government and future economic development. In order to solve this problem, it is of great significance to investigate and study the energy and environmental efficiency of China’s transportation industry to obtain useful information and provide information for decision-makers seeking to improve the efficiency of the transportation industry and promote energy conservation and emission reduction.
The seriousness of the problem has attracted the attention of many scholars, and the energy consumption and environmental pollution problems of the transportation system have been studied from the national, provincial, and urban levels. At the national level, Cui and Li (2015) applied a virtual Frontier Data Envelopment Analysis model to empirically analyse the carbon efficiency of transportation in 15 countries from 2003 to 2010. Sonmez et al. (2017) used an artificial bee colony algorithm to estimate transportation energy demand in Turkey. Pinglin (2020) used an autoregressive distributed lag (ARDL) model to study the overall impact of taxes on energy efficiency in OECD countries. The study found that vehicle traffic taxes significantly improve energy efficiency in the long term. Wanke et al. (2020) used a robust Bayesian stochastic Frontier analysis method to study the sustainability efficiency of the Chinese transportation system. At the provincial level, some scholars study the efficiency of the transportation industry from the perspective of a single efficiency, and some scholars research the energy and environmental efficiency of the transportation system at the same time. Single efficiency studies include environmental efficiency, energy efficiency, CO2 emission efficiency, and transportation sustainability. For instance, Chang et al. (2013) used the non-radial SBM model to analyse the environmental efficiency of China’s transportation industry in 2009. Liu and Lin (2018) and Cui and Li (2014) studied the energy efficiency of China’s transportation industry. Zhao et al. (2022) used the EBM DEA model with undesirable outputs and the spatial Durbin model to evaluate China’s transportation sector carbon dioxide emissions efficiency and its influencing factors. And Tian et al. (2019), Stefaniec et al. (2020) evaluated the Chinese transportation system from sustainability.
Many scholars have evaluated the energy and environmental efficiency of the transportation system at the provincial level. Among them, Wang et al. (2013b) used the non-parametric method of range adjustment measure, Bi et al. (2014) and Ren et al. (2020). Wei et al. (2021) used the data envelopment analysis method. And Wu et al. (2016) studied the transportation system as a parallel system consisting of passenger and freight subsystems. At the city level, Chen et al. (2018) studied the transportation energy efficiency of 15 cities in the Yangtze River Delta region from 2009 to 2013. Wei et al. (2013) compared the transportation system efficiency of 34 cities in China in 2008. Meng et al. (2017) used an integrated life cycle approach to examine the energy efficiency of the urban transportation system in Xiamen, Fujian province, China.
To summarize the existing literature, although there have been many studies on the transportation system’s energy efficiency or environmental efficiency, few scholars have studied the transportation system’s energy and environmental efficiency (EEE) from the city level. However, China has a large number of cities. According to the Ministry of Housing and Urban-Rural Development of the People’s Republic of China, there are 687 cities in China in 2020. Cities with different resource endowments and socioeconomic conditions have different levels of infrastructure construction capability (Zhang and Qi, 2021). In China, cities are the basic units for implementing energy conservation and emission reduction policies (Liu et al., 2021). Therefore, studying the transportation system’s efficiency from the city level will help formulate relevant policies and implement corresponding measures according to the actual situation of different cities to improve energy efficiency and environmental efficiency.
This paper collects relevant data from 2015 to 2019 and uses the super-efficiency SBM model to evaluate and analyse the EEE of transportation systems in 255 cities in China. It contributes to the improvement of energy conservation, emission reduction, and environmental protection effects in each region to achieve sustainable development. The innovation and contribution of this paper compared with other references mainly lie in the following aspect. This is the first study that provides detailed city-by-city analyses aiming to evaluate energy and environmental efficiency in the transportation system at the city level. It highlights the importance of pursuing a balance of energy efficiency and environmental protection across all cities in the transportation system. The research findings will provide local governments with scientific and practical references for investigating policy implications, which contribute to the national energy-saving and environmental protection in transportation.
The rest of this article is organised as follows. Section 2 is the research method and introduces the super-efficiency SBM model. Section 3 illustrates the Research materials, including indicators and data. The empirical results and discussion are presented in Section 4. Finally, the conclusions and policy implications are discussed in Section 5.
The purpose of this research is to evaluate the EEE of transportation systems in Chinese different cities, and there are four main steps to achieve this goal. Firstly, establish an evaluation index system and collect data. Secondly, choose an evaluation method to evaluate the EEE of the transportation system, and make measurements for 255 cities in China. Thirdly, the measurement results and analysis. Finally, make conclusions and policy recommendations. The flowchart of the transportation systems’ EEE research framework is shown in Figure 1.
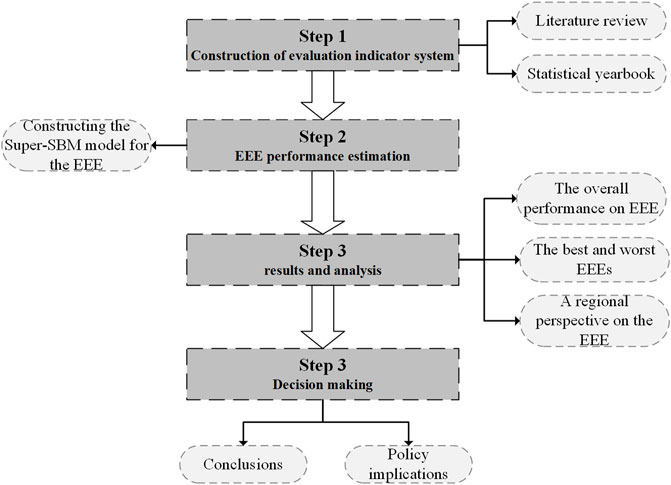
FIGURE 1. The flowchart of the transportation systems’ EEE research framework.
The existing literature for evaluating the efficiency of the transportation industry includes the Bayesian stochastic Frontier analysis method (Wanke et al., 2020), an energy-efficient model that combines output growth and energy-saving (Liu and Lin, 2018), scope-based Non-parametric methods to adjust measures (Wang et al., 2013b) and integrated lifecycle methods (Meng et al., 2017). However, the most frequently used method is data envelopment analysis (DEA), such as Zhao et al. (2022), Ren et al. (2020), Wei et al. (2021) and other scholars.
DEA is a non-parametric method with a multiple inputs and outputs analysis method for efficiency evaluation. This method does not need to assume the form of the production function and the setting of the weight of the indicators and the dimensionless processing of the data, so it can exclude the influence of many subjective factors and has strong objectivity (Chen et al., 2021). The traditional DEA models mainly include CCR and BCC (Cova-Alonso et al., 2020). These traditional DEA models cannot evaluate decision-making units with undesired outputs and only consider undesired outputs. Moreover, when the efficiency values of the decision-making units on the production front are all 1, the relative efficiency values cannot be ranked (Tone 2001). The processing methods for undesired output in the efficiency evaluation mainly include the directional distance function method, the input-output transposition method, and the forward attribute transformation method (Xu et al., 2020). However, these methods do not consider the influence of slack variables, and the evaluation results are often biased. Tone (2002) proposed a super-efficiency SBM model. It not only incorporates slack variables directly into the objective function to solve the input-output slack problem but also provides a framework for ranking efficient units. The SBM model considering undesired output solves the problem of efficiency evaluation with undesired output (Tone 2004).
This paper aims to calculate the EEE of the transportation system in Chinese cities, and undesirable outputs related to environmental pollutants need to be considered. Therefore, in order to more accurately measure the EEE of transportation systems, this paper introduces a super-efficiency SBM model that considers undesired outputs, including the following processes:
(1) First, define the input-output matrix. Suppose there are
(2) Second, define the production possibility set. According to the input-output matrix, the production possibility set (
The
(3) Finally, obtain the model for evaluating the transportation system EEE. According to the super-efficiency, SBM model considering undesired output proposed by Tone, the Fractional Programming Form of the Super-SBM model considering undesired outputs for evaluating the transportation system EEE of the
Where
The validity judgment theorem of the model is: if and only if
Selecting appropriate indicators is an essential step in evaluating the transportation system EEE. The factors that affect the transportation system are complex and involve many aspects. This article summarises the existing EEE papers and lays a theoretical foundation for constructing a reasonable and objective EEE evaluation index system for the transportation system. The inputs and outputs of previous studies are shown in Table 1.
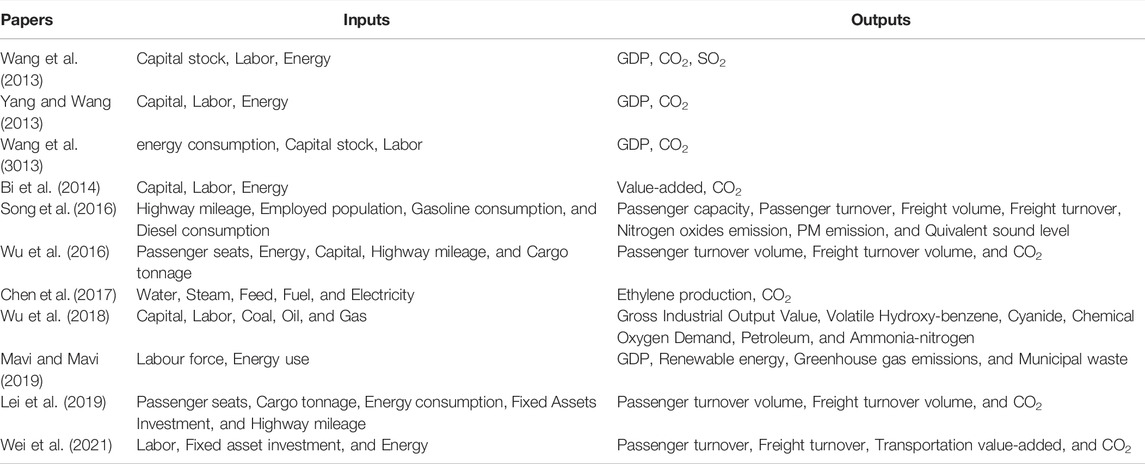
TABLE 1. The inputs and outputs of energy and environmental efficiency.
From Table 1, it can be seen that capital, Labor and energy are defined as the inputs in most papers measuring EEE. For outputs, many papers contain value-added and transportation capacity. In addition, indicators related to the environment are also included. Figure 2 proposes a framework for the input and output dimensions to evaluate the transportation system EEE.
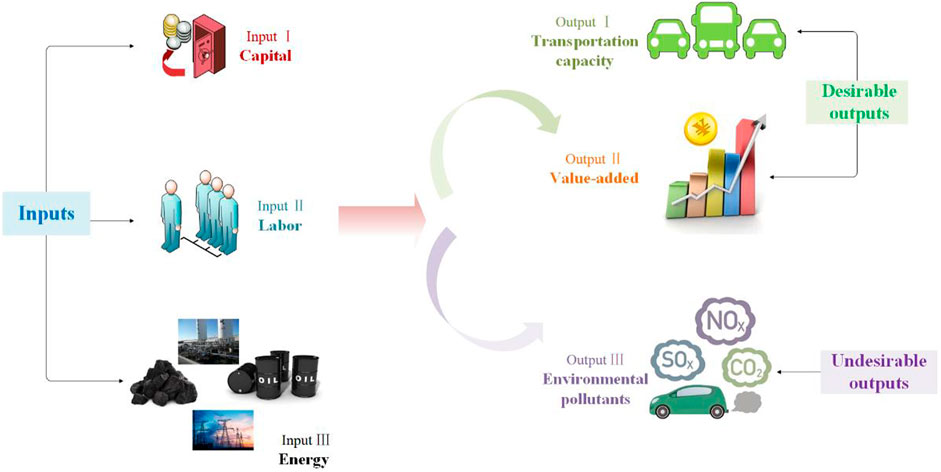
FIGURE 2. The input and output dimensions of the transportation system EEE.
In this paper, according to the common aspects of EEE in the transportation system and other fields, the inputs of the transportation system EEE are chosen from the dimensions of labour input, capital input, and energy input.
(1) Capital input: From the perspective of construction capacity, fixed asset investment can directly reflect the city’s investment and construction capacity in that year. As no official capital stock data exists for transportation sectors in China, this study uses fixed assets investment in urban service facilities as a representative indicator of capital stock (Chang et al., 2013; Li et al., 2016).
(2) Labor input: According to China’s Statistical Yearbooks, the transportation sector in China is defined to consist of transport, storage, and post. Wang and He (2017) also considered the transportation sector to consist of the transport, storage, and postal services industries. This paper considers traffic, transport, storage, and post persons employed as labor inputs.
(3) Energy input: The total energy consumption includes many types of energy, such as coal, oil, natural gas, and electricity (Bi et al., 2014). This paper collects three energy data: annual electricity consumption, total gas supply (coal gas, natural gas), and liquefied petroleum gas supply. Then, according to the reference coefficient of standard coal conversion for various energies given in the China Urban Statistical Yearbook, these energies are converted into the tonne coal equivalent (tce).
The output consists of two aspects: desirable outputs and undesired outputs. The desirable outputs include transportation capacity and value-added dimensions, and the undesired output is environmental pollutants.
(4) Transportation capacity: The main task of the urban transportation system is the transit of passengers and freight. The indicators passenger traffic and freight traffic are used to assess transportation capacity, reflecting the transportation services provided by the transportation system to society (Wei et al., 2013; Wei et al., 2021).
(5) Value-added: As Watanabe and Tanaka (2007), Chang et al. (2013) and Wei et al. (2021) suggested, this paper considers the transportation sector value-added to be the Gross Domestic Product of the sector. Since there is no data on the transportation sector value-added in the statistical unit at present, this study uses the GDP of each city multiplied by the ratio of the transportation sector in the current year to replace the value-added.
(6) Environmental pollutants: The primary source of urban air pollutants in China is automobile exhaust (Ministry of Environmental Protection of People’ s Republic of China, 2010). This paper uses the annual average concentrations of PM2.5, SO2, and NO2 to represent environmental indicators (Wei et al., 2013; Song et al., 2016; Wang et al., 2013a).
The main characteristics of the input-output indicators for evaluating the transportation system EEE are shown in Table 2.
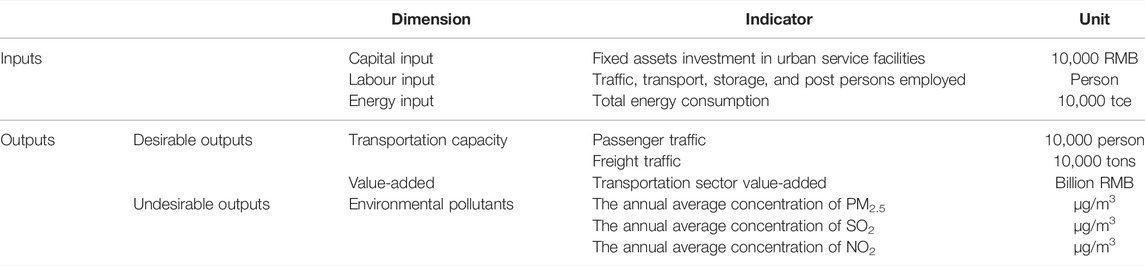
TABLE 2. EEE evaluation indicators of the transportation system.
There are 338 cities at the prefecture-level and above in China. Since some cities cannot provide complete relevant data, only 255 cities were selected as sample cities. The research object of this study is the transportation system of 255 cities in China, the research content is the transportation system EEE, and the research time is from 2015 to 2019. The capital input data comes from the Urban Construction Statistical Yearbook. Labor, energy, passenger, freight, and value-added data come from China Urban Statistical Yearbook. And environmental indicators come from statistics from various air quality networks. The number of the data is too large to include in the paper. Referring to the research of Bian et al. (2020) and Wu et al. (2019), in order to display the input-output indicators, one each of the input, desired output and undesired output indicators during the study period was selected, the annual average data was calculated by logarithm, and uses the scatter plots and box charts to show in Figure 3.
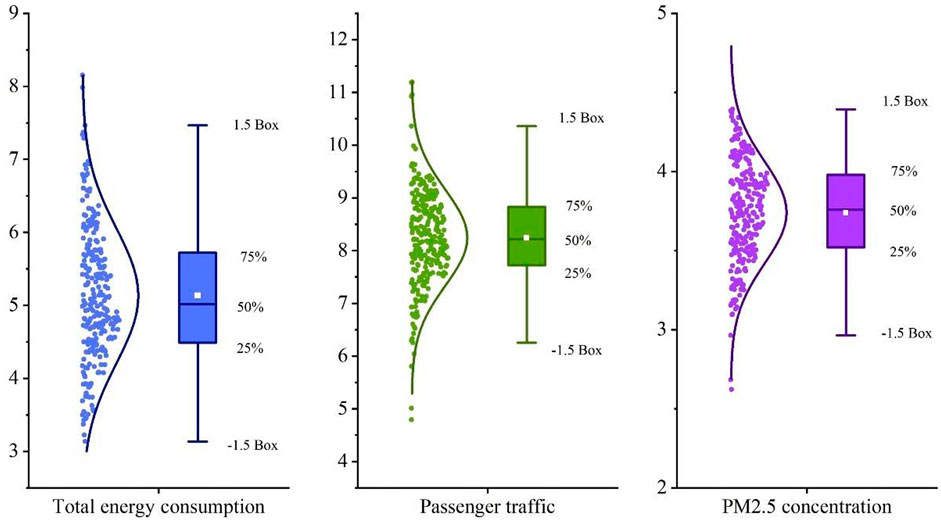
FIGURE 3. Scatter plots and box charts of the logarithms of the total energy consumption, Passenger traffic and PM2.5 concentration from 2015 to 2019 in the 255 Chinese cities.
Since some cities have the same English name, we add the abbreviation of the province name of the province where they are located after the city name with the same English name to distinguish them. For example, Suzhou City in Jiangsu Province and Suzhou City in Anhui Province are named Suzhou (JS) and Suzhou (AH), respectively. Considering the impact of inflation, the economic indicators (fixed assets investment in urban service facilities, transportation sector value-added) are all converted from the GDP index at constant prices to the data for the base period of 2015.
By applying the Super-SBM model described in Section 2 and the variables data described in Section 3, EEEs for transportation systems can be calculated with the computer program Max DEA 8. The EEE results of transportation systems in Chinese 255 cities from 2015 to 2019 are shown in Supplementary Appendix. Based on the annual average value of each city, the 255 cities are ranked in Supplementary Appendix. First, this section analyses the overall performance of the urban transportation system EEE. Then, the top three and bottom three cities in the EEE value of urban transportation system were analysed. Finally, it illustrates the regional differences in the urban transportation system EEE.
As shown in Figure 4, the EEE data in the Supplementary Appendix are plotted as a scatter distribution by year. The traffic system EEE values of 255 cities are divided into six groups, distinguished by different colours.
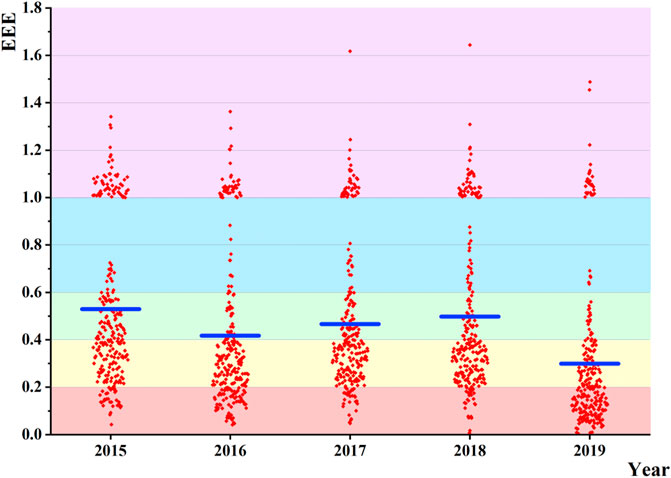
FIGURE 4. Scatter plot on the EEE values between 255 Chinese cities from 2015 to 2019.
Figure 4 shows that the number of cities among the six groups during the study period is significantly different. EEE values for transportation systems in most cities are 0–0.6. Judging from the average EEE value of the transportation system in the sample cities, the average value in 2015 is the highest. The average efficiency value in 2019 is the lowest, showing a trend of first rising and then falling. Combining with the Supplementary Appendix, it can be seen that the overall EEE value of the transportation system in Chinese cities is 0.4420, indicating that the overall EEE performance of the Chinese transportation system is low. There is still much room for improvement from the Frontier of production. It has a significant potential for energy conservation and emission reduction. Moreover, there are only ten cities with an EEE value greater than 1 during the entire survey period, which indicates that the transportation system EEE in most areas of China is low. This finding is consistent with that obtained in the studies by Ren et al. (2020) and Wu et al. (2016).
In 2019, the number of cities with a transportation system EEE value more excellent than one was smaller than in other years, indicating an overall decline in the national transportation system EEE performance during the survey period. However, this does not mean that the EEE of the transportation system in the city itself has not been improved. The eastern region has a more developed economy and a higher level of technology. Energy utilization and environmental protection have improved, and efficiency has improved faster. The economic level of the central, western and northeastern regions is lower than that of the eastern region, and the growth rate of efficiency is slow. Therefore, the gap between cities is getting broader. Most cities have lower efficiency values, so the average efficiency value in 2019 is lower than in other years. From the Supplementary Appendix, we can see that the top ten cities in terms of average have a five-year efficiency value greater than 1, indicating that these cities have always been in a leading position in terms of energy utilization and environmental protection in transportation systems. As we all know, Beijing, Shanghai, Guangzhou, and Shenzhen are the four cities with the most substantial economic strength in mainland China (Deng et al., 2020). There is no doubt that these cities have strong financial support and government attention in terms of infrastructure construction, transportation capacity and environmental protection. This also confirms the reason mentioned above.
According to the EEE values in the Supplementary Appendix, Figure 5 shows the top three and bottom three cities in 2015–2019. Supplementary Appendix Table S1 shows that among the 255 cities, Guangzhou, Maoming, and Zhoushan are the top three in the transportation system EEE, respectively. These cities’ transportation system EEE values were all greater than one during the study period. These three cities were considered pioneer cities in energy utilization and environmental protection, setting an example for improving the EEE of transportation systems in other cities in China. In general, these three cities have some common characteristics.
(1) Economic advantages: Guangzhou, Maoming, and Zhoushan are all open cities along the eastern coast of China with relatively developed economies. They attach great importance to the development of the transportation industry and new energy. Guangzhou is the capital of Guangdong Province, one of the four major first-tier cities in China. It has the characteristics of a developed economy, advanced technology and convenient transportation (Yi et al., 2021). Yu et al. (2019) showed that the local emission control in Guangzhou contributed more to reducing SO2, NO2, PM2.5, and PM10 concentrations than the surrounding area emission control. Maoming is located on the coast of the South China Sea, in the Southwest of Guangdong Province, with rapid economic development (Lin and Kim, 2021). Zhoushan is a prefecture-level city under the jurisdiction of Zhejiang Province and one of the 27 cities in the central area of the Yangtze River Delta. It has always been known as the “back garden” of the Yangtze River Delta (Ma et al., 2020).
(2) Geographical advantages: The river systems in these three cities are developed, and the water area is vast, creating favourable conditions for the development of the water transportation industry. According to Zhoushan Daily, Zhoushan City is China’s first prefecture-level island city and strives to build the Zhoushan Islands into a commodity storage, transit, processing trade centre, and transportation service hub (Zhoushan Daily, 2018). Zhang and Grydehøj (2020) have pointed out that Zhoushan is the largest port service provider in the world and is becoming a major regional shipping route and hub.
(3) Policy documents: Many policy documents and regulations related to transportation and environmental protection have been promulgated. The good EEE performance of transportation systems is inseparable from the protection policies and measures implemented by the local governments. For example, the “Guangzhou New Energy Vehicle Development Work Plan (2017–2020)” encourages individuals and public institutions to use new energy vehicles. And the “Guangdong Provincial Air Pollution Prevention and Control Action Plan” proposes to control regional pollution. The target clarifies the annual average concentration of SO2 and NO.
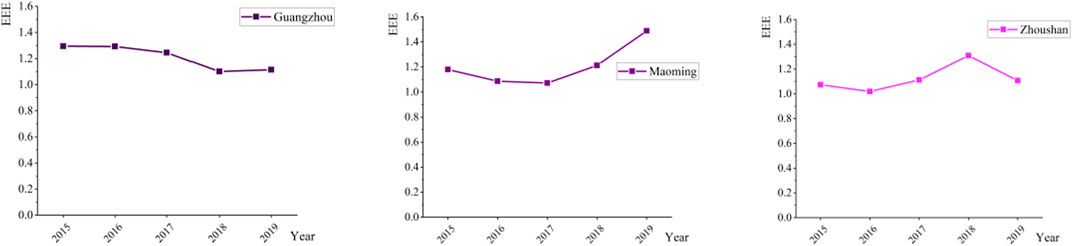
FIGURE 5. The top three cities in the EEEs from 2015 to 2019.
However, Supplementary Appendix indicates that many cities have poor transportation system EEE performance. As shown in Figure 6, the three cities with the lowest transportation system EEE values are Heihe, Xining, and Taiyuan. Their poor performance can be due to a variety of reasons. Mikhailova and Wu (2016) pointed out that Heihe City in Heilongjiang Province is part of several backward regions in Northeast China with an underdeveloped economy. Economic backwardness has led to insufficient investment in constructing transportation infrastructure in Heihe. China’s economic development model is extensive, resulting in ecological and environmental problems such as PM2.5 pollution in many cities (Zhang et al., 2019; Bian et al., 2020). Hu et al. (2020) showed that Xining City, located in the northeastern Qinghai-Tibet Plateau, was heavily polluted. With the rapid development of the social economy, Xining has become the most populous city on the Qinghai-Tibet Plateau (Gao et al., 2019). However, according to Xining City’s “13th Five-Year Plan” for the Development of Highway Transportation, Xining City’s current comprehensive transportation capacity and management level are not high, and the service depth is insufficient. The development of the industry is extensive, the green construction of informatisation is lagging, and the level of sharing and development and utilization of transportation information resources is low. Xining City’s “13th Five-Year Plan for Comprehensive Transportation Development” proposes to promote the integrated development of civil aviation, railways, highways, and municipal transportation to create a national comprehensive transportation hub city (http://plandb.cn/plan/1416). Taiyuan is significant energy, chemical, and heavy industry base in China. It has suffered severe air pollution over the past 20 years due to the excessive use of coal. The situation is not optimistic (Yan et al., 2017; Qi et al., 2021).
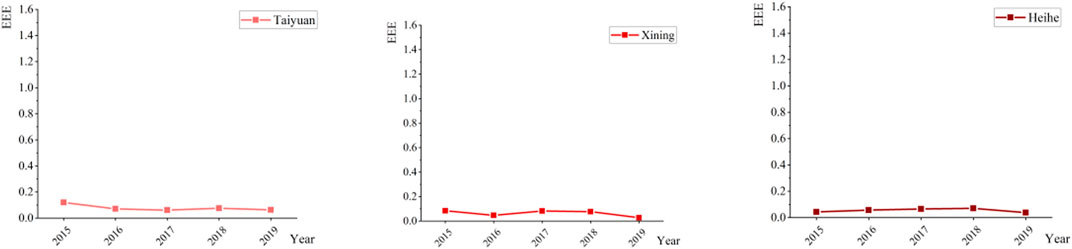
FIGURE 6. The bottom three cities in the EEEs from 2015 to 2019.
The EEE of China’s transportation system is generally low, and there are noticeable regional differences. In order to facilitate analysis and comparison, as shown in Figure 7, under the guidance of China’s National Bureau of Statistics (2020), the provinces where the cities are located are divided into four economic zones: eastern, central, western and northeastern (Wei et al., 2021).
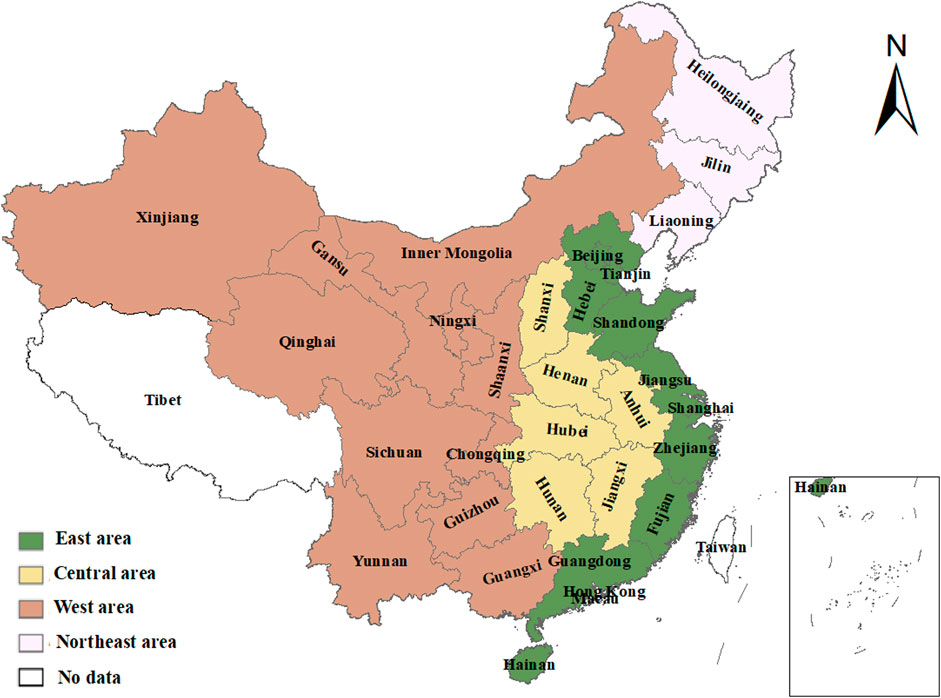
FIGURE 7. The division of economic zones in mainland China.
In order to better reflect the spatial distribution and geographical location characteristics of the transportation system EEEs of 255 cities, Figure 8 shows the spatial distribution of transportation system EEEs from 2015 to 2019. Cities are divided into five categories based on the distribution of transportation system EEE values. The five-year average EEE values of the transportation systems in the eastern, central, western and northeastern regions were 0.4963, 0.4380, 0.4175, and 0.3631, respectively, showing a distinct ladder-like distribution, with the east having the highest, followed by the central, western, and then the northeast. Wu et al. (2016) and Lei et al. (2019) also have similar findings.
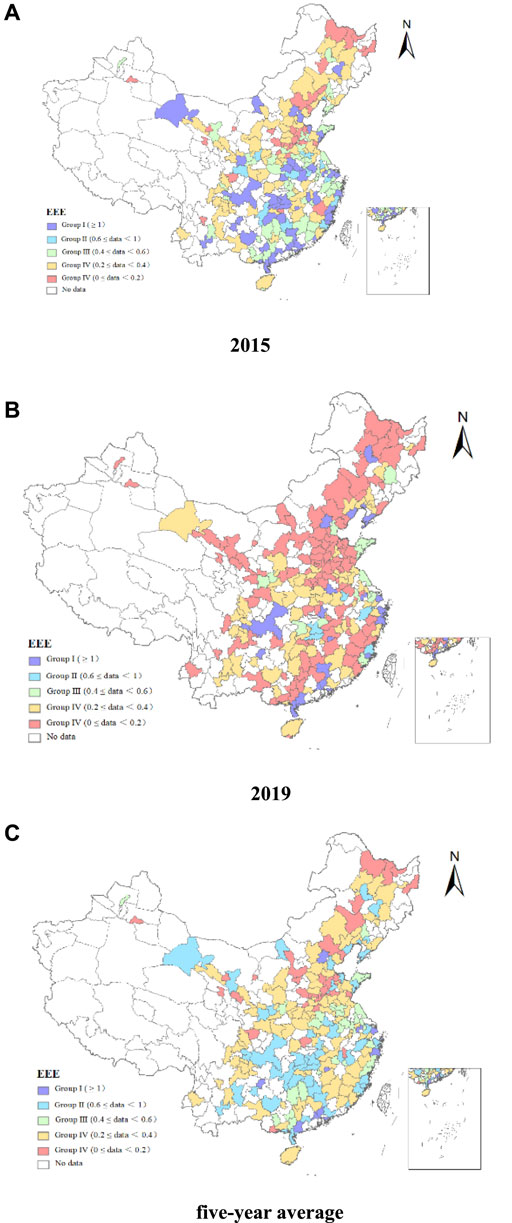
FIGURE 8. Regional differences of the EEE from 2015-2019 (Subgraph a is the 2015 transportation system EEE value, subgraph b is the 2019 transportation system EEE value, and subgraph c is the five-year average transportation system EEE value).
As shown in subfigure of Figure 8A, among the groups with the EEE value of the transportation system more significant than 1 in 2015, the number of cities in the central and western regions is relatively large. These cities may benefit from China’s “Western Development” policy implemented in 2000, which uses the remaining economic development capacity of the eastern coastal areas to improve the western region’s economic and social development level. However, with the development over time, the number of cities with EEE values greater than 1 in the central and western regions gradually decreases. It is commonly appreciated that these cities have underdeveloped economies, low levels of transportation infrastructure and limited investment in addressing pollution (Yuan and Zhang, 2015; Zhao et al., 2018). From subfigure in Figure 8B, the purple area in 2019 is also the cities with EEE efficiency values greater than 1, basically distributed along the eastern coast. This shows that the regional differences are becoming more and more serious, showing a trend that the east is getting better and the other regions are getting worse.
In general, cities with a transportation system EEE value greater than 1 are mainly concentrated in the eastern region, such as Guangzhou, Beijing, and Shanghai. As shown from the Supplementary Appendix and the five-year average in Figure 8C, nine of the top ten cities in the five-year average transportation system EEE are located in the eastern economic zone. These cities have better economic foundations, advanced technology, and better management skills. Therefore, they can adopt policies and measures for pollution control and energy-saving, contributing to the transportation industry’s better and greener development. However, not all eastern coastal cities achieve high EEE values. Taking Binzhou as an example, the five-year average EEE of its transportation system is only 0.1060. In addition, there are also Shaoxing, Sanya, Binzhou, and other eastern coastal cities with low EEE values.
China has become the world’s largest energy consumer and polluter. The transportation industry is high energy consumption and high pollutant emissions industry in China, and measuring its EEE is of great significance to the sustainable development of China and the world. This study takes the transportation system of 255 prefecture-level cities in mainland China as the research object and studies the EEE of the transportation system from 2015 to 2019 with the help of the undesired output Super-SBM model. The main conclusions of this paper are summarised as follows:
(1) During the study period, the average EEE of the transportation system in Chinese cities was 0.4420, indicating that the overall EEE performance of the Chinese transportation system was low. Only ten cities with an EEE value greater than 1 during the entire survey period, indicating that the transportation system EEE in most parts of China is low.
(2) The empirical results show significant differences in the EEE of transportation systems between cities, with Guangzhou, Maoming, and Zhoushan ranking in the top three and Heihe, Xining, and Taiyuan at the bottom.
(3) There are noticeable regional differences in the EEE values of transportation systems in Chinese cities. The mean value of EEE of the transportation system in the four economic zones has an evident ladder-like distribution. The east has the highest, followed by the central, western, and northeast.
According to the above empirical results and conclusions, improving the EEE of the transportation system in mainland Chinese cities can start from the following aspects:
(1) The low EEE value of the Chinese transportation system indicates that the Chinese government should pay more attention to the energy consumption of the transportation industry and the construction of green transportation. Transportation system EEE efficiency can be improved through targeted policies and measures. For example, increase investment in the research and development of low-carbon and energy-saving technologies in the transportation industry, encourage new energy vehicles, develop public transportation and other measures, and implement policies such as corresponding financial subsidies and tax incentives. Strive for more urban transportation systems to achieve energy saving and environmental protection.
(2) Through the analysis, we can conclude that the traffic structure and management measures significantly impact the EEE of transportation. Thus, the focus of the development of the transportation industry should be designated according to the characteristics of the city. For example, coastal cities such as Guangzhou, Zhoushan, and Shanghai should fully use low cost and low energy consumption to develop waterway transportation vigorously. For the inland areas of the central and western regions, the traffic management departments should promote light vehicles with low energy consumption auxiliary equipment, eliminate the old transportation system with high energy consumption and high emission, and improve the operation level and efficiency of the transportation system. Thereby narrowing the EEE gap in the transportation system between cities.
(3) Due to the significant differences in the EEE of the transportation system among the four economic regions, local governments need to formulate differentiated energy and environmental strategies. First of all, the eastern region, with rapid economic and technological development, should pay more attention to improving the management efficiency of the transportation industry while developing transportation. Other regions with relatively backward development, such as the central and western regions, can improve the technical level and strengthen transportation practitioners’ technical training. Technological progress has always been the fundamental measure to achieving energy conservation and emission reduction (Liu and Lin, 2018). Second, the central government should encourage local governments to carry out technology transfer and experience sharing and strengthen inter-regional cooperation and exchanges in the transportation industry. So that the regions with low EEE can learn the experience of transportation management and pollution prevention technology from the regions with high efficiencies, such as the eastern region, and finally realise the balanced development of the national transportation industry.
Finally, this study has some limitations: 1) Due to the lack of data, and some cities cannot be included in the scope of the study. 2) Input-output indicators can be further improved. For example, it will be better for research if it can include CO2 in environmental indicators. 3) This study only compares the EEE of transportation systems in Chinese cities. If the data includes other countries, it may provide more information on the level of the transport sector.
The original contributions presented in the study are included in the article/Supplementary Material, further inquiries can be directed to the corresponding author.
All authors listed have made a substantial, direct, and intellectual contribution to the work and approved it for publication.
This research was funded by the National Natural Science Foundation of China (Grant Nos. 71901043 and 72004187) and the Chongqing Municipal Education Commission Project (Grant No. KJQN201900713).
The authors declare that the research was conducted in the absence of any commercial or financial relationships that could be construed as a potential conflict of interest.
The handling editor CS declared a past co-authorship with the authors LJ, YZ, and YW.
All claims expressed in this article are solely those of the authors and do not necessarily represent those of their affiliated organizations, or those of the publisher, the editors and the reviewers. Any product that may be evaluated in this article, or claim that may be made by its manufacturer, is not guaranteed or endorsed by the publisher.
The Supplementary Material for this article can be found online at: https://www.frontiersin.org/articles/10.3389/fenvs.2022.950562/full#supplementary-material
Bi, G., Wang, P., Yang, F., and Liang, L. (2014). Energy and Environmental Efficiency of China's Transportation Sector: A Multidirectional Analysis Approach. Math. Problems Eng. 2014, 1–12. doi:10.1155/2014/539596
Bian, J., Zhang, Y., Shuai, C., Shen, L., Ren, H., and Wang, Y. (2020). Have Cities Effectively Improved Ecological Well-Being Performance? Empirical Analysis of 278 Chinese Cities. J. Clean. Prod. 245, 118913. doi:10.1016/j.jclepro.2019.118913
Chang, Y.-T., Zhang, N., Danao, D., and Zhang, N. (2013). Environmental Efficiency Analysis of Transportation System in china: a Non-radial Dea Approach. Energy Policy 58, 277–283. doi:10.1016/j.enpol.2013.03.011
Chen, K., Ren, X.-t., and Yang, G.-l. (2021). A Novel Approach for Assessing Academic Journals: Application of Integer DEA Model for Management Science and Operations Research Field. J. Inf. 15 (3), 101176. doi:10.1016/j.joi.2021.101176
Chen, X., Gao, Y., An, Q., Wang, Z., and Neralić, L. (2018). Energy Efficiency Measurement of Chinese Yangtze River Delta's Cities Transportation: a DEA Window Analysis Approach. Energy Effic. 11 (8), 1941–1953. doi:10.1007/s12053-018-9635-7
Chen, Y., Han, Y., and Zhu, Q. (2017). Energy and Environmental Efficiency Evaluation Based on a Novel Data Envelopment Analysis: An Application in Petrochemical Industries. Appl. Therm. Eng. 119, 156–164. doi:10.1016/j.applthermaleng.2017.03.051
Cova-Alonso, D.-J., Díaz-Hernández, J.-J., and Martínez-Budria, E. (2020). A Strong Efficiency Measure for CCR/BBC Models. Eur. J. Operational Res. 291 (1), 284–295.
Cui, Q., and Li, Y. (2015). An Empirical Study on the Influencing Factors of Transportation Carbon Efficiency: Evidences from Fifteen Countries. Appl. Energy 141, 209–217. doi:10.1016/j.apenergy.2014.12.040
Cui, Q., and Li, Y. (2014). The Evaluation of Transportation Energy Efficiency: An Application of Three-Stage Virtual Frontier DEA. Transp. Res. Part D Transp. Environ. 29, 1–11. doi:10.1016/j.trd.2014.03.007
Deng, Z., Zhang, Y., and Yu, A. (2020). The New Economy in China: An Intercity Comparison. SAGE Open 10 (4), 215824402097787. doi:10.1177/2158244020977870
Fan, Y., Fang, C., and Zhang, Q. (2019). Coupling Coordinated Development between Social Economy and Ecological Environment in Chinese Provincial Capital Cities-Assessment and Policy Implications. J. Clean. Prod. 229, 289–298. doi:10.1016/j.jclepro.2019.05.027
Gao, Z., Zhang, H., Yang, X., and Song, Z. (2019). Assessing the Impacts of Ecological-Living-Productive Land Changes on Eco-Environmental Quality in Xining City on Qinghai-Tibet Plateau, China. Sci. Cold Arid. Reg. 11, 194–207. doi:10.3724/SP.J.1226.2019.00194
Hu, X., Yin, Y., Duan, L., Wang, H., Song, W., and Xiu, G. (2020). Temporal and Spatial Variation of PM2.5 in Xining, Northeast of the Qinghai-Xizang (Tibet) Plateau. Atmosphere 11 (9), 953. doi:10.3390/atmos11090953
International Energy Agency (2019). Data, Data Browser, Explore Energy Data by Category, Indicator, Country or Region. Countries & Regions - IEA.
Koondhar, M. A., Shahbaz, M., Ozturk, I., Randhawa, A. A., and Kong, R. (2021). Revisiting the Relationship between Carbon Emission, Renewable Energy Consumption, Forestry, and Agricultural Financial Development for China. Environ. Sci. Pollut. Res. 28 (33), 45459–45473. doi:10.1007/s11356-021-13606-1
Kurniawan, R., Sugiawan, Y., and Managi, S. (2021). Economic Growth - Environment Nexus: An Analysis Based on Natural Capital Component of Inclusive Wealth. Ecol. Indic. 120, 106982. doi:10.1016/j.ecolind.2020.106982
Lei, X., Li, L., Zhang, X., Dai, Q., and Fu, Y. (2019). A Novel Ratio-Based Parallel DEA Approach for Evaluating the Energy and Environmental Performance of Chinese Transportation Sectors. J. Syst. Sci. Syst. Eng. 0, 1–15. doi:10.1007/s11518-019-5416-x
Li, T., Yang, W., Zhang, H., and Cao, X. (2016). Evaluating the Impact of Transport Investment on the Efficiency of Regional Integrated Transport Systems in China. Transp. Policy 45, 66–76. doi:10.1016/j.tranpol.2015.09.005
Lin, J.-Z., and Kim, H.-H. (2021). An Economy Efficiency Analysis of Non Pearl River Delta Region and Nearby Cities in Guangdong of China. Turkish J. Comput. Math. Educ. 12 (13), 6162–6168.
Liu, Q., Wu, S., Lei, Y., Li, S., and Li, L. (2021). Exploring Spatial Characteristics of City-Level CO2 Emissions in China and Their Influencing Factors from Global and Local Perspectives. Sci. Total Environ. 754, 142206. doi:10.1016/j.scitotenv.2020.142206
Liu, W., and Lin, B. (2018). Analysis of Energy Efficiency and its Influencing Factors in China's Transport Sector. J. Clean. Prod. 170, 674–682. doi:10.1016/j.jclepro.2017.09.052
Ma, X., de Jong, M., Sun, B., and Bao, X. (2020). Nouveauté or Cliché? Assessment on Island Ecological Vulnerability to Tourism: Application to Zhoushan, China. Ecol. Indic. 113, 106247. doi:10.1016/j.ecolind.2020.106247
Mavi, N. K., and Mavi, R. K. (2019). Energy and Environmental Efficiency of OECD Countries in the Context of the Circular Economy: Common Weight Analysis for Malmquist Productivity Index. J. Environ. Manag. 247, 651–661. doi:10.1016/j.jenvman.2019.06.069
Meng, F., Liu, G., Yang, Z., Casazza, M., Cui, S., and Ulgiati, S. (2017). Energy Efficiency of Urban Transportation System in Xiamen, China. An Integrated Approach. Appl. Energy 186, 234–248. doi:10.1016/j.apenergy.2016.02.055
Mikhailova, E., and Wu, C.-T. (2016). Ersatz Twin City Formation? the Case of Blagoveshchensk and Heihe. J. Borderl. Stud. 32 (4), 513–533. doi:10.1080/08865655.2016.1222878
Ministry of Environmental Protection of People’s Republic of China (2010). China Motor Vehicle Pollution Prevention Annual Report. Beijing: Chinese Ministry of Environmental Protection.
National Bureau of Statistics (2020). Statistical System and Classification Standards. Available at: http://www.stats.gov.cn/tjzs/cjwtjd/201308/t20130829_74318.html (accessed June 19, 2020).
Patel, P. C., and Rietveld, C. A. (2021). Does Globalisation Affect Perceptions about Entrepreneurship? the Role of Economic Development. Small Bus. Econ. 58, 1545–1562. doi:10.1007/s11187-021-00455-y
Pinglin (2020). Used an Autoregressive Distributed Lag (ARDL) Model to Study the Overall Impact of Taxes on Energy Efficiency in OECD Countries. The Study Found that Vehicle Traffic Taxes Significantly Improve Energy Efficiency in the Long Term.
Qi, M., Wang, L., Ma, S., Zhao, L., Lu, X., Liu, Y., et al. (2021). Evaluation of PM2.5 Fluxes in the “2+26” Cities: Transport Pathways and Intercity Contributions. Atmos. Pollut. Res. 12 (5), 101048. doi:10.1016/j.apr.2021.03.011
Ren, J., Gao, B., Zhang, J., and Chen, C. (2020). Measuring the Energy and Carbon Emission Efficiency of Regional Transportation Systems in China: Chance-Constrained DEA Models. Math. Problems Eng. 2020, 1–12. doi:10.1155/2020/9740704
Song, M., Zheng, W., and Wang, Z. (2016). Environmental Efficiency and Energy Consumption of Highway Transportation Systems in China. Int. J. Prod. Econ. 181, 441–449. doi:10.1016/j.ijpe.2015.09.030
Sonmez, M., Akgüngör, A. P., and Bektaş, S. (2017). Estimating Transportation Energy Demand in Turkey Using the Artificial Bee Colony Algorithm. Energy 122, 301–310. doi:10.1016/j.energy.2017.01.074
Stefaniec, A., Hosseini, K., Xie, J., and Li, Y. (2020). Sustainability Assessment of Inland Transportation in China: A Triple Bottom Line-Based Network DEA Approach. Transp. Res. Part D Transp. Environ. 80, 102258. doi:10.1016/j.trd.2020.102258
Tian, N., Tang, S., Che, A., and Wu, P. (2019). Measuring Regional Transport Sustainability Using Super-efficiency SBM-DEA with Weighting Preference. J. Clean. Prod. 242, 118474.
Tone, K. (2001). A Slacks-Based Measure of Efficiency in Data Envelopment Analysis. Eur. J. Operational Res. 130 (3), 498–509. doi:10.1016/s0377-2217(99)00407-5
Tone, K. (2002). A Slacks-Based Measure of Super-efficiency in Data Envelopment Analysis. Eur. J. Operational Res. 143 (1), 32–41. doi:10.1016/s0377-2217(01)00324-1
Tone, K. (2004). Dealing with Undesirable Outputs in DEA: A Slacks-Based Measure (SBM) Approach. Toronto: Presentation at NAPW III.
Wang, K., Lu, B., and Wei, Y.-M. (2013b). China's Regional Energy and Environmental Efficiency: A Range-Adjusted Measure Based Analysis. Appl. Energy 112, 1403–1415. doi:10.1016/j.apenergy.2013.04.021
Wang, K., Yu, S., and Zhang, W. (2013a). China’s Regional Energy and Environmental Efficiency: A DEA Window Analysis Based Dynamic Evaluation. Math. Comput. Model. 58 (5-6), 1117–1127. doi:10.1016/j.mcm.2011.11.067
Wang, Z., and He, W. (2017). CO2 Emissions Efficiency and Marginal Abatement Costs of the Regional Transportation Sectors in China. Transp. Res. Part D Transp. Environ. 50, 83–97. doi:10.1016/j.trd.2016.10.004
Wanke, P., Chen, Z., Zheng, X., and Antunes, J. (2020). Sustainability Efficiency and Carbon Inequality of the Chinese Transportation System: A Robust Bayesian Stochastic Frontier Analysis. J. Environ. Manag. 260, 110163. doi:10.1016/j.jenvman.2020.110163
Watanabe, M., and Tanaka, K. (2007). Efficiency Analysis of Chinese Industry: A Directional Distance Function Approach. Energy Policy 35 (12), 6323–6331. doi:10.1016/j.enpol.2007.07.013
Wei, F., Zhang, X., Chu, J., Yang, F., and Yuan, Z. (2021). Energy and Environmental Efficiency of China's Transportation Sectors Considering CO2 Emission Uncertainty. Transp. Res. Part D Transp. Environ. 97, 102955. doi:10.1016/j.trd.2021.102955
Wei, J., Xia, W., Guo, X., and Marinova, D. (2013). Urban Transportation in Chinese Cities: An Efficiency Assessment. Transp. Res. Part D Transp. Environ. 23, 20–24. doi:10.1016/j.trd.2013.03.011
Wu, J., Li, M., Zhu, Q., Zhou, Z., and Liang, L. (2018). Energy and Environmental Efficiency Measurement of China’s Industrial Sectors: a DEA Model with Non-homogeneous Inputs and Outputs. Energy Econ. 78, 468–480. doi:10.1016/j.eneco.2018.11.036
Wu, J., Zhu, Q., Chu, J., Liu, H., and Liang, L. (2016). Measuring Energy and Environmental Efficiency of Transportation Systems in China Based on a Parallel DEA Approach. Transp. Res. Part D Transp. Environ. 48, 460–472. doi:10.1016/j.trd.2015.08.001
Wu, Y., Tam, V. W. Y., Shuai, C., Shen, L., Zhang, Y., and Liao, S. (2019). Decoupling China's Economic Growth from Carbon Emissions: Empirical Studies from 30 Chinese Provinces (2001-2015). Sci. Total Environ. 656, 576–588. doi:10.1016/j.scitotenv.2018.11.384
Xiong, J., and Xu, D. (2021). Relationship between Energy Consumption, Economic Growth and Environmental Pollution in China. Environ. Res. 194, 110718. doi:10.1016/j.envres.2021.110718
Xu, Y., Park, Y. S., Park, J. D., and Cho, W. (2020). Evaluating the Environmental Efficiency of the U.S. Airline Industry Using a Directional Distance Function DEA Approach. J. Manag. Anal. 8 (1), 1–18. doi:10.1080/23270012.2020.1832925
Yan, Y., He, Q., Guo, L., Li, H., Zhang, H., Shao, M., et al. (2017). Source Apportionment and Toxicity of Atmospheric Polycyclic Aromatic Hydrocarbons by PMF: Quantifying the Influence of Coal Usage in Taiyuan, China. Atmos. Res. 193, 50–59. doi:10.1016/j.atmosres.2017.04.001
Yang, L., and Wang, K.-L. (2013). Regional Differences of Environmental Efficiency of China’s Energy Utilisation and Environmental Regulation Cost Based on Provincial Panel Data and DEA Method. Math. Comput. Model. 58 (5-6), 1074–1083. doi:10.1016/j.mcm.2012.04.004
Yang, Y., Chen, L., Jia, F., and Xu, Z. (2019). Complementarity of Circular Economy Practices: an Empirical Analysis of Chinese Manufacturers. Int. J. Prod. Res. 57, 1–16. doi:10.1080/00207543.2019.1566664
Yi, P., Li, W., and Zhang, D. (2021). Sustainability Assessment and Key Factors Identification of First-Tier Cities in China. J. Clean. Prod. 281, 125369. doi:10.1016/j.jclepro.2020.125369
Yu, M., Zhu, Y., Lin, C.-J., Wang, S., Xing, J., Jang, C., et al. (2019). Effects of Air Pollution Control Measures on Air Quality Improvement in Guangzhou, China. J. Environ. Manag. 244, 127–137. doi:10.1016/j.jenvman.2019.05.046
Yuan, X. L., and Zhang, Y. S. (2015). Coupling Analysis to Infrastructure and Urbanisation Level in china. urban probl. 236 (3), 18–24. doi:10.13239/j.bjsshkxy.cswt.150303
Zhang, B., and Qi, P. (2021). Transportation Infrastructure, Innovation Capability, and Urban Economic Development. Transformations Bus. Econ. 3C, 526–545.
Zhang, H., and Grydehøj, A. (2020). Locating the Interstitial Island: Integration of Zhoushan Archipelago into the Yangtze River Delta Urban Agglomeration. Urban Stud. 58, 2157–2173. doi:10.1177/0042098020937987
Zhang, Y.-J., Jiang, L., and Shi, W. (2020). Exploring the Growth-Adjusted Energy-Emission Efficiency of Transportation Industry in China. Energy Econ. 90, 104873. doi:10.1016/j.eneco.2020.104873
Zhang, Y., Shen, L., Shuai, C., Bian, J., Zhu, M., Tan, Y., et al. (2019). How Is the Environmental Efficiency in the Process of Dramatic Economic Development in the Chinese Cities? Ecol. Indic. 98, 349–362. doi:10.1016/j.ecolind.2018.11.006
Zhao, P., Zeng, L., Li, P., Lu, H., Hu, H., Li, C., et al. (2022). China's Transportation Sector Carbon Dioxide Emissions Efficiency and its Influencing Factors Based on the EBM DEA Model with Undesirable Outputs and Spatial Durbin Model. Energy 238, 121934. doi:10.1016/j.energy.2021.121934
Zhao, S., Yu, Y., Yin, D., Qin, D., He, J., and Dong, L. (2018). Spatial Patterns and Temporal Variations of Six Criteria Air Pollutants during 2015 to 2017 in the City Clusters of Sichuan Basin, China. Sci. Total Environ. 624, 540–557. doi:10.1016/j.scitotenv.2017.12.172
Zhoushan Daily (2018). About Zhoushan Archipelago New Area. Zhoushan Daily. Available at: http://zhoushan.chinadaily.com.cn/2018-06/28/c_247171.htm. (Accessed June 28, 2018).
Keywords: transportation system, super-SBM model, energy efficiency, environmental efficiency, sustainable development
Citation: Jiao L, Wu F, Luo F, Zhang Y and Huo X (2022) Energy and Environmental Efficiency Evaluation of Transportation Systems in China’s 255 Cities. Front. Environ. Sci. 10:950562. doi: 10.3389/fenvs.2022.950562
Received: 23 May 2022; Accepted: 22 June 2022;
Published: 22 July 2022.
Edited by:
Chenyang Shuai, Chongqing University, ChinaReviewed by:
Jindao Chen, Guangzhou University, ChinaCopyright © 2022 Jiao, Wu, Luo, Zhang and Huo. This is an open-access article distributed under the terms of the Creative Commons Attribution License (CC BY). The use, distribution or reproduction in other forums is permitted, provided the original author(s) and the copyright owner(s) are credited and that the original publication in this journal is cited, in accordance with accepted academic practice. No use, distribution or reproduction is permitted which does not comply with these terms.
*Correspondence: Yu Zhang, eXV6aGFuZ0BjcWp0dS5lZHUuY24=
Disclaimer: All claims expressed in this article are solely those of the authors and do not necessarily represent those of their affiliated organizations, or those of the publisher, the editors and the reviewers. Any product that may be evaluated in this article or claim that may be made by its manufacturer is not guaranteed or endorsed by the publisher.
Research integrity at Frontiers
Learn more about the work of our research integrity team to safeguard the quality of each article we publish.