 Martin Neumann1*
 Petr Kavka1Jan Devátý1
 Jakub Stašek1
 Luděk Strouhal1Adam Tejkl1Romana Kubínová1
 Jesús Rodrigo-Comino2
- 1The Department of Landscape Water Conservation, Faculty of Civil Engineering, Czech Technical University in Prague, Prague, Czechia
- 2Departamento de Análisis Geográfico Regional y Geografía Física, Facultad de Filosofía y Letras, Campus Universitario de Cartuja, University of Granada, Granada, Spain
Soil erosion is recognized as a threat to humankind and to natural ecosystems when sustainable limits are exceeded. Several researchers have used various tools, such as rainfall simulators, to assess extreme rainfall events and non-sustainable soil management practices. However, combinations of two different devices of different sizes has not been tested before, especially in vineyards. The aim is to verify whether plot size, connectivity processes and rainfall distribution affect the activation of soil erosion. In this research on soils cultivated with vineyards in the Moravia Region in the south-eastern part of the Czech Republic, we have performed various rainfall simulation experiments with a small device (1 × 1 m) and with a large device (8 × 1 m). Our results show that the surface runoff was approximately 30% higher on the small plot than on the large plot. The large rainfall simulator produced sediment concentration that was up to 3 times higher, and soil loss that was up to 1.5 times higher, even when the surface runoff was 30%–50% lower for the large rainfall simulator. We therefore conclude that there is a clear influence of surface length and plot size on surface runoff, soil loss and sediment concentration activation. When planning their experiments, researchers need to consider that the type of device can have a drastic influence on the final results. Two devices subjected to the same rainfall intensity (60 mm h−1) can produce very different results, e.g., depending on plot size and kinetic energy. Our results can be effectively used to plan soil protection measures and to inform local authorities about areas prone to flooding and about loss of sediments.
1 Introduction
Soil erosion, especially in cultivated fields, is a big concern for humankind because it threatens soil fertility, food security and rural economies, and also biodiversity (Le Bissonnais et al., 2002; Boellstorff and Benito, 2005; Labrière et al., 2015). Several research groups have been working on new policies and strategies for preventing or mitigating unsustainable soil erosion rates (Boardman et al., 2003; Panagos et al., 2015b; Taguas and Gómez, 2015). Verheijen et al. (2009) defined the maximum limit of tolerable soil erosion as equal to soil formation of about 1.4 t ha−1 yr−1. Montgomery (2007) stated that conventionally managed agricultural fields (tillage, herbicides, bare soils, etc.) register an average of 1–2 orders of magnitude greater than the rates of soil production under native vegetation. Montgomery (2007) stated that these rates can reach as high as ≈1 mm yr−1. Recently, Rodríguez Sousa et al. (2019) estimated the Soil Loss Tolerance in olive orchards, and concluded that even with severe erosion and irrigation, these plantations may be viable for about 150 years with 0.41 t ha−1 yr−1. In China, several authors, e.g., Feng et al. (2018), demonstrated that adjusting the vegetation position along the slope could play a crucial role in surface runoff and soil erosion generation, but this is only effective when precipitation events are fully understood (Yu et al., 2022).
However, the real situation in cultivated fields varies significantly, and the soil erosion rates registered by recent studies are continually rising. The erosion rates are especially high in vineyards, in some cases reaching higher levels than for olives, almonds, citrus fruits and abandoned lands (Rodrigo-Comino, 2018). In traditional viticultural territories such as Spain (e.g., Martínez-Casanovas and Ramos, 2009; Ben-Salem et al., 2018; Mirás-Avalos et al., 2020), Italy (e.g., Napoli et al., 2017; Bagagiolo et al., 2018; Novara et al., 2019), France (e.g., Blavet et al., 2009; Morvan et al., 2014; Quiquerez et al., 2014) and Germany (Hacisalihoglu, 2007), researchers have been registering dramatic erosion rates, with the use of methods such as in situ measurements and experiments, modelling and monitoring. However, some new advances related to the use of cover crops (Marques et al., 2020; Novara et al., 2021), reduction of tillage practices (Arnaez et al., 2007; Lieskovský and Kenderessy, 2014; Bogunovic et al., 2020), mulches (Nachtergaele et al., 1998; López-Urrea et al., 2020), catch crops (Cerdà et al., 2021), terraces (e.g., Ramos and Porta, 1997; Pijl et al., 2019) buffer strips and grass cover (Novara et al., 2013; Capello et al., 2019; Diti et al., 2020) have reduced the erosion rates, and are even improving specific soil physicochemical properties. The effect of soil grass cover compared to bare soil on surface runoff and percolation rate have been observed in detail by other authors in land degraded areas, for example, grazing areas (Minea et al., 2019).
Nowadays, the factors affecting soil erosion in vineyards are mainly well understood, and the recent literature shows them clearly. The factors include bare soils, intense tillage, inclination, vegetation cover, soil surface roughness, and soil properties (texture, structure, aggregate stability, water retention capacity, etc.). The parent material and the age of the plantation have been demonstrated to be major issues (Battany and Grismer, 2000; Martínez-Casasnovas et al., 2005; Quiquerez et al., 2014). The European Union, too, is currently focusing on soil erosion problematics. In the EU Soil Framework Directive (EU, 2019), Objective 1 aims at soil protection. The European Commission identified eight threats to soil quality, soil erosion being named as the one of most severe one. Members states were required to take specific measures, although each state is free decide how to implement them. One of the UN sustainable development goals (UN, 2022), is the Life on Land goal 15.3 of which is to achieve a land degradation-neutral world. It is therefore necessary to assess whether a tool such as a rainfall simulator is a suitable device for assessing the activation of soil erosion during an extreme precipitation event, and for quantifying the potential catastrophic larger scale risk.
One of the most widely-used instruments for assessing soil erosion processes and potential control measures in vineyards is the portable rainfall simulator. This device has been used even to compare vineyards under diverse environmental conditions across Europe from a quantitative point of view (Rodrigo-Comino et al., 2016a) and from a qualitative point of view (Rodrigo-Comino et al., 2016b). Portable rainfall simulators are the key to evaluating soil erosion processes and to detecting which key factor mainly affects the initiation of these processes (Cerdà, 1998; Iserloh et al., 2013; Minea et al., 2021). Small portable rainfall simulators are easy to transport and enable the determining processes of runoff activation and soil detachment to be measured on a small scale (Fernández-Gálvez et al., 2008; Zemke, 2016). The main design issues arise from the size and the shape of the plot. At pedon scale, using rings or quadrat plots, it is not easy to recognize other interconnected processes occurring at larger scales, such as rills or connectivity dynamics (Iserloh et al., 2017; Szabó et al., 2020). It is clear that different results might be obtained when the plot size increases. In vineyards, tests were recently carried out by Rodrigo-Comino et al. (2019) using ISUM (Improved Stock Unearthing Method) in the viticultural area of Tierra de Barros (Extremadura, Spain). The authors demonstrated that measurements of soil loss on plots from 300 to 900 m2 in size, may result in differences of about 3 t ha−1 yr−1.
To the best of our knowledge, however, a rainfall simulator in vineyards has not previously been used for observing in situ processes and for detecting key factors while the scale of the rainfall simulator is being varied. The main goal of this investigation was to shed light on the differences in the activation of soil erosion processes in vineyards when experimental plots of different sizes are being used. To achieve this goal, two different rainfall simulators with different plot sizes (1 × 1 m vs 8 × 1 m) are used to compare runoff, soil loss, sediment concentration and sediment composition in an experimental area in vineyards in the Southern Moravia region, Czech Republic.
2 Materials and methods
2.1 Study area
The experimental site is located in the Stará hora vineyard, near Uherčice village (longitude = 16.67138°, latitude = 48.952612°) at 200 m a. s. l., in the wine-producing region of Moravia, located in the Velké Pavlovice subregion, Hustopeče district (approximately 25 km south of Brno) (Figure 1A), Czech Republic. The grape variety is Muscat Moravian (a combination of Muscat Ottonel and Prachtraube), which is typical for the Moravia viticultural region. The soil parent materials are sandstones with quaternary deposits of clays. The inclination of the hillslopes of the vineyard ranges from 10% to 22%. The resulting soils can be classified as calcic Chernozem (IUSS-WRB, 2015). The soil texture was classified as silty loam with 7% clay, 67% silt and 26% sand particle content. The soil contains 1.49% organic matter and has 7.28 pH values. The vines are cultivated following a 1.75 × 1 m plantation framework. The soil surface is covered by grass all year round, and it is treated 5–6 times per year using a tractor (hammer mulcher and spraying). The climate is characterized by an annual average air temperature of 9.2°C. In summer, the average temperature reaches 19°C. There is annual precipitation of 563 mm yr−1, more than 50% of which falls between May and September. Estimates of the maximum average intensities of a 30-min rainfall with return periods of 2 and 10 years are 33 and 62 mm h−1 respectively (CTU, 2022).
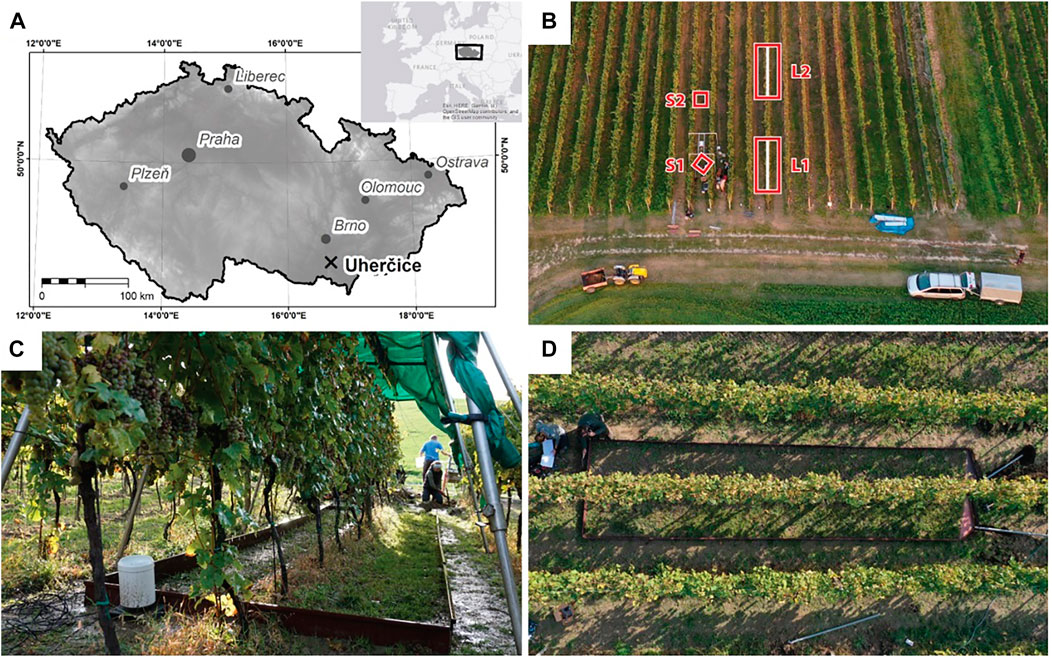
FIGURE 1. (A) Location of the experimental area; (B) General overview of the study area; (C) detail of vine plants, and (D) an aerial view of the placement of the large plot within the rows of vines. *S, small portable rainfall simulator; L, large rainfall simulator. 1 and 2 refer to the number of repetitions.
2.2 Rainfall simulators: Description and procedures
2.2.1 The small portable rainfall simulator
The small portable rainfall simulator (Figure 2B) has four aluminium legs bearing one flat nozzle (veejet 9550, bspt h1/2u, Spraying Systems Co.) at a height of 2.5 m above the middle of the square plot. The experimental plot is 1 × 1 m and is delimited by metal sheets partially inserted into the soil to a depth of approx. 4 cm. The rainfall intensity was set to 60 mm h−1, which corresponds to a high-magnitude rainfall event in this area. The precipitation intensity was chosen to be consistent with other rainfall simulators, to facilitate comparisons between different crops and soil conditions (Ries and Iserloh, 2013). This small rainfall simulator can operate in swinging mode or in pulse mode (i.e., with no movements of the nozzle itself, the intensity is maintained by periodic interruption of the water stream by a solenoid valve) to reproduce the most realistic natural rainfall conditions. The usual kinetic energy in this setup (calibrated previously under laboratory conditions) was 4.14 J m−2 mm−1, and the spatial distribution Christiansen index was 93%. Further information about calibration and technical details can be found in Kavka and Neumann (2021).
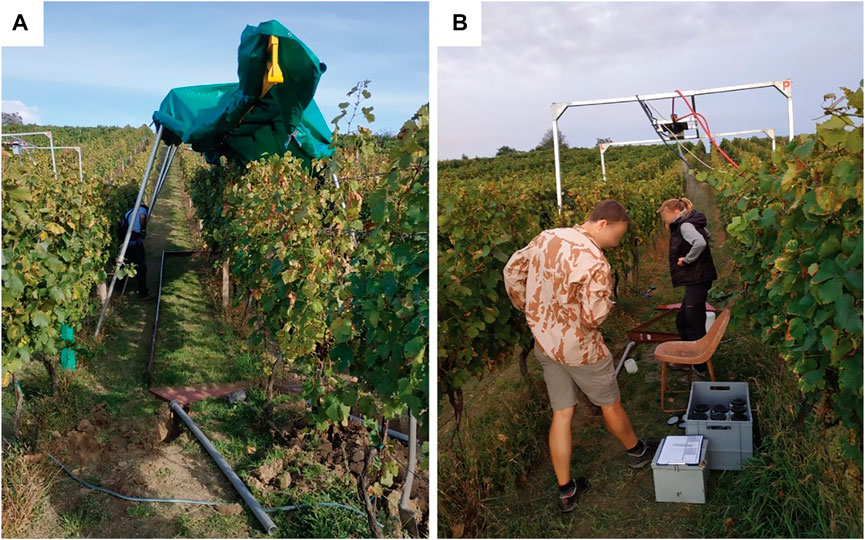
FIGURE 2. The small and large rainfall simulators used for this research. (A) the large rainfall simulator; (B) the small rainfall simulator.
2.2.2 The large rainfall simulator
The usual experimental plot layout when operating the CTU large rainfall simulator (Figure 2A) is a rectangle 8 m in length and 2 m in width (Kavka et al., 2018). It is enclosed by metal sheets with a metal funnel at the downhill border for collecting the surface runoff. In this field campaign, the layout was modified in order to reflect the specific vineyard conditions. At the downhill border, two 1 m wide metal funnels were installed, each of them to collect the runoff from a one row-gap. The elevated ridge of the vine row acted as a natural border between the two sub-plots. To reproduce closely a natural rainfall event, eight nozzles (WSQ40, Spraying System Co.), 2.5 m in height and 1.2 m apart were used. The rainfall intensity reached 60 mm h−1, with mean kinetic energy of the drops up to 10 J m−2 mm−1. The required rainfall intensity was achieved by interrupting the sprinkling of individual nozzles by solenoid valves. The nozzles operation scheme had previously been calibrated using a plastic sheet, under laboratory conditions and also in field conditions.
2.2.3 Experimental procedures
In total, four simulations within 3 days were carried out, two on the small experimental plots and two on the large plots. Both small plots were situated in the same inter-row area along the hillslope (Figure 1B). The first plot was positioned on the footslope, and the last plot on the backslope (no simulations were performed at the shoulder or at the summit). Except for the first experiment with the small rainfall simulator on the footslope, all the plots were delimited with their side edges parallel to the vineyard rows. The runoff was collected in a flat metal funnel, using 1 and 2 L plastic samplers approximately 1 m below the plot. Next to the plot, still within the watered perimeter, a rain gauge was set up to monitor the temporal distribution of the sprinkling intensity. Before each experiment was conducted, the surface cover was evaluated from vertical surface images by automated classification processed with the use of a hand-held camera.
Two simulations in different positions were conducted with the large rainfall simulator. Both large plots were situated along the same vineyard row, ca 10 m apart from the small plots and approximately on the same part of the hillslope. As the large plots were divided into two subplots (Figures 1C,D), two repetitions of each simulation were obtained, resulting in a total of four repetitions. One repetition was excluded from the results, because the vegetation cover was too high. Grass cover was therefore not taken into account when comparing the results among the experimental plots, making all the plots comparable with each other. The canopy cover was evaluated from vertical images of the experimental plot(s), with undesired features filtered out beforehand (bordering metal sheets, adjacent plot overshoot, etc.). The orthorectified images in 1mm resolution were processed in ENVI 5.5 (L3Harris Geospatial, 2019) with the Maximum Likelyhood classifier with single pixels eliminated by Aggregation. The same sprinkling scenario was used for the small plots and for the large plots, comprising dry and wet runs. In the dry run (soil in natural condition), rainfall intensity of 60 mm h−1 was applied for 30 min plus the time to the onset of runoff (TTR), followed by a 15-min break and then the wet run (fully saturated soil)—which was again 30 min plus TTR. The undisturbed samples were collected using standard Kopecky cylinders (diameter 50 mm, height 51 mm) to characterize the soil bulk density and the initial soil moisture in the experimental spot (Al-Shammary et al., 2018). Three samples from each of the specific conditions were collected and evaluated. For the soil moisture measurements, the soil water content sensor (Terros TR10, Meter Group Inc. United States) was installed into the plot and a Hydrosense probe (Hydrosense 2, Campbell Scientific, Inc.) was also used.
The rainfall simulator had performed a short water pressure stabilization cycle before the simulation was initiated. When the water pressure in the system had stabilized to the required value, the stopwatch was started and the experiment began. From this moment, the soil surface was carefully observed, and when surface runoff started, it was sampled and the measurements began. Samples were collected every 2.5 min (resulting in a total of 12 samples per simulation run), and the time of filling for each sample was measured and recorded. The runoff rate was evaluated afterwards under laboratory conditions when the volume of each sample had been measured.
2.3 Laboratory analysis
The soil samples collected during the experiments were analyzed in the laboratory. Kopecky cylinders were used to analyze the bulk density and the organic carbon. Bigger Kopecky cylinders (diameter 80 mm, height 50 mm) were employed to assess the saturated hydraulic conductivity (KSAT). The organic matter was measured by TOC analyzer Tnb multi N/C2100 with an HT 1300 unit by Analytik Jena. The samples collected in the bottles during the experiment were filtered (KA 3M by Czech manufacturer Papírny Pernštejn) and were dried at 105°C for 24 h and then weighed.
2.4 Statistical analysis
All the results were depicted using an Excel datasheet in the form of linear graphs and several characteristics of the simulation runs were calculated. Then, an analysis of the variance in the observed data was performed using R statistical software (R core team, 2019), in order to determine the role of the size of each experimental plot and to separate its effect from the effects of other parameters. R version 3.6.0 and the car 3.0.8 package (Fox and Weisberg, 2019) were used to perform the variance analysis. Since the number of simulations was very low, only two variables were considered: plot size SIM and initial moisture conditions CON. For each simulation characteristic, a hierarchical set of five linear models was built:
• mod0 null model as a baseline for assessing the performance of the other models. Represents the dataset with the mean value;
• mod11 single variable SIM (simulator (plot) size—Small and Large);
• mod12 single variable CON (initial moisture conditions—Dry and Wet);
• mod2 model with two variables SIM + CON without their interaction;
• mod21 model with two variables SIM + CON including their interaction.
For each model, ANOVA Type III was performed to determine the statistical significance of particular variables. In contrast to types I and II, type III of the variance analysis is applicable for unbalanced datasets and for data where a significant interaction between main effects may occur. It calculates the sum of squares for each considered factor (or their interaction term) while taking into account the role of the other factors.
3 Results
3.1 Soil surface conditions on the experimental plots
The soil texture in this experimental area was classified as silty loam. The bulk density values differed between the row and the inter-row. The mean values of the collected samples were 1.46 ± 0.03 g cm−3 and 1.35 ± 0.02 g cm−3, respectively. The mean antecedent volumetric moisture content was 34.57 ± 0.9%. The saturated soil conductivity was 187.72 for the large simulator and 173.5 cm d−1 for the small simulator. Each of the four large experimental subplots was captured by a series of images along its length. The mean vegetation cover on the three large sub-plots was 30.0%, 34.8% and 33.8%. For the small plots, the vegetation cover was 38.6% and 31.2%. It should be pointed out that there were similar local inclinations. Mean values of 13.5% were measured in the small plots (maximum values of 18% and minimum values of 9%) and values of 16.5% were measured in the large plots (maximum values of 20% and a minimum of 12.3%).
3.2 Surface runoff
The time to the start of the surface runoff and the dynamics of the surface runoff during the experiments were evaluated. The runoff started as follows:
• Small plot in dry conditions—3.5 and 5.5 min
• Small plot in wet conditions—1.5 and 1.5 min
• Large plot in dry conditions—3, 1 and 1 min
• Large plot in wet condition—2, 1 and 1 min
In Figure 3, the runoff from the small lower plot shows a tendency stabilized at values under both dry and wet conditions ranging from 0.65 to 0.90 L min−1 m−2, respectively. On the second plot, the runoff stabilized in the last two intervals, reaching constant values of 0.63 L min−1 m−2. Under wet conditions, the runoff reached 0.78 L min−1 m−2. As concerns the averages for the last three measurements in each run, the stabilized specific surface runoff from the small plots ranged from 0.62 to 0.91 L min−1 m−2, with mean values of 0.74 L min−1 m−2.
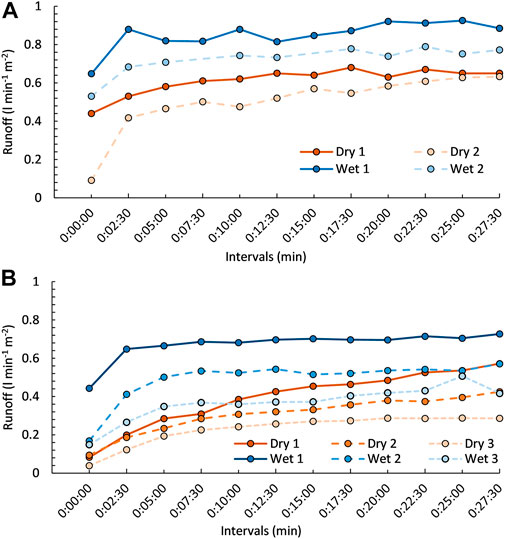
FIGURE 3. Surface runoff using different plot sizes: (A) small plots and (B) large plots, under dry and wet moisture conditions. The time axis provides the relative time from the start of the surface runoff.
During the first simulation using the large rainfall simulator, there was a significant difference between the two subplots. The subplot with considerably higher vegetation cover produced no surface runoff, not even during the wet run. For this reason, results were considered only from the other three simulations. During simulations number 1 and 2, the surface runoff did not show clear stabilization until the wet run reached values of 0.72 and 0.57 L min−1 m−2, respectively. During the third replication, the runoff in dry and wet conditions reached 0.29 and 0.42 L min−1 m−2, respectively. The averages for the last three measurements in each run of the specific surface runoff from the large plots ranged from 0.29 to 0.72 L min−1 m−2, with mean results of 0.49 L min−1 m−2. On the small plots and also on the large plots, the runoff under wet conditions in all cases significantly exceeded the runoff in the dry runs.
The calculated runoff coefficients for the large plots were: 0.36, 0.3 and 0.22 in dry conditions and 0.63, 0.48 and 0.36 in wet conditions. For the small rainfall simulator, runoff coefficients of 0.52 and 0.45 in dry conditions and 0.81 and 0.57 wet conditions were obtained. Overall mean values reaching 0.39 for the large plots and 0.59 for the small plots were registered.
3.3 Soil loss
The soil loss on the small plots was rather evenly distributed in time, with systematically higher values in the second simulation under dry conditions than under wet conditions (Figure 4). As regards, the averages for the last three measurements in each run, the soil loss on the small plots ranged from 1.00 to 3.07 g min−1 m−2, with overall averages of 1.83 g min−1 m−2. The soil loss rates observed in the large plots were more variable. The values from the second simulation were 2–3 times higher than the values from the first and third simulations. With the exception of the third simulation, the soil loss for both dry and wet conditions stabilized very close to those, which is in contrast with the pattern for surface runoff, where the results are quite different. The averages for the last three measurements in each run show that the soil loss in the large plots ranged from 1.37 to 6.06 g min−1 m−2, with total mean values of 3.46 g min−1 m−2. Therefore, no general soil loss patterns were observed when small and large plots were compared. The soil loss from the large plots seems to reach higher values, except in the case of the second simulation.
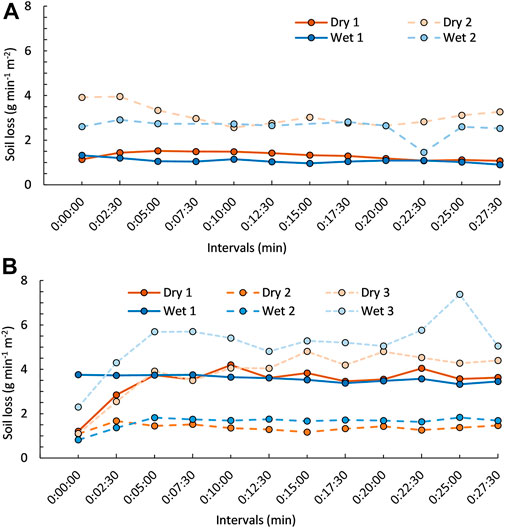
FIGURE 4. Soil loss using different plot sizes: (A) small plots and (B) large plots, under dry and wet moisture conditions. The time axis provides the relative time from the start of the surface runoff.
3.4 Sediment concentration
Similarly to the soil loss results, the sediment concentration in the small plots was almost constant during all the experiments, except for one outlying value at the start of the second dry run (Figure 5). The concentrations from the second simulation were systematically higher when compared with the same moisture conditions and with the concentrations from the dry runs, which always exceeded the concentrations for the wet runs. As regards the average values for the last three measurements in each run, the sediment concentration on the small plots ranged from 1.1 to 4.92 g L−1, with mean values of 2,63 g L−1.
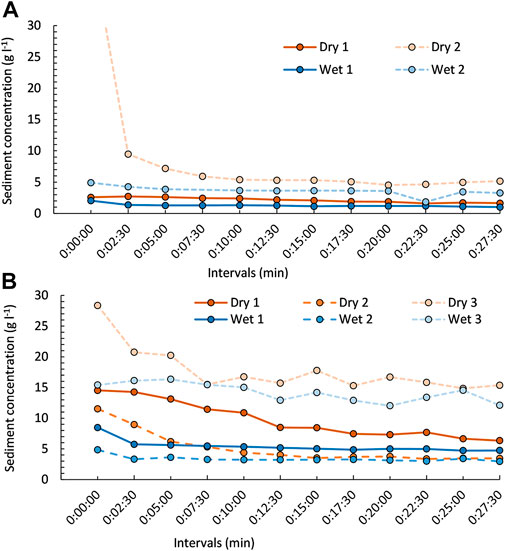
FIGURE 5. Sediment concentration results using different plot sizes: (A) small plots and (B) large plots, under dry and wet moisture conditions. The time axis provides the relative time from the start of the surface runoff.
The sediment concentrations in the large plots showed more distinctly decreasing and later stabilized dynamics in all experiments. As on the small plots, the sediment concentration from the dry runs mostly exceeded the concentrations for the wet runs. In this case, however, there was a more distinct trend towards a decreasing gap, actually approaching zero difference in the second simulation. As regards, the averages for the last three measurements in each run, the sediment concentration from the large plots ranged from 3.13 to 15.35 g L−1, with mean values of 7.83 g L−1.
In contrast to the soil loss results, there was a distinct pattern in sediment concentration for both the small plots and the large plots. In all cases, the concentration in the dry runs exceeded or—in one simulation—approached the values for the wet runs.
3.5 Comparisons of the runoff dynamics
The ratio of the explained variability was determined by comparing the RSS of a model with RSS of mod0. If needed, model pairs were also compared to assess the role of an extra variable or an extra model term (especially for an assessment of the interaction term). Table 1 presents the resulting statistical significance of the considered variables and the ratios of the explained variability.
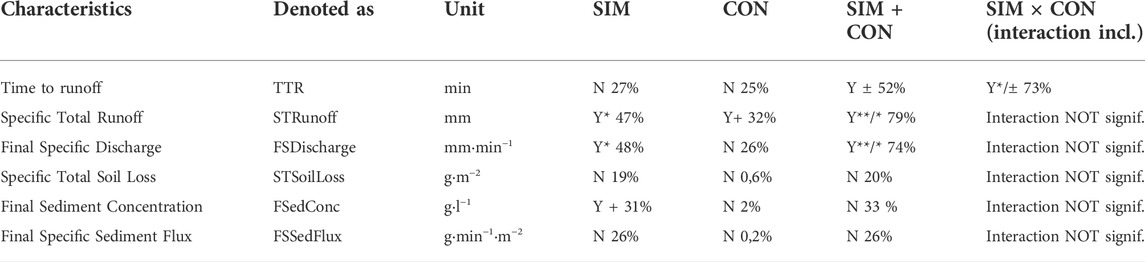
TABLE 1. ANOVA Type III, considering the results obtained with the rainfall simulation experiments and hydrological parameters. The meanings of the variables are: SIM, Simulator (plot) size; CON, initial moisture conditions. Y, yes, variable is significant; N, not a significant variable. Percentages show the fraction of explained variability. Significance levels denoted as: ** (α = 0.01), * (α = 0.05), + (α = 0.1), - (not significant). In models with multiple variables, the order of the alpha levels corresponds to the order of the variables, interaction term provided in the last position.
In TTR, a combination of SIM + CON variables is needed to explain a significant part of the variability. Taken separately, the individual variables are not enough. TTR is the only variable where there is a significant interaction between SIM and CON at the level α = 0.1, while from the two main effects only the plot size proves to be significant (α = 0.05). For one level of conditions (Dry), the effect of plot size is different than for the other level (Wet). The explanation may be that, under wet conditions, runoff is usually initiated immediately on the plots on both scales. However, under dry conditions, it takes some time for runoff to form, and the plot size therefore plays a significant role. With a single exception, the two variables completely fail to explain a significant part of the variability in sediment transport characteristics. As regards the exception, the FSedConc characteristic also partially reflects the runoff, and this might be the reason why one of the variables was shown to be significant. If we consider only the initial conditions (CON), they explain a significant part of the Specific Total Runoff (STRunoff) only, and on a lower level of significance (α = 0.1). When we consider the size of the experimental plot (SIM), it proves to be significant for the two runoff characteristics (STRunoff and FSDischarge) and for one sediment transport characteristic (FSedConc). Combining the SIM + CON characteristics provides significantly better predictions of the runoff characteristics than the use of just one of these characteristics. In these three models (with a slight deviation in TTR), both variables are more significant than in the single-variable models.
4 Discussion
Rainfall simulator devices are widely used in research carried out in vineyards on estimating soil erosion activation processes (Prosdocimi et al., 2016b; Bogunovic et al., 2020). This type of research is undertaken especially in countries with extensive vineyards (Prosdocimi et al., 2016a). However, although the eastern part of the Czech Republic is known as a traditional wine-producing region, little experimental research has been performed on this topic. (Burg et al., 2017; Cizkova et al., 2019; Ragasová et al., 2019). Scientists around the world focus on soil erosion in vineyards, but studies in the Czech Republic are still scarce. The research presented here is focused on the erosion rates in vineyards in the Moravia region, and we have demonstrated that these steep slope vineyards are at risk of activating intensive rainfall-runoff processes.
In the past, soil loss and surface runoff have also been studied using different plot sizes by researchers in other countries investigating vineyards (Rodrigo-Comino et al., 2019) and other land uses, such as grasslands and subtropical environments (Thomaz and Vestena, 2012; Mayerhofer et al., 2017). We have reported that runoff on a small plot was about 30% higher in our experiments than on large plots, but that the soil loss was approximately the same for small and large plots under natural rainfall. Boix-Fayos et al. (2006) highlighted how difficult it is to encapsulate the complexity of system interactions and to represent these interactions using field plots. They introduced the term “complexity” to analyze at different plot scales the connectivity of water and sediment fluxes and the interaction between processes and patterns of vegetation and surface components. Parsons et al. (2008) also did not find higher soil loss for longer plots, although an active debate arose (Kinnell, 2008). One of the main points of discussion has been the influence of connectivity processes, the generation of rills (from 8 up to 10 m), and the influence of agricultural management systems on larger scales (Kinnell, 2016; Cerdà et al., 2018).
The use of a rectangular plot in comparison with a circular plot can also be a good starting point for a discussion. The interface between the soil surface and the collecting funnel is a troublesome spot. If the edge of the soil collapses, a false soil loss value can appear (high values in one interval). We encountered this phenomenon during the second run on the dry plot (Figure 5A) although we had been aware of the potential problem and this connection had been carefully prepared. The surface runoff was low, but there was extremely high soil erosion. With a circular plot, the connection between the funnel and the soil also has to be precisely prepared. However, the interface is only a few centimeters in length, so the peaks will be reduced (Iserloh et al., 2013; Ries and Iserloh, 2013).
In our study area, two different devices were used. There was one small rainfall simulator with a plot 1 m2 in size, and a large rainfall simulator with a plot two times 8 m2 in size, with the same rainfall intensity. However there were some differences in kinetic energy, which was somewhat higher for the large plot. The small rainfall simulators usually need different nozzles than the big simulators. These nozzles produce a more even spatial distribution of the droplets, with lower working pressure and water consumption, but they may show lower kinetic energy.
Nevertheless, we consider the differences in kinetic energies to be negligible in comparison with the differences in plot size and the concentration of the processes in the small device. It should be taken into account that the kinetic energy might also have been reduced due to spatial layout of the experimental setup. The nozzles produce highest kinetic energy in the central part of the spray cone, i.e., right above the vine plants. The percentage of vegetation cover of the plots was calculated in order to provide added information the grass cover, excluded the vine plants. In the case of small rainfall simulator there was no effect of the vine plants. The interception for the large rainfall simulator was therefore also higher than in the small rainfall simulator experiments, where the nozzle was placed in the inter-row. This is a key parameter that other researchers have also highlighted in connection with the reduction in the splash effect due to leaf interception (Crokford and Richardson, 2000; Abdo, 2018). Due to the design of the large rainfall simulator and the spatial pattern of the vine plants, it was not possible to place the rainfall simulator and the respective nozzles in the middle of the inter-rows. It is therefore complicated to determine the ideal rainfall intensity that will ensure that the experiments simulate identical artificial meteorological conditions. Another potential weak point is the limited number of repetitions. We needed to limit the number of repetitions because we used a large rainfall simulator that requires a lot of time and a considerable number of people on the field at the same time (4–6 people). The experiment is expensive to organize, due to the amount of water that is required and the number of cars needed to transport the materials. In addition, the experiment is labor-demanding to install. It is not easy to find suitable positions due to: the size of the experimental area, the need for a representative area without cracks and spillways, the need for large amounts of water for the experiments (1–3 m3 of water per simulation hour), and also the need to obtain the consent of the vineyard owner. However, a major advantage of the setup used in our research was that we were able to obtain results from two experimental plots that were placed next to each other within a single experiment. In addition, the formation of rills could be observed during the experiments. The generation of rills and ephemeral gullies drastically increases the concentration of the runoff and the activation of soil loss (Ben Slimane et al., 2016; Asadi et al., 2017), and allowed us to better observe the connectivity processes from the different parts of the plots to the outlet. This also enabled the inclusion of more accurate measurements of the time to ponding and the time to runoff generation, both of which are key parameters for characterizing the soil-water interactions. The use of this device is innovative, especially in vineyards.
When similar devices and research plans have been used on agricultural fields or on experimental plots under laboratory conditions, successful results have been obtained (Williams et al., 1998; Esteves et al., 2000; Strauss et al., 2000; Schindewolf and Schmidt, 2012). We therefore selected homogeneous surfaces in a conventional vineyard with similar slopes, similar vegetation cover and the same soil management. A comparison between the results obtained for the small plots and for the large plots demonstrated that the small plots provided a higher runoff coefficient (0.59) than the large plot (0.39). This may be associated with the generation of the sheet processes that is observed in small plots (Ghahramani et al., 2011; Kinnell, 2012; Khaledi Darvishan et al., 2013). The large rainfall simulator recorded up to 3 times higher sediment concentration and up to 1.5 times higher soil loss, even when the surface runoff was 30%–50% lower. This may be directly related to the rills that generated some peaks during specific intervals. Hypothesizing a similar situation, Bagarello et al. (2011) tested the influence of plot sizes 11 and 22 m in length. However, they did not find any differences, and their results were not in agreement with the results of our experiments. Both plots tested by Bagarello et al. (2011) were longer than the plot of the large rainfall simulator in our work, so the scaling is different. This may account for the differences in results. We suppose that there is a limit length where the soil loss is less dependent on the length of the plot. We have already pointed out that 8 m could be the limit length to create a rill (Kinnell, 2016). Bagarello et al. (2011) showed that both plots in his experiments were longer than 10 m when the rills were formed in both experiments. This could be the reason why the soil loss was similar for both experiments. Another reason could be the higher kinetic energy for the large plot, where Bagarello used natural rainfall with plots next to each other. The energy of a drop falling to the surface was therefore similar, unlike in our research.
In our study, we have confirmed that the influence of plot length is a topic that requires further study with in situ experiments (Smets et al., 2008), because soil properties such as rock fragments, porosity and roughness, and vegetation/root cover may vary substantially within a scale of a few centimetres. Modelling studies can focus on this topic, but not on other highly used equations e.g. RUSLE (Revised Universal Soil Loss Equation; Efthimiou et al., 2014; Karpilo and Toy, 2004; Panagos et al., 2015a). This model does not take in to account the variation in surface cover and properties when the length increases by a few centimeters at pedon scale. We therefore consider that a small rainfall simulator can be more appropriate for supplementing research with specific information about certain parts of a hillslope and with physical soil properties (Seeger, 2007), and a large rainfall simulator can be more suitable for simulating a micro-environment, taking into account rills, various vegetation patterns and differences in soil properties at pedon scale. It would be interesting to check nozzles to obtain a linear relationship among the plot sizes in order to test both rainfall simulators under the same conditions. The runoff and soil loss could then be recalculated to obtain final results independent from plot size. This would make future experiments easier to conduct and to compare, because experiments with large rainfall simulator on the edge of a vineyard are really complicated to conduct. It is almost impossible to establish the nozzles with the same intensity and to conserve the kinetic energy in the middle of the inter-row.
5 Conclusion
This study has investigated the influence of the size of the plot under a rainfall simulator on the soil loss in vineyards. It was a first attempt to determine whether experiments in vineyards with large rainfall simulators are manageable, whether the use of small plots is comparable with the use of large plots, and can provide similar results, or whether the results for small plots can just provide supplementary information for a limited number of parameters. More research on the influence of small and large rainfall simulators should be carried out to understand the influence of plot length in vineyards. Especially the large rainfall simulator should be placed with the nozzles in the interrow to avoid the effect of the vine leaves. A comparison of the results obtained with small and large plots demonstrated that the small plot experiments resulted in a higher runoff coefficient than the large plot. This may be associated with the generation of the sheet processes observed in the small plots. The large rainfall simulator recorded an up to 3 times higher sediment concentration and up to 1.5 times higher soil loss, even in cases when the surface runoff was 30%–50% lower for the large rainfall simulator. This may be directly related to the rills that generated some peaks during specific intervals. All the results were considered after steady-state values had been reached after the tenth minute. We have confirmed that the length of the plot is important for determining the erosion rates valid for longer flow paths in later phases of rainfall events, even when small simulators are used to study the initial phase of surface runoff and soil loss. A large rainfall simulator can provide results that more closely reflect the real conditions of erosion initiation. Nevertheless, more research should be carried out on the influence of the different kinetic energies between small and large rainfall simulators, in order to avoid differences when different plot sizes are tested and to understand better the influence of plot length in vineyards. However, the related logistics make it significantly more complicated and more expensive to perform considerable numbers of repetitions. The relevant authorities should take into consideration the findings of research on experimental plots in their attempts to quantify and assess erosion risks and to establish sustainable and efficient agricultural funding policies. These on-site experiments can provide accurate data to complete the global models which work with the mean annual values.
Data availability statement
The raw data supporting the conclusions of this article will be made available by the authors, without undue reservation.
Author contributions
MN, PK, and JR-C contributed to the conception and design of the study. MN, PK, JD, JS, LS, AT, and RK conducted the experiments and evaluated data. MN wrote the first draft of the manuscript. MN, LS, JS, JD, and JR-C wrote section of the manuscript. All authors contributed to the revision of the manuscript, read and approved the submitted version.
Funding
This research was supported by Technology Agency of the Czech Republic project TJ02000234, by Ministry of Agriculture of the Czech Republic projects QK1810341, QK1910029, QK22010261, and by the Grant Agency of the Czech Technical University in Prague within the framework of grant number SGS 20/156/OHK1/3T/11.
Conflict of interest
The authors declare that the research was conducted in the absence of any commercial or financial relationships that could be construed as a potential conflict of interest.
Publisher’s note
All claims expressed in this article are solely those of the authors and do not necessarily represent those of their affiliated organizations, or those of the publisher, the editors and the reviewers. Any product that may be evaluated in this article, or claim that may be made by its manufacturer, is not guaranteed or endorsed by the publisher.
References
Abdo, H. G. (2018). Impacts of war in Syria on vegetation dynamics and erosion risks in Safita area, Tartous, Syria. Reg. Environ. Change 18, 1707–1719. doi:10.1007/s10113-018-1280-3
Al-Shammary, A. A. G., Kouzani, A. Z., Kaynak, A., Khoo, S. Y., Norton, M., and Gates, W. (2018). Soil bulk density estimation methods: A review. Pedosphere 28, 581–596. doi:10.1016/S1002-0160(18)60034-7
Arnaez, J., Lasanta, T., Ruiz-Flaño, P., and Ortigosa, L. (2007). Factors affecting runoff and erosion under simulated rainfall in Mediterranean vineyards. Soil Tillage Res. 93, 324–334. doi:10.1016/j.still.2006.05.013
Asadi, H., Aligoli, M., and Gorji, M. (2017). Dynamic changes of sediment concentration in rill erosion at field experiments. J. Water Soil Sci. 20, 125–139. doi:10.18869/acadpub.jstnar.20.78.125
Bagagiolo, G., Biddoccu, M., Rabino, D., and Cavallo, E. (2018). Effects of rows arrangement, soil management, and rainfall characteristics on water and soil losses in Italian sloping vineyards. Environ. Res. 166, 690–704. doi:10.1016/j.envres.2018.06.048
Bagarello, V., Ferro, V., Giordano, G., Mannocchi, F., Pampalone, V., Todisco, F., et al. (2011). Effect of plot size on measured soil loss for two Italian experimental sites. Biosyst. Eng. 108, 18–27. doi:10.1016/j.biosystemseng.2010.10.006
Battany, M. C., and Grismer, M. E. (2000). Development of a portable field rainfall simulator for use in hillside vineyard runoff and erosion studies. Hydrol. Process. 14, 1119–1129. doi:10.1002/(SICI)1099-1085(20000430)14:6<1119::AID-HYP8>3.0.CO;2-O
Ben Slimane, A., Raclot, D., Evrard, O., Sanaa, M., Lefevre, I., and Le Bissonnais, Y. (2016). Relative contribution of rill/interrill and gully/channel erosion to small reservoir siltation in mediterranean environments. Land Degrad. Dev. 27, 785–797. doi:10.1002/ldr.2387
Ben-Salem, N., Álvarez, S., and López-Vicente, M. (2018). Soil and water conservation in rainfed vineyards with common sainfoin and spontaneous vegetation under different ground conditions. Water 10, 1058. doi:10.3390/w10081058
Blavet, D., De Noni, G., Le Bissonnais, Y., Leonard, M., Maillo, L., Laurent, J.-Y., et al. (2009). Effect of land use and management on the early stages of soil water erosion in French Mediterranean vineyards. Soil Tillage Res. 106, 124–136. doi:10.1016/j.still.2009.04.010
Boardman, J., Poesen, J., and Evans, R. (2003). Socio-economic factors in soil erosion and conservation. Environ. Sci. Policy 6, 1–6. doi:10.1016/s1462-9011(02)00120-x
Boellstorff, D., and Benito, B. (2005). Impacts of set-aside policy on the risk of soil erosion in central Spain. Agric. Ecosyst. Environ. 107, 231–243. doi:10.1016/j.agee.2004.11.002
Bogunovic, I., Telak, L. J., and Pereira, P. (2020). Experimental comparison of runoff generation and initial soil erosion between vineyards and croplands of eastern Croatia: A case study. Air, Soil Water Res. 13, 117862212092832. doi:10.1177/1178622120928323
Boix-Fayos, C., Martínez-Mena, M., Arnau-Rosalén, E., Calvo-Cases, A., Castillo, V., and Albaladejo, J. (2006). Measuring soil erosion by field plots: Understanding the sources of variation. Earth-Science Rev. 78, 267–285. doi:10.1016/j.earscirev.2006.05.005
Burg, P., Zemánek, P., and Burgová, J. (2017). The evaluation of erosion losses in vineyards. Agritech Sci. 17.
Capello, G., Biddoccu, M., Ferraris, S., and Cavallo, E. (2019). Effects of tractor passes on hydrological and soil erosion processes in tilled and grassed vineyards. Water 11, 2118. doi:10.3390/w11102118
Cerdà, A. (1998). Changes in overland flow and infiltration after a rangeland fire in a Mediterranean scrubland. Hydrol. Process. 12, 1031–1042. doi:10.1002/(SICI)1099-1085(19980615)12:7<1031::AID-HYP636>3.0.CO;2-V
Cerdà, A., Franch-Pardo, I., Novara, A., Sannigrahi, S., and Rodrigo-Comino, J. (2021). Examining the effectiveness of catch crops as a nature-based solution to mitigate surface soil and water losses as an environmental regional concern. Earth Syst. Environ. 6, 29–44. doi:10.1007/s41748-021-00284-9
Cerdà, A., Rodrigo-Comino, J., Novara, A., Brevik, E. C., Vaezi, A. R., Pulido, M., et al. (2018). Long-term impact of rainfed agricultural land abandonment on soil erosion in the Western Mediterranean basin. Prog. Phys. Geogr. Earth Environ. 42, 202–219. doi:10.1177/0309133318758521
Cizkova, A., Masan, V., Burg, P., and Burgova, J. (2019). Evaluation of water erosion in vineyards using rainfall simulator. Czech Repub. 26, 299–304.
Crokford, R. H., and Richardson, D. P. (2000). Partitioning of rainfall into throughfall, stemflow and interception: Effect of forest type, ground cover and climate. Hydrol. Process. 14, 2903–2920. doi:10.1002/1099-1085(200011/12)14:16/17<2903::aid-hyp126>3.0.co;2-6
CTU (2022). Rain @ FSv cvut v Praze. Available at: https://rain.fsv.cvut.cz/.
Diti, I., Legler, S. E., Caffi, T., Rossi, V., Canali, G., Bosso, A., et al. (2020). A new integrated approach for management of soil threats in the vineyard ecosystem. CATENA 195, 104788. doi:10.1016/j.catena.2020.104788
Efthimiou, N., Lykoudi, E., and Karavitis, C. (2014). Soil erosion assessment using the RUSLE model and GIS. Eur. Water 47, 15–30.
Esteves, M., Planchon, O., Lapetite, J. M., Silvera, N., and Cadet, P. (2000). The ‘EMIRE’ large rainfall simulator: Design and field testingEarth Surf. Process. Landforms, 25, 6812–6908. doi:10.1002/1096-9837(200007)25:7<681::AID-ESP124>3.0
EU (2019). EU soil framework directive. Available at: https://www.ipes-food.org/_img/upload/files/ClientEarth_EU%20Soil%20Framework%20Directive.pdf (accessed 1.7, 2022).
Feng, T., Wei, W., Chen, L., Rodrigo-Comino, J., Die, C., Feng, X., et al. (2018). Assessment of the impact of different vegetation patterns on soil erosion processes on semiarid loess slopes. Earth Surf. Process. Landforms 43, 1860–1870. doi:10.1002/esp.4361
Fernández-Gálvez, J., Barahona, E., and Mingorance, M. D. (2008). Measurement of infiltration in small field plots by a portable rainfall simulator: Application to trace-element mobility. Water Air Soil Pollut. 191, 257–264. doi:10.1007/s11270-008-9622-2
Fox, J., and Weisberg, S. (2019). An R companion to applied regression. AvaliableAt: https://socialsciences.mcmaster.ca/jfox/Books/Companion/.
Ghahramani, A., Ishikawa, Y., Gomi, T., Shiraki, K., and Miyata, S. (2011). Effect of ground cover on splash and sheetwash erosion over a steep forested hillslope: A plot-scale study. CATENA 85, 34–47. doi:10.1016/j.catena.2010.11.005
Hacisalihoglu, S. (2007). Determination of soil erosion in a steep hill slope with different land-use types: A case study in mertesdorf (ruwertal/Germany). J. Environ. Biol. 28, 433–438.
Iserloh, T., Ries, J. B., Cerdà, A., Echeverría, M. T., Fister, W., Geis sler, C., et al. (2013). Comparative measurements with seven rainfall simulators on uniform bare fallow land. Zfg_suppl. 57, 11–26. doi:10.1127/0372-8854/2012/s-00085
Iserloh, T., Wirtz, S., Seeger, M., Marzolff, I., and Ries, J. B. (2017). Erosion processes on different relief units: The relationship of form and process. Cuad. Investig. Geográfica 43, 171–187. doi:10.18172/cig.3206
Iuss Working Group Wrb, (2015). World Reference Base for Soil Resources 2014, update 2015. International soil classification system for naming soils and creating legends for soil maps. Roma: FAO.
Karpilo, R. D., and Toy, T. J. (2004). RUSLE C-factors for slope protection applications. ASMR 2004, 995–1013. doi:10.21000/JASMR04010995
Kavka, P., and Neumann, M. (2021). Swinging-pulse sprinkling head for rain simulators. Hydrology 8, 74. doi:10.3390/hydrology8020074
Kavka, P., Strouhal, L., Jáchymová, B., Krása, J., Báčová, M., Laburda, T., et al. (2018). Double size fulljet field rainfall simulator for complex interrill and rill erosion studies. Stavební obzor Civ. Eng. J. 2018, 183–194. doi:10.14311/CEJ.2018.02.0015
Khaledi Darvishan, A., Sadeghi, S. H., Homaee, M., and Arabkhedri, M. (2013). Measuring sheet erosion using synthetic color-contrast aggregates: Measuring sheet erosion using synthetic color-contrast aggregates. Hydrol. Process. 28, 4463–4471. doi:10.1002/hyp.9956
Kinnell, P. I. A. (2016). A review of the design and operation of runoff and soil loss plots. CATENA 145, 257–265. doi:10.1016/j.catena.2016.06.013
Kinnell, P. I. A. (2008). Comment on ‘scale relationships in hillslope runoff and erosion’ (earth surface processes and landforms 31: 1364-1383 (2006). Earth Surf. Process. Landf. 3133, 13641632–13831636. doi:10.1002/esp.1630
Kinnell, P. I. A. (2012). Raindrop-induced saltation and the enrichment of sediment discharged from sheet and interrill erosion areas. Hydrol. Process. 26, 1449–1456. doi:10.1002/hyp.8270
L3Harris Geospatial (2019). Envi - image processing and analysis software. Available at: https://www.l3harrisgeospatial.com/Software-Technology/ENVI (Accessed 7 4, 2022).
Labrière, N., Locatelli, B., Laumonier, Y., Freycon, V., and Bernoux, M. (2015). Soil erosion in the humid tropics: A systematic quantitative review. Agric. Ecosyst. Environ. 203, 127–139. doi:10.1016/j.agee.2015.01.027
Le Bissonnais, Y., Montier, C., Jamagne, M., Daroussin, J., and King, D. (2002). Mapping erosion risk for cultivated soil in France. CATENA 46, 207–220. doi:10.1016/S0341-8162(01)00167-9
Lieskovský, J., and Kenderessy, P. (2014). Modelling the effect of vegetation cover and different tillage practices on soil erosion in vineyards: A case study in vráble (Slovakia) using WATEM/SEDEM. Land Degrad. Dev. 25, 288–296. doi:10.1002/ldr.2162
López-Urrea, R., Sánchez, J. M., Montoro, A., Mañas, F., and Intrigliolo, D. S. (2020). Effect of using pruning waste as an organic mulching on a drip-irrigated vineyard evapotranspiration under a semi-arid climate. Agric. For. Meteorology 291, 108064. doi:10.1016/j.agrformet.2020.108064
Marques, M., Ruiz-Colmenero, M., Bienes, R., García-Díaz, A., and Sastre, B. (2020). Effects of a permanent soil cover on water dynamics and wine characteristics in a steep vineyard in the Central Spain. Air, Soil Water Res. 13, 117862212094806. doi:10.1177/1178622120948069
Martínez-Casasnovas, J. A., Ramos, M. C., and Ribes-Dasi, M. (2005). On-site effects of concentrated flow erosion in vineyard fields: Some economic implications. Catena 60, 129–146. doi:10.1016/j.catena.2004.11.006
Martínez-Casasnovas, J. A., and Ramos, M. (2009). Soil alteration due to erosion, ploughing and levelling of vineyards in north east Spain. Soil Use Manag. 25, 183–192. doi:10.1111/j.1475-2743.2009.00215.x
Mayerhofer, C., Meißl, G., Klebinder, K., Kohl, B., and Markart, G. (2017). Comparison of the results of a small-plot and a large-plot rainfall simulator – effects of land use and land cover on surface runoff in Alpine catchments. Catena 156, 184–196. doi:10.1016/j.catena.2017.04.009
Minea, G., Costache, R., Turcu, V., Ioana-Toroimac, G., Tudose, N-C., Gyasi-Agyei, Y., et al. (2021). “Challenges to improve rainfall-runoff study on experimental field plots,” in Jesús rodrigo-comino, precipitation. Amsterdam, Netherlands: (Elsevier), 223–236. doi:10.1016/B978-0-12-822699-5.00009-4
Minea, G., Ioana-Toroimac, G., and Moroşanu, G. (2019). The dominant runoff processes on grassland versus bare soil hillslopes in a temperate environment - an experimental study. J. Hydrology Hydromechanics 67 (4), 297–304. doi:10.2478/johh-2019-0018
Mirás-Avalos, J. M., Ramírez-Cuesta, J. M., Fandiño, M., Cancela, J. J., and Intrigliolo, D. S. (2020). Agronomic practices for reducing soil erosion in hillside vineyards under atlantic climatic conditions (galicia, Spain). Soil Syst. 4, 19. doi:10.3390/soilsystems4020019
Montgomery, D. R. (2007). Soil erosion and agricultural sustainability. Proc. Natl. Acad. Sci. U. S. A. 104, 13268–13272. doi:10.1073/pnas.0611508104
Morvan, X., Naisse, C., Malam Issa, O., Desprats, J. F., Combaud, A., and Cerdan, O. (2014). Effect of ground-cover type on surface runoff and subsequent soil erosion in Champagne vineyards in France. Soil Use Manag. 30, 372–381. doi:10.1111/sum.12129
Nachtergaele, J., Poesen, J., and Van Wesemael, B. (1998). Gravel mulching in vineyards of southern Switzerland. Soil Tillage Res. 46, 51–59. doi:10.1016/s0167-1987(98)80107-4
Napoli, M., Marta, A. D., Zanchi, C. A., and Orlandini, S. (2017). Assessment of soil and nutrient losses by runoff under different soil management practices in an Italian hilly vineyard. Soil Tillage Res. 168, 71–80. doi:10.1016/j.still.2016.12.011
Novara, A., Cerda, A., Barone, E., and Gristina, L. (2021). Cover crop management and water conservation in vineyard and olive orchards. Soil Tillage Res. 208, 104896. doi:10.1016/j.still.2020.104896
Novara, A., Gristina, L., Guaitoli, F., Santoro, A., and Cerdà, A. (2013). Managing soil nitrate with cover crops and buffer strips in Sicilian vineyards. Solid earth. 4, 255–262. doi:10.5194/se-4-255-2013
Novara, A., Stallone, G., Cerdà, A., and Gristina, L. (2019). The effect of shallow tillage on soil erosion in a semi-arid vineyard. Agronomy 9, 257. doi:10.3390/agronomy9050257
Panagos, P., Borrelli, P., and Meusburger, K. (2015a). A new European slope length and steepness factor (LS-Factor) for modeling soil erosion by water. Geosciences 5, 117–126. doi:10.3390/geosciences5020117
Panagos, P., Borrelli, P., Meusburger, K., Alewell, C., Lugato, E., and Montanarella, L. (2015b). Estimating the soil erosion cover-management factor at the European scale. Land Use Policy 48, 38–50. doi:10.1016/j.landusepol.2015.05.021
Parsons, A. J., Brazier, R. E., Wainwright, J., and Powell, D. M. (2008). Scale relationships in hillslope runoff and erosion Reply. Earth Surf. Process. Landforms 33, 1637–1638. doi:10.1002/esp.1628
Pijl, A., Barneveld, P., Mauri, L., Borsato, E., Grigolato, S., and Tarolli, P. (2019). Impact of mechanisation on soil loss in terraced vineyard landscapes. Cuad. Investig. Geográfica 45, 287–308. doi:10.18172/cig.3774
Prosdocimi, M., Cerdà, A., and Tarolli, P. (2016a). Soil water erosion on mediterranean vineyards: A review. Catena 141, 1–21. doi:10.1016/j.catena.2016.02.010
Prosdocimi, M., Jordán, A., Tarolli, P., Keesstra, S., Novara, A., and Cerdà, A. (2016b). The immediate effectiveness of barley straw mulch in reducing soil erodibility and surface runoff generation in Mediterranean vineyards. Sci. Total Environ. 547, 323–330. doi:10.1016/j.scitotenv.2015.12.076
Quiquerez, A., Chevigny, E., Allemand, P., Curmi, P., Petit, C., and Grandjean, P. (2014). Assessing the impact of soil surface characteristics on vineyard erosion from very high spatial resolution aerial images (Côte de Beaune, Burgundy, France). Catena 116, 163–172. doi:10.1016/j.catena.2013.12.002
R Core Team (2019). R: A language and environment for statistical computing. Available at: https://www.r-project.org/(Accessed 7 3, 2022).
Ragasová, L., Kopta, T., Winkler, J., and Pokluda, R. (2019). The current stage of greening vegetation in selected wine-regions of south moravian region (Czech republic). Agronomy 9, 541. doi:10.3390/agronomy9090541
Ramos, M. C., and Porta, J. (1997). Analysis of design criteria for vineyard terraces in the mediterranean area of North East Spain. Soil Technol. 10, 155–166. doi:10.1016/S0933-3630(96)00006-2
Ries, J. B., and Iserloh, T. (2013). Rainfall simulation experiments with smalls scale simulators. Z. für Geomorphol. Suppl. Issues 57, 1–10. doi:10.1127/0372-8854/2013/S-00130
Rodrigo-Comino, J., Iserloh, T., Morvan, X., Malam Issa, O., Naisse, C., Keesstra, S. D., et al. (2016b). Soil erosion processes in European vineyards: A qualitative comparison of rainfall simulation measurements in Germany, Spain and France. Hydrology 3, 6. doi:10.3390/hydrology3010006
Rodrigo-Comino, J., Barrena-González, J., Pulido-Fernández, M., and Cerdá, A. (2019). Estimating non-sustainable soil erosion rates in the Tierra de Barros vineyards (extremadura, Spain) using an ISUM update. Appl. Sci. 9, 3317. doi:10.3390/app9163317
Rodrigo-Comino, J. (2018). Five decades of soil erosion research in “terroir”. The State-of-the-Art. Earth-Science Rev. 179, 436–447. doi:10.1016/j.earscirev.2018.02.014
Rodrigo-Comino, J., Iserloh, T., Lassu, T., Cerdà, A., Keesstra, S. D., Prosdocimi, M., et al. (2016a). Quantitative comparison of initial soil erosion processes and runoff generation in Spanish and German vineyards. Sci. Total Environ. 565, 1165–1174. doi:10.1016/j.scitotenv.2016.05.163
Rodríguez Sousa, A. A., Barandica, J. M., and Rescia, A. J. (2019). Estimation of soil loss tolerance in olive groves as an indicator of sustainability: The case of the estepa region (andalusia, Spain). Agronomy 9, 785. doi:10.3390/agronomy9120785
Schindewolf, M., and Schmidt, J. (2012). Parameterization of the EROSION 2D/3D soil erosion model using a small-scale rainfall simulator and upstream runoff simulation. Catena 91, 47–55. doi:10.1016/j.catena.2011.01.007
Seeger, M. (2007). Uncertainty of factors determining runoff and erosion processes as quantified by rainfall simulations. CATENA 71, 56–67. doi:10.1016/j.catena.2006.10.005
Smets, T., Poesen, J., and Bochet, E. (2008). Impact of plot length on the effectiveness of different soil-surface covers in reducing runoff and soil loss by water. Prog. Phys. Geogr. Earth Environ. 32, 654–677. doi:10.1177/0309133308101473
Strauss, P., Pitty, J., Pfeffer, M., and Mentler, A. (2000). A. Rainfall simulation for outdoor experiments. Undefined. Report.
Szabó, J. A., Centeri, C., Keller, B., Hatvani, I. G., Szalai, Z., Dobos, E., et al. (2020). The use of various rainfall simulators in the determination of the driving forces of changes in sediment concentration and clay enrichment. Water 12, 2856. doi:10.3390/w12102856
Taguas, E. V., and Gómez, J. A. (2015). Vulnerability of olive orchards under the current CAP (common agricultural policy) regulations on soil erosion: A study case in southern Spain. Land Use Policy 42, 683–694. doi:10.1016/j.landusepol.2014.09.001
Thomaz, E. L., and Vestena, L. R. (2012). Measurement of runoff and soil loss from two differently sized plots in a subtropical environment (Brazil). Earth Surf. Process. Landforms 37, 363–373. doi:10.1002/esp.2242
UN (2022). Take action for the sustainable development goals. Available at: https://www.un.org/sustainabledevelopment/sustainable-development-goals/.
Verheijen, F. G. A., Jones, R. J. A., Rickson, R. J., and Smith, C. J. (2009). Tolerable versus actual soil erosion rates in Europe. Earth-Science Rev. 94, 23–38. doi:10.1016/j.earscirev.2009.02.003
Williams, D., Wilkins, J., E., McCool, D., K., Baarstad, D., L., Klepper, L., L., and Papendick, B., I. R. (1998). A new rainfall simulator for use in low-energy rainfall areas. Appl. Eng. Agric. 14, 243–247. doi:10.13031/2013.19385
Yu, Y., Zhu, R., Ma, D., Liu, D., Liu, Y., Gao, Z., et al. (2022). Multiple surface runoff and soil loss responses by sandstone morphologies to land-use and precipitation regimes changes in the Loess Plateau, China. Catena 217, 106477. doi:10.1016/j.catena.2022.106477
Keywords: plot size, land management, applied research, viticulture, soil erosion processes, surface runoff, rainfall simulator
Citation: Neumann M, Kavka P, Devátý J, Stašek J, Strouhal L, Tejkl A, Kubínová R and Rodrigo-Comino J (2022) Effect of plot size and precipitation magnitudes on the activation of soil erosion processes using simulated rainfall experiments in vineyards. Front. Environ. Sci. 10:949774. doi: 10.3389/fenvs.2022.949774
Received: 21 May 2022; Accepted: 12 August 2022;
Published: 13 September 2022.
Edited by:
Riccardo Scalenghe, University of Palermo, ItalyReviewed by:
Eugenio Cavallo, Department of Engineering, ICT and Technology for Energy and Transport (CNR), ItalyTianjiao Feng, Beijing Forestry University, China
Antonio Jodar Abellan, University of Alicante, Spain
Gabriel Minea, National Institute of Hydrology and Water Management, Romania
Copyright © 2022 Neumann, Kavka, Devátý, Stašek, Strouhal, Tejkl, Kubínová and Rodrigo-Comino. This is an open-access article distributed under the terms of the Creative Commons Attribution License (CC BY). The use, distribution or reproduction in other forums is permitted, provided the original author(s) and the copyright owner(s) are credited and that the original publication in this journal is cited, in accordance with accepted academic practice. No use, distribution or reproduction is permitted which does not comply with these terms.
*Correspondence: Martin Neumann, bWFydGluLm5ldW1hbm5AZnN2LmN2dXQuY3o=