 Yinping Liu
 Yuhui Jiang1
 Zheng Shi
94% of researchers rate our articles as excellent or good
Learn more about the work of our research integrity team to safeguard the quality of each article we publish.
Find out more
ORIGINAL RESEARCH article
Front. Environ. Sci., 18 July 2022
Sec. Atmosphere and Climate
Volume 10 - 2022 | https://doi.org/10.3389/fenvs.2022.949271
This article is part of the Research TopicAir Pollution Remote Sensing and the Subsequent Interactions with Ecology on Regional ScalesView all 31 articles
The spatiotemporal distribution of cloud-to-ground (CG) lightning activities on the Yungui Plateau is investigated in this study by using a 5-year dataset (2016–2020) from the ground-based National Lightning Detection Network (CNLDN). The correlations between the lightning activities and different meteorological factors in the region are also analyzed. The results show that there is an obvious difference in the spatial distribution of lightning activities on the Yungui Plateau during the 5 years, with high lightning density in the east and low lightning density in the west. The lightning activities shift and gather more towards the eastern plateau especially after 2019. Affected by the quasi-stationary front in Kunming, the spatial distributions of lightning flashes in cold and warm seasons are different. On the other hand, the frequency of the lightning activities varies from year to year, such as the surge in 2019. But in general, 62% of the lightning activities are produced in summer and the lightning flashes occur more often in the afternoon and evening on the Yungui Plateau. Additionally, it is found that lightning activities in the 5 years are closely related to precipitation and temperature, while there is a weak correlation with relative humidity and almost no correlation with sensible heat flux. The analysis also indicates that the CAPE×P (convective available potential energy times precipitation rate) proxy can be effectively used to describe and predict lightning activities on the Yungui Plateau as the lightning flashes corresponds well to CAPE×P, especially of the spatial distribution.
As an important part of thunderstorm activities, the cloud-to-ground (CG) lightning flash is considered a highly destructive meteorological disaster. It may lead to power system faults, cause wildfires, and even threaten life safety (Krause et al., 2014; Veraverbeke et al., 2017). In order to reduce the harm of lightning activities and further understand them for lightning monitoring and forecasting, the characteristics of lightning activities under different climatic factors are studied, such as temperature (Price and Asfur, 2006), precipitation (Zheng et al., 2016), aerosol (Tan et al., 2016; Shi et al., 2020), convective available potential energy (CAPE) (Qie et al., 2003; Pawar et al., 2012), and sensible heat flux (Qie et al., 2004; Li et al., 2020). Because the lightning activity occurs with complex physical mechanisms that are closely related to these meteorological factors. In addition, the topography and geomorphology will also affect the occurrence of lightning flashes by changing the convective motion in the atmosphere (Ramesh Kumar and Kamra, 2012), so it is of great significance to study the temporal and spatial distribution characteristics of lightning activities in different regions.
In recent years, many researchers have studied lightning activities in China (Yang et al., 2015; Xu et al., 2022). In general, there are more lightning activities in the south than in the north of China and more in the east than in the west (Xu et al., 2022). The lightning density in the high-altitude and arid areas of western China is lower than that in the low-altitude and coastal areas of southeastern China. The distribution of lightning flashes in the plateau areas of China can be affected by the complex terrain (Yang et al., 2015). The Tibetan Plateau, the highest and largest plateau in the world, has unique circulation and climatic conditions. The lightning activities produced there is closely related to the plateau thermodynamics (Qie et al., 2004). The charge structure of the thunderstorm cloud and the characteristics of lightning activities are also distinct from others (Li et al., 2020). Possibly affected by the Tibetan Plateau (Yu et al., 2007; Zhang et al., 2014), the Sichuan Basin on the east of it is the only high lightning density center in western China (Yang et al., 2015). It is also a famous nocturnal precipitation basin, as lightning activities mostly occur at night (Xu and Zipser, 2011).
The Yungui Plateau is the transitional zone from the Tibetan Plateau to eastern hilly regions (Li and Yu, 2014). It is well known as a typical karst landform with unique topographic characteristics. There is a gradual decline of the terrain from the west to the southeast (Ge, 2021). Due to the uneven vertical distribution of heat caused by altitude, the climate patterns in the east and west of the Yungui Plateau are different. Lightning density on the Yungui plateau is also influenced by the topography (Yang et al., 2015). Based on satellite data, it is found that the lightning density in southern China and the Yungui Plateau is high (Ma et al., 2007). In addition, Ma et al. analyzed the lightning activities in China from December 2010 to February 2020, and concluded that the southwestern and southeastern sides of the Yungui Plateau are lightning-prone areas in winter (Ma et al., 2022). In recent years, there has been a warming trend on the Yungui Plateau (Shi and Chen, 2018; Ma et al., 2019). However, to the best of our knowledge, the specific analysis of lightning activities of this region remains in 2015 (Wu et al., 2017).
Is the lightning activity on the Yungui Plateau affected by the Tibetan Plateau? What is the relationship between lightning activities on the Yungui Plateau and its special topography and climate? Will the climate change on the Yungui Plateau affect the characteristics of lightning activities? In order to answer the above questions, in this paper, we focus on analyzing the spatiotemporal characteristics of CG lighting activities on the Yungui Plateau and the correlation with the meteorological factors. The results of this paper can provide a basic reference for lightning risk assessment and lightning protection in the Yungui Plateau and its surrounding areas.
The region of interest in this study, namely the Yungui Plateau (100°–111° E, 22°–30°N), is shown in Figure 1. The Yungui Plateau is located on the southeast of the Tibetan Plateau (Ge, 2021). It runs from the Hengduan mountains in the west to the Xuefeng Mountain in Hunan in the east and the Sichuan Basin lies on the north of it. Specifically, Yungui Plateau includes the eastern parts of Yunnan Province, whole area of Guizhou Province, northwestern parts of Guangxi Province and the borders of Sichuan, Hubei, Hunan, and other provinces. The terrain of the Yungui Plateau is rugged, with high in the northwest and low in the southeast. The climate of the Yungui Plateau is characterized by seasonal heavy rainfall and drought as a result of the control of the westerlies and summer monsoons of the southwest monsoon from Bay of Bengal and the East Asian monsoon from South China Sea (Wu et al., 2022).
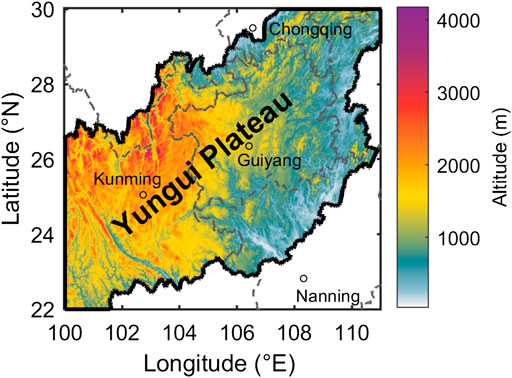
FIGURE 1. The region of interest (marked by the black line) selected in the study: Yungui Plateau (100°–111° E, 22°–30° N). The provincial boundaries are marked by a dotted gray line and the capitals of the provinces are marked.
The lightning dataset used in this paper is derived from the advanced time of arrival and direction (ADTD) detection system of the National Lightning Detection Network (CNLDN), which was established by the China Meteorological Administration in late 2000 (Zhang et al., 2022). It is said that the efficiency of this system can reach about 90%, and the locating accuracy error is around 300–500 m (Xu et al., 2022). The total number of the lightning activities happened on the Yungui Plateau between 2016 and 2020 obtained from the dataset is 9.42 × 10⁶, including the information of time, latitude, longitude, intensity, and location.
Based on the ERA5 dataset of the European Centre for Medium-Range Weather Forecasts (ECMWF) (Pérez-Invernón et al., 2021), the surface temperature, precipitation, surface sensible heat flux, relative humidity (850 hPa), CAPE and precipitation rate are collected to analyze the meteorological conditions of the Yungui Plateau from 2016 to 2020. The spatial resolution of the obtained data is 0.25° × 0.25°, and the temporal resolution is 1 month.
In order to ensure the reliability and accuracy of the analysis, the lightning data is preprocessed. The data outside the Yungui Plateau are cut, and then the results of three and below lightning detection sensors are deleted. As the cloud lightning flashes less than 10 kA and the CG lightning flashes cannot be reliably distinguished, the positive CG (PCG) lightning flashes with current less than 10 kA is deleted from the dataset (Zheng et al., 2016; Zhang et al., 2017). In addition, we group return strokes with time intervals less than 500 ms and horizontal distances less than 10 km as the same set of a lightning flash (Xie et al., 2013). Finally, the CG lightning data are resampled to grid data with spatial resolution of 0.25° × 0.25°.
Figure 2 shows the spatial distribution of annual average lightning density on the Yungui Plateau from 2016 to 2020. It is obvious that there are significant spatial differences in lightning activities on the Yungui Plateau. Specifically, the lightning density is high in the eastern plateau and low in the western plateau. This may be explained by the fact that the eastern plateau (east of the red dotted line in Figure 2) is classified in the eastern coastal humid and semi-humid region of China in Climatology (Ma et al., 2005). In addition, Guizhou, in the east of the plateau, is an area of typical karst landform and the tridimensional climate characteristics formed by the influence of topography are obvious, resulting in complex and changeable CG lightning activities in this region.
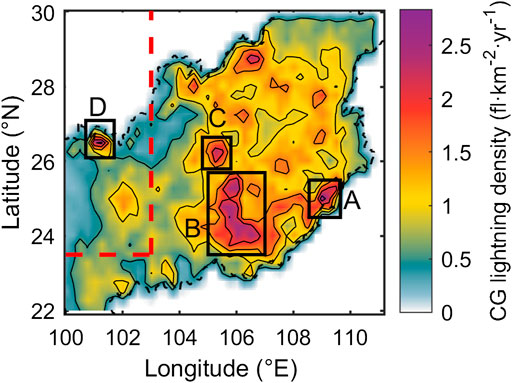
FIGURE 2. The spatial distribution of annual average lightning density on the Yungui Plateau from 2016 to 2020. The red dotted line is the dividing line of dry and humid regions in China. The regions with high lightning density are marked with black rectangles.
In Figure 2, the highest value of CG lightning density appears in region A (109°E, 25°N), located in the southeast of the Yungui Plateau, reaching 2.83 fl km−2·yr−1. The reason why the lightning activity is active here may be due to the influence of the sea position. This area is close to the South China Sea, rich in water vapor and sufficient rainfall. Figure 2 also shows three regions with high lightning density over the 5 years on the Yungui Plateau. Region B lies in the eastern part of Yunnan Province, where the warm and humid airflow uplifted by the terrain in summer is conducive to the development of thunderstorms (Li et al., 2008). The reason for high lightning density in region C, namely the west side of Guizhou, may be that it is blocked by Wumeng Mountain and located on the southeast monsoon windward slope with abundant precipitation. Region D, on the north side of Yunnan region, is located at the junction of Lijiang and Panzhihua. It belongs to the south-central part of the Panxi rift valley, where the maximum altitude difference is more than 3,000 m. The center of the lightning density appears in the area of the valley, where is appropriate to the occurrence of lightning activities (Li et al., 2020). Also, the Hengduan Mountain near it belongs to the southeast corner of the Tibetan Plateau. The influence of lightning activities produced on the Tibetan Plateau makes the average annual lightning density in the area of the Hengduan Mountain larger.
Figure 3 shows that the inter-annual variation of the spatial distribution of the lightning density on the Yungui Plateau is obvious from 2016 to 2020. In general, there is no significant difference in the distribution of the high lightning density area in each year. However, the lightning activities in the first 3 years are uniformly distributed. Since 2019, lightning activities have remarkably shifted to the central and eastern parts of the Yungui Plateau. By 2020, lightning activity had been more concentrated in the middle and eastern plateau.
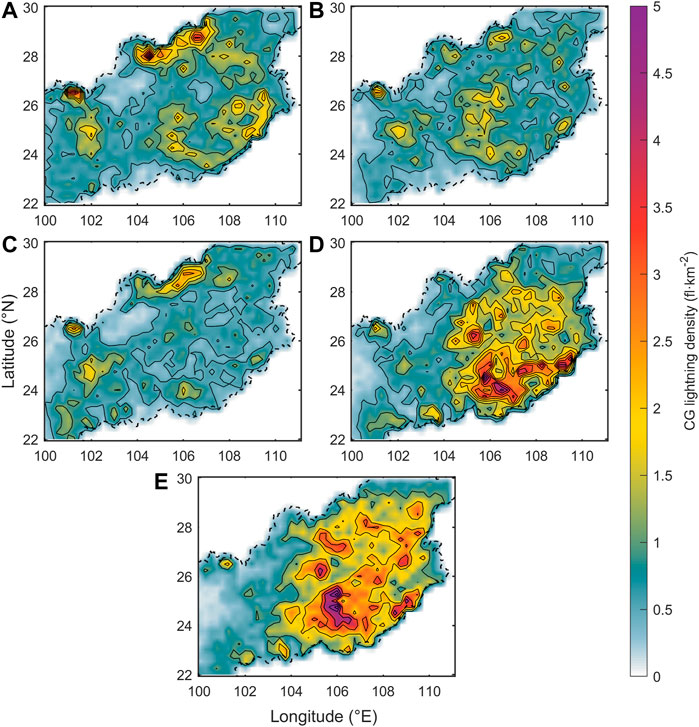
FIGURE 3. The inter-annual variation of the spatial distribution of the lightning density on the Yungui Plateau from 2016 to 2020: (A) 2016, (B) 2017, (C) 2018, (D) 2019, and (E) 2020.
Figure 4 shows the seasonal distribution of average lightning density on the Yungui Plateau between 2016 and 2020. It can be seen that the distribution in spring and winter are highly consistent, with lightning flashes are mainly concentrated in the eastern side of the Yungui Plateau. The consistency of summer and autumn is also strong, as the lightning events mainly occur on the central and western Yungui Plateau. This may be related to the Kunming quasi-stationary front. In winter, during the southward movement of cold air from northern China, blocked by the terrain of Yungui Plateau, the cold air keeps still here and forms a quasi-stationary front. The specific position is about 103.5°E ∼ 104°E. It is characterized by significant differences in cloud and rainfall (Qian and Fu, 2010; Du et al., 2007). Therefore, there is more rainfall in the east of Kunming stationary front in winter, which may be the cause of dense lightning flashes. In addition, in summer and autumn, lightning activities is active near 102°E, 26°N, while there is almost no lightning activity in spring and winter in this region. This may be due to the unique climate model of Yungui Plateau. The west-wind drift in the southern margin of the Tibetan Plateau sinks on the leeward side of the high ridge in the western Hengduan Mountains, inhibiting precipitation and increasing surface temperature. Therefore, the area west of 104°E can be divided into obvious drought (from November to April) and rainy season (from May to October) (Li and Yu, 2014). Most rainfall and its frequency are concentrated in the rainy season, controlled by the southwest summer monsoon.
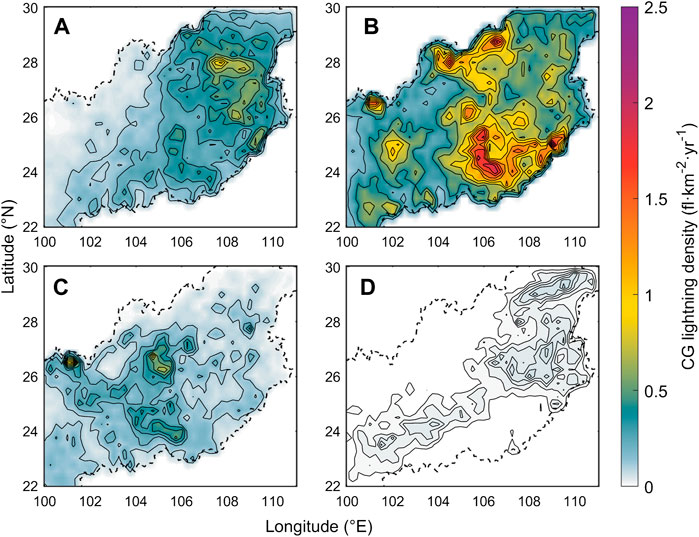
FIGURE 4. The seasonal distribution of average lightning density on the Yungui Plateau between 2016 and 2020: (A) Spring, (B) Summer, (C) Autumn, and (D) Winter.
The distribution of lightning frequency and the proportion of PCG lightning flashes on the Yungui Plateau from 2016 to 2020 is shown in Figure 5. It is found that Yungui Plateau is a lightning-prone area, with the total frequency of lightning flashes during the 5 years reaches 3.4×10⁶ and the annual average frequency reaches 6.8 × 10⁵. Secondly, there is an obvious inter-annual variation of the lightning frequency. From 2016 to 2018, the total frequency of CG lightning flashes decreased slowly, from 6.1 × 10⁵ to 4.5 × 10⁵. However, there was a surge to 8.1 × 10⁵ in 2019, and next year it increased to nearly one million.
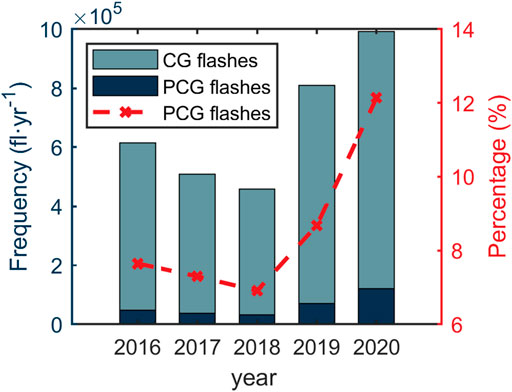
FIGURE 5. The distribution of CG and PCG lightning frequency (y-axis on the left) and the proportion of PCG lightning flashes (y-axis on the right) on the Yungui Plateau from 2016 to 2020.
By comparing the frequency of PCG and negative CG lightning activities in Figure 5, it can also be found that the negative CG lightning flashes has the dominant role on the Yungui Plateau, with only 9.1% of the flashes are PCG lightning flashes. The frequency of negative CG lightning flashes is far greater than that of positive ones. This may be closely related to the distribution structure of the charge in the cloud. The charge generally presents a dipole distribution. Therefore, under the action of the atmospheric electric field, the negative charge is closer to the ground and discharges to the ground. The positive charge is far from the ground, so its probability of discharge to the ground is smaller than that of the negative charge. However, especially after 2018, there was a substantial growth in the proportion of PCG lightning flashes, which may be the result from the changes in cloud depth, environmental conditions, and topography (Yang et al., 2015).
Figure 6 is the line chart of the average current intensity of positive and negative CG lightning flashes from 2016 to 2020. It can be found that in these 5 years, the average intensity of PCG lightning flashes is always greater than that of negative ones. This is mainly because the occurrence opportunity of positive flashes is less than that of negative flashes. The charge in the thunderstorm cloud needs to be conserved, so the intensity of the PCG lightning flashes will be correspondingly greater than that of the negative CG lightning flashes. To be specific, the average intensity of PCG lightning flashes in the 5 years is 64 kA, which is about 1.3 times of the average intensity of negative CG lightning flashes.
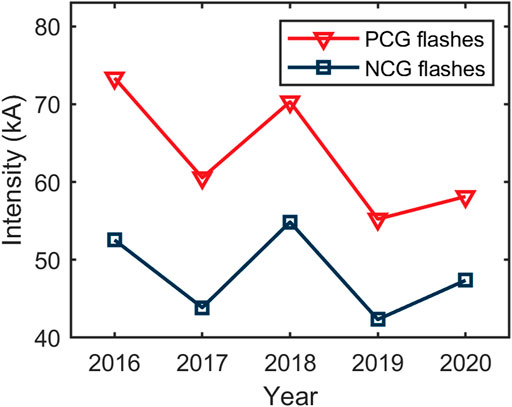
FIGURE 6. The line chart of the average current intensity of positive and negative CG lightning flashes from 2016 to 2020.
Figure 7A shows the monthly distribution of the lightning frequency on the Yungui Plateau from 2016 to 2020. In general, most of the lightning activities happen in summer (June ∼ August), accounting for around 62% of the lightning flashes. While the flashes in winter (December ∼ February) are only about 1%. This is consistent with previous results, that CG lightning activities mainly occurs in the warm season (Xie et al., 2013), as a result of prevailed convection in this season. In addition, it can also be found that, except for 2020, the monthly distribution of lightning frequency in other years presents double peaks, that is, lightning activities also peaks in the spring. This may be due to the intense heating and convective precipitation during the pre-monsoon season (Chandra et al., 2021).
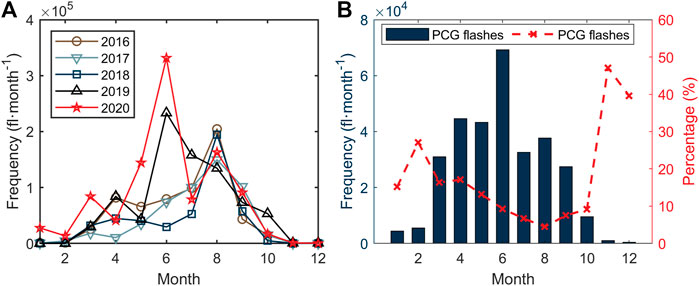
FIGURE 7. (A) The monthly distribution of the lightning frequency on the Yungui Plateau from 2016 to 2020. (B) The monthly distribution of the frequency and percentage of PCG lightning activities.
The monthly distribution of the frequency and percentage of PCG lightning activities can be seen from Figure 7B. The percentage of PCG lightning flashes in cold season is much higher than that in warm season. This is consistent with previous research results (Xie et al., 2013). In November, the percentage of PCG lightning flashes even reaches nearly 50%. There is a negative correlation between the number of lightning activities and the proportion of PCG lightning flashes in this region.
Figure 8 shows the 24-h variation of lightning frequency on the Yungui Plateau, including the frequency of CG lightning activities and the percentage of PCG lightning flashes. Overall, lightning activities occur more frequently in the afternoon and evening, especially between 16 and 18 p.m., with a maximum at 17 p.m. There are fewer lightning activities produced in the morning, with a valley at 10 a.m. This may be because the strengthening of solar radiation in the afternoon, which radiates through the atmosphere to the ground and changes the temperature of the underlying surface. The atmosphere near the ground absorbs more heat, resulting in the atmospheric convergence and uplift of the ground. The convection forms, which will promote the formation of convective clouds and further strengthen the lightning activities. The proportion of PCG lightning flashes is inversely proportional to the total frequency of CG lightning flashes, peaking in the morning and reaching the valley value in the afternoon.

FIGURE 8. The 24-h variation of lightning frequency on the Yungui Plateau, including the frequency of CG lightning activities (y-axis on the left) and the percentage of PCG lightning flashes (y-axis on the right).
Lightning activities are affected by many meteorological factors at the same time. In order to further explore the possible effects of various meteorological factors on the temporal and spatial distribution of lightning activities on the Yungui Plateau, the Pearson linear correlation coefficients between the lightning frequency and various influencing factors are calculated and analyzed. Figure 9 shows the correlations between monthly lightning frequency in the 5 years from 2016 to 2020 and the meteorological factors selected in the corresponding time and region. It can be found that among the four selected meteorological factors, the lightning activity on the Yungui Plateau has a high correlation with precipitation and temperature, reaching 0.75 and 0.72, respectively. The correlation between lightning activities and relative humidity is weak, and it is almost irrelevant to sensible heat flux. In other words, the precipitation in Yungui Plateau, including the difference in rainfall distribution caused by the Kunming quasi-stationary front mentioned above, can indeed have a significant indigenous impact on lightning activities in the region.
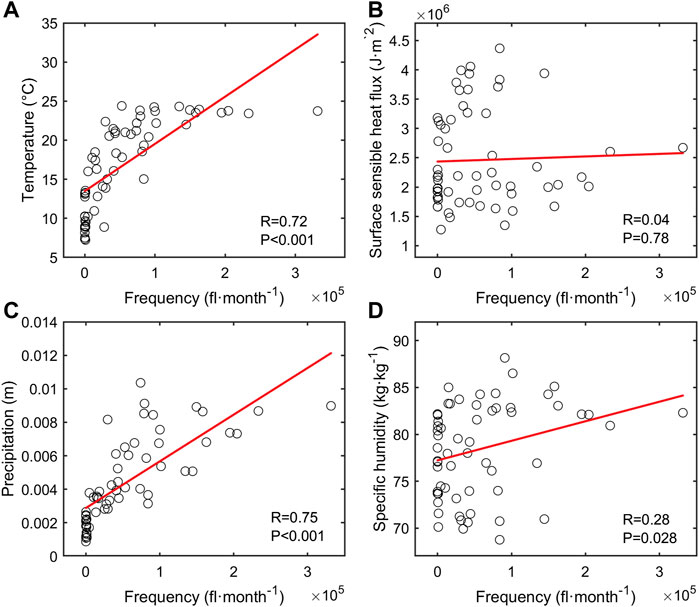
FIGURE 9. The correlations between monthly lightning frequency in the 5 years from 2016 to 2020 and the meteorological factors selected in the corresponding time and region: (A) Temperature, (B) Surface sensible heat flux, (C) Precipitation, and (D) Specific humidity (850 hPa). R represents the value of correlation coefficient and p shows the significance level.
Due to the complexity of the lightning event, it is widely recognized that it is difficult to describe the generation and development of the lightning activity through specific physical processes. Romps et al. explained 77% of the temporal and spatial distribution of CG lightning activities in the United States and predicted the lightning density by using CAPE×P (convective available potential energy times precipitation rate) proxy (Romps et al., 2014). After being validating and evaluating (Romps et al., 2018; Tippett et al., 2019; Zhao et al., 2022), it turns out that CAPE×P can indirectly describe and quantify lightning-related atmospheric processes under certain conditions.
Figure 10 is the scatter plot of the correlation between monthly lightning frequency and CAPE×P on the Yungui Plateau from 2016 to 2020. It can be seen that there is a strong correlation between CAPE×P and the lightning activity, reaching 0.81.
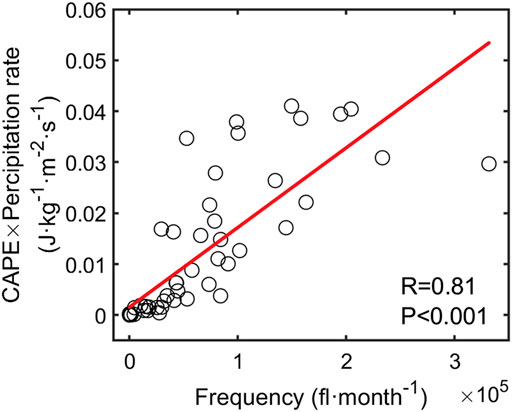
FIGURE 10. The scatter plot of the correlation between monthly lightning frequency and CAPE×P on the Yungui Plateau from 2016 to 2020.
The specific temporal and spatial distribution relationships between CAPE×P and lightning activities on the Yungui Plateau are shown in Figures 11, 12. It can be seen from Figure 11 that in the 5 years from 2016 to 2020, the trend of monthly change of CAPE×P is consistent with the corresponding frequency of lightning flashes, especially the time when the annual peak appears. In terms of the extent of change, the change of CAPE×P and lightning frequency is very similar in the cold seasons each year. In the warm seasons, especially in summer, the change of CAPE×P is much higher than that of lightning frequency except in 2020. This indicates that there may be other factors that affect CG lightning activities on the Yungui Plateau in summer.

FIGURE 11. The monthly temporal distribution of the lightning frequency (y-axis on the left) and CAPE×P (y-axis on the right) on the Yungui Plateau from 2016 to 2020.
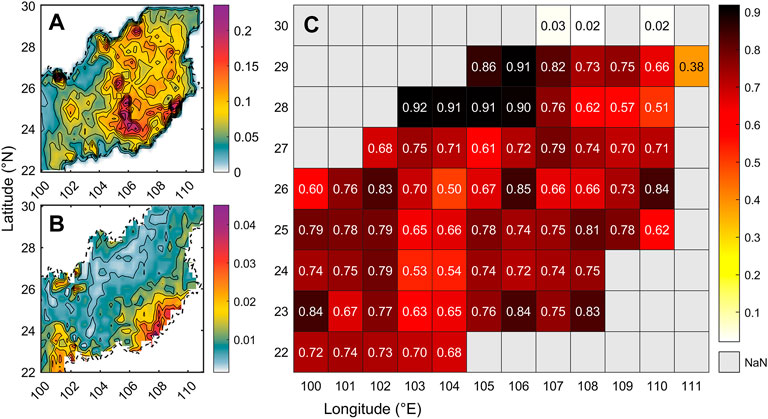
FIGURE 12. (A) The monthly spatial distribution of the lightning density (fl·km−2·month−1) on the Yungui Plateau from 2016 to 2020. (B) Same as (A) but for CAPE×P (J·kg−1·m−1·s−1). (C) The spatial distribution of correlation coefficients between the spatial distribution of monthly density of lightning flashes and the spatial distribution of monthly CAPE×P in the 5 years. The spatial resolution is 1° × 1°.
Figure 12C shows the corresponding relationship between the spatial distribution of monthly density of lightning flashes (Figure 12A) and the spatial distribution of monthly CAPE×P (Figure 12B) in the 5 years. It can be clearly seen that except for the northeastern margin of the Yungui Plateau, the spatial distribution correlation of the region is above 0.5, which proves that the density of the lightning activities in the region is correlated with the spatial distribution of CAPE×P. This also indicates that CAPE×P could be effectively used to describe and predict lightning activities on the Yungui Plateau.
Based on the ADTD ground-based lightning location data on the Yungui Plateau from 2016 to 2020, the temporal and spatial distribution characteristics of lightning activities were obtained. Combined with the reanalysis meteorological data of ERA5, the correlations between lightning activities and different meteorological factors during this period were analyzed. Finally, the relationship between CAPE×P and the frequency of lightning activities in this area was studied. The main conclusions of this paper are as follows:
1) There is a significant difference in the spatial distribution of the lightning activities on the Yungui Plateau, showing high lightning density in the east and low lightning density in the west. During the years from 2016 to 2020, the spatial distribution of lightning activities on the Yungui Plateau presents obvious interannual variations. There is an eastward migration and accumulation of lightning flashes after 2019. Due to the influence of Kunming quasi-stationary front, the spatial distribution of lightning activities in cold and warm seasons of Yungui Plateau is significantly different.
2) The CG lightning activities on the Yungui Plateau is mainly dominated by negative flashes, and the difference in the temporal distribution of the lightning activities is also significant. There has been an obvious surge in the lightning frequency since 2019. Most CG lightning flash occurs in summer, but the percentage of PCG lightning flashes is the lowest during this period. In addition, lightning activities occur more frequently in the afternoon and evening.
3) Lightning activities on the Yungui Plateau are mainly affected by precipitation and temperature. The correlation between lightning activities and relative humidity is weak, and it is almost irrelevant to sensible heat flux. In addition, the CAPE×P proxy is closely related to the lightning activity, especially spatial distribution. This indicates that CAPE×P proxy can be effectively used to describe and predict lightning activities on the Yungui Plateau.
It is undeniable that the above analysis of lightning activities on the Yungui Plateau could be affected by the efficiency and accuracy of lightning location system. In the future, we will try to use longer-term observation data to further explore the corresponding relationship between lightning activities and its topography and climate in the region.
The original contributions presented in the study are included in the article/supplementary material, further inquiries can be directed to the corresponding author.
YL and YJ contributed to conception and design of the study. ZS and JH contributed to data collection. YL, YJ, QG, and ZJ wrote the first draft of the manuscript. All authors contributed to manuscript revision approved the submitted version.
This work was supported by the Natural Science Foundation of China (41575004) and the Jiangsu Provincial Natural Science Foundation of China (BK20150903).
The authors declare that the research was conducted in the absence of any commercial or financial relationships that could be construed as a potential conflict of interest.
All claims expressed in this article are solely those of the authors and do not necessarily represent those of their affiliated organizations, or those of the publisher, the editors and the reviewers. Any product that may be evaluated in this article, or claim that may be made by its manufacturer, is not guaranteed or endorsed by the publisher.
Chandra, S., Siingh, D., Jeni Victor, N., and Kamra, A. K. (2021). Lightning activity over South/Southeast Asia: Modulation by thermodynamics of lower atmosphere. Atmos. Res. 250, 105378. doi:10.1016/j.atmosres.2020.105378
Du, Z., Ding, Z., and Zhang, S. (2007). Analysis of atmospheric circulation and structure of Yunnan-Guizhou quasi-stationary front during its evolution. J. Trop. Meteor. 23, 284–292. doi:10.3969/j.issn.1004-4965.2007.03.011
Ge, W., Han, J., Zhang, D., and Wang, F. (2021). Divergent impacts of droughts on vegetation phenology and productivity in the Yungui Plateau, southwest China. Ecol. Indic. 11, 107743. doi:10.1016/j.ecolind.2021.107743
Krause, A., Kloster, S., Wilkenskjeld, S., and Paeth, H. (2014). The sensitivity of global wildfires to simulated past, present, and future lightning frequency. J. Geophys. Res. Biogeosci. 119, 312–322. doi:10.1002/2013JG002502
Li, J., Wu, X., Yang, J., Jiang, R., Yuan, T., Lu, J., et al. (2020). Lightning activity and its association with surface thermodynamics over the Tibetan Plateau. Atmos. Res. 245, 105118. doi:10.1016/j.atmosres.2020.105118
Li, J., and Yu, R. (2014). Characteristics of cold season rainfall over the Yungui plateau. J. Appl. Meteorol. Climatol. 53, 1750–1759. doi:10.1175/JAMC-D-13-0285.1
Li, Y., Wei, N., Niu, S., Luo, N., Wen, J., and Huang, H. (2008). “Spatial and temporal characteristics of cloud to ground lightning in Guizhou province,” in 2008 Fifth International Conference on Fuzzy Systems and Knowledge Discovery, Jinan Shandong, China, 18-20 October 2008 (IEEE), 660–664. doi:10.1109/FSKD.2008.491
Ma, J., Weng, B., Bi, W., Xu, D., Xu, T., Yan, D., et al. (2019). Impact of climate change on the growth of typical crops in karst areas: A case study of Guizhou province. Adv. Meteorology 2019, 1–16. doi:10.1155/2019/1401402
Ma, M., Huang, X., Fei, J., Zhang, C., Li, C., Cheng, X., et al. (2022). Analysis of the winter cloud-to-ground lightning activity and its synoptic background in China during 2010–20. Adv. Atmos. Sci. 39, 985–998. doi:10.1007/s00376-021-1260-2
Ma, M., Lyu, W., Zhang, Y., and Meng, Q. (2007). Analysis of lightning activity in China. METEOROLOGICAL Sci. Technol. 35, 1–7. doi:10.3390/atmos10060298
Ma, M., Tao, S., Zhu, B., and Lü, W. (2005). Climatological distribution of lightning density observed by satellites in China and its circumjacent regions. Sci. China Ser. D-Earth. Sci. 48, 219–229. doi:10.1360/03yd0204
Pawar, S. D., Lal, D. M., and Murugavel, P. (2012). Lightning characteristics over central India during Indian summer monsoon. Atmos. Res. 106, 44–49. doi:10.1016/j.atmosres.2011.11.007
Pérez-Invernón, F. J., Huntrieser, H., Gordillo-Vázquez, F. J., and Soler, S. (2021). Influence of the COVID-19 lockdown on lightning activity in the Po Valley. Atmos. Res. 263, 105808. doi:10.1016/j.atmosres.2021.105808
Price, C., and Asfur, M. (2006). Inferred long term trends in lightning activity over Africa. Earth Planets Space 58, 1197–1201. doi:10.1186/BF03352010
Qian, W., and Fu, J. (2010). Frontal Genesis of moisture atmosphere during the early 2008 persistent freezing-rain event in southern China. Sci. China Earth Sci. 53, 454–464. doi:10.1007/s11430-009-0101-4
Qie, X. S., Yuan, T., Xie, Y. R., and Ma, Y. M. (2004). Spatial and temporal distribution of lightning activities on the Tibetan plateau. Chin. J. Geophys. 47, 1122–1127. doi:10.1002/cjg2.596
Qie, X., Toumi, R., and Zhou, Y. (2003). Lightning activity on the central Tibetan Plateau and its response to convective available potential energy. Chin. Sci. Bull. 48, 296–299. doi:10.1007/BF03183302
Ramesh Kumar, P., and Kamra, A. K. (2012). The spatiotemporal variability of lightning activity in the Himalayan foothills: Lightning in the Himalayan Foothills. J. Geophys. Res. 117, n/a. doi:10.1029/2012jd018246
Romps, D. M., Charn, A. B., Holzworth, R. H., Lawrence, W. E., Molinari, J., Vollaro, D., et al. (2018). CAPE times P explains lightning over land but not the land‐ocean contrast. Geophys. Res. Lett. 45, 630–712. doi:10.1029/2018GL080267
Romps, D. M., Seeley, J. T., Vollaro, D., and Molinari, J. (2014). Projected increase in lightning strikes in the United States due to global warming. Science 346, 851–854. doi:10.1126/science.1259100
Shi, H., and Chen, J. (2018). Characteristics of climate change and its relationship with land use/cover change in yunnan province, China: Climate change and its relationship with land use/cover change. Int. J. Climatol. 38, 2520–2537. doi:10.1002/joc.5404
Shi, Z., Wang, H., Tan, Y., Li, L., and Li, C. (2020). Influence of aerosols on lightning activities in central eastern parts of China. Atmos. Sci. Lett. 21, e957. doi:10.1002/asl.957
Tan, Y. B., Peng, T., and Chen, H. R. (2016). Lightning flash density in relation to aerosol over Nanjing (China). Atmos. Res. 174–175, 1–8. doi:10.1016/j.atmosres.2016.01.009
Tippett, M. K., Lepore, C., Koshak, W. J., Chronis, T., and Vant‐Hull, B. (2019). Performance of a simple reanalysis proxy for U.S. cloud‐to‐ground lightning. Int. J. Climatol. 39, 3932–3946. doi:10.1002/joc.6049
Veraverbeke, S., Rogers, B. M., Goulden, M. L., Jandt, R. R., Miller, C. E., Wiggins, E. B., et al. (2017). Lightning as a major driver of recent large fire years in North American boreal forests. Nat. Clim. Chang. 7, 529–534. doi:10.1038/nclimate3329
Wu, A., Wu, S., Zeng, Y., and Zhang, S. (2017). Analysis of the characteristics of lightning activities in Yunnan Guizhou Plateau. Insulators Surge Arresters. 02, 74–79,84. doi:10.16188/j.isa.1003-8337.2017.02.015
Wu, H., Fu, C., Zhang, C., Zhang, J., Wei, Z., and Zhang, X. (2022). Temporal variations of stable isotopes in precipitation from Yungui plateau: Insights from moisture source and rainout effect. J. Hydrometeorol. 23, 39–51. doi:10.1175/JHM-D-21-0098.1
Xie, Y., Xu, K., Zhang, T., and Liu, X. (2013). Five-year study of cloud-to-ground lightning activity in Yunnan province, China. Atmos. Res. 129–130, 49–57. doi:10.1016/j.atmosres.2012.12.012
Xu, M., Qie, X., Pang, W., Shi, G., Liang, L., Sun, Z., et al. (2022). Lightning climatology across the Chinese continent from 2010 to 2020. Atmos. Res. 275, 106251. doi:10.1016/j.atmosres.2022.106251
Xu, W., and Zipser, E. J. (2011). Diurnal variations of precipitation, deep convection, and lightning over and east of the eastern Tibetan plateau. J. Clim. 24, 448–465. doi:10.1175/2010JCLI3719.1
Yang, X., Sun, J., and Li, W. (2015). An analysis of cloud-to-ground lightning in China during 2010–13. WEATHER Forecast. 30, 1537–1550. doi:10.1175/waf-d-14-00132.1
Yu, R., Zhou, T., Xiong, A., Zhu, Y., and Li, J. (2007). Diurnal variations of summer precipitation over contiguous China. Geophys. Res. Lett. 34, L01704. doi:10.1029/2006GL028129
Zhang, C., Lu, W., Chen, L., Qi, Q., Ma, Y., Yao, W., et al. (2017). Influence of the Canton Tower on the cloud‐to‐ground lightning in its vicinity. J. Geophys. Res. Atmos. 122, 5943–5954. doi:10.1002/2016JD026229
Zhang, Y., Sun, J., and Fu, S. (2014). Impacts of diurnal variation of mountain-plain solenoid circulations on precipitation and vortices east of the Tibetan Plateau during the mei-yu season. Adv. Atmos. Sci. 31, 139–153. doi:10.1007/s00376-013-2052-0
Zhang, Y., Zhang, Y., Zou, M., Wang, J., Li, Y., Tan, Y., et al. (2022). Advances in lightning monitoring and location technology research in China. Remote Sens. 14, 1293. doi:10.3390/rs14051293
Zhao, P., Xiao, H., Liu, C., Zhou, Y., Xu, X., Hao, K., et al. (2022). Evaluating a simple proxy for climatic cloud‐to‐ground lightning in Sichuan Province with complex terrain, Southwest China. Int. J. Climatol. 42, 3909–3927. doi:10.1002/joc.7451
Keywords: cloud-to-ground lightning, spatiotemporal characteristics, Yungui Plateau, ground-based remote sensing, ADTD, CAPE times precipitation rate
Citation: Liu Y, Jiang Y, Gao Q, Shi Z, Jiang Z and Hu J (2022) Characteristic analysis of lightning activities on the Yungui Plateau using ground-based remote sensing. Front. Environ. Sci. 10:949271. doi: 10.3389/fenvs.2022.949271
Received: 20 May 2022; Accepted: 28 June 2022;
Published: 18 July 2022.
Edited by:
Xinyao Xie, Institute of Mountain Hazards and Environment (CAS), ChinaReviewed by:
Chunlong Zhang, West Anhui University, ChinaCopyright © 2022 Liu, Jiang, Gao, Shi, Jiang and Hu. This is an open-access article distributed under the terms of the Creative Commons Attribution License (CC BY). The use, distribution or reproduction in other forums is permitted, provided the original author(s) and the copyright owner(s) are credited and that the original publication in this journal is cited, in accordance with accepted academic practice. No use, distribution or reproduction is permitted which does not comply with these terms.
*Correspondence: Yinping Liu, eXVhbjg1MDNAMTYzLmNvbQ==
Disclaimer: All claims expressed in this article are solely those of the authors and do not necessarily represent those of their affiliated organizations, or those of the publisher, the editors and the reviewers. Any product that may be evaluated in this article or claim that may be made by its manufacturer is not guaranteed or endorsed by the publisher.
Research integrity at Frontiers
Learn more about the work of our research integrity team to safeguard the quality of each article we publish.