 Xingmin Zhang
 Yihan Wu
- 1West Institute for Economic Research, Southwestern University of Finance and Economics, Chengdu, China
- 2College of Finance, Nanjing Agricultural University, Nanjing, China
Large-scale sports events can improve public environmental awareness, strengthen urban governance, and push green innovation. However, it may also increase the burden on infrastructure, cause energy consumption, and lead to some pollution. Using the panel data of 278 cities in China from 2006 to 2019, this study systematically discusses how comprehensive sports events affect the green and low-carbon development of Chinese cities. First, the green total factor productivity and carbon emission efficiency calculated by the SBM-DEA model are taken as proxy variables of green and low-carbon development. And then, the spatial difference-in-differences (SDID) model is used to undertake empirical analysis and further test the impact mechanism and heterogeneity. Four main results are derived from this study: 1) the hosting of comprehensive sports events can significantly enhance the green and low-carbon development of cities. This result is still valid after a whole string of robustness tests; 2) comprehensive sports events have a significant positive spatial spillover effect on the green and low-carbon development of adjacent cities; 3) the mechanism analysis shows that comprehensive sports events can encourage green development of cities through technological innovation, sports industry development, and foreign investment, but through foreign investment, sports events cannot significantly affect the green total factor productivity and carbon emission efficiency of host cities; and 4) heterogeneity exists between the city rank and the event level. The promotional effect of comprehensive sports events on cities’ green and low-carbon development is more significant in first-tier cities and for international events.
1 Introduction
Centering on “green economy” and “sustainable development,” the 2012 United Nations Conference on sustainable development emphasized that countries give higher priority to issues such as environment and energy. Transforming our World: The 2030 Agenda for Sustainable Development of the United Nations also further emphasizes the vision of promoting sustainable human development. China has always made much account of the construction of ecological civilization. 2050 China Energy and
Meanwhile, for the sake of accelerating the construction of a powerful sports country, the State Council promulgated the National Fitness Program (2021–2025), which requires extensive fitness events and increases the supply of fitness venues and facilities. In addition, the scale and frequency of global sports events have increased significantly over recent years. With the amelioration of comprehensive national strength, China has also become a gathering place for comprehensive sports events. For instance, in 2022, China hosted the Olympic and Paralympic Winter Games Beijing 2022 and is about to host the Chengdu 2021 FISU World University Games and the 19th Asian Games Hangzhou 2022, and the other comprehensive sports events. Particularly in the context of the prevalence of COVID-19, according to the report of the World Bank, blockade and other measures taken by countries will affect the pace of progress toward the Sustainable Development Goal (SDG 7), including renewable energy and energy efficiency. However, these human activities may lead to energy consumption and severely affect the ecosystem (Yu et al., 2022b; Ke et al., 2022), thus hindering sustainable economic development (Huo et al., 2022). So, the current environmental problems have become an urgent and important topic.
In the past, the holding of comprehensive sports events could be regarded as the opposite of environmental protection because such events can not only improve the status and image of the host city, increase employment opportunities (Mao et al., 2020), and promote economic development (Huang, 2011) but also have some negative effects on the city, including traffic congestion, noise pollution, and excessive energy consumption (Mei and Bao, 2018; Guo et al., 2021; Zhong et al., 2021), and even affect adjacent cities and other cities (Chen S et al., 2021). Hence, the International Olympic Committee, as a key player in the global sport’s governance system, listed the environment as the third pillar after sports and culture in 1994. The purpose of this is to encourage countries to combine large-scale sports events with the environment to attain a win–win–win situation for sports competition, environmental protection, and even economic development. The Olympic 2020 Agenda adopted in 2014 directly introduced the concept of “sustainability.” The city is an important carrier for the local economy. How it grasps the opportunity and realizes green and low-carbon development while holding large-scale sports events is particularly important.
Fortunately, in China, comprehensive sports events and environmental protection do not seem to be contradictory. BOCOG implements the concept of “green, shared, open, and honest” sustainability—toward the future—sustainable development report of the Beijing Winter Olympic Games (before the games) and also fully demonstrates the phased achievements of environmental sustainability and Green Olympics. In fact, as a means to enhance the image and status of the host city (Li and Zhao, 2009), the government usually takes environmental protection measures before and during large-scale sports events to better the urban ecological situation, R&D expenditure, and renewable energy, which can often make contributions to environmental quality (Khan et al., 2021d; Awosusi et al., 2022). Therefore, the holding of comprehensive sports events is often conducive to the green and low-carbon development of cities. Specifically, in terms of environmental regulation, Beijing fully noticed that air pollution was a problem of regional dynamic transmission in 2008. The “Beijing Blue” harvested during the Olympic Games verified the effectiveness of the regional linkage of six provinces and cities such as Beijing, Tianjin, and Hebei in air pollution prevention and control. After the practice test of the Beijing Summer Olympics, the State Council established the Beijing–Tianjin–Hebei joint prevention and control mechanism and the Yangtze River Delta joint prevention and control mechanism. This concept of joint prevention and control of air pollution and regional linkage has successful experiences of air quality assurance for other large-scale events to go by. For example, in 2014, the Yangtze River Delta also guaranteed the atmospheric environmental quality during the Nanjing Youth Olympic Games through joint prevention and control. With regard to urban traffic management, Beijing encourages residents to choose public transport by optimizing the public transport network and reducing bus fares. It also strengthened the pollution control of motor vehicles and allowed low-emission private cars to pass (Wu and Zhang, 2008). Shenzhen’s bid to host the Summer Universiade in 2011 was successful, and the practice is also in line with it. For example, the construction of the greenway network in the Pearl River Delta has been implemented. The “demonstration operation scheme of new energy vehicles” has also been implemented, and residents are encouraged to “voluntarily stop driving.” In addition, in terms of technological innovation, Shenzhen actively develops “green buildings,” encourages green innovation, and promotes green industrial transformation. In 2022, the Winter Olympic Games held in Beijing adopted “green” as the primary concept, which fully demonstrated the correlation between sports events and urban green development. The original technology and core technology research and development of its ice and snow equipment industry also released multiple dividends for green and low-carbon development. After all, technological innovation is conducive to alleviating energy demand and promoting sustainable development (Yu et al., 2022a).
In view of the abovementioned analysis, if we only evaluate the economic benefits of comprehensive sports events, we tend to generalize and cannot accurately evaluate the internal value such as the ecological and environmental effects of the events. Therefore, this study raises the following three research questions: 1) Will the holding of comprehensive sports events bring positive external effects to the green and low-carbon development of the host city and other cities? 2) If so, through what mechanisms? 3) Which level of host city or event will bring a greater impact? To solve the abovementioned problems, this study used quasi-natural experiments to test.
2 Literature Review
At present, many studies have focused on sports events and urban development. These documents have been explored mainly from the perspectives of economy, society, and environment. Regarding economic impacts, some scholars believe that the holding of sports events will attract a lot of investment (Siegfried and Zimbalist, 2000) and improve urban infrastructure construction (Lindau et al., 2016), but the main source is government departments, which may crowd out private-sector investment to a certain extent. At the same time, the host city will also take a series of measures for urban renewal, such as the transformation of old urban areas and increase in groundwater levels (Wu and Zhang, 2008), which can provide a large number of jobs (Baumann et al., 2012) so as to accelerate the expansion of the tertiary industry, including sports industry and tourism. The Beijing Summer Olympics contributed not only to the formation of the sports industry chain (Huang, 2011) but also to the tourism development caused by the fact that it is considered to be a channel to directly boost the economy (Shao et al., 2018), including event sports tourism and nostalgic sports tourism (Gibson, 1998). This may precipitate urban industrial clusters and optimize industrial structures. The flow of tourists may even set in motion the economic development of peripheral regions (Zhang and Zhao, 2008; Fourie and Santana-Gallego, 2011) because the expansion of the tourist scale can not only bring additional tourism consumption but also drive the development of transportation, hotel services, and other industries (Nie et al., 2016). However, the entry of a large number of foreign tourists may also cause traffic congestion and low work efficiency, which will retard economic development (Matheson, 2005).
As for the social benefits of sports events, scholars have mainly carried out research on the aspects of public crime perception, participation consciousness, and subjective well-being, as well as on government policies. Swart et al. (2017) pointed out that the possibility of tourists visiting the city again after sports events is largely affected by their perception of the city’s crime risk. In addition, because social participation has an important impact on the organization and planning of large-scale activities and even on environmental sustainability (Lamberti et al., 2011; Lin R. et al., 2022), scholars have also carried out research from the point of public participation. In essence, large-scale sports events are quasi-public goods, which can improve resident awareness of environmental protection (Wu and Zhang, 2008). Subsequently, Pawlowski et al. (2014) tested the relationship between sports event success and subjective well-being by investigating “resident’ perception.” Kim et al. (2015) also used this method to verify public support for holding sports events. Moreover, the Beijing Summer Olympics also changed the sports policy of the Chinese government, which is reflected in the transformation from a big sports nation to a world sports power; that is, it began to be guided by the national sports policy (Tan, 2015).
About environmental impacts, many scholars believe that with some measures taken, the holding of sports events promotes the sustainable development of the city (Yu et al., 2021), which is related to increase in public expenditure (Han et al., 2022). Environmental governance in various countries is also closely related to sustainable economic development (Khan et al., 2021b). As mentioned above, consistent with the effect of green supply chain practices of small- and medium-sized enterprises (Khan S. A. R. et al., 2021), the host city can form a green supply chain management practice through traffic control and green innovation so as to reduce pollution emissions and optimize environmental development (Khan et al., 2021e). Specifically, in terms of air quality, Zhou et al. (2010a) utilized a bottom-up methodology to build emission inventories before and during the 2008 Beijing Summer Olympics so as to estimate the role of measures such as traffic control and vehicle technology improvement during the Olympics and found that they helped reduce air pollution. After that, with a simple regression analysis of the effect of the Beijing Summer Olympics on the air quality of the host city, cohost city, and adjacent cities, Chen et al. (2013) proved that the air quality has been improved during the Beijing Summer Olympics, which is inseparable from the traffic control measures taken by the government. Of course, it is also significantly related to the time and location of factory closures. In terms of carbon emissions, Dan et al. (2011) calculated the difference between energy consumption under normal conditions and that under green measures and converted it into carbon dioxide emission. In this way, they estimated the carbon dioxide emission reduction in energy measures, traffic management, and temporary air contamination control during the Beijing Summer Olympics. Similarly, Miettinen et al. (2019) took six measurement activities before, during, and after the Nanjing Youth Olympic Games. It was found that a series of emission control measures during large-scale events greatly cut down the concentration and composition of PM2.5. Furthermore, Chen Y et al. (2021) utilized the super-DDF DEA model to calculate the environmental efficiency. The regression analysis found that the 2014 Nanjing Youth Olympic Games improved the environmental efficiency level of the host city and still affected the surrounding cities. However, different from previous studies that only focus on a certain sports event, this study mainly makes use of the data of 278 cities from 2006 to 2019 to explore how comprehensive sports events affect urban green and low-carbon development and then utilizes the spatial difference-in-differences (SDID) model to decompose its influence on the host city and other cities and further carries out mechanism analysis and heterogeneity analysis.
In summary, the possible marginal contributions of this study are as follows. First, as for the research perspective, this study is the first to systematically assess the impact of China’s major comprehensive sports events on the green and low-carbon development of the host city, compared to the case studies of individual sports events, thus filling the gap in the systematic evaluation of the environmental effects of comprehensive sports events. Second, in terms of research methodology, the pollution control measures taken in the process of holding sports events and the effect of hosting the events on the growth of tertiary industries and the possible policy demonstration and technology diffusion effects are taken into account. This study is the first to analyze the direct effect and spatial overflow effect of comprehensive sports events on environmental performance by using the SDID model, which reduces the estimation bias caused by ignoring the spatial correlation of geographic units and identifies the externalities of hosting sports events on the neighboring regions in a more scientific and effective way. Finally, in terms of research content, based on the mediating-effect model and the spatial difference-in-difference-in-differences (SDID) model, the impact mechanisms and possible heterogeneity of comprehensive sports events on green and low-carbon development in cities are identified, which is conducive to a more systematic and thorough understanding of the environmental effects of comprehensive sports events and helps provide a reference for the improvement of environmental problems in comprehensive sports events.
The following structure of this study is as follows: Section 3 describes the method and data. Section 4 expounds and verifies how comprehensive sports events affect the green and low-carbon development of cities and then conducts robustness checks. Section 5 carries out mechanism identification. Section 6 shows heterogeneity analysis. Section 7 presents conclusions and policy implications.
3 Methodology and Data
3.1 Spatial Econometric Model
The traditional difference-in-differences (DID) model is often used to assess the effect of policies (Yang et al., 2022). According to the fundamental principles of the DID model, a prerequisite for the validity of DID model parameter estimates is to satisfy the stable unit treatment value assumption (SUTVA) (Rubin, 1986; Rosenbaum, 2010). SUTVA requires that there is no interaction between the potential outcomes of different individuals. In other words, the potential outcome of each individual in the sample does not depend on whether other individuals received the treatment or not. However, as explained in the previous section, influenced by the cross-regional pollution control mechanisms commonly established during the hosting of comprehensive sports events (Chen et al., 2013; Chen Y et al., 2021), the hosting of sports events will not only have an impact on the ecological environment of the host city but also generate inevitable spatial spillover effects on neighboring cities. At the same time, existing studies mostly confirm that hosting comprehensive sports events also generated externalities for other regions through channels such as tourist movement, policy demonstration, and technology diffusion (Tan, 2015; Swart et al., 2017; Kassens-Noor and Fukushige, 2018). Therefore, hosting comprehensive sports events will not only affect the ecological environment and economic development of the local region but will also impact the level of green and low-carbon development of the neighboring territories. Thus, the quasi-natural experiment of hosting comprehensive sports events violated the SUTVA, and using the traditional DID model to assess the impact of hosting comprehensive sports events on the green and low-carbon development will lead to biased estimation results (Delgado and Florax, 2015). In view of this, to ensure the reliability of the estimation results in this study, we reference the study of Jia et al. (2021) to assess the green and low-carbon development effect of comprehensive sports events through spatial econometric methods by using the SDID model. The SDID model is able to control the possible interaction effects among individuals by constructing spatial weight matrices and generating spatial lagged terms (Dubé et al., 2014; Chagas et al., 2016). Consequently, by using the SDID model to deal with the possible spatial spillover effects of comprehensive sports events, it can overcome the deficiency that the traditional DID model cannot obtain effective estimation results in the case of SUTVA violation (Jia et al., 2021) and improve the scientific validity and reliability of the research conclusions. Eq. 1 gives the specific formulation of the SDID model.
Generally, in spatial econometric models, spatial correlation characteristics may be generated by independent variables and a dependent variable or error term (Lesage and Pace, 2009). Therefore, to fully reflect the possible spatial correlation between variables, using the spatial Durbin model (SDM) as a base (Jia et al., 2021), we developed Eq. 1, where
3.2 Data Descriptions
3.2.1 Dependent Variable
(1) Green development: With reference to Zheng et al. (2022), based on the SBM-DEA model, this study calculates the green total factor productivity (
subject to
Here,
In continuation of Wang et al. (2022), we use total investment in fixed assets, total employed persons, and total energy consumption as input variables; real GDP per capita based on 2006 as desired output; and industrial wastewater emissions, industrial smog emissions, and industrial SO2 emissions as undesired outputs. Each city’s green total factor productivity is calculated through the SBM-DEA model. The total energy consumptions are calculated using the total gas supply (including coal gas and natural gas), the total LPG supply, and the annual electricity consumption converted to standard coal as published in the statistical yearbook.
(2) Low-carbon development: Consistent with the
3.2.2 Key Independent Variable
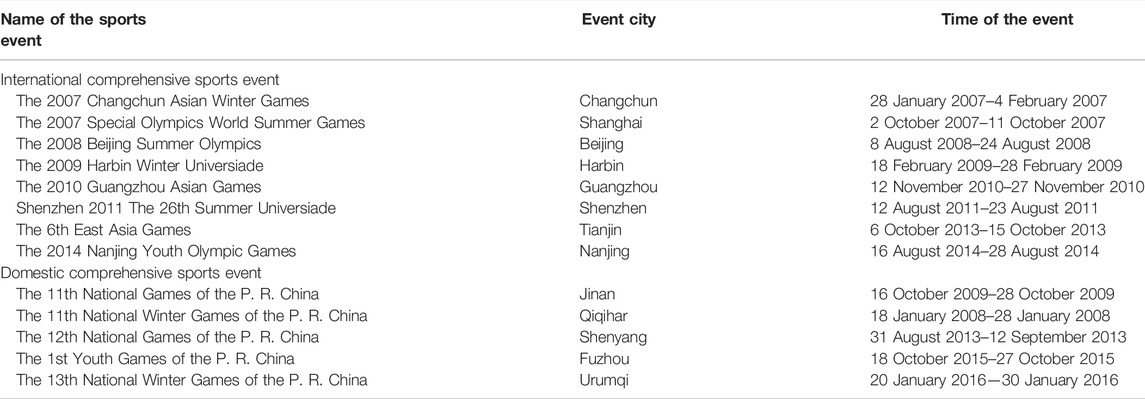
TABLE 1. Previous comprehensive sports events hosted by mainland China.
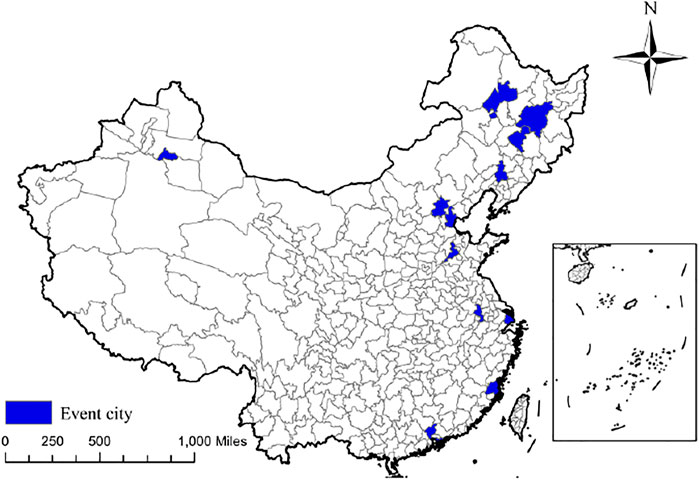
FIGURE 1. Spatial distribution of cities hosting comprehensive sports events.
3.2.3 Control Variables
To ensure the reliability of the study conclusions, we also controlled for a range of variables that potentially affect the
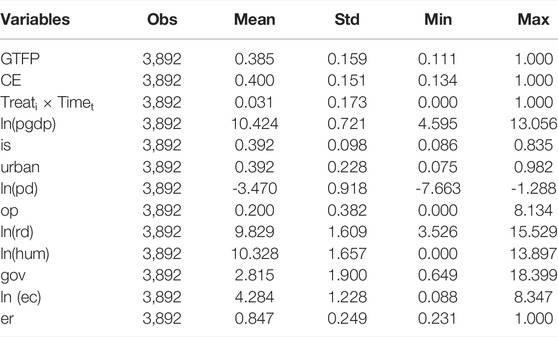
TABLE 2. Summary statistics of variables.
3.2.4 Spatial Weight Matrix
Following the practice of Du et al. (2021), the weight matrix is set as an inverse geographic distance matrix in the benchmark regression section. Specifically,
The elements in the matrix are given by
where
In addition, we also replace the inverse geographic distance matrix (
3.2.5 Data Sources
The figures in this article are mainly from the official website of the State General Administration of Sports (https://www.sport.gov.cn/); the website of the IOC (https://olympics.com/en/); the website of the COC (http://www.olympic.cn/); the Figshare database (https://figshare.com); and the China City Statistical Yearbook, China Energy Statistical Yearbook, China Regional Economic Statistical Yearbook, China Urban and Rural Construction Statistical Yearbook, the statistical yearbook of each province and city in previous years, and the statistical bulletin of each city and other information.
4 Empirical Results and Analysis
4.1 Exploratory Spatial Analysis
4.1.1 Spatial Correlation Analysis
Based on models (2) and (3), the GTFP and CE were measured for each city from 2006 to 2019 in this study, and on this basis, the spatial distribution of GTFP (Figure 2) and CE (Supplementary Appendix Figure A1) in 2006, 2010, 2014, and 2019 is mapped using ArcGIS 10.7. From Figure 2 and Supplementary Appendix Figure A1, it can be found that the GTFP and CE of all Chinese cities have improved from 2006 to 2019. In particular, there is an obvious spatial agglomeration characteristic of GTFP. The coastal and central region cities have a relatively high GTFP, while those in the northwest and southwest regions have a low one. In addition, the spatial distribution characteristics of CE are similar to those of GTFP. CE is relatively high in coastal and southern cities and low in northern cities. The abovementioned phenomenon may be related to the centralized winter heating policy in the northern region (Wang et al., 2020), and the carbon emissions generated by centralized winter heating reduce the CE in northern cities.
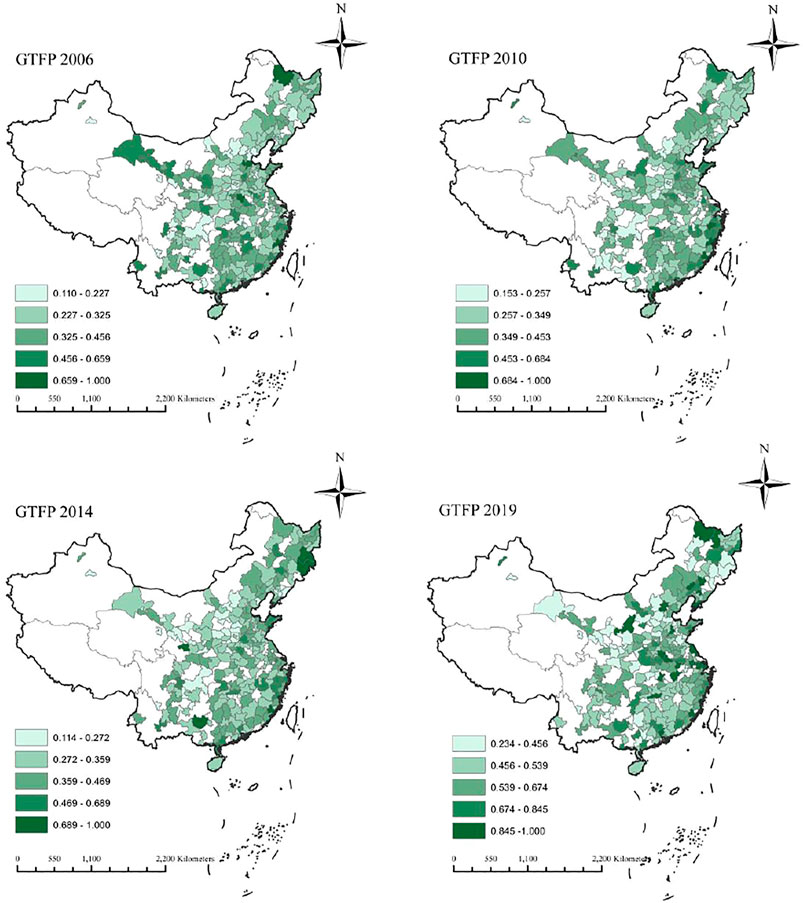
FIGURE 2. Spatial distribution map of GTFP.
Furthermore, the global Moran index was used to more accurately characterize the spatial autocorrelation of GTFP and CE. Eq. 6 presents the formula of global Moran’s index.
where
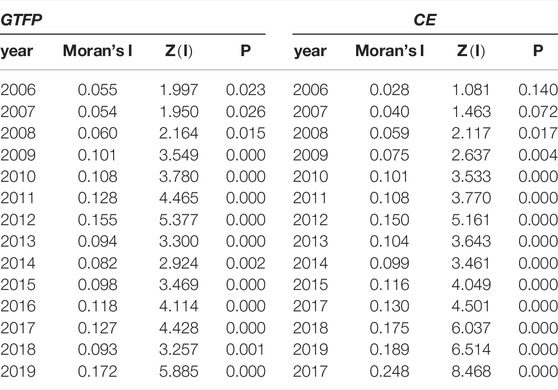
TABLE 3. Test results of global Moran’s index.
The global Moran index investigates the agglomeration of GTFP and CE over the entire spatial series, and to obtain insight into the spatial characteristics of the neighborhood of a particular city
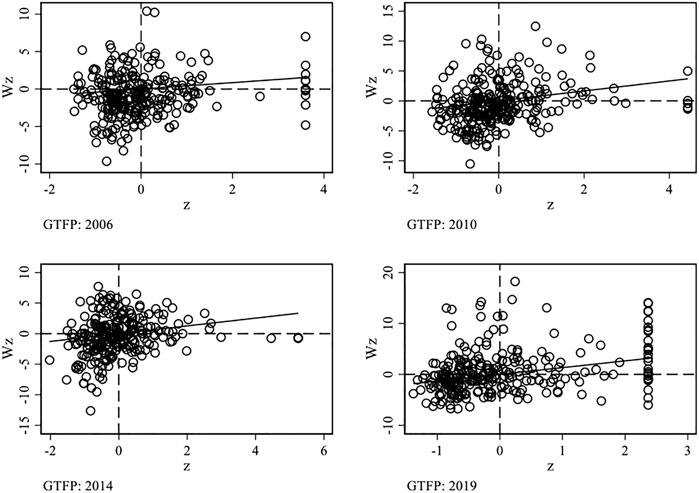
FIGURE 3. Moran’s scatterplot of GTFP by city in 2006, 2010, 2014, and 2019.
4.1.2 Spatial Econometric Modeling Setup Test
This study requires identifying whether spatial dependence exists or not. Specifically, we first perform the LM-lag test and the robust LM-lag test by constructing a spatial lag model (SLM) and an OLS model to determine the existence of a spatial lag effect. Second, the LM-error test and robust LM-error test are conducted by constructing spatial error models (SEMs) and OLS models to judge the existence of spatial error effects (Wang et al., 2021). The abovementioned tests are employed to examine whether the spatial econometric model is necessary to analyze the effect of comprehensive sports events on GTFP and CE. From Table 4, it can be found that all the aforementioned four tests have significantly rejected the null hypothesis, which initially illustrates that the spatial econometric modeling is reasonable in this study.
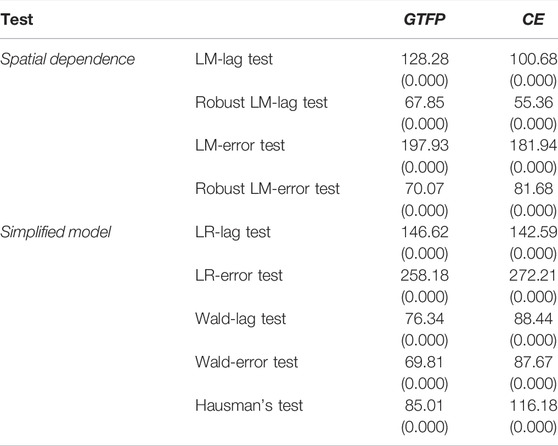
TABLE 4. Test results of the setting model.
Based on the abovementioned analysis, this study refers to Jia et al. (2021) to identify the SDM as degradable to the SLM or the SEM by conducting the LR test and the Wald test. The test results in Table 4 show that the LR-lag tests, LR-error tests, Wald-lag tests, and Wald-error tests are all significant at the 1% level. Thus, the SDM failed to degrade as the SLM or the SEM (Elhorst, 2014). Moreover, the Hausman tests have rejected the null hypothesis at a significance level of 1%, implying that the fixed-effects model should be used for panel data analysis. Consequently, the setting of Eq. 1 in this study is reasonable and reliable.
4.2 Benchmark Regressions
Columns (4) and (8) in Table 5 show the estimation results of Eq. 1. It can be observed that hosting comprehensive sports events significantly enhances the GTFP and CE of host cities, while the spatial lag of
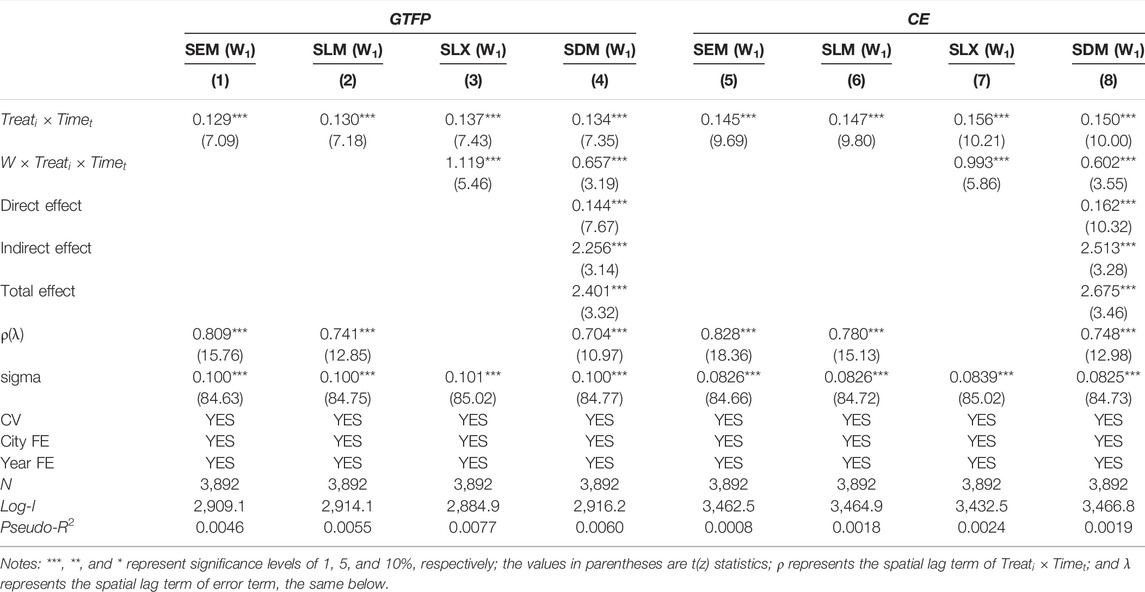
TABLE 5. Estimates of the green and low-carbon development effects on sports events.
4.3 Robustness Checks
4.3.1 Parallel Trend Tests
Satisfying the parallel trend assumption is the precondition for the valid estimation results of the DID model. Therefore, we need to judge whether there are significant systematic differences in the change trends of the dependent variables across the treatment and control groups pre and post the hosting of comprehensive sports events. Here, this study continues the method of Lin (2017) and establishes the following equation for the parallel trend test based on the event study method.
where
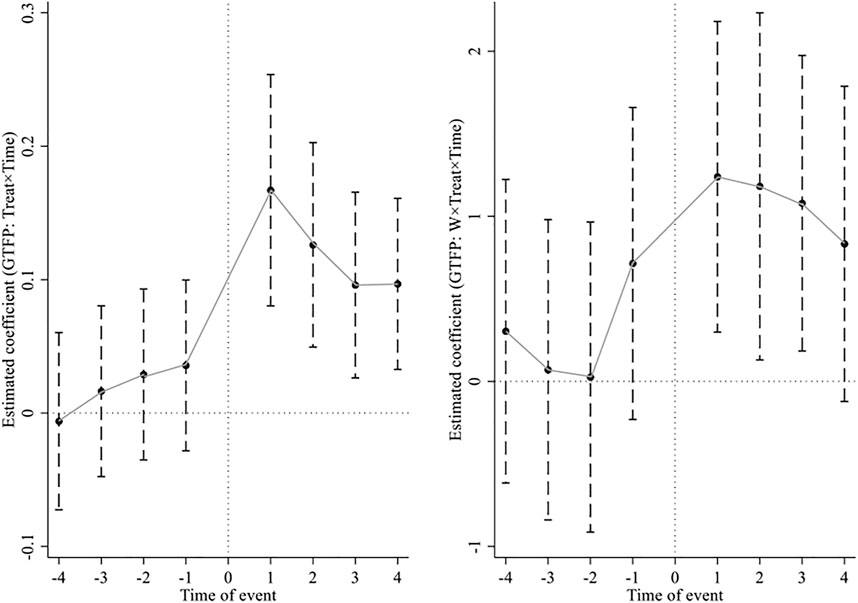
FIGURE 4. Parallel trend test results of GTFP.
4.3.2 Placebo Tests
Omission of important variables may lead to biased estimation results. For this reason, we refer to Jia, et al. (2021) and perform placebo tests using a random sampling method. The idea is to generate false dummy variables
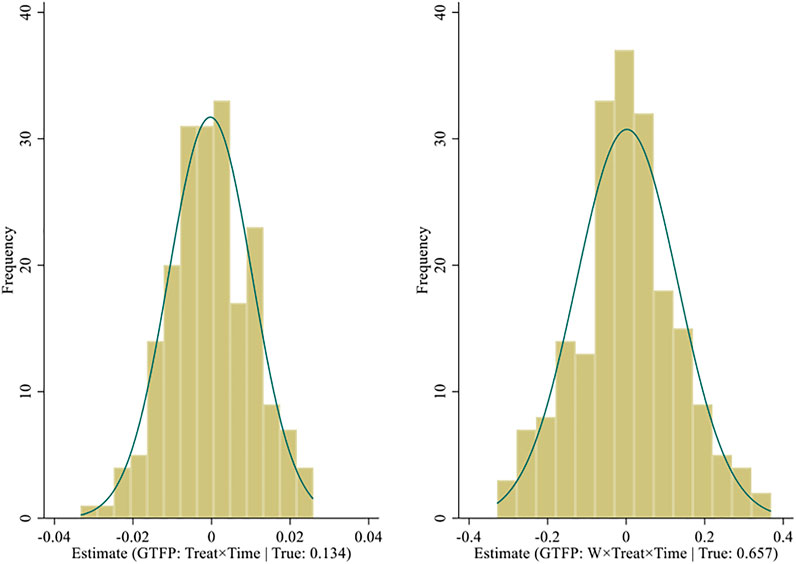
FIGURE 5. Placebo test results of GTFP.
4.3.3 Non-Spatial Perspective Robustness Checks
To guarantee the robustness of the study’s conclusions, we conducted robustness checks from both spatial and non-spatial perspectives.
(1) Using the traditional DID model
Following Feng et al. (2021), we performed robustness checks using the traditional DID model without spatial lag term. Columns (1) and (2) of Table 6 report the estimates of the traditional DID model. It can be found that the
(2) Using the synthetic DID Model
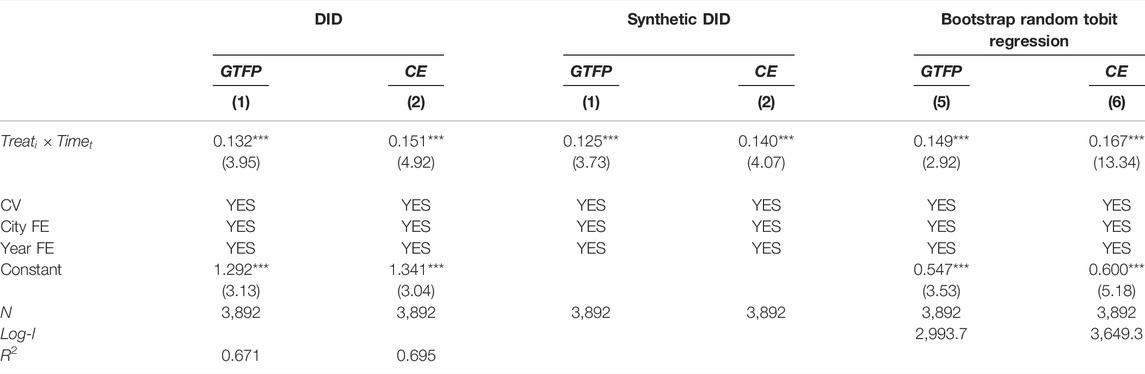
TABLE 6. Robustness test Ⅰ.
This study also employs the synthetic DID approach developed by Arkhangelsky et al. (2021) for robustness checks. The synthetic DID approach incorporates the advantages of both the DID method and the synthetic control method (SCM) to identify causal relationships without satisfying the large sample and parallel trend assumptions and has the properties of double robustness, which is a superior estimation method. The basic idea of synthetic DID is to synthesize a control group by taking a weighted approach to potential control groups and identify the policy effects of the intervention by comparing the differences pre and post intervention between the treatment and control groups. Since the synthetic control group is an optimal “counterfactual” fitness of the pre-intervention treatment group, the same change trends in dependent variables existed for the synthetic control and treatment groups before the intervention, which naturally satisfies the parallel trend assumption. At the same time, compared with the SCM, the synthetic DID approach introduces an intercept term to distinguish the synthetic control group from the treatment group and also adjusts the policy base period using time weights (
(3) Using the tobit regression model
Considering that both GTFP and CE are truncated–tailed data, and following the research of Chen S et al. (2021), this article also uses the bootstrap tobit regression model for robustness checks. The estimation results of tobit are reported in columns (5) and (6) of Table 6. It is observed that the coefficients estimated for
4.3.4 Spatial Perspective Robustness Checks
(1) Using the PSM-SDID model
To overcome the estimation bias due to possible systematic differences in individual characteristics across the treatment and control groups, we further used the PSM-SDID approach for robustness tests. Specifically, the PSM nearest neighbor matching method to search for similar control groups to the treatment group was used, and the propensity score values were estimated by logit regression on the dummy variable
(2) Excluding the CET policy interference
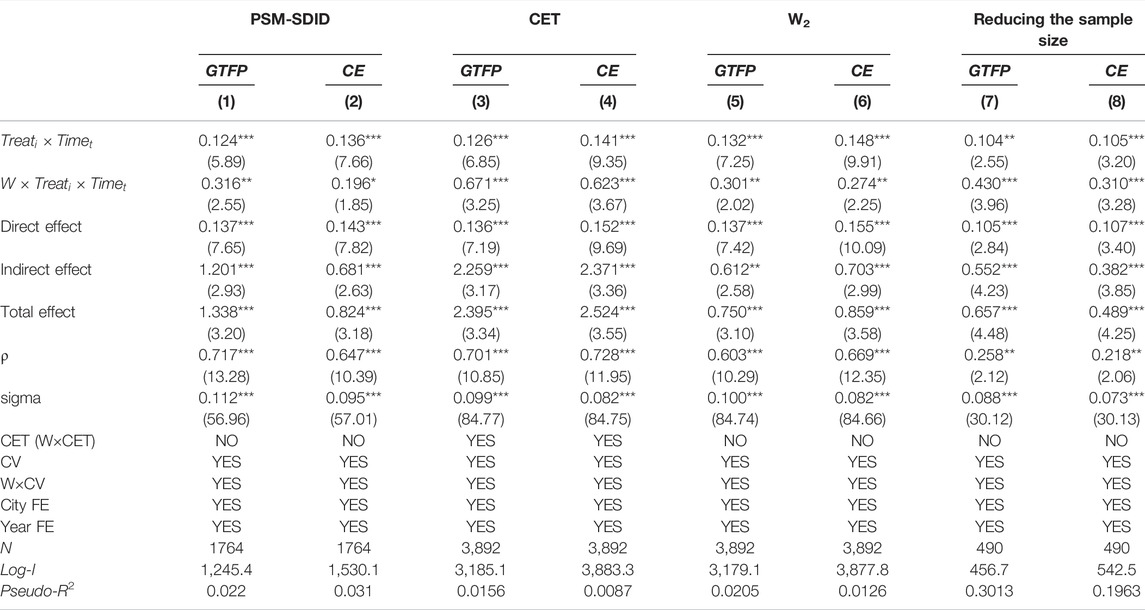
TABLE 7. Robustness test Ⅱ.
Existing literature suggests that the carbon emissions trading (CET) pilot policy affects cities’ GTFP and CO2 emissions (Wen et al., 2021; Zhang and Wang, 2021; Cheng and Kong, 2022). Since 2013, China has launched the pilot CET programs in seven provinces and municipalities. The CET pilot policy has improved the carbon emission performance and GTFP of the pilot cities to some extent. To address the possible effects of the CET policy on the environmental effects of comprehensive sports events, this study introduces a dummy variable
(3) Replacing the spatial weight matrix
This section substitutes the inverse geographic distance matrix (
(4) Reducing the sample size
Considering that cities at different hierarchical levels in China may have different urban governance capabilities, the environmental governance effectiveness of cities may vary significantly at diverse levels of governance. Therefore, borrowing from Yang et al. (2019), this study reduces the sample to provincial capitals and planned cities for testing whether the control group changes have substantial effects on the estimation conclusions. The regression results in columns (7) and (8) of Table 7 demonstrate that the direct effects and spatial spillover of hosting comprehensive sports events on GTFP and CE are still significantly positive, which is sufficient to indicate that the basic conclusions of this study are solid and robust.
5 Mechanism Identification
5.1 Mechanism Analysis
The previous section demonstrated that hosting comprehensive sports events can significantly improve GTFP and CE but cannot analyze the reasons for this. In this section, we discuss the mechanisms by which comprehensive sports events influence environmental performance improvement. Overall, the results in the previous section may be achieved through technological innovation, sports industry development, and foreign investment.
5.1.1 Technological Innovation Effect
Comprehensive sports events have become an important policy instrument to promote green technology innovation (Kassens-Noor and Fukushige, 2018). In the building industry, for example, stadiums built to host events have higher environmental standards, and hosting sports events can promote scientific and technological innovation in the architecture sector, thereby reducing the carbon emissions of stadiums and other infrastructure and improving environmental performance (Wu and Zhang, 2008). At the same time, mega-sports events are a testing ground for new transportation technologies. The demand for transportation during sports events far exceeds the daily situation, necessitating that transportation authorities optimize and innovate transportation management technologies to meet passenger demand. Therefore, hosting sports events can objectively promote transportation technology innovation, optimize urban transportation efficiency, and increase the GTFP of the host city (Zhou et al., 2010b; Yan et al., 2010). In addition, sports events also facilitate innovation in information and communication technology and ecological protection technology (Wu and Zhang, 2008; Zhang et al., 2021). Communication technology innovation can reduce resource waste and achieve energy saving and environmental protection (Wu et al., 2021). The ecological protection technology innovation can explore a new urbanization development pattern of coordinated development of urban construction and ecological protection and provide ecological environmental technical support for the green development of the host city and other cities after the tournament (Zhang et al., 2021). Notably, the Athletes’ Village built for the sports events can be considered a typical case of circular economy. By operating the Athletes’ Village, it is possible to explore and practice the application of circular economy in the community, which will provide technical support for the future large-scale promotion of cleaner and more environmentally friendly production and living systems, thus contributing to sustainable development of the hosts (Khan et al., 2021c). Therefore, this study believes that organizing comprehensive sports events can realize the green and low-carbon development of each city through green technology innovation.
5.1.2 Sports Industry Development Effect
The organization of comprehensive sports events will facilitate the formation and promotion of the sports sector. On the one hand, organizing sports events can stimulate the public’s enthusiasm for participating in sports activities and develop consumption demand for sports goods or services (Chen S et al., 2021). When producers anticipate that holding sports events may boost people’s demand for sports products and services, they will influence the production and investment decisions of enterprises, which in turn will improve the supply capacity of sports products and services (Zhang et al., 2018). The sports industry develops through the hosting of events under the mutual influence of supply and demand. On the other hand, using sports events as a policy instrument essentially enhances the sports infrastructure of the host city, optimizes the hardware conditions for consumers to participate in sports activities, and creates an environment conducive to the promotion of the sports sector (Tan, 2015; Zhang et al., 2018). Therefore, holding comprehensive sports events is advantageous to the sports sector’s progress. In addition, as a green industry, the stable and healthy development of the sports industry is conducive to promoting sustainable regional development (Yang et al., 2020). The energy-saving and efficiency-enhancing functions of the sports sector are beneficial to facilitating industrial structure optimization and modernization, which effectively stimulates the green and low-carbon transition of the economy (Xu and Yang, 2019). Consequently, we assume that hosting comprehensive sports events is conducive to improving the GTFP and CE of the hosts by driving the development of the sports industry.
5.1.3 Foreign Investment Attraction Effect
The success of a comprehensive sports event can optimize the host city’s infrastructure and business environment (Zhang et al., 2018; Yu et al., 2021), reflecting the efficiency of the host city’s government and social governance (Malchrowicz-Mośko and Poczta, 2018). This helps establish the national image and the city’s influence, which in turn attracts foreign investment through the “signaling mechanism” to affect the ecological environment and carbon emissions of the host city (Kim et al., 2014; Long et al., 2018; Yu et al., 2022a). However, the effect of foreign direct investment (FDI) on the environment is still controversial in academic community. The “pollution haven” hypothesis asserts that developed countries exacerbate the environmental pressure in host countries by transferring high pollution and energy-intensive industries, while the " pollution halo” hypothesis believes that the FDI contributes to the improvement of the host country’s environmental quality by upgrading its production technology (Lin H. et al., 2022). Both of these hypotheses have received substantial empirical support, but the environmental performance of FDI induced by comprehensive international sports events is not known. Therefore, this study tries to answer this question through mechanism identification.
5.2 Mechanism Testing
In order to verify whether hosting comprehensive sports events can achieve green and low-carbon development of the host city through technological innovation, sports industry development, and attracting foreign investment, this study uses the mediating-effects model for mechanism identification, with reference to the method of Baron and Kenny (1986). The specific model is as follows:
Here,
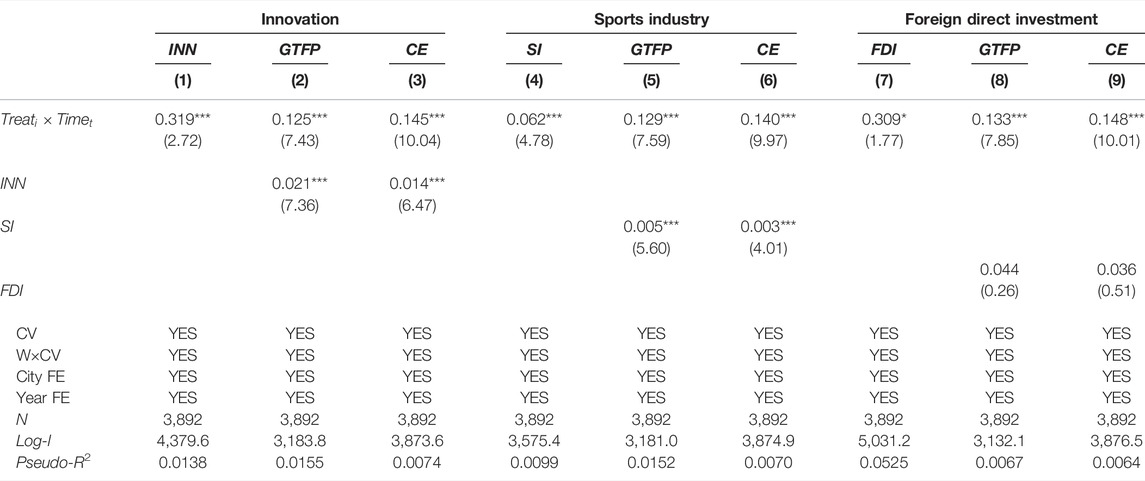
TABLE 8. Mechanism identification.
From columns (1), (4), and (7), it is observed that the estimated coefficients of
6 Heterogeneity Analysis
Since cities at different levels may have different low-carbon green development capabilities (Wang et al., 2022), there is a possibility of heterogeneity in the environmental effects of comprehensive sports events. Meanwhile, considering the differences in preparation requirements and event scale between different ranks of events (Malchrowicz-Mośko and Poczta, 2018), those discrepancies may lead to heterogeneity in the environmental performance. Therefore, to check the possible heterogeneous characteristics for the environmental effects of comprehensive sports events in terms of the development level of the host city and the rank of the event, the spatial difference-in-difference-in-differences (SDDD) model is employed in this study to conduct the analysis, and its model is set as follows:
In Eqs 10 and 11, the variables are the same as those in Eq. 1 except for
Table 9 documents the results of the heterogeneity analysis. From column (1) and column (3), it is evident that the direct and spatial spillover effects of hosting comprehensive sports events in first-tier cities on GTFP and CE are higher than those of other cities. This may be due to the greater technological innovation capability of first-tier cities than other cities, and hosting sports events is more likely to achieve improvements in GTFP and CE through technological innovation. Meanwhile, from column (2) and column (4), it is noticeable that the direct and spatial spillover effects of international sports events on environmental performance improvement are greater in comparison with domestic sports events. This may be due to the preparation requirements and higher influence of international comprehensive sports events, which are more likely to stimulate the technological innovation and sports industry development of the hosting regions, which in turn leads to their green and low-carbon development.
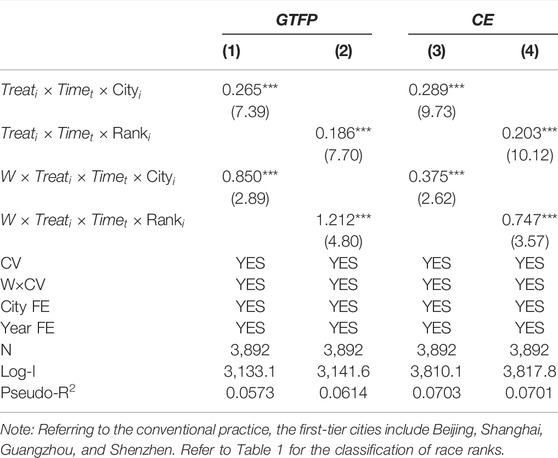
TABLE 9. Heterogeneity analysis of green and low-carbon development effects in sports events.
7 Conclusion and Discussion
Using the annual panel data of 278 cities in China from 2006 to 2019, this study empirically examines the effects of hosting comprehensive sports events on green total factor productivity and carbon emission efficiency through the SDID model. The main conclusions are as follows:
1. Hosting comprehensive sports events can significantly improve the green total factor productivity and carbon emission efficiency of host cities, and this result still holds after robustness tests using the traditional DID model, synthetic DID model, and panel tobit model.
2. The spatial spillover effect of comprehensive sports events on green total factor productivity and carbon emission efficiency is also statistically significant. It indicates that hosting comprehensive sports events is not only conducive to guiding the host city to develop in a green and low-carbon direction but also generates significant positive externalities to other cities in the neighborhood. The abovementioned observations still hold after robustness tests utilizing the PSM-SDID model, excluding the interference of other policies, replacing the spatial weight matrix, and reducing the sample size.
3. Mechanism identification suggests that hosting comprehensive sports events can significantly strengthen the host city’s technological innovation capacity, promote its sports industry, and attract more foreign direct investment. Comprehensive sports events can realize the green and low-carbon development of the host city by improving its science and technology innovation capacity and sports industry development. However, the FDI attracted by the sports events did not contribute to the green total factor productivity and carbon emission efficiency of the host city.
4. Heterogeneity analysis shows that international comprehensive sports events and sports events hosted by first-tier cities play a more obvious role in promoting the green total factor productivity and carbon emission efficiency of the host city and its neighboring regions.
Based on the abovementioned findings, this study presents the following policy implications. First, from 2022 to 2023, China will host a number of comprehensive sports events, and the host cities should take the events as an opportunity to effectively optimize urban transportation infrastructure, promote urban renovation, and promote green and low-carbon development of urban construction. Second, the crucial way to reinforce the environmental effect of comprehensive sports events is to strengthen the ability of technological innovation and promote the development of the sports industry. The hosts should attach importance to scientific and technological innovation, take the hosting of the event as an opportunity to develop technological innovation activities, and strive to form a series of urban scientific innovation clusters, through which the clusters can effectively enhance the innovation capacity. Simultaneously, we should put stress on and direct the development of the sports industry, make reasonable utilization of the "legacy of the event,” improve the post-event utilization efficiency of the event venues on the basis of adequate planning, and give impetus to the development of the sports service industry in a low-carbon direction. Third, it is recommended to fulfill the role of comprehensive sports events in attracting foreign investment, enforce environmental supervision of foreign investment, correctly guide the flow of all kinds of foreign investment to high-tech and low-energy industries, maximize the “promotion effect” of foreign investment on environmental performance, and promote the long-term green and low-carbon development of the host city. Finally, to build an information-sharing platform, cities should publicize the concept of low-carbon environmental protection and raise public environmental awareness with the help of events. Meanwhile, it can also carry out full linkages in technological innovation and pollution prevention and control, so as to take advantage of the spillover effect of comprehensive sports events even better.
At last, there are some inevitable shortcomings in this study. First, in the heterogeneity analysis section, this study only classifies comprehensive sports events into two categories: international events and domestic events. However, due to the restrictions of the event rank and economic development base of the host city, each event can be regarded as a quasi-natural experiment, and a more detailed analysis method is needed to identify the policy effects of each event. Second, in terms of the spatial weight matrix, only the inverse geographic distance weight matrix and the adjacency matrix are chosen to describe the interconnection between cities. The two classical spatial weight matrices do not take into account the influence of factors such as economic links and transportation networks on the intercity linkages; thus, the identification of spatial spillover effects in this study may not be comprehensive. Furthermore, due to the constraints of the research scale, this study only assesses the overall impact of comprehensive sports events on host cities and does not identify the impact of sports events on the spatial pattern changes within cities and the evolution of economic centers of gravity. Therefore, based on the abovementioned shortcomings, further research can be embarked on the following three aspects:
1. The treatment effect of a single comprehensive sports event can be identified by the synthetic control method. This method is suitable for assessing policies with only a few or unique “pilots” (Abadie et al., 2010), which helps improve the knowledge of the existing literature on the environmental effects of sports events.
2. The spatial weight matrix can be further analyzed by creating an economic weight matrix and a traffic time weight matrix. Of course, this also does not fully reflect the spatial correlation between the two cities, and the actual situation may be more complicated.
3. In future studies, a further combination of statistical data at district and county levels with satellite remote sensing data can depict the impact of comprehensive sports events on the internal development of cities more meticulously. The authors believe this will be an interesting field of research.
Data Availability Statement
The original contributions presented in the study are included in the article/Supplementary Material; further inquiries can be directed to the corresponding author.
Author Contributions
XZ conceptualized the study and designed the methodology. XZ and YW designed the software, performed formal analysis and data curation, visualized the study, wrote and prepared the original draft, and wrote, reviewed, and edited the manuscript. YW supervised the study. All authors have read and agreed to the published version of the manuscript.
Funding
This research was supported by the Fundamental Research Funds for the Central Universities, Southwestern University of Finance and Economics (JBK2102035), and the National Natural Science Foundation of China (71503212).
Conflict of Interest
The authors declare that the research was conducted in the absence of any commercial or financial relationships that could be construed as a potential conflict of interest.
Publisher’s Note
All claims expressed in this article are solely those of the authors and do not necessarily represent those of their affiliated organizations, or those of the publisher, the editors, and the reviewers. Any product that may be evaluated in this article, or claim that may be made by its manufacturer, is not guaranteed or endorsed by the publisher.
Supplementary Material
The Supplementary Material for this article can be found online at: https://www.frontiersin.org/articles/10.3389/fenvs.2022.946993/full#supplementary-material
References
Abadie, A., Diamond, A., and Hainmueller, J. (2010). Synthetic Control Methods for Comparative Case Studies: Estimating the Effect of California's Tobacco Control Program. J. Am. Stat. Assoc. 105, 493–505. doi:10.1198/jasa.2009.ap08746
Arkhangelsky, D., Athey, S., Hirshberg, D. A., Imbens, G. W., and Wager, S. (2021). Synthetic Difference-In-Differences. Am. Econ. Rev. 111, 4088–4118. doi:10.1257/aer.20190159
Awosusi, A. A., Mata, M. N., Ahmed, Z., Coelho, M. F., Altuntaş, M., Martins, J. M., et al. (2022). How Do Renewable Energy, Economic Growth and Natural Resources Rent Affect Environmental Sustainability in a Globalized Economy? Evidence from Colombia Based on the Gradual Shift Causality Approach. Front. Energy Res. 9, 721. doi:10.3389/fenrg.2021.739721
Baron, R. M., and Kenny, D. A. (1986). The Moderator-Mediator Variable Distinction in Social Psychological Research: Conceptual, Strategic, and Statistical Considerations. J. Personality Soc. Psychol. 51, 1173–1182. doi:10.1037/0022-3514.51.6.1173
Baumann, R., Engelhardt, B., and Matheson, V. A. (2012). Employment Effects of the 2002 Winter Olympics in Salt Lake City, Utah: Themenheft 3/Bd. 232.” in Jahrbücher für Nationalökonomie und Statistik: Sports Economics: Present and Future Impact on General Economics.
Chagas, A. L. S., Azzoni, C. R., and Almeida, A. N. (2016). A Spatial Difference-In-Differences Analysis of the Impact of Sugarcane Production on Respiratory Diseases. Regional Sci. Urban Econ. 59, 24–36. doi:10.1016/j.regsciurbeco.2016.04.002
Chen, J., Gao, M., Cheng, S., Hou, W., Song, M., Liu, X., et al. (2020). County-level CO2 Emissions and Sequestration in China during 1997-2017. Sci. Data 7, 391. doi:10.1038/s41597-020-00736-3
Chen, Y., Jin, G. Z., Kumar, N., and Shi, G. (2013). The Promise of Beijing: Evaluating the Impact of the 2008 Olympic Games on Air Quality. J. Environ. Econ. Manag. 66, 424–443. doi:10.1016/j.jeem.2013.06.005
Chen, S, S., Preuss, H., Hu, X., Kenyon, J., and Liang, X. (2021). Sport Policy Development in China: Legacies of Beijing's 2008 Summer Olympic Games and 2022 Winter Olympic Games. J. Glob. Sport Manag. 6, 234–263. doi:10.1080/24704067.2019.1566756
Chen, Y, Y., Long, X., and Salman, M. (2021). Did the 2014 Nanjing Youth Olympic Games Enhance Environmental Efficiency? New Evidence from a Quasi-Natural Experiment. Energy Policy 159, 112581. doi:10.1016/j.enpol.2021.112581
Cheng, Z., and Kong, S. (2022). The Effect of Environmental Regulation on Green Total-Factor Productivity in China's Industry. Environ. Impact Assess. Rev. 94, 106757. doi:10.1016/j.eiar.2022.106757
Delgado, M. S., and Florax, R. J. G. M. (2015). Difference-in-differences Techniques for Spatial Data: Local Autocorrelation and Spatial Interaction. Econ. Lett. 137, 123–126. doi:10.1016/j.econlet.2015.10.035
Deng, Y., You, D., and Wang, J. (2022). Research on the Nonlinear Mechanism Underlying the Effect of Tax Competition on Green Technology Innovation - an Analysis Based on the Dynamic Spatial Durbin Model and the Threshold Panel Model. Resour. Policy 76, 102545. doi:10.1016/j.resourpol.2021.102545
Du, G., Yu, M., Sun, C., and Han, Z. (2021). Green Innovation Effect of Emission Trading Policy on Pilot Areas and Neighboring Areas: An Analysis Based on the Spatial Econometric Model. Energy Policy 156, 112431. doi:10.1016/j.enpol.2021.112431
Dubé, J., Legros, D., Thériault, M., and Des Rosiers, F. (2014). A Spatial Difference-In-Differences Estimator to Evaluate the Effect of Change in Public Mass Transit Systems on House Prices. Transp. Res. Part B Methodol. 64, 24–40. doi:10.1016/j.trb.2014.02.007
Elhorst, J. P. (2014). Spatial Econometrics: From Cross-Sectional Data to Spatial Panels [M]. Heidelberg, New York, Dordrecht, London: Springer.
Feng, Y., Wang, X., Liang, Z., Hu, S., Xie, Y., and Wu, G. (2021). Effects of Emission Trading System on Green Total Factor Productivity in China: Empirical Evidence from a Quasi-Natural Experiment. J. Clean. Prod. 294, 126262. doi:10.1016/j.jclepro.2021.126262
Fourie, J., and Santana-Gallego, M. (2011). The Impact of Mega-Sport Events on Tourist Arrivals. Tour. Manag. 32, 1364–1370. doi:10.1016/j.tourman.2011.01.011
Gibson, H. J. (1998). Sport Tourism: A Critical Analysis of Research. Sport Manag. Rev. 1, 45–76. doi:10.1016/s1441-3523(98)70099-3
Guo, J., Wu, X., Guo, Y., Tang, Y., and Dzandu, M. D. (2021). Spatiotemporal Impact of Major Events on Air Quality Based on Spatial Differences-In-Differences Model: Big Data Analysis from China. Nat. Hazards, 1–22. doi:10.1007/s11069-021-04517-y
Han, F., Farooq, M. U., Nadeem, M., and Noor, M. (2022). Public Spending, Green Finance, and Zero Carbon for Sustainable Development: A Case of Top 10 Emitting Countries. Front. Environ. Sci. 10, 834195. doi:10.3389/fenvs.2022.834195
Hille, E., Shahbaz, M., and Moosa, I. (2019). The Impact of FDI on Regional Air Pollution in the Republic of Korea: A Way Ahead to Achieve the Green Growth Strategy? Energy Econ. 81, 308–326. doi:10.1016/j.eneco.2019.04.004
Huang, L. (2011). Research on Effect of Beijing Post-Olympic Sports Industry to China's Economic Development. Energy Procedia 5, 2097–2102. doi:10.1016/j.egypro.2011.03.362
Huo, W., Ullah, M. R., Zulfiqar, M., Parveen, S ., and Kibria, U. (2022). Financial Development, Trade Openness, and Foreign Direct Investment: A Battle between the Measures of Environmental Sustainability. Front. Environ. Sci. 10, 851290. doi:10.3389/fenvs.2022.851290
Jia, R., Shao, S., and Yang, L. (2021). High-speed Rail and CO2 Emissions in Urban China: A Spatial Difference-In-Differences Approach. Energy Econ. 99, 105271. doi:10.1016/j.eneco.2021.105271
Kassens-Noor, E., and Fukushige, T. (2018). Olympic Technologies. J. Urban Technol. 25, 83–104. doi:10.1080/10630732.2016.1157949
Ke, H., Yang, B., and Dai, S. (2022). Does Intensive Land Use Contribute to Energy Efficiency? -Evidence Based on a Spatial Durbin Model. Int. J. Environ. Res. Public Health 19. doi:10.3390/ijerph19095130
Khan, S. A. R., Godil, D. I., Jabbour, C. J. C., Shujaat, S., Razzaq, A., and Yu, Z. (2021a). Green Data Analytics, Blockchain Technology for Sustainable Development, and Sustainable Supply Chain Practices: Evidence from Small and Medium Enterprises. Ann. Oper. Res 10. doi:10.1007/s10479-021-04275-x
Khan, S. A. R., Godil, D. I., Yu, Z., Abbas, F., and Shamim, M. A. (2021b). Adoption of Renewable Energy Sources, Low-Carbon Initiatives, and Advanced Logistical Infrastructure—An Step toward Integrated Global Progress, Sustain. Dev. 30, 275–288. doi:10.1002/sd.2243
Khan, S. A. R., Ponce, P., Thomas, G., Yu, Z., Al-Ahmadi, M. S., and Tanveer, M. (2021c). Digital Technologies, Circular Economy Practices and Environmental Policies in the Era of COVID-19. Sustainability 13, 12790. doi:10.3390/su132212790
Khan, S. A. R., Ponce, P., and Yu, Z. (2021d). Technological Innovation and Environmental Taxes toward a Carbon-free Economy: An Empirical Study in the Context of COP-21. J. Environ. Manag. 298, 113418. doi:10.1016/j.jenvman.2021.113418
Khan, S. A. R., Yu, Z., and Sharif, A. (2021e). No Silver Bullet for De-carbonization: Preparing for Tomorrow, Today. Resour. Policy 71 (C), 101942. doi:10.1016/j.resourpol.2020.101942
Kim, J., Kang, J., and Kim, Y. K. (2014). Impact of Mega Sport Events on Destination Image and Country Image. Sport Mark. Q. 23, 161–175. http://165.193.178.96/login?url=http://search.ebscohost.com/login.aspx?direct=true&db=bth&AN=98205229&site=eds-live
Kim, W., Jun, H. M., Walker, M., and Drane, D. (2015). Evaluating the Perceived Social Impacts of Hosting Large-Scale Sport Tourism Events: Scale Development and Validation. Tour. Manag. 48, 21–32. doi:10.1016/j.tourman.2014.10.015
Lamberti, L., Noci, G., Guo, J., and Zhu, S. (2011). Mega-Events as Drivers of Community Participation in Developing Countries: The Case of Shanghai World Expo. Tour. Manag. 32, 1474–1483. doi:10.1016/j.tourman.2010.12.008
Lesage, J., and Pace, R. K. (2009). Introduction to Spatial Econometrics, 1. Boca Raton, FL: CRC Press. doi:10.1201/9781420064254
Lin, H., Wang, X., Bao, G., and Xiao, H. (2022). Heterogeneous Spatial Effects of FDI on CO2 Emissions in China. Earth's Future 10, e2021E–e2331E. doi:10.1029/2021ef002331
Lin, R., Ma, X., Li, B., Ye, X., Chen, X., and Liang, S. (2022). A Study on the Participation of Peasants in Rural Environmental Improvement from the Perspective of Sustainable Development. Front. Environ. Sci. 10. doi:10.3389/fenvs.2022.853849
Lin, Y. (2017). Travel Costs and Urban Specialization Patterns: Evidence from China's High Speed Railway System. J. Urban Econ. 98, 98–123. doi:10.1016/j.jue.2016.11.002
Lindau, B., Tavarez, V. B., and Petzhold, B. (2016). Mega events and the transformation of Rio de Janeiro into a mass-transit city. Res. Transp. Econ. 59, 196–203.
Long, X., Chen, B., and Park, B. (2018). Effect of 2008's Beijing Olympic Games on Environmental Efficiency of 268 China's Cities. J. Clean. Prod. 172, 1423–1432. doi:10.1016/j.jclepro.2017.10.209
Malchrowicz-Mośko, E., and Poczta, J. (2018). A Small-Scale Event and a Big Impact-Is This Relationship Possible in the World of Sport? the Meaning of Heritage Sporting Events for Sustainable Development of Tourism-Experiences from Poland. Sustainability 10, 4289. doi:10.3390/su10114289
Mao, F. F., Zheng, F., and Zhu, S. Q. (2020). The Impact of Major Sports Events on Urban Economy Development: Based on the Panel Data from 70 Large and Medium-Sized Cities in China. J. Shanghai Univ. Sport 44, 24. doi:10.16099/j.sus.2020.05.003
Matheson, V. A. (2005). Contrary Evidence on the Economic Effect of the Super Bowl on the Victorious City. J. Sports Econ. 6, 420–428. doi:10.1177/1527002504267489
Mei, W., and Bao, H. (2018). Mega-Event Effects on the Housing Market: Evidence From the Beijing 2008 Olympic Games. Cities 72, 207. doi:10.17863/CAM.11548
Miettinen, M., Leskinen, A., Abbaszade, G., Orasche, J., Sainio, M., Mikkonen, S., et al. (2019). PM2.5 Concentration and Composition in the Urban Air of Nanjing, China: Effects of Emission Control Measures Applied During the 2014 Youth Olympic Games. Sci. Total Environ. 652, 1–18. doi:10.1016/j.scitotenv.2018.10.191
Nie, H. F., Wang, B., X. C., and Zhao, H. Q. (2016). Do Mega Sports Events Promote Local Economics Growth? Empirical Evidence from China. China J. Econ. 3, 85–114. (In Chinese). doi:10.16513/j.cnki.cje.20161025.002
Pan, X., Guo, S., Han, C., Wang, M., Song, J., and Liao, X. (2020). Influence of FDI Quality on Energy Efficiency in China Based on Seemingly Unrelated Regression Method. Energy 192, 116463. doi:10.1016/j.energy.2019.116463
Pawlowski, T., Downward, P., and Rasciute, S. (2014). Does National Pride from International Sporting Success Contribute to Well-Being? an International Investigation. Sport Manag. Rev. 17, 121–132. doi:10.1016/j.smr.2013.06.007
Shao, C. D., Su, D., and Li, K. W. (2018). Agglomeration across the Border: Spatial Characteristics and Driving Factors. Finance Trade Econ. 39, 99–113. (In Chinese). doi:10.19795/j.cnki.cn11-1166/f.2018.04.008
Siegfried, J., and Zimbalist, A. (2000). The Economics of Sports Facilities and Their Communities. J. Econ. Perspect. 14, 95–114. doi:10.1257/jep.14.3.95
Swart, K., George, R., Cassar, J., and Sneyd, C. (2017). The 2014 FIFA World Cup: Tourists’ Satisfaction Levels and Likelihood of Repeat Visitation to Rio de Janeiro. J. Dest. Mark. Manage.. S2212571X16301688. doi:10.1016/j.jdmm.2017.01.001
Tan, T.-C. (2015). The Transformation of China's National Fitness Policy: From a Major Sports Country to a World Sports Power. Int. J. Hist. Sport 32, 1071–1084. doi:10.1080/09523367.2015.1036240
Wang, B., Yu, M., Zhu, Y., and Bao, P. (2021). Unveiling the Driving Factors of Carbon Emissions from Industrial Resource Allocation in China: A Spatial Econometric Perspective. Energy Policy 158, 112557. doi:10.1016/j.enpol.2021.112557
Wang, J., Obradovich, N., and Zheng, S. (2020). A 43-Million-Person Investigation into Weather and Expressed Sentiment in a Changing Climate. One Earth 2, 568–577. doi:10.1016/j.oneear.2020.05.016
Wang, K.-L., Pang, S.-Q., Zhang, F.-Q., Miao, Z., and Sun, H.-P. (2022). The Impact Assessment of Smart City Policy on Urban Green Total-Factor Productivity: Evidence from China. Environ. Impact Assess. Rev. 94, 106756. doi:10.1016/j.eiar.2022.106756
Wen, H.-X., Chen, Z.-R., and Nie, P.-Y. (2021). Environmental and Economic Performance of China's ETS Pilots: New Evidence from an Expanded Synthetic Control Method. Energy Rep. 7, 2999–3010. doi:10.1016/j.egyr.2021.05.024
Wu, H., Hao, Y., Ren, S., Yang, X., and Xie, G. (2021). Does Internet Development Improve Green Total Factor Energy Efficiency? Evidence from China. Energy Policy 153, 112247. doi:10.1016/j.enpol.2021.112247
Wu, J., and Zhang, Y. (2008). Olympic Games Promote the Reduction in Emissions of Greenhouse Gases in Beijing. Energy Policy 36, 3422–3426. doi:10.1016/j.enpol.2008.05.029
Xu, J., and Yang, R. (2019). Sports Industry Agglomeration and Green Economic Growth-Empirical Research Based on Panel Data of 30 Provinces and Cities in China. Sustainability 11, 5399. doi:10.3390/su11195399
Yan, L. C., Yang, S. S., and Fu, G. J. (2010). Travel Demand Model for Beijing 2008 Olympic Games. J. Transp. Eng. 136, 537–544. ASCE)TE. doi:10.1061/(10.1061/(asce)te.1943-5436.0000105
Yang, S., Xu, J., and Yang, R. (2020). Research on Coordination and Driving Factors of Sports Industry and Regional Sustainable Development-Empirical Research Based on Panel Data of Provinces and Cities in Eastern China. Sustainability 12, 813. doi:10.3390/su12030813
Yang, X., Lin, S., Li, Y., and He, M. (2019). Can High-Speed Rail Reduce Environmental Pollution? Evidence from China. J. Clean. Prod. 239, 118135. doi:10.1016/j.jclepro.2019.118135
Yang, Z., Yuan, Y., and Zhang, Q. (2022). Carbon Emission Trading Scheme, Carbon Emissions Reduction and Spatial Spillover Effects: Quasi-Experimental Evidence from China. Front. Environ. Sci. 9. doi:10.3389/fenvs.2021.824298
Yu, J.-G., Jeong, Y.-D., and Kim, S.-K. (2021). Verifying the Effectiveness of Sports Event Policies for a City's Sustainable Growth: Focusing on the Multiple Effects. Sustainability 13, 3285. doi:10.3390/su13063285
Yu, Z., Khan, S. A. R., Ponce, P., Lopes De Sousa Jabbour, A. B., and Chiappetta Jabbour, C. J. (2022a). Factors Affecting Carbon Emissions in Emerging Economies in the Context of a Green Recovery: Implications for Sustainable Development Goals. Technol. Forecast. Soc. Change 176, 121417. doi:10.1016/j.techfore.2021.121417
Yu, Z., Ponce, P., Irshad, A. U. R., Tanveer, M., Ponce, K., and Khan, A. R. (2022b). Energy Efficiency and Jevons' Paradox in OECD Countries: Policy Implications Leading Toward Sustainable Development. J. Pet. Explor Prod. Technol. 4. doi:10.1007/s13202-022-01478-1
Zhang, J. J., Kim, E., Mastromartino, B., Qian, T. Y., and Nauright, J. (2018). The Sport Industry in Growing Economies: Critical Issues and Challenges. Ijsms 19, 110–126. doi:10.1108/IJSMS-03-2018-0023
Zhang, Y. J., and Wang, W. (2021). How Does China's Carbon Emissions Trading (CET) Policy Affect the Investment of CET-Covered Enterprises? Energ. Econ., 98. doi:10.1016/j.eneco.2021.105224
Zhang, Y. Q., and Zhao, K. (2008). The Impact of Beijing Olympic-Related Investments on Regional Economic Growth of China: Interregional Input-Output Approach. Econ. Res. J., 4. https://kns.cnki.net/kcms/detail/detail.aspx?FileName=JJYJ200803004&DbName=CJFQ2008
Zhang, Y., Xu, Z., and Wu, J. (2021). Influence of Beijing Winter Olympic Games Construction on Vegetation Coverage Around Zhangjiakou Competition Zone. Ijerph 18, 12777. doi:10.3390/ijerph182312777
Zheng, C., Deng, F., Li, C., and Yang, Z. (2022). The Impact of China's Western Development Strategy on Energy Conservation and Emission Reduction. Environ. Impact Assess. Rev. 94, 106743. doi:10.1016/j.eiar.2022.106743
Zhong, Y. J., Liu, B., and Guo, Z. (2021). Research on Environmental Sustainability in Sports—A Systematic Review Based on English Journals in 2016—2020. China Sport Sci. 41, 58–67. (In Chinese). doi:10.16469/j.css.202106006
Zhou, Y., Wu, Y., Yang, L., Fu, L., He, K., Wang, S., et al. (2010a). The Impact of Transportation Control Measures on Emission Reductions during the 2008 Olympic Games in Beijing, China. Atmos. Environ. 44, 285–293. doi:10.1016/j.atmosenv.2009.10.040
Keywords: comprehensive sports events, green and low-carbon development, SBM-DEA model, spatial difference-in-differences model, spatial spillover effect
Citation: Zhang X and Wu Y (2022) The Green and Low-Carbon Development Effect of Comprehensive Sports Events: A Quasi-Natural Experiment From China. Front. Environ. Sci. 10:946993. doi: 10.3389/fenvs.2022.946993
Received: 18 May 2022; Accepted: 07 June 2022;
Published: 13 July 2022.
Edited by:
Syed Abdul Rehman Khan, Xuzhou University of Technology, ChinaReviewed by:
Adeel Shah, College of Business Management, PakistanLaeeq Razzak Janjua, Vistula University, Poland
Copyright © 2022 Zhang and Wu. This is an open-access article distributed under the terms of the Creative Commons Attribution License (CC BY). The use, distribution or reproduction in other forums is permitted, provided the original author(s) and the copyright owner(s) are credited and that the original publication in this journal is cited, in accordance with accepted academic practice. No use, distribution or reproduction is permitted which does not comply with these terms.
*Correspondence: Yihan Wu, eWloYW53dUBzdHUubmphdS5lZHUuY24=