- 1MOE Key Laboratory of Groundwater Circulation and Environmental Evolution, China University of Geosciences, Beijing, China
- 2Chinese Academy of Environmental Planning, Beijing, China
- 3School of Water Resources and Environment, China University of Geosciences, Beijing, China
Groundwater quality assessment is important for understanding the suitability of groundwater resources for various purposes. Although many different methods have been proposed for this purpose, few methods have considered the spatial variation of groundwater components during the assessments. In this study, we proposed to combine the self-organizing map (SOM) and entropy-based weight determining method to assess groundwater quality. Totally, 955 water samples taken from 58 wells during 2010–2017 were used in the study. 22 hydrochemical components (K+, Na+, Ca2+, Mg2+, NH4+, Cl−, SO42-, F−, NO3−, Fe2+, Fe3+, Al, etc.) were used in the assessment for each sample. These sampling points can be classified into five clusters, which may be affected by four different sources: landfill sources (cluster 3), industrial and agricultural sources (cluster 5), and domestic sewage discharge sources (clusters 1, 2, and 4). The scores of the water quality of the five clusters that were calculated by the entropy method are 0.2658, 0.2634, 0.5737, 0.2608, and 0.5718, indicating that the groundwater affected by domestic sewage discharge sources (clusters 1, 2, and 4) are better than other two sources (clusters 3 and 5) in the study area. The results of this study provide insights for the protection of groundwater resources and the treatment of groundwater pollution in the future.
1 Introduction
Groundwater is the key water source for food, energy, and ecosystems especially in arid or semi-arid area (Gleeson et al., 2016). As part of the North China Plain, Beijing suffers from the semi-arid climate and is highly dependent on the groundwater as its water supply (Li et al., 2020b). In order to cope with the water resource shortage in Beijing, multiple emergency groundwater supply sources have been constructed in the phreatic aquifer in the Pinggu Basin, northeast of Beijing (Li et al., 2020a). Thus, groundwater resource protection is especially important in the Pinggu Basin. However, rapid urbanization and industrialization in recent years in this area have put a serious threat on the groundwater quality and the groundwater supply. Only a few studies have investigated the hydrochemical characteristics and the groundwater quality in these areas (Jiang et al., 2017; Li et al., 2020a). Jiang et al. (2017) studied the major ions of groundwater in the shallow aquifer of the Pinggu Basin and found that water–rock interaction was the dominated process that controlled the hydrochemical evolution. Recently, Li et al. (2020a) investigated the spatial and temporal evolutions of groundwater hydrochemical monitoring data by the SOM method and found that Cl−, SO42-, NO3−, and NH4+ increased in 2017 compared with that of 2014, but the groundwater quality around this area has not been evaluated in an integrative way.
Assessing groundwater quality usually needs to deal with a large dataset as there are complex chemical components in the groundwater (Sanchez-Martos et al., 2002) and multiple factors need to be considered when performing the assessment (Li et al., 2014). The Water Quality Index (WQI) method is an efficient way of assessing the influence of individual parameters on the overall groundwater quality, and thus has become the popular method for groundwater quality assessment (Vasanthavigar et al., 2010; Li et al., 2014). However, the determination of the weight in this method is somewhat subjective which may affect the result of the groundwater quality (Amiri et al., 2014). In order to solve this issue, an information entropy-based weight determining method was proposed in the assessment (Li et al., 2011). Multivariate statistical analysis methods have also been widely used in the groundwater quality assessment as they are powerful in dimension reduction and classification (Omo-Irabor et al., 2008). However, such methods do not consider the spatial and temporal variations of the groundwater components and the randomicity, complexity, and non-linearity in the environment issues (Bodrud-Doza et al., 2016). Artificial intelligence (AI) algorithms such as self-organizing maps (SOM) have been introduced into the groundwater quality assessment recently and they have shown that they can be used in the groundwater quality assessment effectively (Gharibi et al., 2012; Nguyen et al., 2015). However, only individual weight was considered in the SOM method, while missing the integrative impact on the overall quality.
In this study, we proposed to combine both the information entropy-based weight determining method and the SOM method to assess the groundwater quality in the Pinggu Basin during 2010–2017. Such a method considered both the overall quality by individual parameters and individual wells, and also integrated the spatial and temporal variations, thus, we consider it is useful in assessing the regional groundwater quality, especially when the dataset is large.
2 Materials and Methods
2.1 Study Area and Data
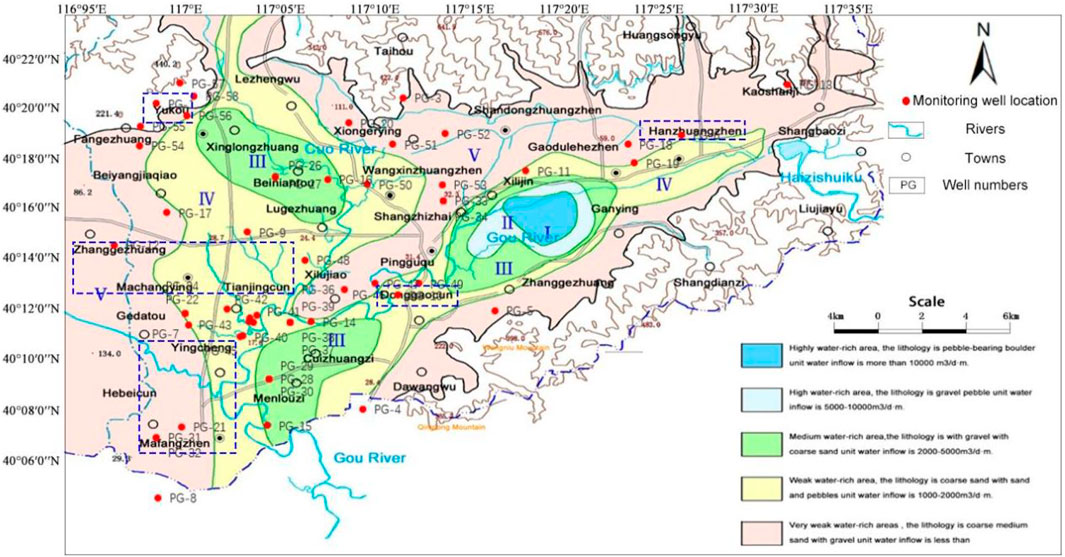
As one of the districts of Beijing, the Pinggu Basin is located on the transitional area of the Yanshan Mountains and the North China Plain (116°58′37″-117°18′42″N, 40°2′19″-40°11′48″E). The basin is a rifted-basin with a distance of 32 km across east to west and 15 km across north to south, and it has an area of 402 km2 (Figure 1). The basin is an individual intermontane basin hydrogeological unit with a limestone aquifer as the major aquifer in the mountain area and a Quaternary sediment pore aquifer in the plain area. Groundwater is mainly recharged by meteoric precipitation, surface water leakage, and lateral flow. The major flow direction is consistent with the river direction–flow from north to south or from northeast to southwest. Groundwater recharge sources in the study area are mainly composed of atmospheric precipitation infiltration recharge, surface water infiltration recharge such as river channels, and a lateral replenishment of the piedmont zone. Moreover, leakage from the Haizi Reservoir, flood infiltration, and return infiltration of canals are also important sources of supply. Groundwater is mainly discharged by human exploitation.
The aquifers in the plain area can be divided into four different aquifers. The lower boundary of the first layer has a depth of 51.9 m, the second aquifer has a depth of 100 m, 180 m for the third aquifer, and below that is the fourth aquifer. 58 groundwater-monitoring wells are constructed in the basin (Figure 1): 32 wells located in the first layer of the phreatic aquifer, 14 wells located in the second aquifer, 8 wells located in the third aquifer, and 4 wells in the fourth aquifer. Water samples were collected and analyzed by the Beijing Institute of Hydrogeology and Engineering Geology every 3 months from October 2010 to June 2017. These water samples were used to analyze the following 22 parameters: K+, Na+, Ca2+, Mg2+, NH4+, HCO3−, CO32-, Cl-, SO42-, F−, NO3−, TDS, CO2, Fe2+, Fe3+, oxygen consumption, Al, nitrite, total hardness, pH, electrical conductivity (EC), and total alkalinity. For these ions with concentrations below the limit of detection, we do not involve them in the further study. As for the other ions, we compared them with the environmental background value and chose those parameters for the further study. Before sampling, the in-situ measurements of pH, TDS, CO2, oxygen consumption, and electrical conductivity were performed by portable meters. Sample bottles (clean polyethylene bottles) were rinsed by the same groundwater 2–3 times, and all samples were filtered with 0.45 m filter membranes and collected in the sample bottles. And, nitric acid was added to the sample used to test cations to pH < 2. After that, all samples were stored in ice boxes at 4°C until the laboratory analysis. An inductively coupled plasma spectrometer (ICP-9100) was used to analyze the concentrations of ions (K+, Na+, Ca2+, and Mg2+). Ion chromatography (ICS-2500) was used to determine the concentrations of Cl−, SO42-, F−, and NH4+. The concentrations of Fe2+, Fe3+, NH4+, and NO3− and nitrite were measured by using a hash reagent. The concentrations of HCO3− were determined by acid–base titration Figure 2.
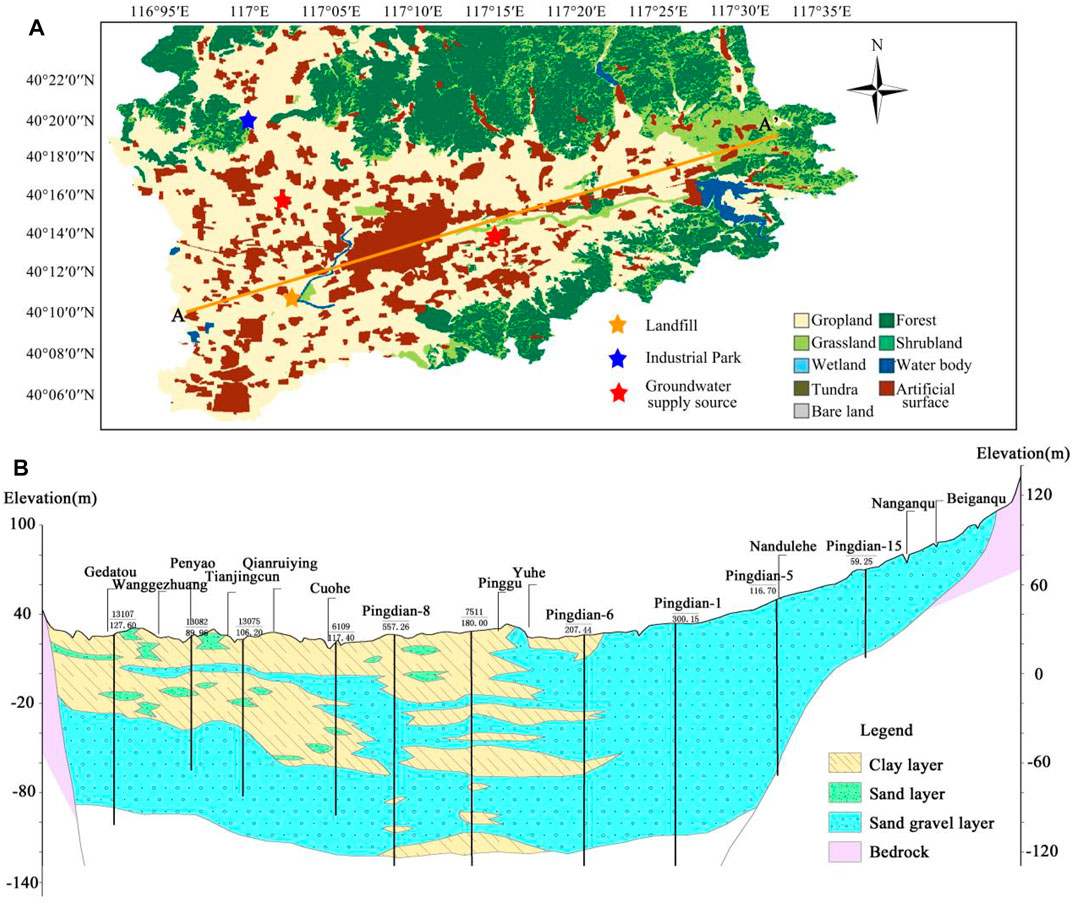
FIGURE 2. (A)Land-use map of the Pinggu District, and A-A′ is the location of the geological profile; (B)The geological profile of the Pingu area, and the position is shown in Figure 2A (AA′).
2.2 Materials and Method
SOM was employed to classify the groundwater samples. The classification results of the groundwater samples and the concentration distribution of various ions in each water sample were obtained, which were then used to identify pollution sources. Then, the entropy method was used to calculate the groundwater quality scores of all the water samples, and the water quality scores of the water samples were obtained statistically. Combined with the results of SOM and the entropy method, the water quality evaluation and pollution source identification analysis were carried out.
2.2.1 Entropy Method
Many different chemical parameters need to be considered in an overall groundwater quality assessment, and different water samples should also be considered in the spatial groundwater quality assessment. Thus, the weight of each parameter and water sample should be determined in the calculation. Currently, weight is usually given by the experts (Li et al., 2011) or calculated from the standard-exceeding rate. Those methods are either too subjective or miss the processes of interaction between multiple parameters. The information entropy method is an effective way to determine the weight in a complex, large dataset and also have been used in groundwater quality assessments. The concept of information entropy was first proposed by Shannon (Shannon, 1948), and it can be used as a measure of information or uncertainty. Thus, it is an efficient way of providing uncertainty and probability. Unlike the fuzzy synthetic evaluation methods that focus on the spatial characteristics of the groundwater quality, the entropy method can deal with both spatial and temporal groundwater quality data.
The algorithm of the entropy method can be realized by MATLAB programming. It can be realized by the following steps:
1) selecting n water samples (i = 1,2,….,n) and m chemical parameters (j = 1,2, … ,m),xij represents the jth groundwater quality parameter of the
2) Normalization of the chemical parameters. Because of the different units of chemical parameters, before using them to calculate the comprehensive index, we first do the normalization. That is, transform the absolute value of the index into the relative value, so as to solve the homogenization problem caused by different chemical parameter concentrations. Moreover, because of the different meanings of the positive index and negative index values, we use different algorithms to normalize the data for high and low indexes, the detail steps are as follow:
For the positive index:
For the negative index:
where xj is the index value of jth chemical parameter, xmax is the maximum for indicator j, xmin is the minimum for indicator j, and xij’ is the standardized values.
3) Calculating the weight of the ith water sample of jth chemical parameters:
4) Calculation of entropy for the jth chemical parameters:
5) Calculation of entropy redundancy for the chemical parameters:
The greater the difference of the index value j, the greater the left and right of the evaluation of the scheme, the smaller the entropy value, and the definition of the difference coefficient;
6) Weight evaluation:
7) Computing a comprehensive score for each water sample:
2.2.2 Self-Organizing Map (SOM)
The SOM method is an unsupervised neutral network algorithm proposed by Kohonen (Kohonen, 1995). It can project high-dimensional, complex data into a low-dimensional, regularly arranged map based on the data similarity (Jin et al., 2011). Thus, it is an effective linear dimensionality reduction method (Choi et al., 2014) that has been widely used in data mining, classification, etc. One of the key purposes of the SOM method is to obtain the informative and physically explainable reference vectors (also known as weight vectors, prototype vectors, and code-book vectors). The map size determines the accuracy of the pattern recognition; however, topographical adjacency is further among the clusters. Thus, one should use the optimal size both for the pattern recognition and topographical proximity of the clusters (Nguyen et al., 2015). Here, we follow the previous study of the heuristic rule of
Choosing the winning neuron p through competitive learning.6) Updating the BMU and its adjacent neurons to the input water sample and calculating the weight vectors for each time step as follows:
7) Iteration learning rate
2.2.3 Evaluation Method of Water Quality Combined With SOM and the Entropy Method
The monitoring wells are distributed in different areas of the Pinggu Basin, thus the results obtained directly by clustering cannot verify their rationality. Here, we evaluated the water quality of all the water samples first, and then clustered the hydrochemical characteristics and classification of the water samples by the SOM method. Through the analysis of water quality and hydrochemical characteristics, the rationality of the method and the accuracy of the results are verified.
First, all water samples 955) were screened for outliers or missing data, and we compared them with the background values of each chemical component. If five or more chemical components in each water sample were below the background value, the water sample data were excluded. Because the Cr6+, manganese, arsenic, mercury, volatile phenol, cyanide and nitrite, volatile phenol, cyanide, and nitrite in many water samples are all below the background value, we ignored these water samples in the study in order to ensure the weight value of the important chemical components. As a result, 533 samples were selected from 955 water samples.
Among the 533 water samples, many of them were sampled quarterly from the same monitoring well in the same year, while some monitoring wells only had one water sample in that year. In order to prevent the duplication and superposition of the samples, the average value of a single monitoring well data for each year (the average of quarterly data for that year) was taken, and totally, 270 sample data were processed.
The entropy method is used to evaluate the groundwater quality of a single well. The weight of each chemical parameter in the calculation process is determined by the magnitude of change. The water quality score of each water sample is calculated by this method. The score is weighted by the numerical contribution of each pollution component. The higher the score, the greater the fraction of each pollution group or the contribution of the components, and the worse the water quality. The entropy method is calculated at the individual level, thus the whole situation of the water samples can be obtained by classifying 270 water samples by using the SOM method. The 270 water samples can be divided into multiple groups and distributed in the grid. The similar locations in the grids may indicate the same or similar hydrochemical types and the similar source of pollutants. After that, we compared the cluster result with the water quality score. Finally, the 270 water samples were classified into multiple clusters based on the SOM results, and the average score of the water samples in each large cluster was also calculated. The calculation process is shown in Figure 3.
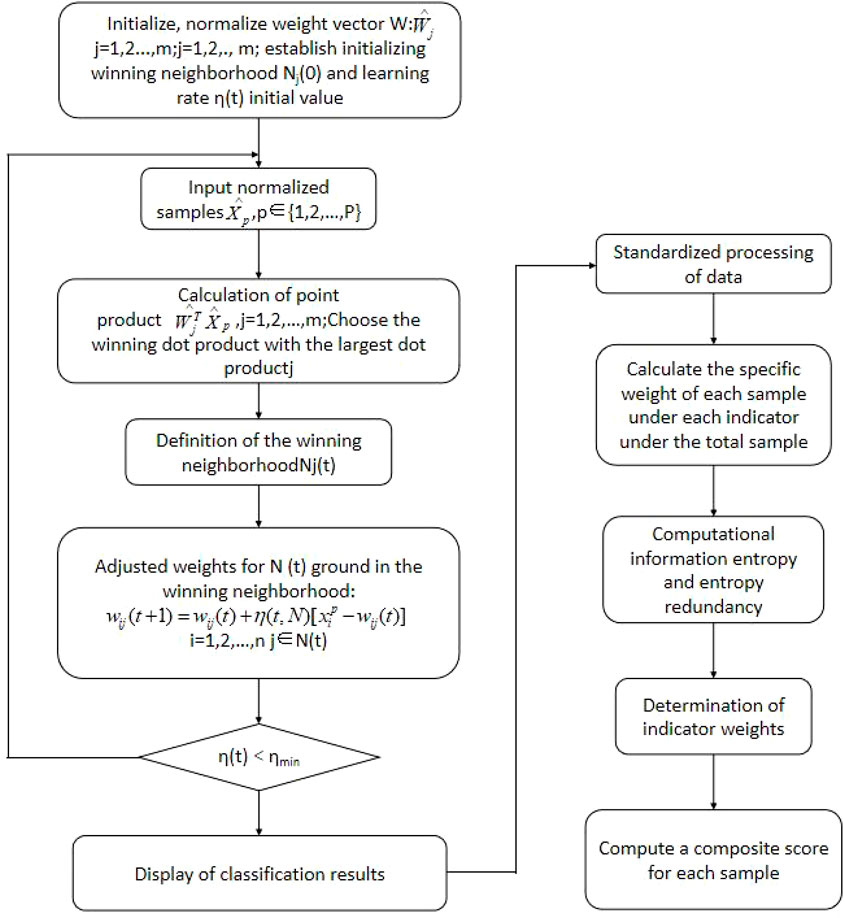
FIGURE 3. Based on SOM and the entropy method, the calculation principle and flow of the water quality assessment are demonstrated.
3 Result
3.1 Assessment of the Water Quality in Individual Monitoring Wells
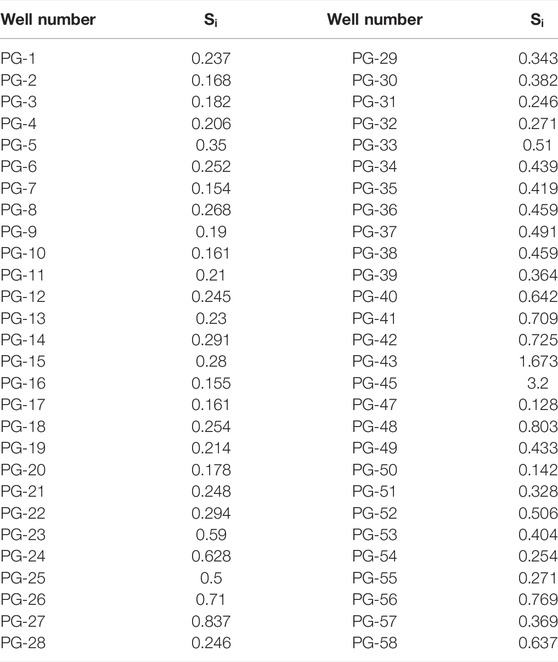
The entropy method determines the index weight according to the variation degree of each index value, and the deviation caused by human factors can be avoided. The result of the entropy method for the 58 wells is shown in Table 1. In Table 1, the score of each well stands for the water quality
The scores of the monitoring well can be divided equally by using the entropy method. According to the distribution of monitoring wells in Figure 1, monitoring wells are roughly distributed in the northwest, west, south, east, and central areas of the study area. The scores could be divided into five clusters at equal intervals (Table 2). It can be found that the scores of PG-43 and PG-45 in the water quality of monitoring wells were much higher than those of other wells, and other values were all within the normal range.
According to Table 1, the group of groundwater wells (PG-45, 43, 27, 48, 56, 42, 26, 41, 40, and 58) shows the highest score. The smallest group of scores includes PG-47, 50, 16, 17, 10, 20, and 9 wells. The first group’s wells PG-45, 43, 27, 48, 42, 26, 41, and 40 are located near the landfill (Figures 1, 2), and PG-56 and 58 monitoring wells are mainly located near Yukou town. PG-10, 47, and 50 monitoring wells are located in the middle of the study area. PG-16, 17, 20, and 9 monitoring wells are located in the southern part of the study area. From the ranking of the water quality scores, the spatial distribution of the monitoring wells with similar water qualities is relatively concentrated.
Since we only evaluate the water quality of each single well, the overall water quality in the study area needs to be further studied. We analyzed the overall water quality by using a self-organizing mapping neural network (SOM) in the next section.
3.2 SOM Results
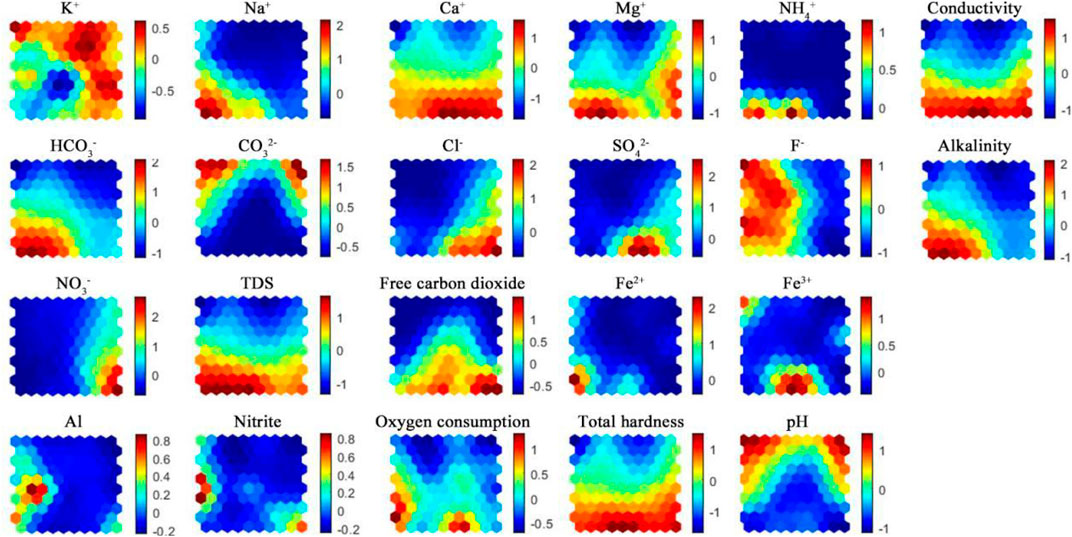
22 chemical parameters from 270 samples were used in the SOM analysis. Based on the aforementioned method, the number of SOM nodes is set as 100, the number of rows and columns are 10 and 10, respectively. This SOM method is used for the standard cluster analysis of groundwater chemical monitoring data. Figure 3 shows the SOM mapping of 22 components and finally gets the training process. Each map represents a reference vector of 100 SOM nodes, where the reference vectors are standardized using color visualization graphs. The node representing a high value is crimson and a low value is dark blue, comparing each component of the SOM by color gradient, the correlation among each component could be identified.
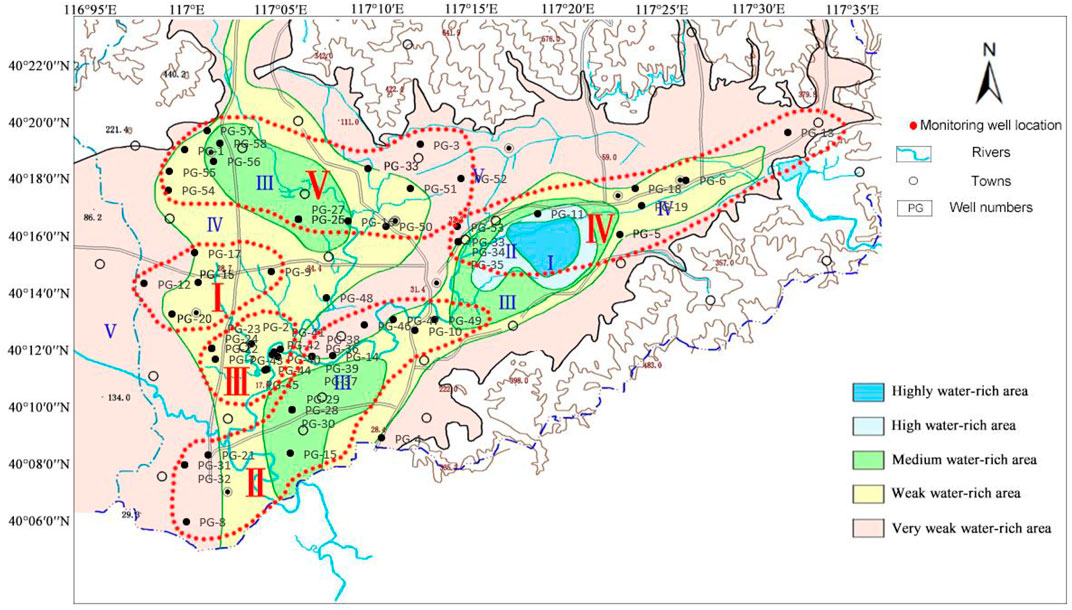
The classification results of the water samples (Figure 4) and the topology results of each index (Figure 5) were obtained through the SOM analysis of the 270 water samples.
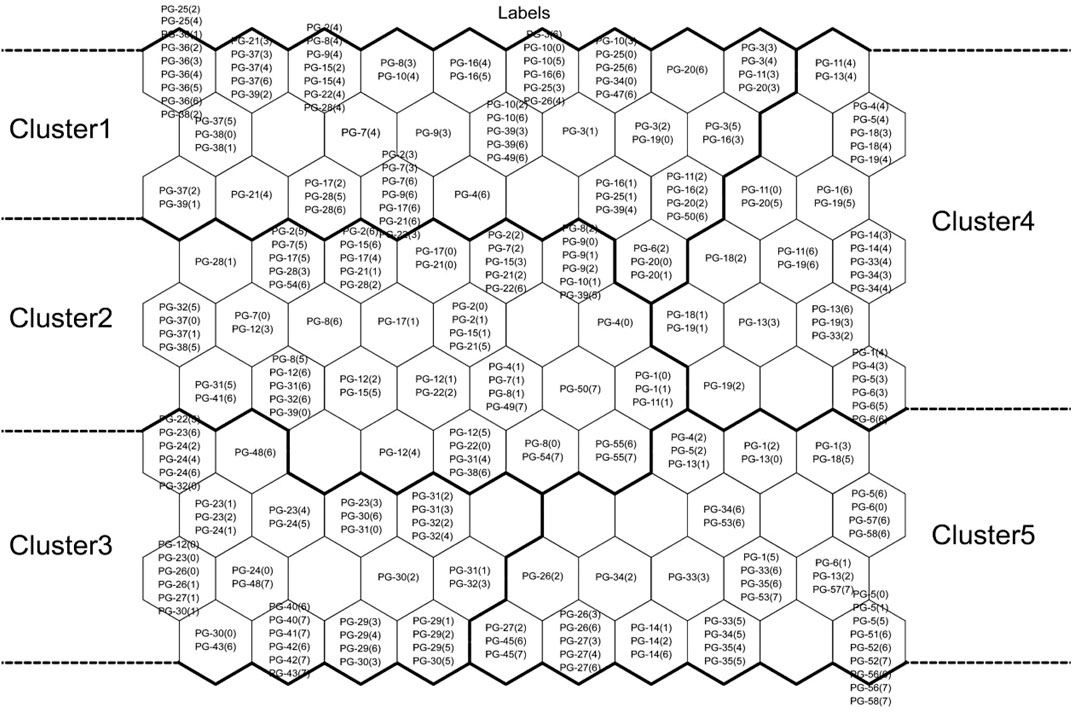
FIGURE 4. Pattern classification map of the seven clusters by the SOM method. The number in the node represents the number of each well, and the area name is referred to as monitoring well number year (Pinggu area + year + quarter).
SOM combines the k-means clustering algorithm. The DB index (DBI for short) is the maximum value of the ratio between the inner distance and the distance between the classes, which is used to judge the clustering results. The smaller DBI value indicates the smaller distance within the class, while the larger DBI value indicates the larger distance between the classes. This also shows that the clustering results are better.
In order to select the best number of clusters, the DBI value based on the k-means clustering algorithm is employed, and the clusters of 5 show the minimum DBI.
Figure 4 shows a pattern classification of five clusters. According to the SOM classification results, 270 water samples can be divided into five clusters: cluster 1: PG-2, 7, 9, 10, 16, 17, 20, 21, 22, 36, 37, and 38. This cluster of monitoring wells is basically distributed in the second and third aquifers; cluster 2: PG-1, 4, 8, 12, 15, 28, 31, 32, 37, 38, 39, 47, 49, 50, and 54; cluster 3: PG-22, 23, 24, 29, 30, 31, 32, 40, 41, 42, 43, and 48; cluster 4: PG-4, 5, 6, 11, 13, 18, 19, 20, 33, and 34; cluster 5: PG-1, 4, 5, 13, 14, 26, 27, 33, 34, 35, 51, 52, 53, 56, 57, and 58. The monitoring wells of clusters 1, 2, 3, and 4 are mostly distributed in the first and second aquifers, while the PG-1, 2, 17, 36 monitoring wells are in the fourth aquifer.
SOM classification results show that the five clusters are distributed roughly in five regions: southern, central, eastern, southwest, and northwest of the study area (Figure 5). In the southern region, the number of monitoring wells in layers 1 to 4 is 9, 7, 5, and 3, respectively. The monitoring wells are located in cluster 1 and cluster 3. In the east, the number of monitoring wells in layers 1 to 4 is 6, 6, 2, and 1, respectively. The monitoring wells are mainly located in cluster 2. In the northern region, the number of monitoring wells in layers 1 to 4 is 6, 3, 1, and 0, and the monitoring wells are mainly located in cluster 4. In the west, the number of monitoring wells in layers 1 to 4 is 9, 4, 2, and 1, respectively. The monitoring wells are located in cluster 5. It can be seen that the block distribution of the monitoring wells in Figure 5 is consistent with the SOM classification results.
Figure 6 shows the SOM mapping of the 22 chemical components, each map representing a reference vector with 100 SOM nodes, where the reference vectors are normalized using a color visualization map. Dark red indicates the high values and dark blue indicates the low values. Each grid in Figure 6 corresponds to Figure 4 one by one, and the depth of the color represents the corresponding ion concentration of the monitoring well at that position.
On this aforementioned principle, SOM calculated the concentration distribution of each ion in the water sample group in Figure 6. Combining the results of Figure 4 and Figure 6, we can see that in cluster 1, the higher contents are K+ and CO32-, and Na+, Cl− dominated in cluster 2; The higher contents in cluster 3 are Na+, Ca2+, NH4+, HCO3-, F−, TDS, free CO2, Fe2+, oxygen consumption, total hardness, EC, and total alkalinity; cluster 4 contains: CO32-, NO3−; The higher contents in cluster 5 are: Ca2+, Cl−, SO42-, NO3−, TDS, free CO2, Fe3+,nitrite, oxygen consumption, total hardness, EC, and total alkalinity. Figure 6 shows the corresponding distribution of each ion on the SOM classification results. On the other hand, groundwater samples in nodes with relatively low ion concentrations are located in the upper left and upper right corners of each SOM diagram.
The groundwater data were analyzed by using the SOM method. 100 (10 × 10) output neurons were selected (Figure 5), and the sampling points were divided into 5 clusters (Figure 4). Neurons use color coding to display the weight vector value of each neuron. Blue and red correspond to the parameters with low and high concentrations, respectively. Therefore, the interdependence of the variables can be identified by comparing the color of the neurons. As can be seen from Figure 5, HCO3−, Na+, and Mg2+ have similar color gradients, Cl− and NO3− have similar gradients, and Al and nitrite have similar gradients, indicating that they may be controlled by the same hydrochemical process. Cl−, SO42-, and NO3− are negatively correlated with HCO3−, Na+, and Mg2+ by an inverse color gradient, indicating that Cl−, SO42-, NO3−, and HCO3−, Na+, and Mg2+ are controlled by different sources. Fe3+, Fe2+, and NH4+ have obvious similarities in color gradient, indicating that they undergo common hydrochemical processes such as REDOX reactions.
3.3 Assessment of Water Quality of the Five Clusters of the Monitoring Wells
If the water quality scores of a single monitoring well are compared, some errors may occur. Therefore, the score of a single monitoring well is calculated and the outliers in each cluster and each cluster of water quality are eliminated, so the score obtained is more persuasive and credible. The removal of the outliers is very important for water quality evaluation, and the entropy method can be very convenient in carrying out this step, but the comprehensive evaluation method is very difficult to carry out this step.
The average score and ranking of the five types of water quality data after pretreatment are obtained in Table 3:
The score obtained by the entropy method is obtained by the information contribution of various pollution components to water quality. The higher the score, the worse the water quality, and vice versa. After removing the outliers, the average score of each monitoring well was calculated, and the modified score was used as the final score of the monitoring well. The best water quality is located cluster 4, followed by cluster 1 and cluster 2 with close scores; the fourth and fifth are clusters 5 and 3, respectively.
4 Discussion
4.1 Evaluation of Water Quality in the Five Clusters
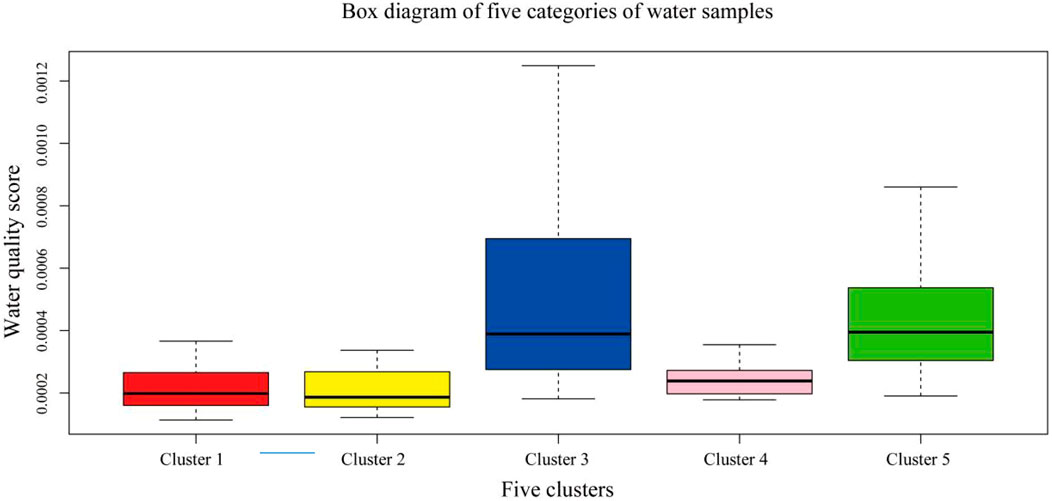
The minimum DBI corresponding to the most appropriate number of clusters is 5. And the box diagram of the water quality score for the five clusters is shown in Figure 7. From Figure 7, we could find that the water quality in cluster 3 is the worst, followed by cluster 5.
According to the classification of SOM, the wells of clusters 1, 2, and 4 are highly similar, and those of clusters 3 and 5 are highly similar. Combined with Figure 3, it can be seen that cluster 2 is located in the central and eastern areas of the study area and belongs to the living area, while cluster 3 is distributed in the southeast area of the study area and near the QianRuiying landfill site. The scores of the two are 0.2634 and 0.5737, respectively. Although clusters 2 and 3 are very close, there is a large difference in the water quality, indicating the large effect of different pollution sources on the water quality of the aquifer. Cluster 1 is distributed in the south of the study area, located in the area of Zhanggezhuang–Machangying–Tianjingcun, which is away from the urban, and thus made the relative goodness of the water quality. Cluster 4 is mainly distributed in the northeastern side of the Pinggu Basin, and also the upstream of the region, thus with low score and good water quality. The water quality scores of cluster 1 and 2 are very similar. Cluster 5 is distributed in the southwest region of the study area, including Yukou Town Industrial Park and a large area of farmlands (Figure 2A), with industrial pollution and agricultural pollution, with a score of 0.5718 and thus indicating bad water quality. The scores of cluster 5 and cluster 3 are very similar, both of which have persistent pollution.
4.2 Spatial Distribution of Each Clusters
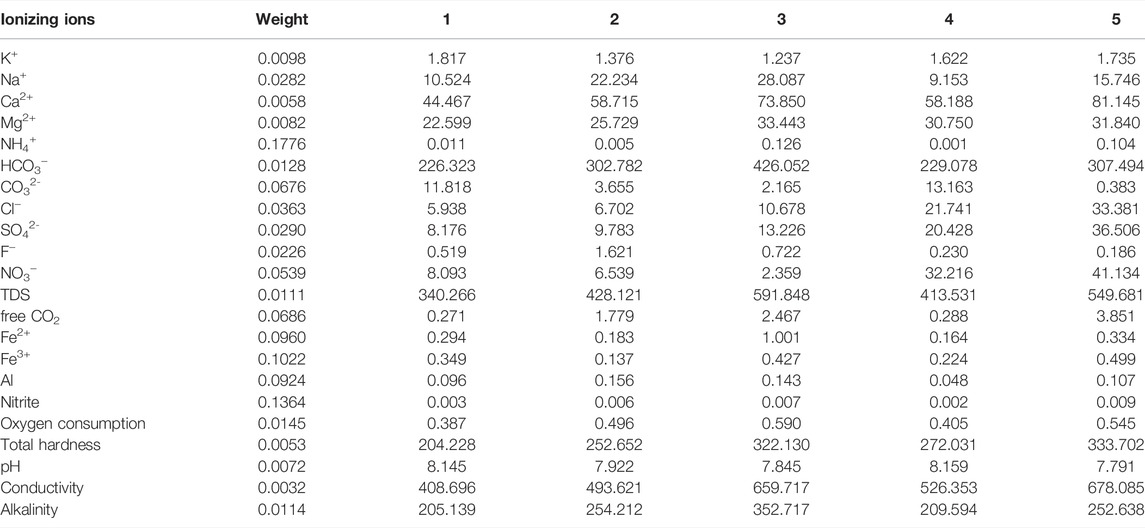
By using the entropy method, we obtained the weight value and average concentration of the corresponding chemical components of each groundwater sample (Table 4). The weight value of each chemical component is important for the water quality assessment, and it explains the importance of various chemical components that should be chosen for monitoring. And the components with the largest weight could be selected for monitoring if multiple components exist. The columns 3 to 7 showed the average concentration of the five levels of the groundwater. If such a classification could be corresponding to the result of SOM, then we could conclude that our model is reasonable and could be further used in the water quality classification and assessment.
Through the calculation of water quality, the weight value of each ion and the average concentration of each ion in the 5 types of monitoring wells were obtained. The ions with higher weights are respectively: NH4+, Nitrite, Fe3+, Fe2+, Al, free CO2, CO32-, NO3−, and Cl−, and other ions have a relatively low proportion. In addition, the average concentration and source of each ion in cluster 1 to cluster 5 are discussed below.
For the monitoring wells of cluster 1, they are distributed in the south side of the study area, mainly in the Zhanggezhuang–Machangying–Tianjingcun areas (The blue dotted box is shown in Figure 1). The distribution of the monitoring wells is relatively concentrated. PG-20 is located in the first layer aquifer, PG-9, 10, 15, and 37 are located in the second aquifer, PG-7 and 22 are located in the third aquifer, and PG-2 and 14 are located in the forth layer of the aquifer. As can be seen from the SOM topology, the CO32- is most similar with pH, and it is contrary to the trend of free CO2. Combined with Table 4, it can be seen that the average concentration of each component is relatively low in the five types of waters. The reasons may be as follow: It is possible that these groundwater samples are all outside the town, with a certain distance from downtown. The second reason maybe that there are only very few monitoring wells that are distributed in the first layer. Thus the groundwater is difficult to be contaminated. As can be seen from the SOM topology in Figure 4, the upper-left corner (cluster 1) is dark, indicating the low concentration of each chemical component. The average score of the water quality in cluster 1 was 0.2658, showing good quality comparing with cluster 3 and cluster 5.
For cluster 2, the distribution of the monitoring wells is slightly scattered, but they are mainly distributed in the eastern and central areas of the study area. PG-28, 29, and 30 are located in the same place which monitors layer 3, layer 2, and layer 1 aquifer. And the PG-36 to PG-39 monitoring wells are located in layer 4, layer 3, layer 2, and layer 1. PG-28, 29, and 30 are classified in cluster 3 with the worst water quality. The PG-28, 36, 37, 38, 39, 46, 48, and 50 wells are located in the middle of the study area. Among them, the PG-39, 46, 48, and 50 wells are located in the first layer. The distribution of the latter three wells is relatively scattered, and the distribution of the PG-28, 36, 37, 38, and 39 wells is relatively concentrated. The area is located in the main urban area, which has suffered from the effect of human activities. The PG-8, 21, 31, 32 wells are near the Yingcheng and Ma Fang towns (The blue dotted box is shown in Figure 1), which are distributed at the edge of the study area and the east with a sparse population. Therefore, the groundwater is less polluted by human activities and the concentration of chemical components is low. Among the calculated average concentration, the contents of Na+ and F− (Xiao et al., 2022) are very high, with 22.234 mg/l and 1.621 mg/l, respectively, which is consistent with the results of SOM topology in Figure 4. The average score of cluster 2’s water quality is 0.2634, which is very close to cluster 1. Thus, the water quality in cluster 2 is also good.
For cluster 3, these monitoring wells are located in the southeast of the central part of the study area. It can be seen from the SOM gray topology that the concentrations of Na+, Mg2+, HCO3−, NH4+, F−, TDS, Fe2+, total hardness, electrical conductivity, and total alkalinity are relatively high. This result can also be matched with the average concentration in Table 3. This cluster is mainly located near the Pinggu landfill, and it is found that there are reductive garbage leachates in the area without oxidation that enter into the groundwater in a relatively closed accumulation environment, resulting in strong reducibility. Here, the concentrations of SO42- and NO3− are 13.226 mg/L and 2.359 mg/L, respectively. The sources of pollution from the monitoring wells near the dump site include ammonia nitrogen, nitrate (Xiao et al., 2021; Yong et al., 2022), and nitrite. Therefore, the measured concentrations of NH4+ and nitrite are 0.126 mg/L and 0.007 mg/L, respectively. The PG-22, 23, and 24 wells are located in the same place, and monitoring layer 3, layer 2, and layer 1, respectively. The PG-40, 41, 42, and 43 wells are located in the first layer and are very concentrated. Therefore, the horizon distribution of cluster I’s monitoring wells, the concentration of the same pollution component in cluster 3’s water quality must be higher. In addition, due to the impact of a landfill plant, the relatively high concentration of the pollution component is reasonable. Among the ion weights calculated by the entropy method, the weights of NH4+ and nitrite are the largest, which are 0.1776 and 0.1364, respectively, which shows that the aforementioned inference is reasonable. The calculated score of this kind of water quality is 0.5737, which is the highest among the five kinds of water qualities, indicating that this kind of water quality is the worst.
For cluster 4, the SOM gray topology shows that CO32-, K+ concentrations in this kind of water are relatively high, with a high mean concentration, high CO32-, K+, and NO3− concentrations. The concentrations of other chemical components are lower than those of cluster 3 and cluster 5. These monitoring wells are distributed in the Donggao Village–Hanzhuang Town–Ruoshanji area (The blue dotted box is shown in Figure 1). Some of the areas are rural areas, without large factories and a large amount of domestic wastewater pollution, so the ion concentration is relatively low. The PG-6, 11, 13, 18, and 19 wells are located in the first aquifer, and the PG-5, 33, and 34 wells are located in the second and third aquifers. And the score of the water quality is 0.2608, which is lowest among the five clusters of groundwater, indicating the best water quality in the study area.
For the wells in cluster 5, Ca2+, Cl−, SO42-, NO3−, TDS, Fe3+, nitrite, total hardness, and electrical conductivity, and the average concentration showed in high value which is consistent with the results shown in the SOM topology diagram (Figure 3). As shown in Figure 1, the study area is in the southwest, with Yu Kou Town Industrial Park (The blue dotted box is shown in Figure 1) and a large area of farmlands. The PG-27, 51, 52, 53, 57, and 58 wells are located in the first aquifer, where the PG-26 and 1 wells are located in the second and third aquifers. The possible pollution source from industrial wastewater discharge and pesticide use in this area may lead to the poor quality of water. And the water quality score of cluster 5 is 0.5718, which is close to cluster 3.
In summary, the cluster grouped by the combination of self-organizing map (SOM) and entropy-based weight determining method is quite in agreement with the distribution of the contamination sources in the study area. This also indicates that the methods proposed in this study are useful in groundwater quality assessment and possible contamination identification.
5 Conclusion
In this study, we used entropy-based weight determining method, in combination with the SOM method to evaluate the water quality and to identify the possible sources of these different clusters. Five clusters were grouped by based on the water quality score and the SOM result.
The cluster 1 is dominant with K+ and CO32-, and these monitoring wells are distributed in the south of the study area. Cluster 2 is dominant with Na+ and Cl−, and these monitoring wells are mainly distributed in the eastern and central areas of the study area. Cluster 3 is dominant with Na+, Ca2+, NH4+, HCO3−, F−, TDS, free CO2, Fe2+, oxygen consumption, total hardness, EC, and total alkalinity, and these monitoring wells are located in the southeast region of the central part of the study area. The cluster 4 is dominant with CO32-, NO3−, and these monitoring wells are distributed in the Donggao Village–Hanzhuang Town–Ruoshanji area as well as some of the rural areas. The cluster 5 is dominant with Ca2+, Cl−, SO42-, NO3−, TDS, free CO2, Fe3+, nitrite, oxygen consumption, total hardness, EC, and total alkalinity, and these monitoring wells are distributed in the southwest region of the study area.
Our results show that large-scale farming and intensive industrial activities in the southwest region of the study area increased the concentrations of Ca2+, Cl−, SO42-, NO3−, TDS, Fe3+, and nitrite in the groundwater. In the southeast region of the study area, the concentrations of Mg2+, HCO3−, NH4+, F−, TDS, and Fe2+ were mainly caused by landfill activities. The areas affected by domestic sewage discharge are the southern, central, eastern, and northwest regions of the study area. The Na+, F− concentrations in the central and eastern regions are higher, and the K+, NO3− concentrations in the northwest region are higher.
Based on the SOM classification results, the entropy method was used to calculate the ranking of the five types of water quality: cluster 4 > cluster 1 > cluster 2 > cluster 5 > cluster 3. The pollution of the monitoring wells of clusters 1, 2, and 4 in the water is low, and the pollution of the monitoring wells of clusters 3 and 5 in the water is high. According to the water quality score and the influence of surrounding pollution, the influence degree can be inferred as follows: Industrial and farmland > landfill > living quarters. Industrial wastewater, pesticides, garbage, and other polluting components will infiltrate into the aquifer and cause water pollution. Therefore, water quality monitoring is conducive to the control of industrial wastewater treatment, rational use of pesticides, and proper disposal of garbage, which can protect the groundwater to a certain extent and prevent it from further pollution.
SOM classification results correspond to water quality calculation results of the entropy method, which also shows the reliability and applicability of these two models. SOM can provide groups for the calculation of the entropy method and improve the accuracy of the calculation results of the entropy method. At the same time, the entropy method is used to evaluate water quality based on the SOM classification results, and the data are further calculated and analyzed. In addition, based on the research results of this article, it is shown that the combination of these two models can be used to search and distinguish groundwater pollution sources, and these provide a new way for groundwater protection and purification.
Based on the aforementioned analysis, this model evaluates the water quality of monitoring wells from two aspects: spatial distribution of the pollution components and water sample evaluation. The results are consistent with those reported in Pinggu and with the research results of other scholars. It shows that this model is suitable for water quality assessment of multiple monitoring wells, and the effect is good.
Data Availability Statement
The raw data supporting the conclusions of this article will be made available by the authors, without undue reservation.
Author Contributions
SL, ZZ, and ZS contributed to conception and design of the study. SL, NS, SQ, and JL organized the database, SL and NS performed the statistical analysis. SL, ZZ, NS, SQ, and ZS wrote the first draft of the manuscript. All authors contributed to the manuscript revision, read, and approved the submitted version.
Conflict of Interest
The authors declare that the research was conducted in the absence of any commercial or financial relationships that could be construed as a potential conflict of interest.
Publisher’s Note
All claims expressed in this article are solely those of the authors and do not necessarily represent those of their affiliated organizations, or those of the publisher, the editors, and the reviewers. Any product that may be evaluated in this article, or claim that may be made by its manufacturer, is not guaranteed or endorsed by the publisher.
References
Amiri, V., Rezaei, M., and Sohrabi, N. (2014). Groundwater Quality Assessment Using Entropy Weighted Water Quality Index (EWQI) in Lenjanat, Iran. Environ. Earth Sci. 72 (9), 3479–3490. doi:10.1007/s12665-014-3255-0
Bodrud-Doza, M., Islam, A. R. M. T., Ahmed, F., Das, S., Saha, N., and Rahman, M. S. (2016). Characterization of Groundwater Quality Using Water Evaluation Indices, Multivariate Statistics and Geostatistics in Central Bangladesh. Water Sci. 30 (1), 19–40. doi:10.1016/j.wsj.2016.05.001
Choi, B.-Y., Yun, S.-T., Kim, K.-H., Kim, J.-W., Kim, H. M., and Koh, Y.-K. (2014). Hydrogeochemical Interpretation of South Korean Groundwater Monitoring Data Using Self-Organizing Maps. J. Geochem. Explor. 137, 73–84. doi:10.1016/j.gexplo.2013.12.001
Garcı́a, H. L., and González, I. M. (2004). Self-Organizing Map and Clustering for Wastewater Treatment Monitoring. Eng. Appl. Artif. Intell. 17 (3), 215–225. doi:10.1016/j.engappai.2004.03.004
Gharibi, H., Mahvi, A. H., Nabizadeh, R., Arabalibeik, H., Yunesian, M., and Sowlat, M. H. (2012). A Novel Approach in Water Quality Assessment Based on Fuzzy Logic. J. Environ. Manage. 112, 87–95. doi:10.1016/j.jenvman.2012.07.007
Gleeson, T., Befus, K. M., Jasechko, S., Luijendijk, E., and Cardenas, M. B. (2016). The Global Volume and Distribution of Modern Groundwater. Nat. Geosci. 9 (2), 161–167. doi:10.1038/ngeo2590
Jiang, T., Qu, C., Wang, M., and Hu, B. (2017). Hydrochemical Characteristics of Shallow Groundwater and the Origin in the Pinggu Plain, Beijing. J. Arid Land Resour. Environ. 31 (11), 122–127.
Jin, Y.-H., Kawamura, A., Park, S.-C., Nakagawa, N., Amaguchi, H., and Olsson, J. (2011). Spatiotemporal Classification of Environmental Monitoring Data in the Yeongsan River Basin, Korea, Using Self-Organizing Maps. J. Environ. Monit. 13 (10), 2886–2894. doi:10.1039/c1em10132c
Kohonen, T. (1995). “Self-Organizing Maps,” in Series in Information Sciences (Heidelberg: Springer), 30. doi:10.1007/978-3-642-97610-0
Li, J., Shi, Z., Wang, G., and Liu, F. (2020a). Evaluating Spatiotemporal Variations of Groundwater Quality in Northeast Beijing by Self-Organizing Map. Water 12 (5), 1382. doi:10.3390/w12051382
Li, J., Wang, Y., Zhu, C., Xue, X., Qian, K., Xie, X., et al. (2020b). Hydrogeochemical Processes Controlling the Mobilization and Enrichment of Fluoride in Groundwater of the North China Plain. Sci. Total Environ. 730, 138877. doi:10.1016/j.scitotenv.2020.138877
Li, P.-Y., Qian, H., and Wu, J.-H. (2011). Application of Set Pair Analysis Method Based on Entropy Weight in Groundwater Quality Assessment-A Case Study in Dongsheng City, Northwest China. E-Journal Chem. 8, 879683. doi:10.1155/2011/879683
Li, P., Wu, J., Qian, H., Lyu, X., and Liu, H. (2014). Origin and Assessment of Groundwater Pollution and Associated Health Risk: A Case Study in an Industrial Park, Northwest China. Environ. Geochem Health 36 (4), 693–712. doi:10.1007/s10653-013-9590-3
Nguyen, T. T., Kawamura, A., Tong, T. N., Nakagawa, N., Amaguchi, H., and Gilbuena, R. (2015). Clustering Spatio-Seasonal Hydrogeochemical Data Using Self-Organizing Maps for Groundwater Quality Assessment in the Red River Delta, Vietnam. J. Hydrology 522, 661–673. doi:10.1016/j.jhydrol.2015.01.023
Omo-Irabor, O. O., Olobaniyi, S. B., Oduyemi, K., and Akunna, J. (2008). Surface and Groundwater Water Quality Assessment Using Multivariate Analytical Methods: A Case Study of the Western Niger Delta, Nigeria. Phys. Chem. Earth Parts A/B/C 33 (8-13), 666–673. doi:10.1016/j.pce.2008.06.019
Sanchez-Martos, F., Aguilera, P. A., Garrido-Frenich, A., Torres, J. A., and Pulido-Bosch, A. (2002). Assessment of Groundwater Quality by Means of Self-Organizing Maps: Application in a Semiarid Area. Environ. Manag. 30 (5), 0716–0726. doi:10.1007/s00267-002-2746-z
Shannon, C. E. (1948). A Mathematical Theory of Communication. Bell Syst. Tech. J. 27 (3), 3270–3423. doi:10.1002/j.1538-7305.1948.tb01338.x
Vasanthavigar, M., Srinivasamoorthy, K., Vijayaragavan, K., Ganthi, R. R., Chidambaram, S., Anandhan, P., et al. (2010). Application of Water Quality Index for Groundwater Quality Assessment: Thirumanimuttar Sub-Basin, Tamilnadu, India. Environ. Monit. Assess. 171 (1-4), 595–609. doi:10.1007/s10661-009-1302-1
Xiao, Y., Hao, Q., Zhang, Y., Zhu, Y., Yin, S., Qin, L., et al. (2021). Investigating Sources, Driving Forces and Potential Health Risks of Nitrate and Fluoride in Groundwater of a Typical Alluvial Fan Plain. Sci. Total Environ. 802, 149909. doi:10.1016/j.scitotenv.2021.149909
Xiao, Y., Liu, K., Hao, Q., Li, Y., Xiao, D., and Zhang, Y. (2022). Occurrence, Controlling Factors and Health Hazards of Fluoride-Enriched Groundwater in the Lower Flood Plain of Yellow River, Northern China. Expo. Health 14, 345–358. doi:10.1007/s12403-021-00452-2
Keywords: self-organizing map (SOM), entropy method, water quality, groundwater, contamination
Citation: Lv S, Zhang Z, Sun N, Shi Z, Li J and Qu S (2022) Regional Groundwater Water Quality Assessment and Contamination Source Identification by a Self-Organizing Map and Entropy Method in Pinggu Basin, Northeast Beijing. Front. Environ. Sci. 10:946914. doi: 10.3389/fenvs.2022.946914
Received: 18 May 2022; Accepted: 21 June 2022;
Published: 10 August 2022.
Edited by:
Yong Xiao, Southwest Jiaotong University, ChinaReviewed by:
Shiyang Yin, North China Electric Power University, ChinaQichen Hao, Chinese Academy of Geological Sciences, China
Copyright © 2022 Lv, Zhang, Sun, Shi, Li and Qu. This is an open-access article distributed under the terms of the Creative Commons Attribution License (CC BY). The use, distribution or reproduction in other forums is permitted, provided the original author(s) and the copyright owner(s) are credited and that the original publication in this journal is cited, in accordance with accepted academic practice. No use, distribution or reproduction is permitted which does not comply with these terms.
*Correspondence: Zongwen Zhang, emhhbmd6d0BjYWVwLm9yZy5jbg==; Zheming Shi, c3ptQGN1Z2IuZWR1LmNu
 Shaojie Lv
 Zongwen Zhang
 Ning Sun2
 Zheming Shi