 Chao Liu1†
 Ying Chen
 Xiang Li
94% of researchers rate our articles as excellent or good
Learn more about the work of our research integrity team to safeguard the quality of each article we publish.
Find out more
ORIGINAL RESEARCH article
Front. Environ. Sci., 29 June 2022
Sec. Atmosphere and Climate
Volume 10 - 2022 | https://doi.org/10.3389/fenvs.2022.945658
This article is part of the Research TopicAir Pollution and Climate Change: Interactions and Co-mitigationView all 18 articles
Northwest China has a desert, arid and semi-arid climate that makes outdoor air sampling challenging. The region is also affected by intense dust storms. Monitoring challenges from the harsh climate have limited supplies of the data needed to inform appropriate regulatory actions to address air pollution in the region. Here we combine a comprehensive set of state-of-the-art offline analytical approaches and multiple models to deconstruct the chemical nature and sources of particulate matter at arid city in northwestern China. We collected 972 samples in Jiuquan during the period March 2019 through January 2020. The annual levels of PM10 (73.7 μg/m3) exceeded the Chinese Ambient Air Quality Standard (CAAQS) Grade II of 70 μg/m3. The percentages of the sum of sulfate, nitrate and ammonium, inorganic elements, organic carbon and elemental carbon in PM10 mass ranged 6.8–15.8%, 9.9–12.2%, 9.0–27.7%, and 1.5–4.7%, respectively. Analyses of sources indicated that soil dust was a major contributor to PM10 levels in Jiuquan city accounting for 24.8–30.5%. Fugitive dust and coal combustion were the second and third largest contributors to PM10, respectively. Our results suggest that natural emissions can make air quality regulation futile. In this comprehensive particulate pollution analysis, we present the view that the sizeable regional particulate sources warrant national and regional mitigation strategies to ensure compliance with air quality requirements.
Studies have consistently shown that particulate matter (PM) can have significant deleterious effects on atmospheric quality and climate change in a region (Tsiouri et al., 2015; Tao et al., 2017b; Jiang et al., 2018; Javed and Guo, 2021). This effect has been verified to be directly related to PM level, size, and component (Almeida et al., 2009; Wang et al., 2013; Pui et al., 2014; Tao et al., 2017b). In consequence, a number of local governments have undertaken to regulate ambient PM concentrations for the benefit of air quality. To develop compliance strategies, we must pinpoint the major sources and measure their respective effects on ambient PM.
In Northwest China, attribution of emissions sources tends to prove difficult for a number of reasons: 1) a lack of integrated monitoring networks to gather comprehensive air pollution data; 2) the pollution of most cities mostly drifts in either from nearby cities or from further afield (e.g., other countries); 3) many cities are involved in a multitudinous range of industrial activities pertaining to iron and steel smelting; and 4) the high quality emission datasets necessary for dispersion models tend not to be on offer.
Even in the face of such obstacles, several source apportionment studies have in fact taken place in Lanzhou. These works discerned three main types of sources of particulate matter—crustal, long range transport, and local emissions (Chu et al., 2008; Qiu et al., 2016; Wang et al., 2016; Guan et al., 2019; Jiang et al., 2021). Research performed using satellite measurements to probe atmospheric pollution in Xinjiang autonomous region showed that soil dust, fossil fuel burning, and local vehicle exhausts constituted most of the airborne particles (Wang et al., 2020).
One past air quality study taking place on the Silk Road, Northwest China, involved PM samples being collected from multiple sites during summer and winter, 2018. The work indicated that daily average PM10 and PM2.5 concentrations in four cities were 112–152 and 70–81 μg/m3, respectively (Zhou et al., 2021). These levels were over double the Grade I daily standard of CAAQS of 50 μg/m3 for PM10 and 35 μg/m3 for PM2.5. Sand storms are commonplace in Hexi Corridor. The local climate is relatively arid most of the year, and the terrain is valley. Regrettably, these natural sands and dusts do not submit to human control or regulation, whereas the regional joint prevention and control can do some good. For example, weather warnings in advance of sand storms may prompt the population to remain inside to limit their exposure.
When samples taken on days during by extreme sand storms were factored out of previous analyses, the PM10 and PM2.5 levels in most cities of Northwest China were found to be still quite high. Any suggestion that these levels can be blamed on these extreme sand storm events risks being false. The effect of sand dust on PM level in the Hexi Corridor is not one that has been subject to extensive study, meaning that the present study offers a chance to improve air quality by looking into contributions from other significant sources. Dust is nonetheless still expected be the main contributor to atmospheric particle levels.
Jiuquan, a typical arid city in northwestern China, is located in the Silk Road Economic Belt, and has undergone rapid growth in its economic and industrial development over the past few decades. Besides, the valley landform also makes it vulnerable to surrounding desert sources. Hence, the type of air pollution in this region is a composite pollution dominated by dust and coal-fired emissions. Here we selected Jiuquan for the research as representative of the arid region of northwest China, and used detailed observations and multiple models to identify and quantify the major sources. This study qualitatively and quantitatively analyzes the air particulate pollution law of a typical arid region in northwestern China and summarizes the regional sources of PM10. The results from this study should avail for the government of northwest China in relation to the scientific and rational measures that should be used to effectively mitigate against environmental pollution from airborne particulate matter.
Jiuquan experiences the four seasons of the year as very discrete in their manifestations in light of the local weather, in consequence of which a decision was made to likewise divide the sampling into four phases selected to represent spring–28 March to 4 May 2019, summer–14 July to 13 August 2019, fall–11 October to 7 November 2019, and winter–14 December 2019 to 9 January 2020, respectively. A total of 972 PM10 samples were collected from 3 sites in Jiuquan city. Additional particulars on the sampling locations can be seen in Figure 1 and Supplementary Table S1. PM10 samples were collected on 90 mm quartz filters (Whatman, Maidstone, United Kingdom) using a particulate sampler (TH150F, Wuhan Tianhong Instruments, Wuhan, China) operating at a flow rate of 100 L/min. Three quartz filters were collected at each site at the same time. Sampling duration was 23 h, starting at 9:00 local time every day and ending at 8:00 local time the following day. Field blank filters enabled us to correct for any artifacts of gas absorption and filters’ background levels. Before and after sampling, each filter was equilibrated at a relative humidity of 50% and a temperature of 25°C for 24 h and then weighed (precision 10 μg, Sartorius, Göttingen, Germany). PM10 mass concentrations were determined from the mass difference and the sampled air volume. The aerosol-loaded filter samples were stored in a freezer at −20°C prior to analysis to prevent volatilization of particles.
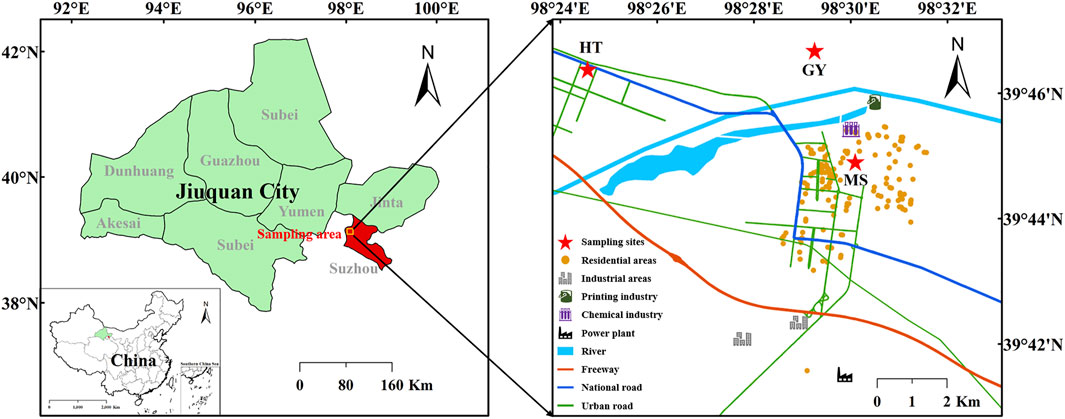
FIGURE 1. Geographical location of study area as well as sampling sites in Jiuquan city. SZ, Suzhou District site; HT, High-tech Zone site; MS, Meteorological Station site.
Filter samples were applied to determine nine water-soluble ions (WSIs). They were sectioned and a quarter of the filter was put into 10 ml ultra-pure water (18.2 MΩ) for 40 min with ultrasonic agitation to complete extract these WSIs. The solutions thus extracted were filtered (0.22 μm, PTFE, Whatman, United States) and then was analyzed using an ion chromatography (Metrohm940, Metrohm, Switzerland). Anions (F−, Cl−, NO3−, and SO42−) were separated by a Metrosep A supp5-150/4.0 column, using a mixed solution of 3.2 mmol/L Na2CO3 and 1.0 mmol/L NaHCO3 as the eluent. Cation (Na+, NH4+, K+, Ca2+, and Mg2+) concentrations were determined with the use of a Metrosep C4-150/4.0 column, using a mixed solution of 1.7 mmol/L HNO3 and 0.7 mmol/L C7H5NO4 as an eluent. A calibration was performed for each analytical sequence. Procedural blank values were subtracted from sample concentrations.
Organic carbon (OC) and elemental carbon (EC) were analyzed using a DRI model 2001 carbon analyzer (Atmoslytic, Inc., Calabasas, United States), and the IMPROVE thermal/optical reflectance (TOR) protocol (Chow and Watson, 2002; Cao, 2003; Gu et al., 2010) was used for the carbon analysis. An area of 0.526 cm2 was punched out of each filter and analyzed in the hope of detecting four OC fractions (OC1, OC2, OC3, and OC4 at 120°C, 250°C, 450°C, and 550°C, respectively, in a Helium atmosphere); PC (a pyrolyzed carbon fraction measured by finding when transmitted laser light regains its prior intensity upon addition of O2 to the analytical air being probed); and three EC fractions (EC1, EC2, and EC3 at 550°C, 700°C, and 800°C, respectively, in a 2% O2/98% He atmosphere). The IMPROVE protocol defines OC as OC1 + OC2 + OC3 + OC4 + PC and EC as EC1 + EC2 + EC3 − PC.
Following ion and carbonaceous species analysis, another quarter filter was chopped up finely and immersed in a mixed solution of concentrated HNO3 and concentrated HF. Eleven inorganic elements (Mg, Al, Ca, Fe, V, Mn, Ni, Cu, Zn, Pb, and Ba) were extracted by microwave digestion and inductively coupled plasma mass spectrometer (ICP-MS, 7900, Agilent Technologies, United States) was then employed to find the concentrations of these metals. The mixed standard solution containing 5% HNO3 was prepared into different concentration gradients, and a standard curve was established for quantitative analysis of inorganic elements.
Positive Matrix Factorization (PMF) is a multivariate receptor model that employed to measure the contributions of various emissions sources to PM. More specifics regarding this model can be found elsewhere (Wang et al., 2015; Li et al., 2016; Alahmad et al., 2021; Zhou et al., 2021). In this paper, 6 WSIs (Cl−, NO3−, SO42−, Na+, NH4+, and K+), OC, EC and 11 elements (Mg, Al, Ca, Fe, V, Mn, Ni, Cu, Zn, Pb, and Ba) were included for the PMF analysis. All these species were categorized on the basis of their signal-to-noise ratio (S/N) as “bad” (S/N < 0.2), “weak” (0.2 ≤ S/N ≤ 2) and “strong” (S/N ≥ 2) species, and PM mass was chosen as the total variable.
In order to identify the origin and pathway of the air masses reaching Jiuquan and analyze its impact on air quality, back trajectory simulation was performed by using Hybrid Single-Particle Lagrangian Integrated Trajectory (HYSPLIT) model developed by the National Oceanic and Atmospheric Administration (NOAA) Air Resource Laboratory (Draxier and Hess, 1998). 48 h backwards trajectories were worked out with the HYSPLIT model, based on an elevation of 500 m. The meteorological data utilized for this back trajectory simulation are six-hourly archive values from the National Centre for Environmental Prediction (NCEP/NCAR) Global Data Assimilation System (GDAS) dataset (available at ftp://arlftp.arlhq.noaa.gov/ pub/archives/gdas1/).
To better understand the variations of air pollutants in Hexi Corridor, five representative cities are selected for analysis according to geographical locations, including Jiuquan, Jia Yuguan, Wuwei, Jinchang, and Zhangye. Supplementary Table S2 shows the levels of CO, O3, SO2, NO2, PM2.5, and PM10 over these cities in 2019, which were obtained from government reports. The 95th percentile of CO concentrations in five cities ranged from 0.9 to 1.2 mg/m3, perfectly meeting the Grade I daily standard of CAAQS (4 mg/m3). The 90th percentile of 8-h O3 concentrations varied from 134 μg/m3 to 138 μg/m3, which is lower than the Grade II standard of CAAQS (160 μg/m3). The annual mean concentrations varied from 8 to 17 μg/m3 for SO2, and from 15 to 25 μg/m3 for NO2, both meeting the Grade I annual standard of CAAQS (20 μg/m3 for SO2 and 40 μg/m3 for NO2). The annual average PM2.5 concentrations were also lower than the Grade II annual standards of CAAQS (35 μg/m3), which are 20–28 μg/m3. The annual average PM10 concentrations in Jiuquan, Jia Yuguan, Wuwei, Jinchang, and Zhangye were 65, 61, 61, 58, and 55 μg/m3, respectively. Among these cities, the annual average PM10 concentrations of Jiuquan closed the Grade II annual standard of CAAQS (70 μg/m3), which may be explained by the valley landform and high emissions of particles from the surrounding deserts.
Table 1 shows the seasonal variations of PM levels in Jiuquan during the sampling period (March 2019–January 2020). The annual average concentrations of PM2.5 and PM10 were 24.8 and 73.7 μg/m3, which were comparable with previous studies (Guan et al., 2019). It is worth nothing that the annual average concentration of PM10 exceeded the Grade II annual standard of CAAQS (70 μg/m3). The seasonal average levels reach to the maximum in fall with mass concentrations of 27.7 (PM2.5) and 89.3 μg/m3 (PM10), and minimum in summer with the PM mass as low as 17.0 (PM2.5) and 55.2 μg/m3 (PM10). The trend of PM emissions is consistent with other cities (Gu et al., 2010; Ma and Jia, 2016). High PM concentrations often occur at the turn of the seasons, especially in late fall and early winter as well as late winter and early spring. Besides, the seasonal ratios of PM2.5/PM10 were found to have decreased in the order of 41.9% in winter, 31.0% in fall, 30.8% in summer, and 25.7% in spring. These seasonal variations might be blamed on the cooperative effects of variations in emissions and seasonal meteorological conditions. In the spring, there was a tendency for windy and dry conditions, which favor for dispersion of PM, but the low humidity would tend to discourage secondary particle production. In the summertime, the precipitation was ample and the PM might tend to be efficiently taken away by wet scavenging. In the fall, the exposed soil after the harvest mainly caused higher concentration of PM. In the winter, the highest PM2.5/PM10 ratio could be attributed to the combination effect of both strong emissions of pollutants and relatively constant atmospheric condition, the former enhances the emissions of primary pollutants and their precursor gases, while the latter tends to militate against the dispersion of air pollutants and thus tends to lead to their accumulation over nearby surfaces.
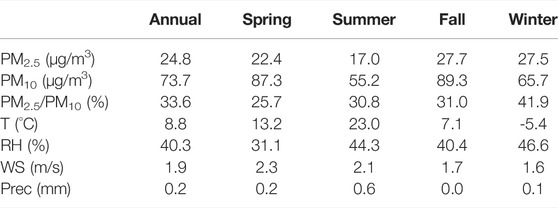
TABLE 1. Annual mean and seasonal mean of PM2.5 and PM10 mass concentrations and meteorological parameters in Jiuquan city during the entire sampling period (March 2019–January 2020). T: Temperature; RH: Relative Humidity; WS: Wind Speed; Prec: Precipitation.
The mass concentrations of WSIs and their relative effects on the PM10 levels for the present research are summarized in Table 2. We found that the WSIs concentration showed obvious seasonal variation in Jiuquan and was highest in winter (16.24 μg/m3), followed by fall (15.41 μg/m3), spring (10.23 μg/m3), and summer (6.50 μg/m3), accounting for 24.7%, 17.3%, 11.7% and 11.8% of PM10, respectively. In winter, the high levels of WSIs might be attributed to the lower air temperature, significant temperature inversion, and stronger emission sources, particularly from coal combustion for domestic heating. Clearly, NO3−, SO42−, and Ca2+ dominated the water-soluble inorganic species, being responsible for 8.5–15.8% of PM10 mass. F− showed the lowest levels of the ionic species we detected. The primary ion composition in different seasons is jointly affected by the ion formation mechanism and meteorological conditions. In summer, high temperature and increased radiation are more likely to promote the chemical reaction rate of SO2 and formation of SO42−, and high temperature could lead NH4NO3 dissociating to gaseous HNO3 and NH3 (Chiwa, 2010; He et al., 2017), so that the concentration of SO42− was higher than that of NO3−. The NO3− levels were enhanced in winter as compared to other seasons, which can be explained by the accumulation of pollutants under low temperature and stable synoptic conditions. The sulfur oxidation rates (SORs) for four seasons were all >0.1 and generally higher than the nitrogen oxidation rates (NORs) (Supplementary Table S3), implying that airborne photochemical oxidation of SO2 and the conversion of SO2 to sulfate was more likely to occur than the conversion of NO2 to nitrate (Li et al., 2016; Qin et al., 2021). Some coal-related ions such as NH4+ were more abundant in winter than in other seasons, an observation mainly believed to be due to more coal combustion for power plants and domestic heating supply (He et al., 2017). Supplementary Figure S1 shows the strong correlation between NH4+ and NO3−, which is higher than that between NH4+ and SO42−, suggesting NH4NO3 to be the major chemical fraction of WSIs, followed by (NH4)2SO4 and NH4HSO4 (He et al., 2017).
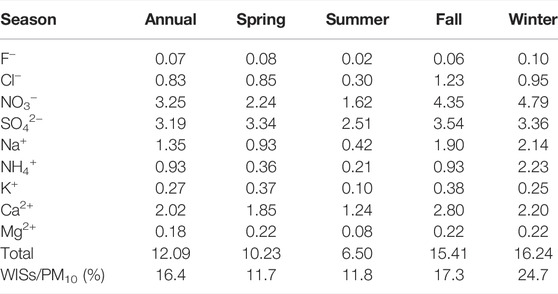
TABLE 2. Seasonal distribution of water-soluble ions mass concentrations in four seasons in Jiuquan city during the entire sampling period (μg/m3).
Anion equivalents (AE)/Cation equivalents (CE) ratios are often employed to discern the acidity of PM, and their calculation method is provided in the Supplementary Material. As shown in Figure 2, the CE/AE ratios have significant seasonal differences. Except for summer, the CE/AE ratios for spring, fall and winter were above 1, which indicated that the atmospheric particles in these three seasons were characterized as alkaline in nature. In summer, however, the CE/AE ratios was close to 1, and the particles were close to being neutral, which is associated with lower soil and industrial emissions in summer.
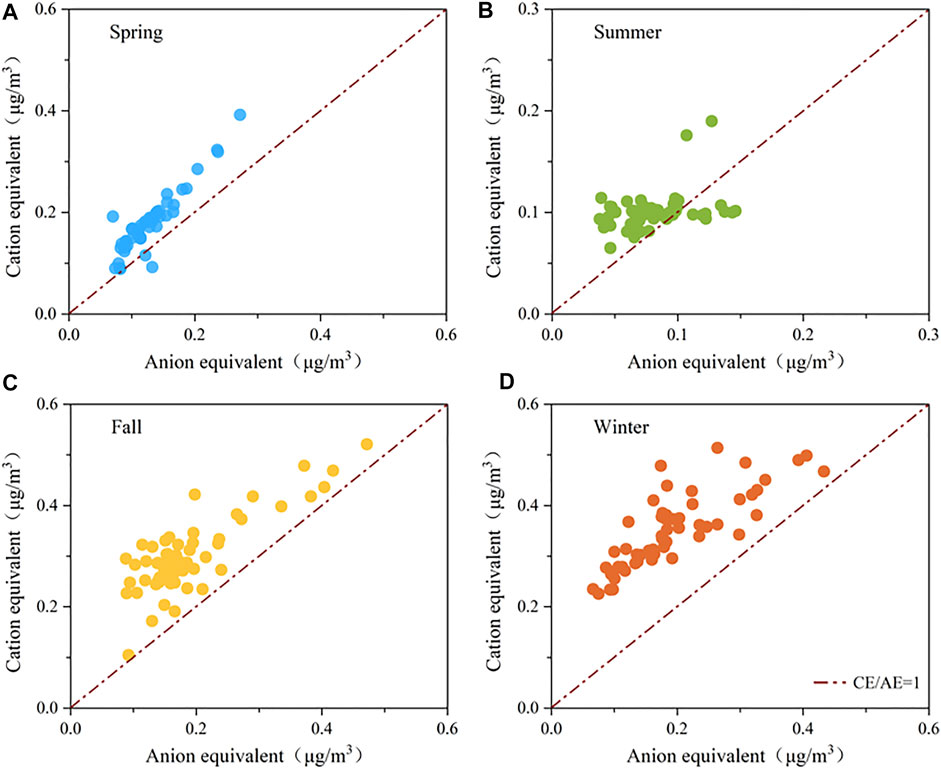
FIGURE 2. Total cation versus anion micro-equivalents concentrations in four seasons: (A) spring, (B) summer, (C) fall and (D) winter.
Carbonaceous chemicals in atmospheric aerosols are mostly made up of two species, namely, OC and EC (Zhou et al., 2021). The main origins of OC and EC include commercial coal burning, motor-vehicle exhausts and biomass combustion (Gu et al., 2010). OC can be divided into primary organic carbon (POC) that is directly emitted from anthropogenic and biogenic sources and secondary organic carbon (SOC) that is generated by atmospheric photochemical reactions. The OC/EC ratio is well regarded as an indicator of fractions attributable to primary and secondary organic aerosols (SOA). While the OC/EC ratio does depend on the length of time and methods used in the analysis, in general, an OC/EC value above 2.0–2.2 informs us that secondary organic carbon (SOC) may be produced (Zhang et al., 2013; Li et al., 2016). As shown in Figure 3 and Supplementary Table S4, the seasonal average concentration varied from 7.0 (summer) to 18.2 μg/m3 (winter) for OC and from 1.3 (spring) to 3.1 μg/m3 (winter) for EC. The OC/EC ratio does here point in the direction of potential presence of SOA with annual mean OC/EC ratios of 5.7. In particular, higher OC/EC ratio and SOC (Calculation method is provided in the Supplementary Material) concentration were detected in the wintertime as contrasted with other seasons.
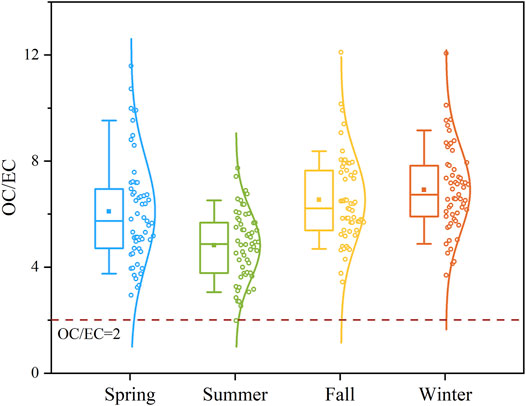
FIGURE 3. Seasonal variation of OC/EC ratios in Jiuquan city.
The mass concentrations of inorganic elements in PM10 samples are shown in Table 3. We found that the total concentration of inorganic elements was highest in fall (10.9 μg/m3), followed by spring (10.1 μg/m3), winter (7.9 μg/m3), and summer (5.4 μg/m3), accounting for 12.2%, 11.6%, 12.0% and 9.9% of PM10 mass, respectively. Moreover, the comparatively high concentrations of inorganic elements were found in the order Al > Fe > Mg > Ca, the mass contributions of these four elements made up 9.6–11.8% for PM10, and their concentration can be compared with Xi’an, Lanzhou, and other cities (Wang et al., 2013). To look into their main formation processes, the Enrichment factor (EF) method availed to tell anthropogenic and natural sources apart (Zhou et al., 2021). We entertained the idea of using Al as the reference element and judge the anthropogenic and crustal origin of inorganic elements based on a critical EF value of 10 (Hsu et al., 2010). The EFs of those elements (Mg, Al, Ca, Fe, V, Mn, Ni, Cu, Zn, Pb and Ba) in PM10 are shown in Table 3. The EFs of Mg, Al, Ca, Fe, V, Mn, Ni, Cu and Ba were <10, indicating these inorganic elements were mainly from mineral dusts, whereas the EFs of Zn and Pb were >10, indicating they are mainly from anthropogenic sources.
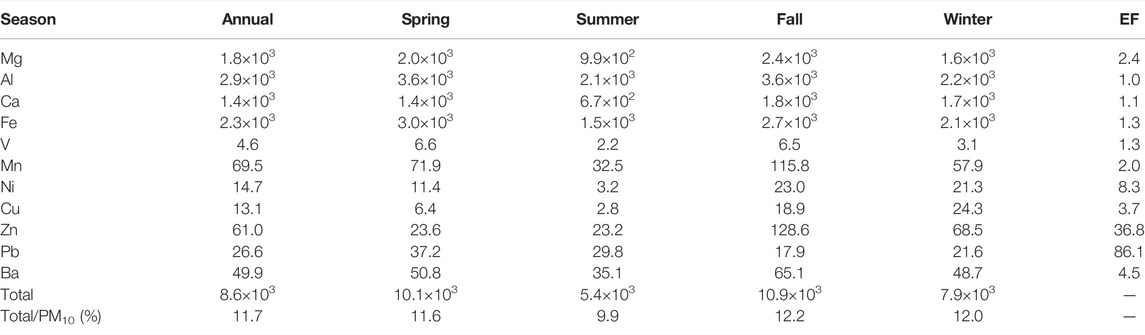
TABLE 3. Seasonal distribution of inorganic elements mass concentrations in four seasons in Jiuquan city during the entire sampling period (ng/m3).
To interpret the influence of regional sources and long-range movement of pollutants in Jiuquan, the 48-h air mass backward trajectories ending were determined by the HYSPLIT model. Figure 4 shows the backward air mass trajectories in four seasons in Jiuquan city. We found that the seasonal differences of PM10 partially caused by the different air mass origins in different seasons. For example, the highest PM10 in Jiuquan in fall seems to be something that can be attributed to the air masses coming from many deserts (17% for the Taklimakan Desert, 18% for the Badain Jaran Desert) and the Gobi Desert. The lowest PM10 in summer was due to almost 80% of air masses from the edge of the Taklimakan Desert and the Badain Jaran Desert, and only 20% of the air masses being from the Gurbantunggut Desert. In spring, air masses were mainly from both the west (38%) and northwest (23%) and basically passed the dust storm source areas including the Taklimakan Desert and the Gurbantunggut Desert. Hence, dust storms generally occurred in the spring, at which time the PM2.5/PM10 ratio was the lowest (25.7%), indicating that PM10 mostly originated from natural sources. Most of the air masses during wintertime reaching this region were from the Gobi Desert of northwest Qinghai Province (65%) passing over the industrial city of Jia Yuguan, which may be the reason for the highest PM2.5/PM10 ratio in winter.
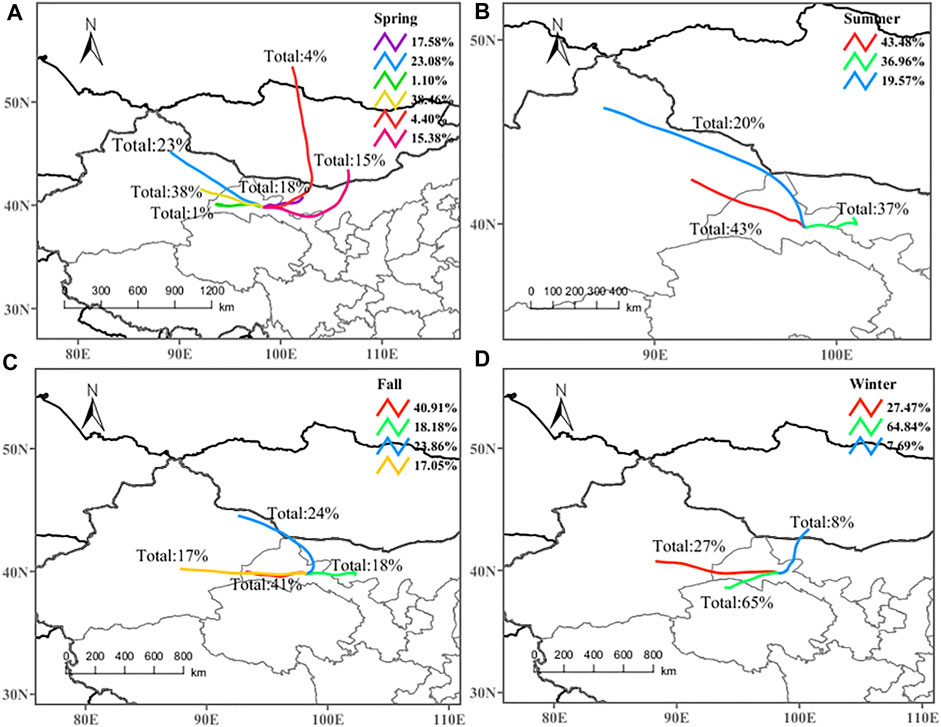
FIGURE 4. Analytical results of 48 h air mass back trajectories arriving at 500 m elevation in four seasons in Jiuquan city. The percentage in the figure represents the proportion of the air mass to the total backward trajectory.
PMF is commonly used to obtain the contributions of different source factors and their profiles. In the present study, PMF analysis employing many detected chemical species (Data Analysis Section) found seven major source factors in Jiuquan, including 1) soil dust, 2) fugitive dust, 3) coal combustion, 4) secondary aerosols, 5) traffic emissions, 6) industrial emissions, and 7) biomass burning. The profiles of these factors and their contributions to PM10 are shown in Figure 5. The details are elaborated below.
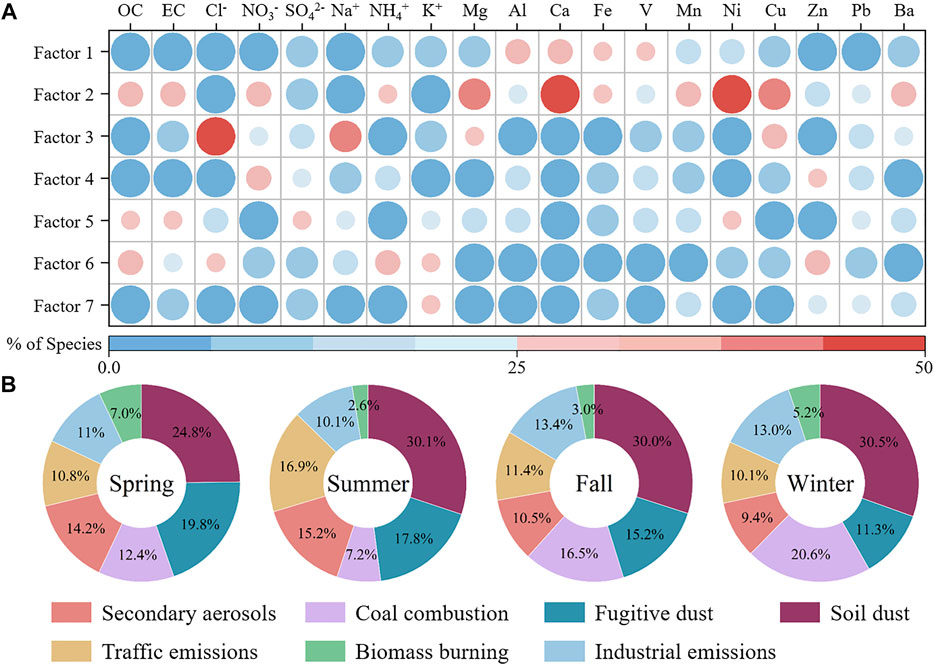
FIGURE 5. The PMF model was used to analyze the source factor profiles (A) and their relative contributions to PM10 in four seasons (B) in Jiuquan city. The color gradient represents the contribution of a certain chemical component to the source.
The first factor pertains to soil dust which includes significant concentrations of soil elements Ca, Fe, Al, and Mg in PM10 compared with other elements. These crustal elements are a known signature of soil dust (Khodeir et al., 2012; Grivas et al., 2018; Jain et al., 2020). The contribution from soil dust to PM10 mass was 24.8–30.5%. This is in good concurrence with high PM10 levels detected in Lanzhou city (Wang et al., 2009) and high fractions of soil dust in PM10 as a consequence of the low rainfall in conjunction with exposed ground conditions.
The second factor accounted for about 11.3–19.8% of PM10 mass; this was separately classed as fugitive dust emission, comprising a mixture of re-suspended road dust, construction, and demolition dust. This source profile has high loadings of Mg and Ca, which have been detected before in the construction dust (Crilley et al., 2017). This source also showed significant levels of Mn, Ni, Cu, and NO3−, linked also with re-suspended road dust (Khodeir et al., 2012; Javed and Guo, 2021).
The third factor is coal combustion characterized by elevated levels of Cl− and Pb. The concentrations of good marker of coal burning such as Cl− increased by 3.2 times, from summer to winter due to wintertime indoor heating and stagnant weather. This source was responsible for 20.6% of the PM10 mass during the winter, as against only 7.2% in summer. Coal burning has proven one of the most important sources for atmospheric particles in many of China’s cities (Song et al., 2006; Geng et al., 2013; Tao et al., 2014; Li et al., 2016; Liu et al., 2016).
The fourth factor is related to secondary aerosols characterized by high levels of SO42−, NO3−, and NH4+ in PM10, which are generated by photochemical or other chemical reaction processes. This factor contributed 9.4–15.2% to PM10 mass. Their levels show effects of precursor gases and atmospheric parameters, such as temperature, humidity, insolation, and solar radiation (Lurmann et al., 2006; Wang et al., 2016; Tan et al., 2017).
The fifth factor finds the cause of high fractions of OC, EC, Mn, and Pb in PM10, a feature of traffic emissions. The contribution from traffic exhausts to PM10 was 10.1–16.9%. Past work has demonstrated that OC and EC are the most widespread species in traffic exhaust (Kim et al., 2003; Song et al., 2006; Wang et al., 2016; Tao et al., 2017a). Mn and Pb are sometimes also generated from lubricant oil, brake linings, and tires (Zhou et al., 2004; Lough et al., 2005; Yu et al., 2013).
The sixth source is the industrial emissions, where a host of metals such as K+, Ni, and Zn, linked to iron and steel processing, serve as the signature (Song et al., 2001; Mooibroek et al., 2011). This factor contributed 13.4 and 13.0% to the PM10 mass in fall and winter, respectively. As referred to above, the majority of the air masses during fall and winter reaching this region travels across Jia Yuguan city (Figure 4), a major centre for the iron and steel industry northwestern China, which might make its mark felt on the air in Jiuquan.
The seventh factor corresponds to biomass burning, and shows high proportion of K+. Prior studies have shown that soluble K+ can be enriched in the aerosol by biomass burning (Chow et al., 2004; Duan et al., 2004; Shen et al., 2009). This factor accounted for 2.6–7.0% of PM10 mass, indicating the presence of burning vegetation and domestic wood combustion in the area.
Although PM pollution has to some extent been dealt with in the last few years in northwestern China, the annual average PM10 levels in Jiuquan were still exceeded the Grade II annual standard of CAAQS (70 μg/m3), indicating the issue of atmospheric PM pollution in the area remains significant. The seasonal mean concentration of PM10 in fall was 1.6 times higher than in summer. The water-soluble ions were dominated by three ionic species (NO3−, SO42−, and Ca2+) accounting for 8.5–15.8% of PM10 mass. PM10 in Jiuquan was alkaline by the micro-equivalents concentration methods but nearly neutral in summer, and the chemical forms of WSIs were mainly NH4NO3, (NH4)2SO4 and NH4HSO4. In general, water-soluble ions showed a definite seasonal pattern, rising in winter and falling in summer. However, the highest inorganic elements were observed in the fall. It is also worth noting that the overall carbonaceous particle matter made up around 10.5–32.4% of PM10 mass.
The back trajectory analysis corroborated the view that the long-range transport of air masses from desert areas has an important impact on the level of particulate matter in Jiuquan. In addition, seven source factors were identified for PM10 through PMF model analysis. Soil dust, fugitive dust and coal combustion are the most important sources, accounting for 24.8–30.5%, 11.3–19.8%, and 7.2–20.6% of PM10, respectively. The significant contributions of natural emissions and regional transport set a major challenge to achieving local PM standards, pointing in turn to how crucial regional collaboration is when seeking more effective control policies to reduce air pollution. The findings herein offer worthwhile initial analysis on the potential sources identified and their probable relative contributions to particulate pollution; this will thus be useful for policymakers when they advance local air quality improvement strategies and when they work on regional collaboration on pollution control policies.
The raw data supporting the conclusion of this article will be made available by the authors, without undue reservation.
CL wrote the manuscript. XL and YC reviewed and modified the manuscript. Sampling work was performed by GZ, XL, and YG. TZ and BL measured and analyzed the samples. CL and TZ provided the graphics. XL administered the project. All authors contributed to manuscript revision and read and approved the submitted version.
This work was supported by the National Natural Science Foundation of China (Nos. 42061134006 and 21876029). The authors declare no conflicts of interest.
The authors declare that the research was conducted in the absence of any commercial or financial relationships that could be construed as a potential conflict of interest.
All claims expressed in this article are solely those of the authors and do not necessarily represent those of their affiliated organizations, or those of the publisher, the editors and the reviewers. Any product that may be evaluated in this article, or claim that may be made by its manufacturer, is not guaranteed or endorsed by the publisher.
The Supplementary Material for this article can be found online at: https://www.frontiersin.org/articles/10.3389/fenvs.2022.945658/full#supplementary-material
Alahmad, B., Al-Hemoud, A., Kang, C.-M., Almarri, F., Kommula, V., Wolfson, J. M., et al. (2021). A Two-Year Assessment of Particulate Air Pollution and Sources in Kuwait. Environ. Pollut. 282, 117016. doi:10.1016/j.envpol.2021.117016
Almeida, S. M., Freitas, M. C., Repolho, C., Dionísio, I., Dung, H. M., Caseiro, A., et al. (2009). Characterizing Air Particulate Matter Composition and Sources in Lisbon, Portugal. J. Radioanal. Nucl. Chem. 281 (2), 215–218. doi:10.1007/s10967-009-0113-8
Cao, J. (2003). Characteristics of Carbonaceous Aerosol in Pearl River Delta Region, China during 2001 Winter Period. Atmos. Environ. 37 (11), 1451–1460. doi:10.1016/s1352-2310(02)01002-6
Chiwa, M. (2010). Characteristics of Atmospheric Nitrogen and Sulfur Containing Compounds in an Inland Suburban-Forested Site in Northern Kyushu, Western Japan. Atmos. Res. 96 (4), 531–543. doi:10.1016/j.atmosres.2010.01.001
Chow, J. C., Watson, J. G., Kuhns, H., Etyemezian, V., Lowenthal, D. H., Crow, D., et al. (2004). Source Profiles for Industrial, Mobile, and Area Sources in the Big Bend Regional Aerosol Visibility and Observational Study. Chemosphere 54 (2), 185–208. doi:10.1016/j.chemosphere.2003.07.004
Chow, J. C., and Watson, J. G. (2002). PM2.5 Carbonate Concentrations at Regionally Representative Interagency Monitoring of Protected Visual Environment Sites. J. Geophys. Res. 107 (D21), 6–1. doi:10.1029/2001jd000574
Chu, P. C., Chen, Y., Lu, S., Li, Z., and Lu, Y. (2008). Particulate Air Pollution in Lanzhou China. Environ. Int. 34 (5), 698–713. doi:10.1016/j.envint.2007.12.013
Crilley, L. R., Lucarelli, F., Bloss, W. J., Harrison, R. M., Beddows, D. C., Calzolai, G., et al. (2017). Source Apportionment of Fine and Coarse Particles at a Roadside and Urban Background Site in London during the 2012 Summer ClearfLo Campaign. Environ. Pollut. 220, 766–778. doi:10.1016/j.envpol.2016.06.002
Draxier, R. R., and Hess, G. D. (1998). An Overview of the HYSPLIT_4 Modelling System for Trajectories, Dispersion and Deposition. Aust. Meteorol. Mag. 47 (4), 295–308.
Duan, F., Liu, X., Yu, T., and Cachier, H. (2004). Identification and Estimate of Biomass Burning Contribution to the Urban Aerosol Organic Carbon Concentrations in Beijing. Atmos. Environ. 38 (9), 1275–1282. doi:10.1016/j.atmosenv.2003.11.037
Geng, N., Wang, J., Xu, Y., Zhang, W., Chen, C., and Zhang, R. (2013). PM2.5 in an Industrial District of Zhengzhou, China: Chemical Composition and Source Apportionment. Particuology 11 (1), 99–109. doi:10.1016/j.partic.2012.08.004
Grivas, G., Cheristanidis, S., Chaloulakou, A., Koutrakis, P., and Mihalopoulos, N. (2018). Elemental Composition and Source Apportionment of Fine and Coarse Particles at Traffic and Urban Background Locations in Athens, Greece. Aerosol Air Qual. Res. 18 (7), 1642–1659. doi:10.4209/aaqr.2017.12.0567
Gu, J., Bai, Z., Liu, A., Wu, L., Xie, Y., Li, W., et al. (2010). Characterization of Atmospheric Organic Carbon and Element Carbon of PM2.5 and PM10 at Tianjin, China. Aerosol Air Qual. Res. 10 (2), 167–176. doi:10.4209/aaqr.2009.12.0080
Guan, Q., Liu, Z., Yang, L., Luo, H., Yang, Y., Zhao, R., et al. (2019). Variation in PM2.5 Source over Megacities on the Ancient Silk Road, Northwestern China. J. Clean. Prod. 208, 897–903. doi:10.1016/j.jclepro.2018.10.199
He, Q., Yan, Y., Guo, L., Zhang, Y., Zhang, G., and Wang, X. (2017). Characterization and Source Analysis of Water-Soluble Inorganic Ionic Species in PM2.5 in Taiyuan City, China. Atmos. Res. 184, 48–55. doi:10.1016/j.atmosres.2016.10.008
Hsu, S. C., Liu, S. C., Tsai, F., Engling, G., Lin, I. I., Chou, C. K. C., et al. (2010). High Wintertime Particulate Matter Pollution Over an Offshore Island (Kinmen) off Southeastern China: An Overview. J. Geophys. Res. 115 (D17), D17309. doi:10.1029/2009jd013641
Jain, S., Sharma, S. K., Vijayan, N., and Mandal, T. K. (2020). Seasonal Characteristics of Aerosols (PM2.5 and PM10) and Their Source Apportionment Using PMF: A Four Year Study over Delhi, India. Environ. Pollut. 262, 114337. doi:10.1016/j.envpol.2020.114337
Javed, W., and Guo, B. (2021). Chemical Characterization and Source Apportionment of Fine and Coarse Atmospheric Particulate Matter in Doha, Qatar. Atmos. Pollut. Res. 12 (2), 122–136. doi:10.1016/j.apr.2020.10.015
Jiang, N., Yin, S., Guo, Y., Li, J., Kang, P., Zhang, R., et al. (2018). Characteristics of Mass Concentration, Chemical Composition, Source Apportionment of PM 2.5 and PM 10 and Health Risk Assessment in the Emerging Megacity in China. Atmos. Pollut. Res. 9 (2), 309–321. doi:10.1016/j.apr.2017.07.005
Jiang, H., Li, Z., Wang, F., Zhou, X., Wang, F., Ma, S., et al. (2021). Water-Soluble Ions in Atmospheric Aerosol Measured in a Semi-arid and Chemical-Industrialized City, Northwest China. Atmosphere 12 (4), 456. doi:10.3390/atmos12040456
Khodeir, M., Shamy, M., Alghamdi, M., Zhong, M., Sun, H., Costa, M., et al. (2012). Source Apportionment and Elemental Composition of PM2.5 and PM10 in Jeddah City, Saudi Arabia. Atmos. Pollut. Res. 3 (3), 331–340. doi:10.5094/apr.2012.037
Kim, E., Hopke, P. K., and Edgerton, E. S. (2003). Source Identification of Atlanta Aerosol by Positive Matrix Factorization. J. Air & Waste Manag. Assoc. 53 (6), 731–739. doi:10.1080/10473289.2003.10466209
Li, H., Wang, Q. g., Yang, M., Li, F., Wang, J., Sun, Y., et al. (2016). Chemical Characterization and Source Apportionment of PM2.5 Aerosols in a Megacity of Southeast China. Atmos. Res. 181, 288–299. doi:10.1016/j.atmosres.2016.07.005
Liu, B., Song, N., Dai, Q., Mei, R., Sui, B., Bi, X., et al. (2016). Chemical Composition and Source Apportionment of Ambient PM2.5 during the Non-heating Period in Taian, China. Atmos. Res. 170, 23–33. doi:10.1016/j.atmosres.2015.11.002
Lough, G. C., Schauer, J. J., Park, J.-S., Shafer, M. M., Deminter, J. T., and Weinstein, J. P. (2005). Emissions of Metals Associated with Motor Vehicle Roadways. Environ. Sci. Technol. 39 (3), 826–836. doi:10.1021/es048715f
Lurmann, F. W., Brown, S. G., McCarthy, M. C., and Roberts, P. T. (2006). Processes Influencing Secondary Aerosol Formation in the San Joaquin Valley during Winter. J. Air & Waste Manag. Assoc. 56 (12), 1679–1693. doi:10.1080/10473289.2006.10464573
Ma, X., and Jia, H. (2016). Particulate Matter and Gaseous Pollutions in Three Megacities over China: Situation and Implication. Atmos. Environ. 140, 476–494. doi:10.1016/j.atmosenv.2016.06.008
Mooibroek, D., Schaap, M., Weijers, E. P., and Hoogerbrugge, R. (2011). Source Apportionment and Spatial Variability of PM2.5 Using Measurements at Five Sites in the Netherlands. Atmos. Environ. 45 (25), 4180–4191. doi:10.1016/j.atmosenv.2011.05.017
Pui, D. Y. H., Chen, S.-C., and Zuo, Z. (2014). PM 2.5 in China: Measurements, Sources, Visibility and Health Effects, and Mitigation. Particuology 13, 1–26. doi:10.1016/j.partic.2013.11.001
Qin, Y., Li, J., Gong, K., Wu, Z., Chen, M., Qin, M., et al. (2021). Double High Pollution Events in the Yangtze River Delta from 2015 to 2019: Characteristics, Trends, and Meteorological Situations. Sci. Total Environ. 792, 148349. doi:10.1016/j.scitotenv.2021.148349
Qiu, X., Duan, L., Gao, J., Wang, S., Chai, F., Hu, J., et al. (2016). Chemical Composition and Source Apportionment of PM10 and PM2.5 in Different Functional Areas of Lanzhou, China. J. Environ. Sci. 40, 75–83. doi:10.1016/j.jes.2015.10.021
Shen, Z., Cao, J., Arimoto, R., Han, Z., Zhang, R., Han, Y., et al. (2009). Ionic Composition of TSP and PM2.5 during Dust Storms and Air Pollution Episodes at Xi'an, China. Atmos. Environ. 43 (18), 2911–2918. doi:10.1016/j.atmosenv.2009.03.005
Song, X.-H., Polissar, A. V., and Hopke, P. K. (2001). Sources of Fine Particle Composition in the Northeastern US. Atmos. Environ. 35 (31), 5277–5286. doi:10.1016/s1352-2310(01)00338-7
Song, Y., Zhang, Y., Xie, S., Zeng, L., Zheng, M., Salmon, L. G., et al. (2006). Source Apportionment of PM2.5 in Beijing by Positive Matrix Factorization. Atmos. Environ. 40 (8), 1526–1537. doi:10.1016/j.atmosenv.2005.10.039
Tan, J., Zhang, L., Zhou, X., Duan, J., Li, Y., Hu, J., et al. (2017). Chemical Characteristics and Source Apportionment of PM 2.5 in Lanzhou, China. Sci. Total Environ. 601-602, 1743–1752. doi:10.1016/j.scitotenv.2017.06.050
Tao, J., Gao, J., Zhang, L., Zhang, R., Che, H., Zhang, Z., et al. (2014). PM<sub>2.5</sub> Pollution in a Megacity of Southwest China: Source Apportionment and Implication. Atmos. Chem. Phys. 14 (16), 8679–8699. doi:10.5194/acp-14-8679-2014
Tao, J., Zhang, L., Cao, J., and Zhang, R. (2017a). A Review of Current Knowledge Concerning PM<sub>2. 5</sub> Chemical Composition, Aerosol Optical Properties and Their Relationships across China. Atmos. Chem. Phys. 17 (15), 9485–9518. doi:10.5194/acp-17-9485-2017
Tao, J., Zhang, L., Cao, J., Zhong, L., Chen, D., Yang, Y., et al. (2017b). Source Apportionment of PM2.5 at Urban and Suburban Areas of the Pearl River Delta Region, South China - with Emphasis on Ship Emissions. Sci. Total Environ. 574, 1559–1570. doi:10.1016/j.scitotenv.2016.08.175
Tsiouri, V., Kakosimos, K. E., and Kumar, P. (2015). Concentrations, Sources and Exposure Risks Associated with Particulate Matter in the Middle East Area-A Review. Air Qual. Atmos. Health 8 (1), 67–80. doi:10.1007/s11869-014-0277-4
Wang, S., Feng, X., Zeng, X., Ma, Y., and Shang, K. (2009). A Study on Variations of Concentrations of Particulate Matter with Different Sizes in Lanzhou, China. Atmos. Environ. 43 (17), 2823–2828. doi:10.1016/j.atmosenv.2009.02.021
Wang, J., Hu, Z., Chen, Y., Chen, Z., and Xu, S. (2013). Contamination Characteristics and Possible Sources of PM10 and PM2.5 in Different Functional Areas of Shanghai, China. Atmos. Environ. 68, 221–229. doi:10.1016/j.atmosenv.2012.10.070
Wang, Q. Q., Huang, X. H. H., Zhang, T., Zhang, Q., Feng, Y., Yuan, Z., et al. (2015). Organic Tracer-Based Source Analysis of PM 2.5 Organic and Elemental Carbon: A Case Study at Dongguan in the Pearl River Delta, China. Atmos. Environ. 118, 164–175. doi:10.1016/j.atmosenv.2015.07.033
Wang, Y., Jia, C., Tao, J., Zhang, L., Liang, X., Ma, J., et al. (2016). Chemical Characterization and Source Apportionment of PM2.5 in a Semi-arid and Petrochemical-Industrialized City, Northwest China. Sci. Total Environ. 573, 1031–1040. doi:10.1016/j.scitotenv.2016.08.179
Wang, W., Samat, A., Abuduwaili, J., and Ge, Y. (2020). Spatio-Temporal Variations of Satellite-Based PM2.5 Concentrations and its Determinants in Xinjiang, Northwest of China. Int. J. Environ. Res. Public Health 17 (6), 2157. doi:10.3390/ijerph17062157
Yu, L., Wang, G., Zhang, R., Zhang, L., Song, Y., Wu, B., et al. (2013). Characterization and Source Apportionment of PM2.5 in an Urban Environment in Beijing. Aerosol Air Qual. Res. 13 (2), 574–583. doi:10.4209/aaqr.2012.07.0192
Zhang, R., Jing, J., Tao, J., Hsu, S.-C., Wang, G., Cao, J., et al. (2013). Chemical Characterization and Source Apportionment of PM<sub>2.5</sub> in Beijing: Seasonal Perspective. Atmos. Chem. Phys. 13 (14), 7053–7074. doi:10.5194/acp-13-7053-2013
Zhou, L., Hopke, P. K., Paatero, P., Ondov, J. M., Pancras, J. P., Pekney, N. J., et al. (2004). Advanced Factor Analysis for Multiple Time Resolution Aerosol Composition Data. Atmos. Environ. 38 (29), 4909–4920. doi:10.1016/j.atmosenv.2004.05.040
Keywords: arid region, particulate matter, chemical composition, source apportionment, dust, regional transport
Citation: Liu C, Zhang T, Lu B, Zheng G, Liu X, Gao Y, Chen Y and Li X (2022) Multiple Models Used to Deconstruct the Characteristics of Atmospheric Particles in Arid Region of Northwest China. Front. Environ. Sci. 10:945658. doi: 10.3389/fenvs.2022.945658
Received: 16 May 2022; Accepted: 06 June 2022;
Published: 29 June 2022.
Edited by:
Shupeng Zhu, University of California, Irvine, United StatesCopyright © 2022 Liu, Zhang, Lu, Zheng, Liu, Gao, Chen and Li. This is an open-access article distributed under the terms of the Creative Commons Attribution License (CC BY). The use, distribution or reproduction in other forums is permitted, provided the original author(s) and the copyright owner(s) are credited and that the original publication in this journal is cited, in accordance with accepted academic practice. No use, distribution or reproduction is permitted which does not comply with these terms.
*Correspondence: Xiang Li, bGl4aWFuZ0BmdWRhbi5lZHUuY24=; Ying Chen, eWluZ2NoZW5AZnVkYW4uZWR1LmNu
†These authors have contributed equally to this work and share first authorship
Disclaimer: All claims expressed in this article are solely those of the authors and do not necessarily represent those of their affiliated organizations, or those of the publisher, the editors and the reviewers. Any product that may be evaluated in this article or claim that may be made by its manufacturer is not guaranteed or endorsed by the publisher.
Research integrity at Frontiers
Learn more about the work of our research integrity team to safeguard the quality of each article we publish.