 Cong Ou
 Yongsheng Wang
- Institute of Geographic Sciences and Natural Resources Research, Chinese Academy of Sciences (CAS), Beijing, China
Rapid urbanization and economic development have led the diversified food production and consumption. In this context, as a highly efficient and intensive cultivated land use form, Greenhouse-led cultivated land (GCL) has continuously increased in recent decades worldwide. Previously works have documented the irrational expansion of GCL in challenging the ecological environment and sustainable agricultural development. However, these studies either have been short-term and point-based studies or have not revealed the long-term causes, process and patterns in a large-scale. In this study, long-term annual remote sensing-based and statistical data were used to investigate the spatiotemporal dynamics of GCL and its drivers in Shandong province, China from 1989 to 2018. The results showed that: 1) GCL in Shandong was toward continuous clustering dominated by medium-low and medium densities, showing the same trend as the increase of its total area; 2) GCL with a cumulative duration of more than 15 years and a demolition frequency of less than 0.2 were mainly distributed in the industrial clustering regions and roughly formed a circular expansion pattern around the central mountainous area with the most expansion period appeared in the mid-2010’s; 3) Budget expenditure for rural development, local retail sales and average earnings of local farmers were the most important local driving factors of the GCL expansion in Shandong. 4) The competition of external vegetable supply and the consumption demand from Beijing were the main external driving forces of the expansion of GCL in Shandong. These findings can enhance the comprehensive understanding of typical component of “Human-Nature” interaction and support the sustainable development of regional agriculture.
1 Introduction
With rising need for a balanced food supply within a year and the advancement of agricultural technology in recent decades, the total area of protected agriculture has continuously increased at a rate of close to 20% per year around the world (Jiménez-Lao et al., 2020). In this context, greenhouse-led cultivated land (GCL) has been widely utilized worldwide, with an estimated area of 3.02 million hectares in 2016 (Briassoulis et al., 2016), offering a micro-scale environment to counteract unfavorable natural conditions for agricultural output. Although GCL has revolutionized extensive farming to intensive farming, changed the form of seasonal food supply, and improved the socio-economic well-being of small-scale farmers (Baudoin and Von Zabeltitz, 2002; González-Yebra et al., 2018; Shi et al., 2022), its rapid global expansion has also posed a number of ecological threats to the local environment, such as soil continuous crop obstacle (Wen-shou, 2004), soil biodiversity degradation (Zhang et al., 2015), irrational fertilizer use (Min et al., 2012) or plastic waste (Sica and Picuno, 2007). However, as a typical agricultural component that people interact with natural systems (Liu et al., 2007; Zou et al., 2022), the long-term causes, processes and patterns of GCL still unclear. It is critical to investigate the spatiotemporal dynamics of GCL and its drivers over a long-term period to comprehend the complexity of the typical component of “Human-Nature” interaction and support the sustainable development of agriculture and ecosystem.
According to the results of the Seventh National Census, China’s urban population reached 930 million in 2021, up 729 million since the “reform and opening-up” policy was implemented in 1978. In this context, due to government policy support and urban food-consumption demand, GCL in China have rapidly increased from mid-1980, and reached the world’s greatest coverage of 1.32 million hectares in 2016. The rapid expansion of GCL in China not only brought some of the above-mentioned environmental issues, but also posed a threat to China’s strictest policy of protecting cultivated land and ensuring food security (Liu et al., 2020), as the GCL are always disorderly developed by the autonomous behavior of local farmers in the early stages (Ge et al., 2019), reducing the possibility of restoring grain-planting and the rational rural land use (He and Ma, 2007; Su et al., 2019). Shandong province began to promote GCL for the growing of vegetables in the early 1990s, particularly in Shouguang (a county in Shandong), which is known as “China’s cradle of ‘Winter-Warm’ greenhouse” (Ma et al., 2021). Exploring the spatiotemporal dynamics of GCL and its drivers in Shandong can provide a clear historical picture of the China’s remarkable GCL expansion as well as a scientific reference for other protected agriculture developing areas.
Remote sensing technology has been proved its advantages in spatio-temporal explicit monitoring for GCL on different scales when compared to traditional statistics (Jiménez-Lao et al., 2020). Multiple sources of satellite imagery have introduced for GCL mapping, including Landsat TM/ETM+/OLI (Levin et al., 2007; Chaofan et al., 2016), Sentinel-2 MSI (Novelli et al., 2016; Balcik et al., 2019), GF-1/2 (Gao et al., 2018; Li et al., 2020), QuickBird (Agüera et al., 2008; Agüera and Liu, 2009; Carvajal et al., 2010) or WorldView-2 (Koc-San, 2013; Aguilar et al., 2014), etc. Meanwhile, a number of unsupervised methods based on the novel AG-extraction indices, such as the vegetable land extraction index (VI) (Zhao et al., 2004), moment distance index (MDI) (Aguilar et al., 2016), plastic-mulched landcover index (PMLI) (Lu et al., 2014), plastic greenhouses index (PGI) (Yang et al., 2017) and greenhouses detection index (GDI) (González-Yebra et al., 2018), have been proposed to distinguish GCL from other land use types. In order to improve the robustness of such unsupervised methods, previous studies also have adopted the supervised approaches, such as support vector machine (SVM) (Bektas Balcik et al., 2020), random forest (RF) (Lin et al., 2021), artificial neural network (ANN) (Carvajal et al., 2006) and convolutional neural network (CNN) (Sun et al., 2021), to extract the spatial distribution of GCL. Despite the fact that all of these researches performed well and produced a number of accurate GCL maps in various locations and years, only a few studies used the resulting GCL maps to detect spatio-temporal dynamics and driving forces of GCL (Arcidiacono and Porto, 2010; Picuno et al., 2011; Yu et al., 2017; Ou et al., 2020). To our knowledge, a few of these studies have revealed the annual spatiotemporal dynamics of GCL and its drivers over a large-scale and long-term period, which failed to provide a comprehensive and macroscale description of GCL for policymakers.
In this paper, in order to address the aforementioned research gaps, a comprehensive analysis framework that integrated spatial information entropy, kernel density estimation, time-series segmentation sliding algorithm, annual expansion index, geographic detector and granger causality test, was proposed to investigate the spatiotemporal dynamics of GCL and its drivers in Shandong from 1989 to 2018 using long-term annual remote sensing-based and statistical data. The main contributions of this paper were as follows:
• The spatio-temporal dynamics of GCL, including spatial clustering, temporal continuity and expansion trajectory in Shandong were quantified;
• The local driving mechanism between GCL expansion and the change of local economic scale, population growth, transportation conditions, rural infrastructure, consumption demand, farmers’ willingness as well as government support in Shandong were detected;
• The external driving mechanism between GCL expansion and the change of the supply and demand of vegetables in external markets in Shandong were clarified.
2 Materials and Methods
2.1 Study Area
Shandong province is located in the eastern coastal region of China (34°22’∼38°24’N, 114°47’∼122°42’E), with a total area of approximate 157,900 km2 (Figure 1). The inland area of Shandong borders the provinces of Tianjin, Hebei, Henan, Anhui, and Jiangsu from north to south and the coastal area of Shandong is surrounded by the Yellow Sea and the Bohai Sea. Its landform can be characterized as a mountain area dominating the south-central part, a plain area dominating the southwest and northwest, and a hill area dominating the east. The study area belongs to a warm temperate monsoon climate zone, with the annual average temperature, ranging from 11 to 14°C and the annual average precipitation, ranging from 550 to 950 mm. Due to such geographical conditions, Shandong has become a major agricultural production province in China, with a cultivated land area of about 7.59 million hectares. In 2019, the total agricultural output value of the province was 547.65 billion yuan and the grain output was 53.57 million tons, ranking second in the country. Furthermore, Shandong province is not only a major grain producing province, but also an important cash crop producing province in China, with a highest export volume of agricultural products for decades. Particularly in the vegetable-producing industry, Shandong ranked first in the national vegetable supply provinces, with an output of 81.92 million tons, and the planting area of protected vegetables accounting for approximately one-fourth of the planting area of protected vegetables in China.
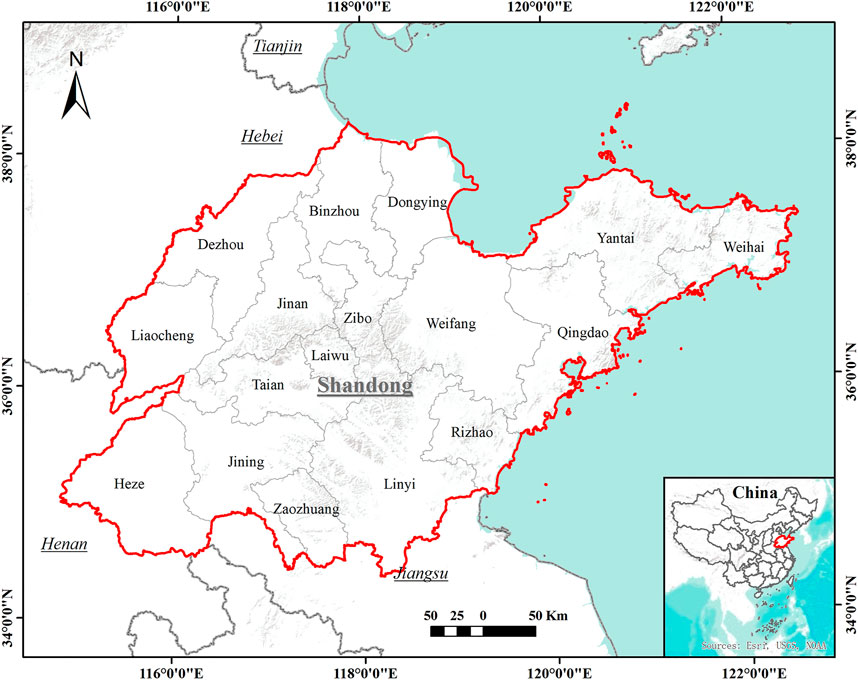
FIGURE 1. Study area (modified it from Ou et al., 2021).
2.2 Data Sources and Processing
A sequential and fine-resolution GCL mapping dataset is the fundamental information for exploring annual spatiotemporal dynamics of GCL and its driving forces. In this study, we used a series of Landsat-derived maps of GCL in Shandong province, China during 1989–2018 with annual temporal resolution and 30 m spatial resolution (Ou et al., 2021). This dataset was developed based on 8,450 Landsat images on the Google Earth Engine (GEE) and an annual remote sensing mapping method of GCL oriented to the provincial area and long-term period, which was the first dataset with accurate and long-term GCL dynamic maps in China. The average User’s Accuracy, Producer’s Accuracy and F1-score of GCL over 30 years were 96.56%, 86.64%, and 0.911, respectively. This dataset was consistent and comparable over time, which benefits from the same mapping window, feature optimization as well as temporal consistency correction, could serve as a suitable dataset for more comprehensive characterization of GCL expansion.
In addition, a number of variables were selected for the driven mechanism analysis (for details, Supplementary Material S1). The physical aspect included 7 driving variables: elevation (AVE), slope (SLP), soil type (ST), distance to rivers (DRV), distance to rural settlements (DR), distance to town centers (DT) and distance to urban centers (DU), which were used to analyze their driving effect on GCL expansion in terms of three relatively stable aspect over a long time period: topography, soil and location. The socioeconomic aspect included 16 driving variables: primary industry added value (VP), secondary industry added value (VS), tertiary industry added value (VT), rural population (RPOP), urban population (UPOP), road mileage (RO), motorway mileage (MO), effective irrigation area (EI), agricultural machinery (AM), rural electricity consumption (REC), local retail sales (LRS), average earning of local famers (AE), budget expenditure for rural development (BER), vegetable production in other provinces (VPO), total value of agricultural exports (VAE) and consumption demand of vegetable in adjacent metropolises (CDM), which were used to analyze their driving effect on GCL expansion in terms of seven relatively dynamic aspect over a long time period: economic scale, population growth, transportation conditions, rural infrastructure, consumer demand, farmers’ willingness and government support.
2.3 Spatiotemporal Dynamics Analysis
2.3.1 Spatial Information Entropy
The spatial information entropy has been widely used in studies such as geography, ecology and life sciences to describe or explain the heterogeneity of data or the distribution of “things” in space due to its ability to characterize the amount of information, uncertainty, heterogeneity and other concepts, in this study we applied it to quantify the global change of GCL clustering in Shandong over the past 30 years, which can be defined as (Leibovici et al., 2014):
where
2.3.2 Kernel Density Estimation
In order to further reflect the spatial heterogeneity of GCL clustering, the density of GCL in each year was classified based on the kernel density estimation (KDE). KDE is a non-parametric test method used to estimate unknown density functions, which has been widely used in natural disasters, public health, industrial spatial layout hotspot analysis and detection, etc. Its calculation formula is as follows (Cai et al., 2013):
where
2.3.3 Time-Series Segmentation and Sliding Algorithm
One of the significant advantages of remote sensing-based data is the ability to continuously observe the same area and thus obtain continuous information (Maus et al., 2016). Therefore, we proposed a time-series segmentation and sliding algorithm (TSS) based on the annual remote sensing mapping products of GCL, aiming to analyze the spatiotemporal dynamics of GCL in cumulative duration, demolition frequency and expansion trajectory.
As shown in Figure 2, the annual GCL maps were stacked to obtain the classification labels of each pixel from 1989 to 2018, and the temporal label sequences that need to be analyzed were extracted based on the temporal segmentation window N. For the cumulative duration analysis, the cumulative duration of GCL for each pixel at that period can be obtained by accumulating all labels of the segmented sequence. For the demolition frequency analysis, the time sliding window n was further set to 2, and the frequency of “01” or “10” combinations at that period can be obtained by sliding backward from the starting year in steps of 1. For the expansion trajectory analysis, we set the time sliding window n to 1, slide backward from the starting year in steps of 1, and assign the year information to each pixel when “1” appears for the first time.
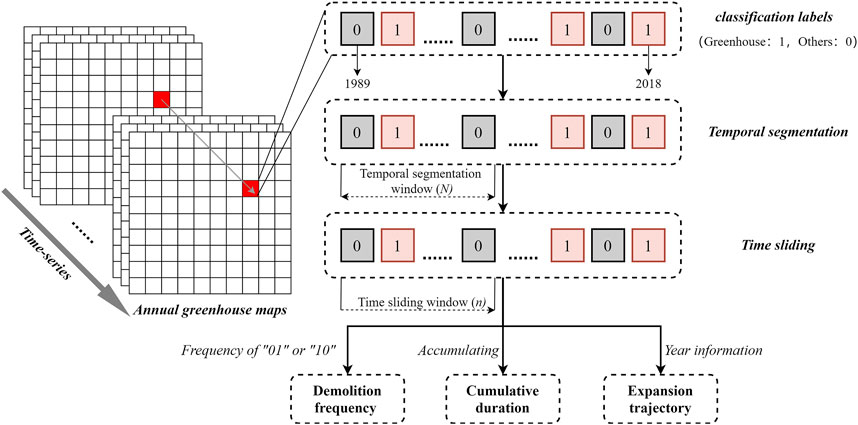
FIGURE 2. The Time-series segmentation and sliding algorithm (TSS).
2.3.4 Annual Expansion Index
Regarding the expansion intensity, previous studies have focused on urban expansion as represented by built-up or impervious areas. However, the major difference between GCL and urban is that urban expansion is generally considered to be irreversible (Li et al., 2015). In terms of GCL, due to the fluctuation of demolition and construction, the information between each year would be lost if the urban expansion intensity calculation rule is followed. Therefore, we proposed an annual expansion index (AEI) based on annual growth to reflect the true expansion intensity over a certain period, which was calculated as follows:
where
2.4 Driven Mechanism Analysis
2.4.1 Geodetector
Spatially stratified heterogeneity is a universal characteristic of geographic data, and for geographic data in different layers, if each layer of independent variables has an influence on the dependent variable, its spatial distribution should be similar (Wang et al., 2010). Geodetector is such a statistical method for detecting the spatial heterogeneity and revealing the driving factors behind it based on this assumption (Wang et al., 2016). In this study, we applied the factor detection in Geodetector to explain the local driven mechanism between GCL expansion and the selected variables, which is calculated as follows:
where L is the total number of stratifications of the dependent variable Y or the independent variables X,
2.4.2 Granger Causality Test
Granger causality test is to determine whether a time-series change in one variable is caused by a time-series change in another variable (Freeman, 1983). In this study, we first used the Augmented Dickey-Fuller test (ADF) to test whether the time-series variables were stationary, which is based on the following unit root tests (Krämer, 1998):
where the ADF tests whether the series xt rejects the original hypothesis by judging the estimated value of δ. When δ is less than the critical value of the correlation test, the series Xt is a stationary series, otherwise, the series Xt is a non-stationary series, and a further differential process is required to judge the stationarity of the differenced series.
For variables that are still non-stationary and belong to the same-order of single integer after differencing, further cointegration test based on the Engle-Granger method is required to determine whether there is a long-term stable relationship between the variables, which is conduct by establishing the least squares regression equation as following (Lee and Lee, 2015):
when ε is less than the critical value of the correlation test, the residual series
After testing the stationarity of the variables and the cointegration relationship between the variables, Granger causality tests were carried out on the time-series variables that were stationary and had cointegration relationships, and the following two regression models were estimated:
where the original hypothesis is that
3 Results
3.1 Spatiotemporal Dynamics of Greenhouse-Led Cultivated Land
3.1.1 Spatial Clustering
The spatial information entropy was calculated for all years using the annual maps of GCL in Shandong (Figure 3A). The unit area entropy value of GCL exhibited a decreasing trend in general, with the maximum value appearing in 1990 and the minimum value appearing in 2017, which can be divided into three stages: 1) from 1989 to 1996, the average unit area entropy value was 0.044; 2) from 1996 to 2005, the average unit area entropy value was 0.036; 3) from 2005 to 2018, the average unit area entropy value was 0.031. It indicated that the spatial clustering of GCL in Shandong over past 30 years was gradually increasing in general, where the highest level of spatial clustering was in 2017 and the lowest was in 1990. Combined with the changes in its total area, it can be seen that entropy value per unit area decreased continuously with the expansion of greenhouses in general, which means that the spatial clustering has a positive synergistic relationship with the change of total area of GCL.
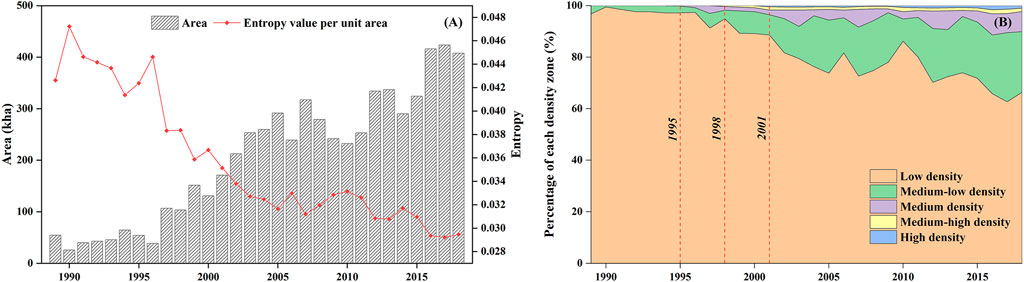
FIGURE 3. The spatial clustering patterns of GCL: (A) the spatial information entropy, (B) the spatial distribution density.
We further explored the spatial heterogeneity of GCL clustering over 30 years by using the KDE method to partition the spatial distribution density (Figure 3B). The percentage of low density zones decreased from 96.82% in 1989 to 66.38% in 2018, with a decrease of 30.44% and an average annual decrease of 1.05%; the medium-low density zones increased from 0.54% in 1989 to 23.51% in 2018, with an increase of 22.97% and an average annual increase of 0.79%; the medium density zones increased from 0.13% in 1995 to 7.80% in 2018, with an increase of 7.67% and an average annual increase of 0.33%; the medium-high density zones increased from 0.30% in 1998 to 1.36% in 2018, with an increase of 1.06% and an average annual increase of 0.05%; and the high density zones increased from 0.43% in 2001 to 0.95% in 2018, with an increase of 0.47% and an average annual increase of 0.03%. It indicated that despite the GCL expansion in Shandong was toward continuous clustering, but mainly dominated by the medium-low and medium densities.
3.1.2 Temporal Continuity
Based on the TSS algorithm, we calculated the cumulative duration of GCL over the past 30 years. As shown in Figure 4, GCL with the cumulative duration of 1 year accounted for 55.32% and showed a scattered distribution pattern mainly around the central mountainous area, and when the cumulative duration reached more than 2 years, its percentage rapidly decreased to less than 18.03%. And it can be found that the areas where the cumulative duration of GCL was more than 15 years were mainly distributed in northwestern Weifang, southwestern Linyi and western of Liaocheng, showing a triangular distribution pattern, which is similar to the pattern of the spatial clustering, indicating that the higher level of spatial clustering can extend the cumulative duration of GCL. In addition, it can be seen from the detail enlargements in Figures 4A–C that there was a certain spatial continuity in the extension of the cumulative duration.
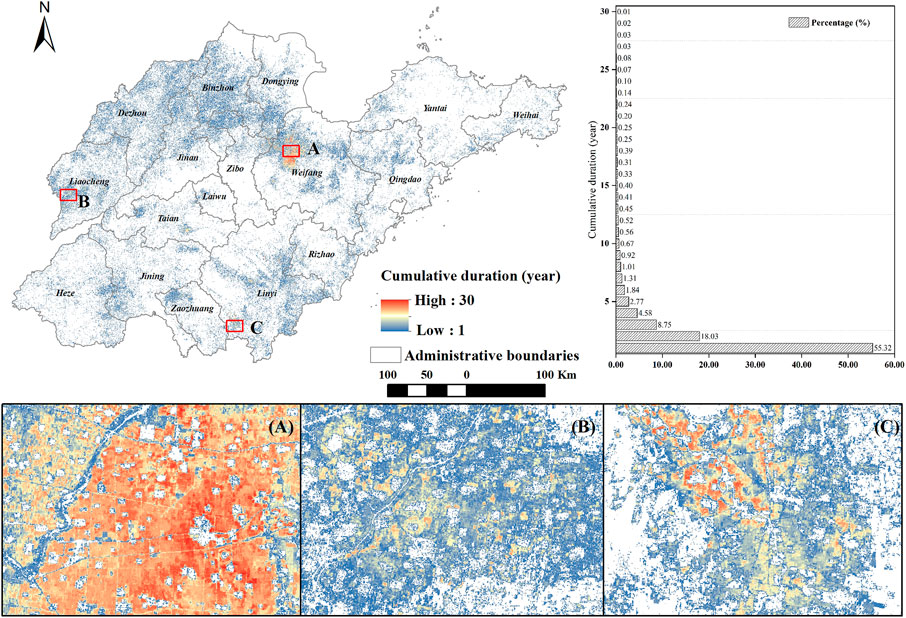
FIGURE 4. The cumulative duration patterns of GCL: (A) enlarge area A, (B) enlarge area B, and (C) enlarge area C.
Then the demolition frequency of GCL over the past 30 years was also calculated based on the TSS algorithm. As shown in Figure 5, the demolition frequencies of GCL in the range of 0.8∼1.0 accounted for 60.65% during the 30-year period, and showed a scattered distribution pattern mainly around the central mountainous area. The demolition frequencies in the range of 0.6∼0.8–0.4∼0.6 accounted for about 13%, and when the demolition frequency dropped to 0.4, its percentage decreased rapidly to below 12.33%. At the same time, it can be found that the areas with demolition frequency below 0.2 were mainly distributed in northwestern Weifang, southwestern Linyi and western Liaocheng, which is similar to the patterns of the spatial clustering as well as the cumulative duration, indicating that the higher level of spatial clustering can not only ensure the duration but also the continuity of GCL. In addition, from the detailed enlarged Figures 5A–C, it can be seen that there is a certain continuity in the change of demolition frequency, in which the area with low demolition frequency tends to form the area with relatively low demolition frequency around it.
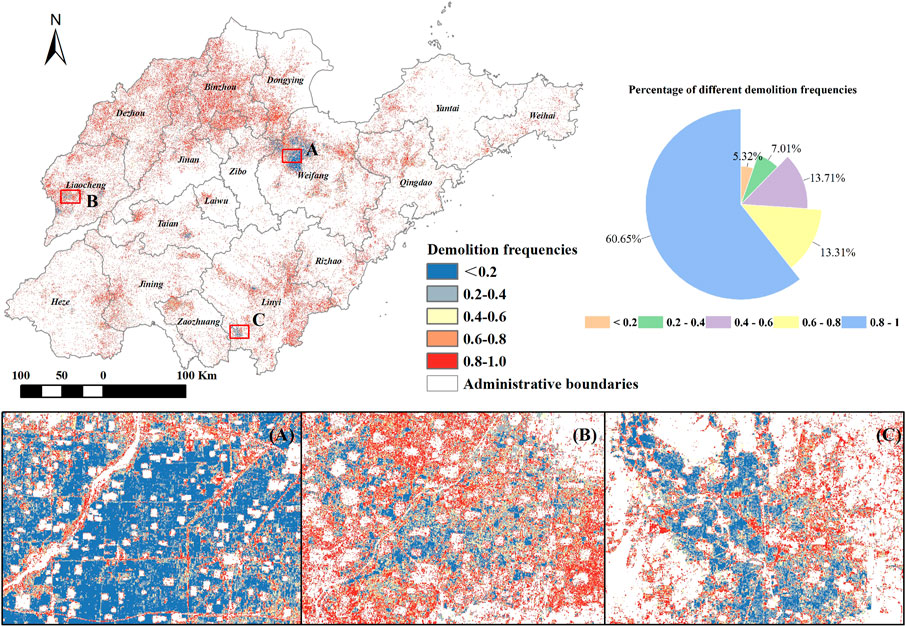
FIGURE 5. The demolition frequency patterns of GCL: (A) enlarge area A, (B) enlarge area B, and (C) enlarge area C.
3.1.3 Expansion Trajectory
Based on the TSS algorithm, we also identified the year in which GCL first appeared in Shandong province over the past 30 years. As shown in Figure 6, the expansion trajectory of GCL roughly formed a circular expansion pattern around the central mountainous area, among which the expansion trajectories were more disorderly in Dezhou, Jinan, Binzhou and Dongying, and more orderly in Weifang, Liaocheng, Linyi, Zaozhuang and Jining. Combined with its spatial clustering pattern, it can be seen that the expansion trajectories were more orderly in the GCL concentration areas. In terms of each period, in period 2004∼2008 and period 2014∼2018 accounted for the most percentage of GCL expansion with 25.18% and 20.62%, respectively, followed by period 1999∼2003 (18.92%) and period 2009∼2013 (18.40%), and the least was period 1989∼1993 (7.22%) and period 1994∼1998 (9.67%). In addition, from the detail enlarged Figures 6A–C, in northwestern Weifang, southwestern Linyi and western Liaocheng showed an obvious pattern of circle outward expansion trajectories.
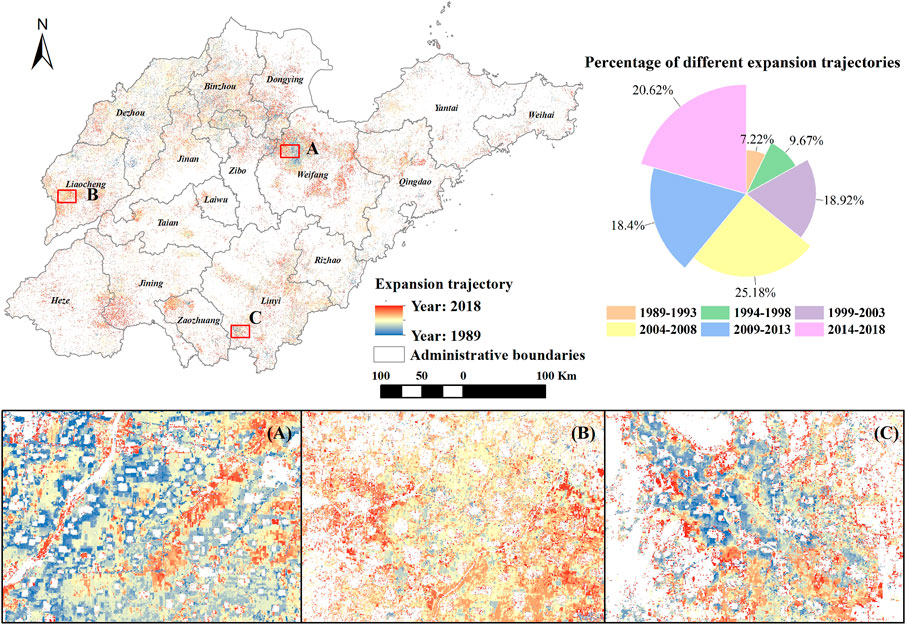
FIGURE 6. The expansion trajectory patterns of GCL: (A) enlarge area A, (B) enlarge area B, and (C) enlarge area C.
We further calculated the GCL expansion intensity in the above-mentioned periods at the 1 km grid scale, and classified it into five types: slow expansion, low-speed expansion, medium-speed expansion, high-speed expansion, and rapid expansion based on the natural break method (De Smith et al., 2007). As shown in Figure 7, the areas with rapid expansion intensity were mainly located in the northwestern plains represented by Weifang in period 1989∼1999 and continued to expand in period 1999∼2004, the southern plains represented by Linyi began to appear in the rapid expansion intensity in period 1999∼2004 as well. In period 2004∼2014, the areas with rapid expansion intensity shrank to the plain areas of northwestern and southern Shandong, and appeared in the plain areas represented by Liaocheng in the west. After that, the new areas with rapid expansion intensity appeared in the southeastern of Weifang and the junction of Jining and Heze from 2014 to 2018.
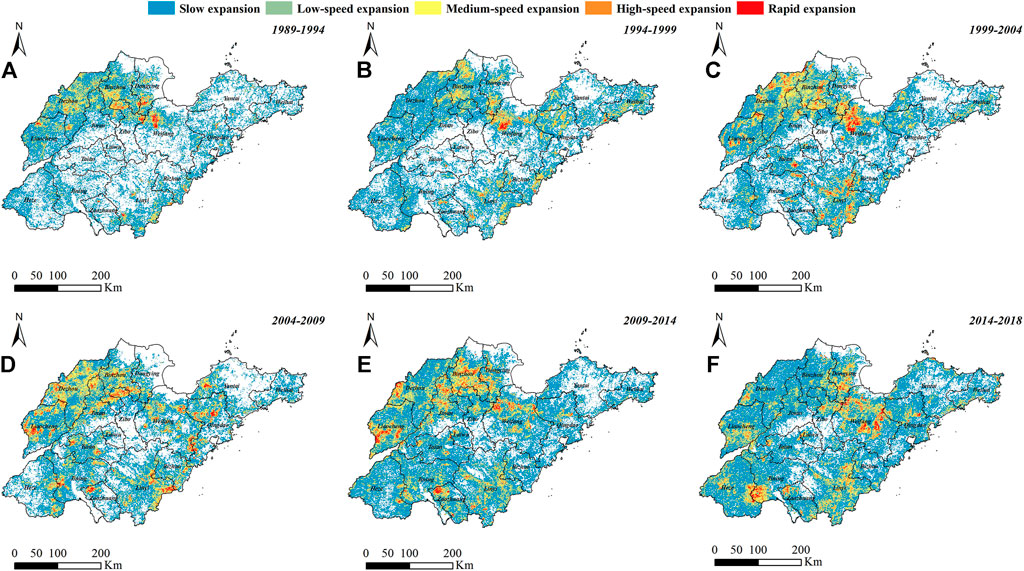
FIGURE 7. The expansion intensity patterns of GCL at different periods: (A) period 1989–1994, (B) period 1994–1999, (C) period 1999–2004, (D) period 2004–2009, (E) period 2009–2014, (F) period 2014–2018.
3.2 Driven Mechanisms of Greenhouse-Led Cultivated Land
3.2.1 Local Driven Mechanism
In order to reveal the differences in the local driven mechanism of GCL at different periods, we first divided the past 30 years into three different periods based on the annual change rate (ACR) of the total area of GCL, which were the stable period (1989∼1996, with an ACR of −2.28 kha/year), the growth period (1997∼2005, with an ACR of 23.09 kha/year) and the fluctuating period (2006∼2018, with an ACR of 14.03 kha/year), respectively. Meanwhile, the ACR of the selected local dynamic variables were calculated and identified as “ACR_XX” within each period. For those local stable variables that vary little over time, were also quantified based on factor detection at different periods.
Regarding the results of factor detection for the local dynamic variables in each period (Figure 8A), the top three q-values were ACR_BER (0.1164), ACR_EI (0.1153) and ACR_AE (0.1055) in the stable period, ACR_LRS (0.0389), ACR_RO (0.0386) and ACR_AM (0.0354) in the growth period, and ACR_AE (0.0365), ACR_AM (0.0328) as well as ACR_BER (0.0316) in the fluctuating period. It indicated that 1) budget expenditure for rural development reflecting government support and average earning of local famers reflecting farmers’ willingness were both the major driving factors for farmers to promote GCL in the stable as well as the fluctuating period, 2) effective irrigated area reflecting agricultural production conditions only played a major driving role in the stable period, 3) local retail sales reflecting local consumer demand and road mileage reflecting transportation conditions played a key driving role in the growth period.
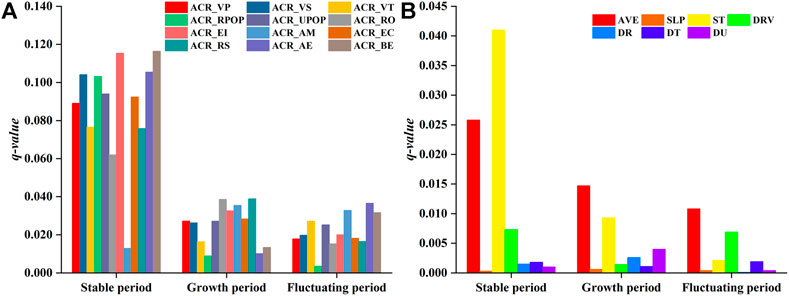
FIGURE 8. The local driven mechanism of GCL at different periods: (A) factor detection for the local dynamic variables, (B) factor detection for the local stable variables.
Regarding the results of factor detection for the local stable variables in each period (Figure 8B), the top three q-values were ST (0.0410), AVE (0.0258) and RIV (0.0073) in the stable period, AVE (0.0147), ST (0.0093) and DU (0.0040) in the growth period, and AVE (0.0108), RIV (0.0069) as well as ST (0.0410) in the fluctuating period. It indicated that 1) elevation and soil type were always the main driving force for GCL expansion in all local stable variables over time, 2) the driving force of the distance to rivers exhibited a significant performance in both the stable and fluctuating periods among the location aspect, 3) compared with elevation, the driving force of slope showed an insignificant performance in all periods.
3.2.2 External Driven Mechanism
In order to reveal the driven mechanism of the supply and demand of vegetables in external markets on GCL expansion in Shandong, the following target and explanatory time-series were selected: total area of GCL in Shandong province (
As shown in Supplementary Material S2, the ADF values of
Therefore, the target series after differencing was selected for Granger causality tests with each explanatory series after the same-order differencing at lag 1, lag 3, and lag 5 (Supplementary Material S4). From the perspective of the supply of vegetables in the external markets, vegetable production change in Guangxi, Hainan, Hunan, and Hubei province were a one-way Granger causality of the development of GCL in Shandong province, vegetable production change in Sichuan province was a two-way Granger causality of the development of GCL in Shandong province, and no Granger causality between vegetable production change in Guangdong province and the development of GCL in Shandong. From the perspective of the consumption demand of vegetable in the external markets, vegetable consumption in Beijing was a one-way Granger causality of the development of GCL in Shandong, and no Granger causality between both vegetable consumption in Shanghai as well as abroad and the development of GCL in Shandong.
4 Discussion
4.1 Significance of Greenhouse-Led Cultivated Land Dynamics in Shandong Over the Past 30 years
Our study revealed that GCL in Shandong was widespread over the past 30 years from 1989 to 2018, involving a total expanded area of 353 kha. In terms of spatial clustering of GCL, the entropy value per unit area of GCL decreased from 0.043 to 0.029 and the spatial distribution of GCL clustering was mainly medium-low and medium densities, which means that despite the GCL expansion in Shandong over the past 30 years was toward continuous clustering, the industrial clustering effect was not evident from the macro level. In terms of temporal continuity of GCL, more than half of GCL with a cumulative duration was 1 year only and more than 60% of GCL with a demolition frequency in range of 0.8∼1.0, which means that GCL in most region of Shandong lacked stability except a few industrial clustering regions. In terms of expansion trajectory of GCL, the expansion trajectory of GCL roughly formed a circular expansion pattern around the central mountainous area over the past 30 years and the most expansion period appeared in the mid-2010’s, which means that the development of GCL has shown an obvious spatiotemporal heterogeneity in Shandong over the past 30 years. These findings provided a deeper understanding in spatiotemporal dynamics of GCL over a large-scale and long-term period.
4.2 Drivers of Greenhouse-Led Cultivated Land Expansion in Shandong Over the Past 30 years
By combining a number of variables involving physical and socioeconomic aspects with the ACR of the total area of GCL, we further explored the local and external driven mechanisms behind rapid GCL expansion in Shandong over the past 30 years. In terms of local driven mechanism, the change of government support and farmers’ willingness showed the significant drive forces in both stable and fluctuating period of GCL, the change of agricultural production conditions played a major driving role in the stable period of GCL, and the change of local consumer demand as well as transportation conditions were the dominate driven variables in the growth period of GCL, which means the local driven mechanism behind GCL expansion varied in each period and an effective regulation of its expansion needs to consider the differences of each period. In terms of external driven mechanism, vegetable production change in four provinces showed a great influence on the expansion of GCL in Shandong, the consumption demand of vegetable in Beijing and the expansion of GCL in Shandong were mutually driven, and the consumption demand of vegetable in Shanghai as well as aboard had no significant impact on the expansion of GCL in Shandong, which indicated that the competition of external vegetable supply and the consumption demand from nearby metropolises were the main external driving factor of the expansion of GCL in Shandong over the past 30 years.
4.3 Limitations and Future Works
Our results provided a comprehensive and macroscale description of GCL expansion in Shandong province, China over the past 30 years and indicated that the long-term causes, processes and patterns of GCL varied in each period as well as different regions. However, some limitations are worth noting. For instance, we mainly analyzed the spatiotemporal dynamics and driven mechanisms in Shandong province, which is the earliest and largest province in China to promote GCL, considering that GCL has been widely popularized in China and there are differences in the pattern of GCL expansion between in other provinces and Shandong, we will expand the quantitative analysis of the spatiotemporal dynamics and driven mechanisms of GCL at national scale in the follow-up study. In addition, the analysis of driven mechanisms in this study was partially limited by the availability of data, and the micro level information such as farmers’ decision-making, terms of trade of GCL products and government subsidy policies were not taken into account. In the future, field research can be carried out to obtain more detailed micro data, so as to realize a more in-depth analysis.
5 Conclusion
In this study, we proposed a comprehensive analysis framework which oriented to investigate the spatiotemporal dynamics and driven mechanisms of GCL over a long-term period in a large-scale area. The results showed the following: 1) The spatial clustering of GCL in the area of research during 1989∼2018 was gradually increasing in general, which was mainly dominated by medium-low and medium densities. 2) GCL in most region of the area of research lacked stability except a few industrial clustering regions, and the expansion trajectory of GCL roughly formed a circular expansion pattern around the central mountainous area with the most expansion period appeared in the mid-2010’s. 3) Local driven mechanism behind GCL expansion varied in each period, and budget expenditure for rural development, local retail sales and average earnings of local farmers were the most important local driving factors of the GCL expansion in Shandong. 4) From the external perspective, the competition of external vegetable supply in Guangxi, Hainan, Hunan as well as Hubei province and the consumption demand from Beijing were the main external driving forces of the expansion of GCL in Shandong. In general, our study quantified a range of spatiotemporal dynamics of GCL and its drivers over a large-scale and long-term period, which puts forwards the potential of earth observations to evaluate the impacts of cultivated land use and management.
Data Availability Statement
The original contributions presented in the study are included in the article/Supplementary Material, further inquiries can be directed to the corresponding author.
Author Contributions
CO: conceptualization, methodology, and writing—original draft. YW: supervision and funding acquisition.
Funding
This work was supported by the Key Program of the National Natural Science Foundation of China (41931293).
Conflict of Interest
The authors declare that the research was conducted in the absence of any commercial or financial relationships that could be construed as a potential conflict of interest.
Publisher’s Note
All claims expressed in this article are solely those of the authors and do not necessarily represent those of their affiliated organizations, or those of the publisher, the editors and the reviewers. Any product that may be evaluated in this article, or claim that may be made by its manufacturer, is not guaranteed or endorsed by the publisher.
Supplementary Material
The Supplementary Material for this article can be found online at: https://www.frontiersin.org/articles/10.3389/fenvs.2022.944422/full#supplementary-material
References
Agüera, F., Aguilar, F. J., and Aguilar, M. A. (2008). Using Texture Analysis to Improve Per-Pixel Classification of Very High Resolution Images for Mapping Plastic Greenhouses. ISPRS J. Photogrammetry Remote Sens. 63 (6), 635–646.
Agüera, F., and Liu, J. (2009). Automatic Greenhouse Delineation from QuickBird and Ikonos Satellite Images. Comput. Electron. Agric. 66 (2), 191–200.
Aguilar, M., Bianconi, F., Aguilar, F., and Fernández, I. (2014). Object-based Greenhouse Classification from GeoEye-1 and WorldView-2 Stereo Imagery. Remote Sens. 6 (5), 3554–3582. doi:10.3390/rs6053554
Aguilar, M., Nemmaoui, A., Novelli, A., Aguilar, F., and García Lorca, A. (2016). Object-based Greenhouse Mapping Using Very High Resolution Satellite Data and Landsat 8 Time Series. Remote Sens. 8 (6), 513. doi:10.3390/rs8060513
Arcidiacono, C., and Porto, S. M. C. (2010). A Model to Manage Crop-Shelter Spatial Development by Multi-Temporal Coverage Analysis and Spatial Indicators. Biosyst. Eng. 107 (2), 107–122. doi:10.1016/j.biosystemseng.2010.07.007
Balcik, F. B., Senel, G., and Goksel, C. (2019). “Greenhouse Mapping Using Object Based Classification and Sentinel-2 Satellite Imagery,” in 2019 8th International Conference on Agro-Geoinformatics (Agro-Geoinformatics) (IEEE), 1–5.
Baudoin, W., and Von Zabeltitz, C. (2002). Greenhouse Constructions for Small Scale Farmers in Tropical Regions. Acta Hortic. 578, 171–179. International Symposium on Design and Environmental Control of Tropical and Subtropical Greenhouses. doi:10.17660/actahortic.2002.578.20
Bektas Balcik, F., Senel, G., and Goksel, C. (2020). Object-based Classification of Greenhouses Using Sentinel-2 MSI and SPOT-7 Images: A Case Study from Anamur (Mersin), Turkey. IEEE J. Sel. Top. Appl. Earth Obs. Remote Sens. 13, 2769–2777. doi:10.1109/jstars.2020.2996315
Briassoulis, D., Dougka, G., Dimakogianni, D., and Vayas, I. (2016). Analysis of the Collapse of a Greenhouse with Vaulted Roof. Biosyst. Eng. 151, 495–509. doi:10.1016/j.biosystemseng.2016.10.018
Cai, X., Wu, Z., and Cheng, J. (2013). Using Kernel Density Estimation to Assess the Spatial Pattern of Road Density and its Impact on Landscape Fragmentation. Int. J. Geogr. Inf. Sci. 27 (2), 222–230. doi:10.1080/13658816.2012.663918
Carvajal, F., Agüera, F., Aguilar, F. J., and Aguilar, M. A. (2010). Relationship between Atmospheric Corrections and Training-Site Strategy with Respect to Accuracy of Greenhouse Detection Process from Very High Resolution Imagery. Int. J. Remote Sens. 31 (11), 2977–2994. doi:10.1080/01431160902946580
Carvajal, F., Crisanto, E., Aguilar, F., Agüera, F., and Aguilar, M. (2006). “Greenhouses Detection Using an Artificial Neural Network with a Very High Resolution Satellite Image,” in ISPRS Technical Commission II Symposium (Vienna: International Society of Photogrammetry and Remote Sensing), 37–42.
Chaofan, W., Jinsong, D., Ke, W., Ligang, M., and Tahmassebi, A. R. S. (2016). Object-based Classification Approach for Greenhouse Mapping Using Landsat-8 Imagery. Int. J. Agric. Biol. Eng. 9 (1), 79–88. doi:10.3965/j.ijabe.20160901.1414
De Smith, M. J., Goodchild, M. F., and Longley, P. (2007). Geospatial Analysis: A Comprehensive Guide to Principles, Techniques and Software Tools. Matador: Troubador publishing ltd.
Freeman, J. R. (1983). Granger Causality and the Times Series Analysis of Political Relationships. Am. J. Political Sci. 27, 327–358. doi:10.2307/2111021
Gao, M., Qunou, J., Yiyang, Z., Wentao, Y., and Mingchang, S. (2018). Comparison of Plastic Greenhouse Extraction Method Based on GF-2 Remote-Sensing Imagery. J. China Agric. Univ. 23 (8), 125–134. doi:10.11841/j.issn.1007-4333.2018.08.14
Ge, D., Wang, Z., Tu, S., Long, H., Yan, H., Sun, D., et al. (2019). Coupling Analysis of Greenhouse-Led Farmland Transition and Rural Transformation Development in China's Traditional Farming Area: A Case of Qingzhou City. Land Use Policy 86, 113–125. doi:10.1016/j.landusepol.2019.05.002
González-Yebra, Ó., Aguilar, M. A., Nemmaoui, A., and Aguilar, F. J. (2018). Methodological Proposal to Assess Plastic Greenhouses Land Cover Change from the Combination of Archival Aerial Orthoimages and Landsat Data. Biosyst. Eng. 175, 36–51.
He, F., and Ma, C. (2007). Development and Strategy of Facility Agriculture in China. Chin. Agric. Sci. Bull. 23 (3), 462–465.
Jiménez-Lao, R., Aguilar, F. J., Nemmaoui, A., and Aguilar, M. A. (2020). Remote Sensing of Agricultural Greenhouses and Plastic-Mulched Farmland: An Analysis of Worldwide Research. Remote Sens. 12 (16), 2649. doi:10.3390/rs12162649
Koc-San, D. (2013). Evaluation of Different Classification Techniques for the Detection of Glass and Plastic Greenhouses from WorldView-2 Satellite Imagery. J. Appl. Remote Sens. 7 (1), 073553. doi:10.1117/1.jrs.7.073553
Krämer, W. (1998). Fractional Integration and the Augmented Dickey–Fuller Test. Econ. Lett. 61 (3), 269–272. doi:10.1016/s0165-1765(98)00194-3
Lee, H., and Lee, J. (2015). More Powerful Engle-Granger Cointegration Tests. J. Stat. Comput. Simul. 85 (15), 3154–3171. doi:10.1080/00949655.2014.957206
Leibovici, D. G., Claramunt, C., Le Guyader, D., and Brosset, D. (2014). Local and Global Spatio-Temporal Entropy Indices Based on Distance-Ratios and Co-occurrences Distributions. Int. J. Geogr. Inf. Sci. 28 (5), 1061–1084. doi:10.1080/13658816.2013.871284
Levin, N., Lugassi, R., Ramon, U., Braun, O., and Ben-Dor, E. (2007). Remote Sensing as a Tool for Monitoring Plasticulture in Agricultural Landscapes. Int. J. remote Sens. 28 (1), 183–202. doi:10.1080/01431160600658156
Li, M., Zhang, Z., Lei, L., Wang, X., and Guo, X. (2020). Agricultural Greenhouses Detection in High-Resolution Satellite Images Based on Convolutional Neural Networks: Comparison of Faster R-CNN, YOLO V3 and SSD. Sensors 20 (17), 4938. doi:10.3390/s20174938
Li, X., Gong, P., and Liang, L. (2015). A 30-year (1984-2013) Record of Annual Urban Dynamics of Beijing City Derived from Landsat Data. Remote Sens. Environ. 166, 78–90. doi:10.1016/j.rse.2015.06.007
Lin, J., Jin, X., Ren, J., Liu, J., Liang, X., and Zhou, Y. (2021). Rapid Mapping of Large-Scale Greenhouse Based on Integrated Learning Algorithm and Google Earth Engine. Remote Sens. 13 (7), 1245. doi:10.3390/rs13071245
Liu, J., Dietz, T., Carpenter, S. R., Alberti, M., Folke, C., Moran, E., et al. (2007). Complexity of Coupled Human and Natural Systems. science 317 (5844), 1513–1516. doi:10.1126/science.1144004
Liu, Y., Zou, L., and Wang, Y. (2020). Spatial-temporal Characteristics and Influencing Factors of Agricultural Eco-Efficiency in China in Recent 40 Years. Land Use Policy 97, 104794. doi:10.1016/j.landusepol.2020.104794
Lu, L., Di, L., and Ye, Y. (2014). A Decision-Tree Classifier for Extracting Transparent Plastic-Mulched Landcover from Landsat-5 TM Images. IEEE J. Sel. Top. Appl. Earth Obs. Remote Sens. 7 (11), 4548–4558. doi:10.1109/jstars.2014.2327226
Ma, A., Chen, D., Zhong, Y., Zheng, Z., and Zhang, L. (2021). National-scale Greenhouse Mapping for High Spatial Resolution Remote Sensing Imagery Using a Dense Object Dual-Task Deep Learning Framework: A Case Study of China. ISPRS J. Photogrammetry Remote Sens. 181, 279–294. doi:10.1016/j.isprsjprs.2021.08.024
Maus, V., Camara, G., Cartaxo, R., Sanchez, A., Ramos, F. M., and De Queiroz, G. R. (2016). A Time-Weighted Dynamic Time Warping Method for Land-Use and Land-Cover Mapping. IEEE J. Sel. Top. Appl. Earth Obs. Remote Sens. 9 (8), 3729–3739. doi:10.1109/jstars.2016.2517118
Min, J., Zhang, H., and Shi, W. (2012). Optimizing Nitrogen Input to Reduce Nitrate Leaching Loss in Greenhouse Vegetable Production. Agric. Water Manag. 111, 53–59. doi:10.1016/j.agwat.2012.05.003
Novelli, A., Aguilar, M. A., Nemmaoui, A., Aguilar, F. J., and Tarantino, E. (2016). Performance Evaluation of Object Based Greenhouse Detection from Sentinel-2 MSI and Landsat 8 OLI Data: A Case Study from Almería (Spain). Int. J. Appl. earth observation geoinformation 52, 403–411. doi:10.1016/j.jag.2016.07.011
Ou, C., Yang, J., Du, Z., Liu, Y., Feng, Q., and Zhu, D. (2020). Long-term Mapping of a Greenhouse in a Typical Protected Agricultural Region Using Landsat Imagery and the Google Earth Engine. Remote Sens. 12 (1), 55. doi:10.3390/rs12010055
Ou, C., Yang, J., Du, Z., Zhang, T., Niu, B., Feng, Q., et al. (2021). Landsat-Derived Annual Maps of Agricultural Greenhouse in Shandong Province, China from 1989 to 2018. Remote Sens. 13 (23), 4830. doi:10.3390/rs13234830
Picuno, P., Tortora, A., and Capobianco, R. L. (2011). Analysis of Plasticulture Landscapes in Southern Italy through Remote Sensing and Solid Modelling Techniques. Landsc. urban Plan. 100 (1-2), 45–56. doi:10.1016/j.landurbplan.2010.11.008
Shi, L., Wang, Y., Liu, Y., and Li, Y. (2022). The Poverty Evolution of Typical Countries along the Belt and Road and Implications from China's Poverty Reduction Experiences. J. Geogr. Sci. 32 (3), 458–476. doi:10.1007/s11442-022-1953-1
Sica, C., and Picuno, P. (2007). “Spectro-radiometrical Characterization of Plastic Nets for Protected Cultivation,” in International Symposium on High Technology for Greenhouse System Management: Greensys2007 801), 245–252.
Su, Y., Li, C., Wang, K., Deng, J., Shahtahmassebi, A. R., Zhang, L., et al. (2019). Quantifying the Spatiotemporal Dynamics and Multi-Aspect Performance of Non-grain Production during 2000-2015 at a Fine Scale. Ecol. Indic. 101, 410–419. doi:10.1016/j.ecolind.2019.01.026
Sun, H., Wang, L., Lin, R., Zhang, Z., and Zhang, B. (2021). Mapping Plastic Greenhouses with Two-Temporal Sentinel-2 Images and 1d-Cnn Deep Learning. Remote Sens. 13 (14), 2820. doi:10.3390/rs13142820
Wang, J.-F., Zhang, T.-L., and Fu, B.-J. (2016). A Measure of Spatial Stratified Heterogeneity. Ecol. Indic. 67, 250–256. doi:10.1016/j.ecolind.2016.02.052
Wang, J. F., Li, X. H., Christakos, G., Liao, Y. L., Zhang, T., Gu, X., et al. (2010). Geographical Detectors-Based Health Risk Assessment and its Application in the Neural Tube Defects Study of the Heshun Region, China. Int. J. Geogr. Inf. Sci. 24 (1), 107–127. doi:10.1080/13658810802443457
Wen-shou, H. (2004). Soil Problems and Countermeasure in Facility Agriculture in China. Soils 36 (3), 235–242. doi:10.3321/j.issn:0253-9829.2004.03.003
Yang, D., Chen, J., Zhou, Y., Chen, X., Chen, X., and Cao, X. (2017). Mapping Plastic Greenhouse with Medium Spatial Resolution Satellite Data: Development of a New Spectral Index. ISPRS J. Photogrammetry Remote Sens. 128, 47–60. doi:10.1016/j.isprsjprs.2017.03.002
Yu, B., Song, W., and Lang, Y. (2017). Spatial Patterns and Driving Forces of Greenhouse Land Change in Shouguang City, China. Sustainability 9 (3), 359. doi:10.3390/su9030359
Zhang, L., Liu, W., Hou, K., Lin, J., Song, C., Zhou, C., et al. (2019). Air Pollution Exposure Associates with Increased Risk of Neonatal Jaundice. Nat. Commun. 10 (1), 3741–3749. doi:10.1038/s41467-019-11387-3
Zhang, Y., Wang, P., Wang, L., Sun, G., Zhao, J., Zhang, H., et al. (2015). The Influence of Facility Agriculture Production on Phthalate Esters Distribution in Black Soils of Northeast China. Sci. Total Environ. 506-507, 118–125. doi:10.1016/j.scitotenv.2014.10.075
Zhao, G., Li, J., Li, T., Yue, Y., and Warner, T. (2004). Utilizing Landsat TM Imagery to Map Greenhouses in Qingzhou, Shandong Province, China. Pedosphere 14 (3), 363–369.
Keywords: greenhouse-led cultivated land, spatiotemporal dynamics, driving factors, long-term period, provincial scale
Citation: Ou C and Wang Y (2022) Tracking Spatio-Temporal Dynamics of Greenhouse-Led Cultivated Land and its Drivers in Shandong Province, China. Front. Environ. Sci. 10:944422. doi: 10.3389/fenvs.2022.944422
Received: 15 May 2022; Accepted: 08 June 2022;
Published: 12 July 2022.
Edited by:
Li Peng, Sichuan Normal University, ChinaCopyright © 2022 Ou and Wang. This is an open-access article distributed under the terms of the Creative Commons Attribution License (CC BY). The use, distribution or reproduction in other forums is permitted, provided the original author(s) and the copyright owner(s) are credited and that the original publication in this journal is cited, in accordance with accepted academic practice. No use, distribution or reproduction is permitted which does not comply with these terms.
*Correspondence: Yongsheng Wang, d2FuZ3lzQGlnc25yci5hYy5jbg==