 Tan Chen
 Chunqiao Song
 Chenyu Fan
 Xin Gao
 Kai Liu
 Zhen Li4
94% of researchers rate our articles as excellent or good
Learn more about the work of our research integrity team to safeguard the quality of each article we publish.
Find out more
ORIGINAL RESEARCH article
Front. Environ. Sci., 17 August 2022
Sec. Environmental Informatics and Remote Sensing
Volume 10 - 2022 | https://doi.org/10.3389/fenvs.2022.944319
Climate change and human interference pose a significant threat to fishery habitats and fish biodiversity, leading to changes in fishery resources. However, the impact of environmental change on lake fishery resources has been largely blurred in assessments due to the complicated variables of the lake environment. Here, taking the largest freshwater lake (Poyang Lake) in China as a study case, we first proposed a conceptual model and simulated the effect of environmental variables on fish catches based on remote sensing techniques and machine learning algorithms. We found that the hydrometeorological conditions of fishery habitats are critical controlling factors affecting the fish catches in Poyang Lake through a long time series of simulations. Among the involved hydrometeorological variables, the temperature, precipitation, and water level are strongly correlated with the fish catches in the simulation experiments. Furthermore, we tested other experiments and found that the integration with water quality variables (correlation coefficient (R) increased by 11%, and root mean square error (RMSE) decreased by 2,600 tons) and water ecological variables (R increased by 17%, and RMSE decreased by 3,200 tons) can further improve the accuracy of fish catch simulation. The results also showed that fish catches of aquatic species in Poyang Lake are more susceptible to water ecological variables than water quality refers to the model performance improvements by different input variable selections. In addition, a multi-dimension variable combination involving hydrometeorological conditions, water quality, and water ecological variables derived from remote sensing can maximally optimize the model performance of fish catch simulation (R increased by 21%, and RMSE decreased by 4,300 tons). The approach developed in this study can save the labor and financial costs for large-area investigation and the assessment of lake fishery resources compared to conventional methods. It is expected to demonstrate an efficient way for public authorities, stakeholders, and decision-makers to guide fishery conservation and management strategies.
As an essential part of natural resource supply, the fishery sector can provide plentiful high-protein food and bring considerable employment and income for human beings (Pauly and Zeller, 2017). However, as climate change unfolds and anthropogenic stress intensifies, the overall sustainability of global fishery resources has decreased significantly. Thus, the assessment of sustainable utilization of the fishery habitats and resources has attracted wide attention worldwide (Barbarossa et al., 2021; Comte et al., 2021). Furthermore, lakes are significant reserves of accessible fresh water and provide vital habitats for fish living and breeding (La Notte et al., 2017; Kao et al., 2020). Therefore, investigation about the dynamics of lake fishery resources and better understanding of the impacts of various environmental factors are urgently needed.
Lake fisheries are particularly vulnerable to environmental changes (Venard and Scarnecchia, 2005). In particular, fish distribution is usually limited by environment temperature (Missaghi et al., 2017), water quality (Araujo et al., 2018), ecosystem structure (Ferrari et al., 2018), and other external distractions (Weijerman et al., 2019; Sifundza et al., 2021). In addition, different phases of the fish life cycle, including spawning, feeding, nursery, and migrations, require specific environmental conditions, involving a series of complicated driving factors (Petitgas et al., 2006; Giannoulaki et al., 2017; Sólmundsson et al., 2018). Previous studies have confirmed that environmental degradations have led to significant shifts in fish catches and species composition in many lakes (Mccullough et al., 2009; Njiru et al., 2018; Rypel et al., 2019; Zadereev et al., 2020). However, these studies evaluate the relationship between fisheries and environmental factors based on the traditional method with spot or transect sampling. It is greatly limited by the inaccessibility of regional environmental data with spatiotemporally full coverage. Thus, how these various environmental factors influence lake fishery resources at large spatial scales is still very complex to comprehend and remains largely unelucidated.
Satellite remote sensing provides an effective way to capture spatio-temporal continuous environmental data and to provide a holistic view of the influencing variables of fishery resources. Previous studies have demonstrated that remote sensing can be used for investigating lake fishery resources, assessing fish habitats, and forecasting fish situations (Lucas and Baras, 2000; Herold et al., 2007; Grimm et al., 2016; Qi et al., 2021). In particular, remote sensing allows large-scale, real-time, and dynamic monitoring of the water environment variables, such as chlorophyll-a concentrations (Chla), Secchia disk depth (SDD), suspended particulate matter (SPM), and other water quality parameters (Kutser, 2004; Awad, 2014; Cao et al., 2017; Hou et al., 2017). Furthermore, in terms of lake hydrological conditions, remote sensing technologies effectively monitor water surface area, surface elevation, and volume of lakes (Crétaux et al., 2016; Zhu et al., 2020; Chen et al., 2021; Luo et al., 2021). However, few studies comprehensively employ remote sensing to detect environmental changes that directly or indirectly affect fish life events, such as spawning, breeding, feeding, etc. Therefore, it is necessary to extend the remote sensing techniques to interpret these environmental variables that are essential for fish distribution and reproduction.
The environmental factors affecting lake fishery resources are complex and diverse, and the main elements are still controversial. Therefore, the machine learning algorithms were considered to model the influences of various environmental driving forces (hydrometeorological parameters, water quality, and ecological indicators) on lake fishery in this study as these algorithms can deal with complex variables without prior knowledge (Mohammed et al., 2016; Mahesh, 2020). To implement the machine learning model of accurately simulating the dynamics of fish catches in response to various influencing variables, we chose the largest freshwater lake in China, Poyang Lake, as the study case. Owing to inconsistent temporal spans of different influencing variables, we designed two sets of simulation experiments with different variable groups to investigate the model potential for the simulation of lake fish resources and the sensitivities to different environmental factors. Furthermore, we evaluated the performance of fish catch simulation with different models and the influence of key model parameters on the simulation results. Finally, we discussed the associations of the decadal variability of Poyang Lake fish catches with the freshwater fishery policy and the socio-economic development of China.
The Poyang Lake, located in the middle reach of the Yangtze River, is the largest freshwater lake in China, which is mainly fed by five large rivers: Ganjiang, Fuhe, Xiuhe, Xinjiang, and Raohe rivers, with the outlet northward being linked to the Yangtze mainstream (Figure 1). The Poyang Lake basin, covering an area of 162,200 km2, is characterized by a subtropical monsoon climate, with the air temperatures varying from the winter to summer in a range of 3.9–28.5°C. The mean annual precipitation and evaporation are 1,600 mm/yr and 1,000 mm/yr, respectively (Li et al., 2020). Poyang Lake is rich in fishery resources and plays a vital role in maintaining and supplementing the aquatic biodiversity of the Yangtze River (Liu et al., 2019). According to the field investigation of fish resources and prior literature, the period March to June is the spawning season of carp and crucian carp in Poyang Lake (Gong et al., 2009; Chen, 2020). The water depth is less than 0.5 m is usually interpreted as the potential spawning area of Poyang Lake (Jin et al., 2019). Furthermore, the unique hydrological regime of Poyang Lake led to the sensitive response of its fishery to seasonal hydrology and associated environmental conditions (Jin et al., 2019).
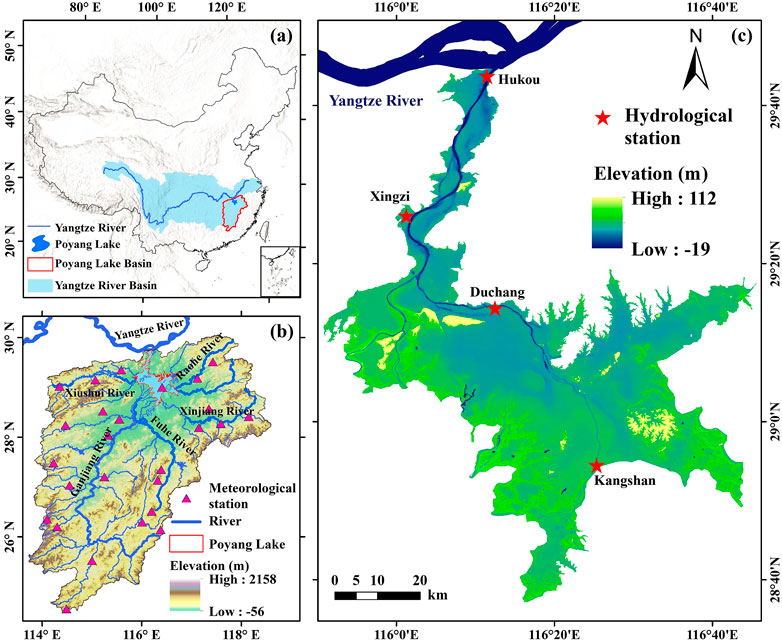
FIGURE 1. Study area with the distributions of meteorological stations in the Poyang Lake basin and hydrological gauging stations in Poyang Lake. (A) Location of the Poyang Lake basin. (B) Location of Poyang Lake and main drainage network in its basin. (C) Spatial distribution characteristics of elevation of Poyang Lake.
The lake water level and surrounding meteorological conditions are important influencing factors of fishery catches, which were selected as key input variables of machine learning models. Daily water levels of four hydrological stations, Hukou, Xingzi, Duchang, and Kangshan gauging stations, during 1960–2017 from the Hydrological Bureau of Jiangxi Province, were collected to represent the upper, middle, and lower water levels of Poyang Lake (Figure 1C). Furthermore, data on five main climatological variables (i.e., precipitation, temperature, pan evaporation, atmospheric pressure, and relative humidity) from 26 meteorological stations within the Poyang Lake basin during 1960–2017 were obtained from the China Meteorological Data Sharing Service System (http://cdc.cma.gov.cn) (Figure 1B). All the hydrological and meteorological data were composited at a yearly timescale to simulate the annual fishery catches of Poyang Lake.
Multi-source remote sensing data (Table 1) were employed to retrieve the environmental parameters representing the water quality and ecological conditions of Poyang Lake. First, we utilized the moderate resolution imaging spectroradiometer (MODIS) satellite data of 1-km resolution from 2000 to 2017 to estimate three typical water quality parameters based on existing empirical algorithms within the Google Earth Engine (GEE) platform (Supplementary Text S1 in Supporting Information). The three water quality parameters included Chla, SDD, and SPM (Le et al., 2013; Wu et al., 2013; Wang et al., 2015; Feng et al., 2019). Chla is one of the crucial components of phytoplankton, the primary producer in lake ecosystems, and provides the necessary conditions for fish to spawn. In addition,, SDD and SPM are other two indicators of lake water quality for assessing lake eutrophication and fish habitat quality.
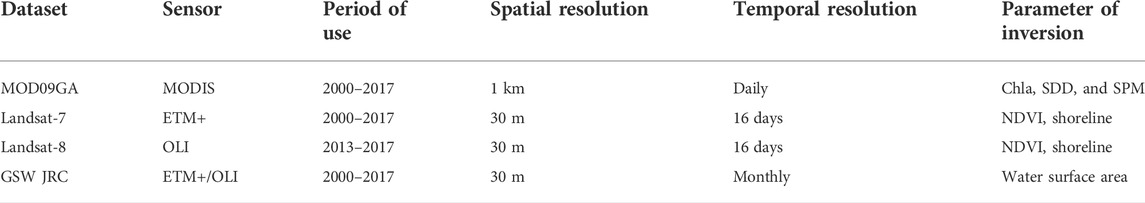
TABLE 1. Main remote sensing data employed in the study.
In addition, we employed the Landsat-5 TM (1984–2013), Landsat-7 ETM+ (1999-present), and Landsat-8 OLI (2013-present) images to calculate the Normalized Difference Vegetation Index (NDVI) (Supplementary Text S1 in Supporting Information), which could indicate the aquatic vegetation status of Poyang Lake (Penuelas et al., 1993; Villa et al., 2014; Chen et al., 2018). These sensors have a 30 m pixel resolution and a revisiting cycle every 16 days on average. The primary fish of Poyang Lake, such as carp and crucian carp, usually use grass beds as preferential spawning grounds (Roche et al., 2000; Huang and Li, 2016). Most of their spawning grounds are distributed in the shallow parts of the lake and with abundant aquatic vegetation (Du et al., 2017). Therefore, NDVI can assist in the search of places with high vegetation concentrations as the identification marks of fish spawning grounds.
Global Surface Water (GSW) datasets of the Joint Research Centre (JRC) derived from Landsat series satellite data were employed to extract the yearly and monthly water surface area and shoreline length of Poyang Lake (Pekel et al., 2016). The ratio of shoreline length and equal area circumference represents the degree of shoreline development, indicating the range of fish habitats. The yearly water surface area combined with the lake bathymetry could estimate the water volumes in different years. In addition, it is possible to obtain the distribution of potential spawning grounds in a particular depth range for a specific season based on monthly water surface area, NDVI, and bathymetry (Herold et al., 2007; Grimm et al., 2016).
We also used the Climatic Research Unit (CRU) dataset to supplement the missing data at a few stations result in the time gap of meteorological variables. CRU is a widely used climate interpolation dataset based on meteorological stations and provides a monthly grid at a resolution of 0.5° × 0.5° covering the Earth, excluding Antarctica since 1901 (Harris et al., 2020). We applied CRU TS v.4.05 version (https://crudata.uea.ac.uk/cru/data/hrg/) from 1960 to 2017 in this study to provide five climatological variables, including precipitation, temperature, evapotranspiration, atmospheric pressure, and relative humidity. These variables were the same as measured by meteorological stations, and they had a strong association with the fishery catches of Poyang Lake during the study period. Therefore, these variables were aggregated into the annual average as the model input parameters to simulate the time series of yearly fishery catches extracted by the boundary of the Poyang Lake basin.
Furthermore, the lake bathymetry map at a 1:10,000 scale was surveyed in 2010, and data on yearly fishery catches during 1960–2017 were obtained from the Hydrological Bureau of Jiangxi Province. The bathymetry map provided the water depth of Poyang Lake and was used to estimate water volume variations. The fishery catches’ data were involved in the machine learning model for training and validation.
The environmental impact on lake fishery resources is very complex, and the dominant driving forces remain to be debated. Considering the complexity and diversity of environmental factors affecting lake fishery resources, we designed a conceptual model to explicitly represent the different dimensional influencing factors of fish catch (Figure 2). In the model, hydrometeorological factors based on gauging stations, water quality, and ecological indicators derived from remote sensing were considered three-group independent variables (Table 2). In addition, the fish catch was taken as the dependent variable of the model to represent the lake fishery resources (Figure 2). Combining remote sensing and machine learning algorithms, we explored the effect of environmental variables on fishery catch as illustrated in the conceptual model.
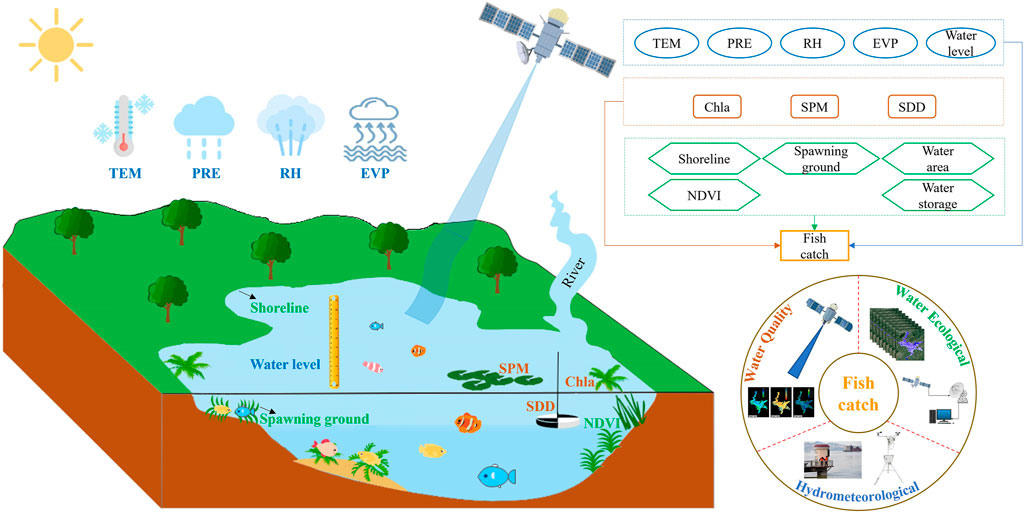
FIGURE 2. Schematic diagram illustrating the machine learning model of fish catch simulation and main environmental variables. Variables associated with hydrometeorological conditions are in oval blue boxes. Variables associated with water quality are in brown-rounded rectangular boxes. Variables associated with water ecological conditions are in green-hexagon boxes.
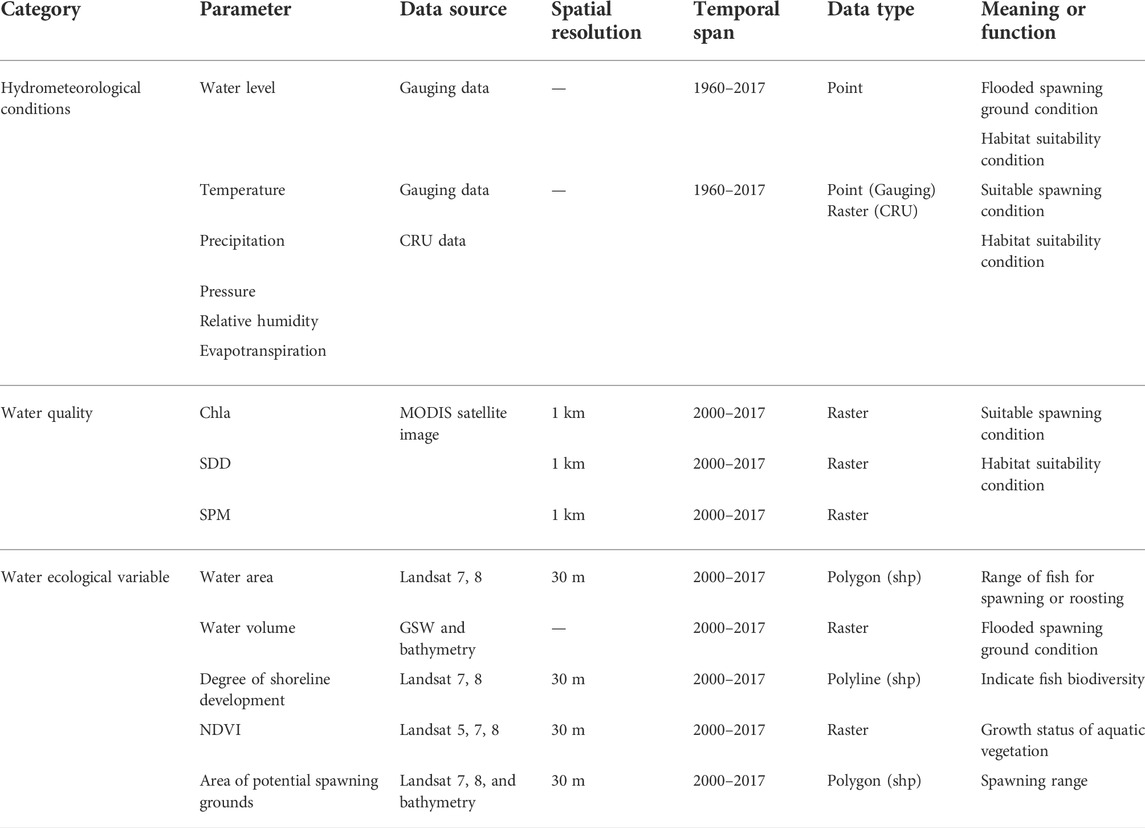
TABLE 2. List of environmental variables involved in the machine learning model.
In this study, we established two sets of simulation experiments based on the machine learning algorithm to simulate fishery catches of Poyang Lake due to the inconsistent temporal spans of different variables. The first set of experiments was long-term simulations based on the hydrometeorological variables for nearly six decades (1960–2017). In these experiments, the hydrological and meteorological gauging data and CRU data were trained and simulated separately or recombined for the optimal stimulation (termed Case 1, long time-series simulation experiments). Then, based on the optimal simulation combination scheme in the first-set experiments, we added the multiple environmental variables representing water quality and ecological indicators in the second set of experiments for the period 2000–2017. Thus, in the second set of experiments, the different combinations of variables will be applied to the machine learning algorithm to simulate the fishery catches in the recent two decades (termed Case 2 and two-decade simulation experiments).
We used the extreme gradient boosting tree (XGBoost) algorithm with the hydrometeorological variables, water quality, and water ecological variables in the conceptual model to simulate the fishery catches of Poyang Lake over the recent decades. XGBoost, an implementation of gradient boosted decision trees (GBDT) designed for speed and performance, is proposed by Chen et al. (2016). Recently, XGBoost has attracted more attention in machine learning algorithms because it is highly efficient, flexible, and portable. XGBoost is an improved GBDT algorithm, but a new tree model loss function with regularization is utilized to prevent overfitting and reduce the complexity of the model (Song et al., 2020; Fan et al., 2021). The equations of the XGBoost algorithm are illustrated as follows:
where the
Another two algorithms, the deep neural network (DNN) and random forests (RF), were also employed to compare with the XGBoost algorithm performance (more details about two algorithms in Supplementary Text S2 in Supporting Information). DNN is a powerful machine learning algorithm implemented by stacking layers of neural networks and the depth and width of smaller architectures and needs a large amount of annotated data for training (Chien, 2018). RF is a supervised machine learning algorithm constructed from decision tree algorithms introduced by Breiman (2001). Random forests are a collection of classification and regression trees, using binary splits on predictor variables to determine outcome predictions (Breiman et al., 2017). Furthermore, XGBoost and RF are both popular ensemble learning algorithms. DNN is a powerful neural network and deep learning algorithm. All three algorithms can deal with complex variables and are thus selected to compare their performance in simulation experiments. For all the three abovementioned algorithms, the variables during the study period were randomly divided into training sets (70% of the sample) and testing sets (30% of the sample). The training data sets consisted of fishery catch data and corresponding environmental variables, and the rest were the testing data sets. After model training and testing, we used the trained model to simulate the fishery catches in two sets of experiments during the whole study period.
In this study, we employed the correlation coefficient (R), root mean square error (RMSE), mean absolute error (MAE), and Nash–Sutcliffe efficiency (NSE) to evaluate the model performance. The Nash–Sutcliffe efficiency index is a widely used and potentially reliable statistic to assess the performance of hydrologic models (Jain and Sudheer, 2008). Precisely, the aforementioned metrics are calculated by the following equation:
where
The time series of hydrometeorological variables monitored from hydrological and meteorological stations are shown in Figure 3. Precipitation and temperature had a generally consistent fluctuation trend that had strong influences on the fish catches. For example, in the flood event year of 1998, the highest values of the annual mean temperature (18.95°C) and annual precipitation (2,138.36 mm) of Poyang Lake matched the extreme of total fish catch (71.90 thousand tons) during 1960–2017. Yet, the atmospheric pressure (994.56 hPa/yr) monitored at various stations in the Poyang Lake basin had remained almost constant during the study period, which also showed that atmospheric pressure had little effect on fishery resources. On the other hand, based on observations from 26 meteorological stations in the Poyang Lake basin, relative humidity showed a fluctuating decline during the study period with a plunge in 2002. Furthermore, evapotranspiration in the Poyang lake basin showed a continuous downward trend during the study period, from 4,138.86 mm in 1960 to 2,411.02 mm in 2017. In addition, the water level of Duchang, Hukou, Kangshan, and Xingzi stations showed similar fluctuations from 1960 to 2017 with the apparent difference in water level between the upper, middle, and lower reaches of Poyang Lake. The maximum water level difference between upstream and downstream was close to 5 m. Therefore, the difference in water level also affected the spatial distribution of fish species and fishery resources.
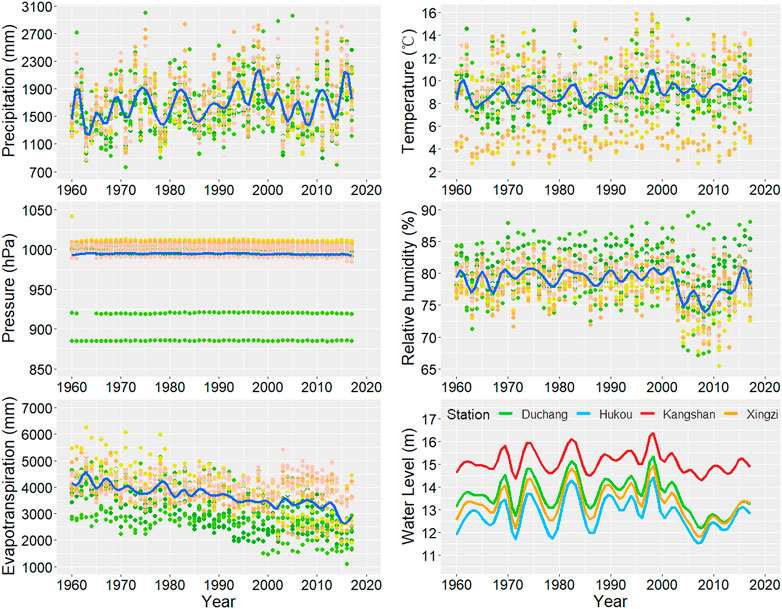
FIGURE 3. Time series of hydrometeorological variables derived from gauging stations in the Poyang Lake basin during 1960–2017. The points in different colors represent the measured value from different meteorological stations. The blue lines in each meteorological variable represent the time series of multi-site averages. Color lines in the right-bottom panel are the measured value derived from hydrological stations.
Figure 4 displays the monthly time series and spatial distribution of the annual average of Chla, SDD, and SPM in the Poyang Lake based on remote sensing estimations. The inversion results of the three water quality parameters all appeared periodic fluctuations. The seasonal change of three parameters each was Chla (5.03 μg/L), SDD (0.90 m), and SPM (26.56 mg/L). Moreover, the spatial distribution of water quality was significantly different between upstream and downstream. For instance, the Chla concentration was lower downstream (usually less than 3 μg/L) and higher upstream (over 10 μg/L), consistent with the spatial distribution of aquatic vegetation in Poyang Lake. Aquatic vegetation is necessary for fish to spawn, so the distribution of Chla concentration will affect the spatial distribution of spawning grounds. In addition, the spatial distribution of SPM and SDD presented a significant negative correlation. For example, the lower reaches of Poyang Lake had lower SDD (0–0.25 m) and higher SPM (50–70 mg/L). SPM in the middle part of the lake was usually higher than that in other areas, especially near the entrance of the Yangtze River (over 70 mg/L). The SDD in the west and east was more significant than the lake outlet and the lake center, and the difference reached 1–1.5 m.
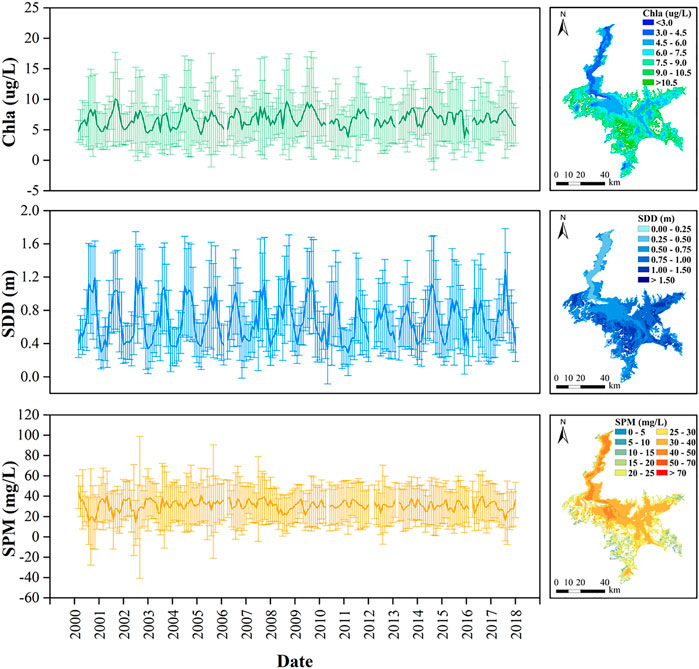
FIGURE 4. Time-series (left panels) and spatial distribution (right panels) of the annual average of Chla, SDD, and SPM estimated from MODIS data for the Poyang Lake. The green line represents the time series of Chla. The blue line represents the time series of SDD. The orange line represents the time series of SPM. Error bars represent the uncertainty of remote sensing inversion results.
The potential spawning grounds of Poyang Lake showed an inevitable inter-annual fluctuation, and the lowest was only 371.78 km2 in 2010. After 2016, the area of potential spawning grounds gradually increased and reached 501.25 km2 in 2017 (Figure 5). The size of the potential spawning grounds can indicate the fish caught in the next year, which had a strong correlation with the number of fish catches. From spatial distribution, the potential spawning grounds were located in the sub-lakes of the upper and middle reaches of Poyang Lake with relatively low depth. Yet, the deep water zones represented by the gray pixels cannot be the potential spawning grounds.
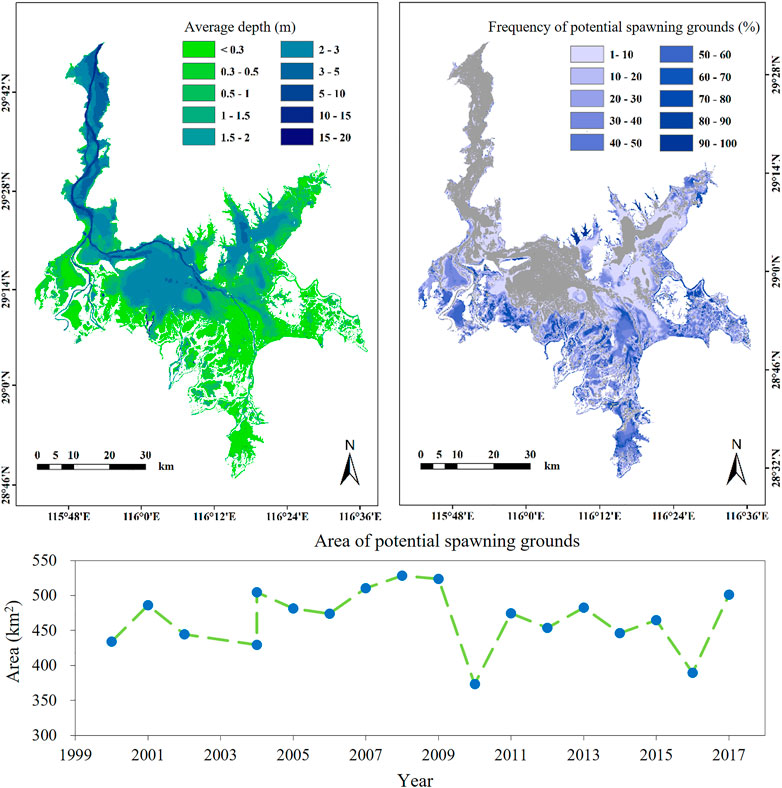
FIGURE 5. Area of potential spawning grounds estimated based on lake topography and monthly water area extent. The upper left panel represents the average depth of Poyang Lake during the study period. The upper right panel represents the distribution of the frequency of potential spawning grounds (%). The gray pixels in the background represent the places that are unlikely to be spawning grounds. The bottom panel shows the area time series of potential spawning grounds.
Long time series of simulated annual fish catches based on the different combinations of hydrometeorological variables were illustrated in Figure 6 (Case 1). The difference between the measured and simulated annual fish catches in Poyang Lake almost completely fall in the one-fold or two-fold uncertainty range, represented by the standard deviation (SD) of multiple-iteration simulations. It suggests that the simulation results could well capture details of annual fish catch in Poyang Lake based on hydrometeorological variables participating in machine learning training. In the past 60 years, the fish catches in Poyang Lake increased first and then decreased and experienced a dramatic rise in 1998 with an extreme flood in the Yangtze. The annual fish catches were between 20 and 40 thousand tons in most years except for a few memorable years (e.g., 1966–1972, 1974–1979, and 1996–1999).
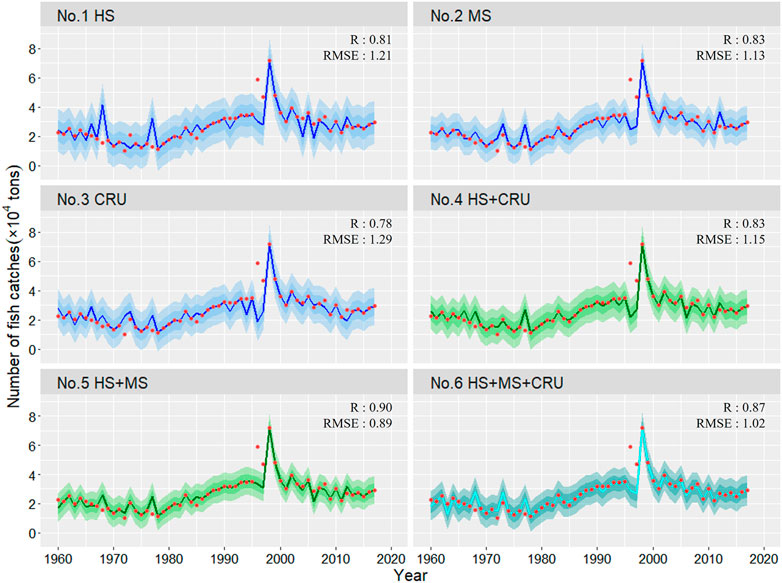
FIGURE 6. Long time series simulation results based on hydrometeorological variables. Red scatter represents the measured value of the fish catch. The solid line is the simulation result of fish catch. The dark ribbon is the one-fold SD of the simulation results, and the light ribbon is the two-fold SD of the simulation result.
Although the simulation results derived from different parameter combinations participating in the machine learning algorithm training can well capture the details of annual fish catches in Poyang Lake, different parameter combinations induced slight discrepancy. For example, the third group experiment (No. 3 CRU in Figure 6) was only based on CRU meteorological variables participated in the training, with the correlation coefficient (R) and root mean square error (RMSE) being 0.78 and 12,900 tons, respectively. As a result, the No. 3 group experiment showed a more significant error than the No. 1 and No. 2 group experiments, which employed measured values to participate in the training. Furthermore, the simulation results of multiple variables participating in the modeling are better than single variables (No. 4, No. 5, and No. 6 groups). The best simulation experimental results can be observed in the fifth group (No. 5 HS + MS in Figure 6), which involved monitoring data from hydrological and meteorological stations participating in the training and had the minimum simulation error with R and RMSE of 0.90 and 8,900 tons, respectively. From these different combinations, it can be inferred that the hydrometeorological conditions of fishery habitats were important controlling factors affecting the fish catches of Poyang Lake during the study period.
To further explore the effects of other environmental factors on fish catches, we integrated the water quality and ecological variables with the hydrometeorological conditions of fishery habitats in the new simulation experiments based on Case 1 (Case 2). As shown in Figure 7, the time series of simulated annual fish catches based on combined hydrometeorological, water quality, and ecological variables performed better than that only based on hydrometeorological variables. In addition, water quality (No. 2 WQ) and water ecological (No. 3 WECO) parameters as independent variables participating in the model had better simulation results than hydrometeorological station data (No. 1 HM). Therefore, it can be inferred that parameters impacting the fish catches from high to low are water ecological indicators, water quality, and hydrometeorological variables (No. 1, No. 2, and No. 3 in Figure 7). Furthermore, no matter water quality (No. 4 HM + WQ in Figure 7) or water ecological (No. 5 HM + WECO in Figure 7) parameters can further improve the accuracy of fish catches simulation of Poyang Lake by a combination with the hydrometeorological station data.
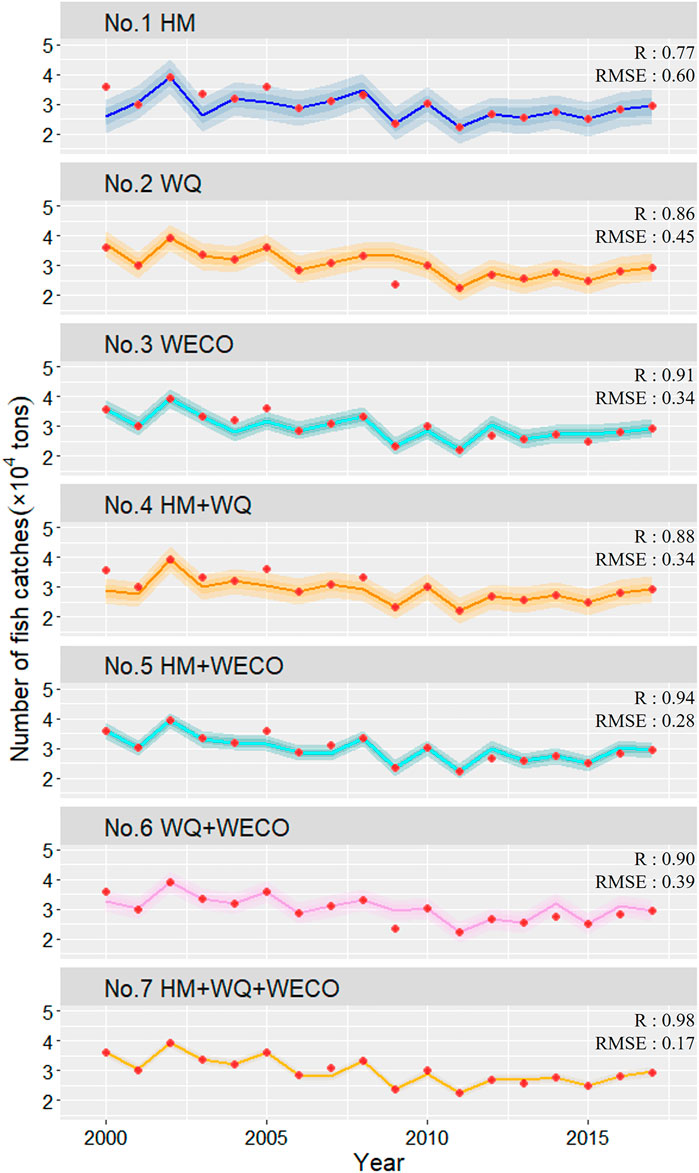
FIGURE 7. Simulation results based on the combination of hydrometeorological conditions, water quality, and ecological variables.
The combination of different dimensions of variables also affected the simulation results. For instance, the No. 6 groups with the combination of water quality and ecological variables participating in the model had better simulation performance than the combinations of No. 4 and No. 5 groups. The best simulation result was derived from the No. 7 group experiment (HM + WQ + WECO in Figure 7), which involved gauging data from hydrometeorological stations, water quality, and water ecological variables with the R and RMSE of 0.98 and 1700 tons, respectively. On the other hand, the No. 4 group experiment (R = 0.88, RMSE = 3,400 tons) showed a more significant error than the No. 5 group experiments (R = 0.94, RMSE = 2,800 tons), which meant that aquatic species of fish catches in Poyang Lake might be more susceptible to water ecological factors than water quality during the study period.
Based on hydrometeorological variables of the simulation experiments in Case 1 (Group No. 5), XGBoost, DNN, and RF machine learning approaches were employed to simulate the fish catches. The performance of the XGBoost algorithm was best compared with DNN and RF algorithms (Figure 8). Although the DNN and RF algorithms generally derived comparable temporal patterns of the simulated results with the XGBoost algorithm, they cannot precisely capture the abrupt shifts (e.g., the peak in 1996–1999). The results based on the three algorithms all have strong correlations (>0.7) with the validated samples. In terms of the RMSE and MAE, the XGBoost model had the lowest values. Furthermore, the NSE of the XGBoost model was high as 0.97, indicating the model was the most satisfactory in this study.
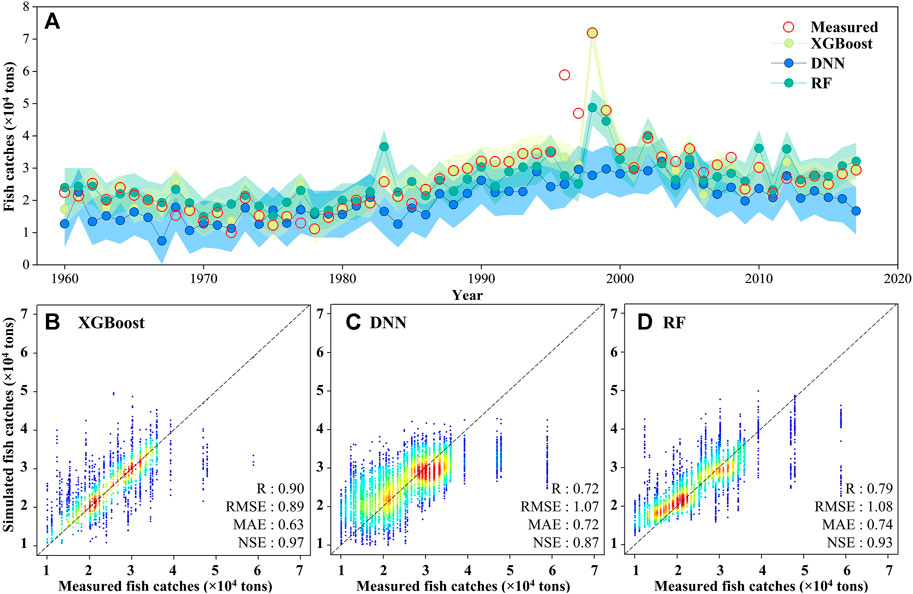
FIGURE 8. Predicted fish catches of Poyang Lake based on XGBoost, DNN, and RF models (A) and performance evaluation of the XGBoost (B), DNN (C), and RF (D) models.
Differences in model results are mainly contingent on their algorithm principles. For example, the XGBoost algorithm comes with a built-in cross-validation method at each iteration, which prevents the model from overfitting (Chen and Guestrin, 2016). By contrast, DNN and RF algorithms cannot learn the covariances among the input variables and allow the application of regularization parameters to control the overfitting of the model. Furthermore, the DNN algorithm usually requires more training data for model simulation than the other two algorithms, like thousands of labeled samples. However, the data used in this study does not reach this level. In addition, the RF model is good at classification but not for regression issues. More importantly, the XGBoost model uses parallelized implementation to build the process of the sequential trees, which can substantially improve the algorithm efficiency.
The XGBoost algorithm includes many input parameters, such as maximum tree depth, learning rate, maximum iterations, L1 and L2 regularization terms on weight . In general, one of the critical parameters for the simulation of fish catches is the maximum iterations in this study. To explore and compare the sensitivity of the key parameter of the XGBoost algorithm on simulation results, we used a robustness test to analyze the importance of the maximum iterations of the XGBoost algorithm and the influence of the maximum iterations on the simulation results. Figure 9 shows the simulation results with different maximum iterations and the robustness test of the maximum iterations (e.g., 5, 6, 7, 8, 9, 10, 100, 1,000, and 10,000). With the increase in maximum iterations, the simulation results based on the XGBoost algorithm were closer to the measured values (Figure 9A). For example, the modeling performance was significantly improved when maximum iterations increased between 5 and 100. Concurrently, the model performance tended to be more robust in terms of the R, RMSE, MAE, and NSE (Figure 9B). Furthermore, when the maximum iterations of the XGBoost algorithm exceeded 100, modeling results became robust (Figure 9B).
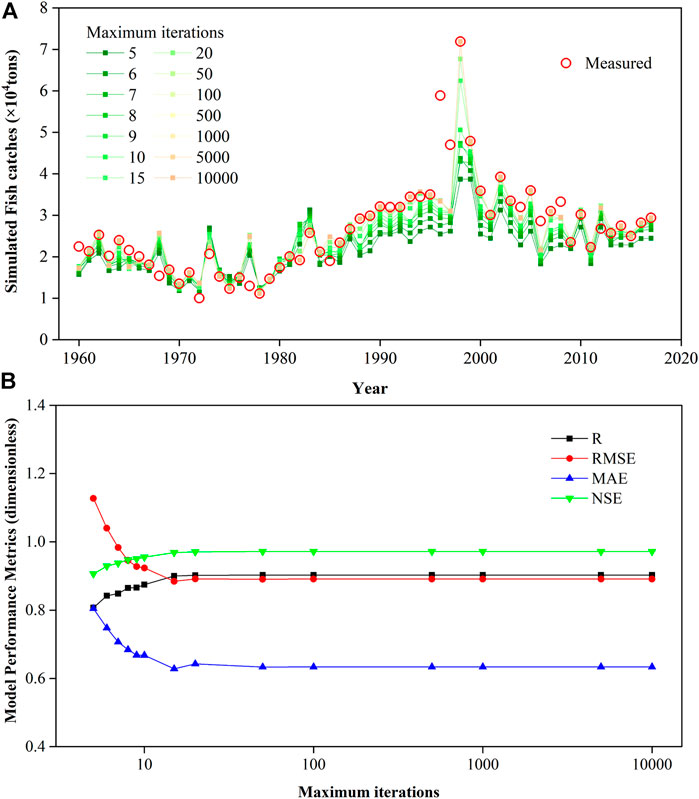
FIGURE 9. Comparison of simulations at different maximum iterations (A) and robustness test of the maximum iterations (B).
The machine learning model is a data-based method. Although it can reasonably simulate the relationship between the environmental factors and the fish catch, the lack of explanation of internal physical mechanism leads to failure to capture the detailed changes at certain moments, such as a peak in 1996. It is undeniable that the impacts of fishery resources come from natural factors and human activities (e.g., fishing policy formulation and innovation in fishing technology). However, the development of freshwater fishery in China is a human-led activity, unlike other continuous environmental variables that can participate in the model. Therefore, we used the method of mutation point detection (Christopoulos, 2016) to find the inflection points in the time series and discuss the human activities leading to the abrupt changes in fish catches.
China has a long fishery history and rich fishing culture, but the fishery activities were conducted in an original way and in local areas until the 1950s (Hu et al., 2021). The development of freshwater fishery in modern China dates back to the founding of the People’s Republic of China when fishery production recovered and developed rapidly. The time series of fish catches in Poyang Lake have experienced several critical stages and nodes as follows. They could be related to the contemporary fishery development in China according to inflection points (Figure 10). In the first stage (1960–1978), the fish catch of Poyang Lake was consistent with the national fishery production level and kept a relatively steady state of fluctuation. Since 1978, when China began to implement the reform and opening-up policy, fishery production has developed rapidly (Hu et al., 2021). In 1985, the No. 5 Central document was released, marking that China fully liberalized the national aquatic product market (Lin, 1997; Gui et al., 2018). Maybe because of the implementation of this policy, the fish catches of Poyang Lake showed a steady growth trend in the second stage (1978–the 1990s). Particularly, the fish catches in Poyang Lake increased dramatically and reached a peak in 1998. This is because the Yangtze River basin suffered severe floods, resulting in a large number of fish in the artificial ponds escaping into the lake. In the third stage (2000–2017), the fish catches in Poyang Lake began to steadily decline again. In this stage, the spring fishing ban act may explain the drop in fishing catches, with the feature year in 2004.
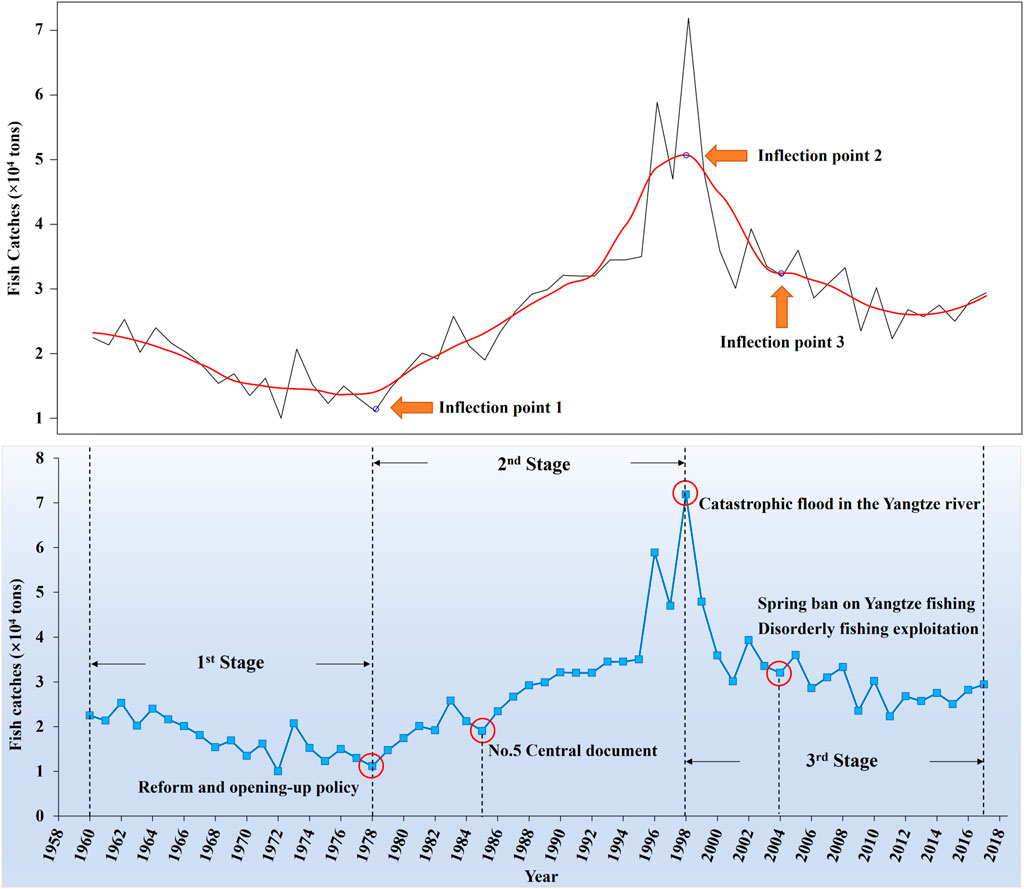
FIGURE 10. Time series of fish catches in Poyang Lake and historical background of inflection points.
Taking the largest freshwater lake in China (Poyang Lake) as a study case, we designed two sets of simulation experiments with different input variable combinations to model the environmental influences on lake fish catches. We aimed to assess and analyze the potential of applying remote sensing and machine learning approaches to simulate lake fish resources and their sensitivities to environmental factors. Based on the simulation experiments at different timescales, we found that the hydrometeorological conditions of fishery habitats are critical controlling factors affecting the fish catches of Poyang Lake in a six-decade simulation. Fish catches of aquatic species in Poyang Lake are more susceptible to water ecological factors than water quality. In addition, the two-decade simulation experiments of independent variables indicate that the parameters impacting the fish catches from high to low are water ecological indicators, water quality, and hydrometeorological variables. Among the different simulation experiments, the optimal scheme is the combination of hydrometeorological conditions, water quality, and water ecological variables all involved in the model training. The R value is as high as 0.98, and RMSE is 1,700 tons.
We highlight the capacity of machine learning algorithms and remote sensing to advance our understanding of the effect of environmental variables on lake fishery resources. Our method could save labor and economic costs in the field investigation and is friendly for users with inadequate prior knowledge. Integrating machine learning algorithms with the ground and satellite-based data can help improve efficiencies in fishy resources surveys and benefit lake fisheries and aquatic food security. Although remote sensing and machine learning methods have been used extensively to monitor and assess the aquatic environmental impacts, we suggest fish ecologists, public authorities, stakeholders, and decision-makers take the proposed approach to improve fishery resource management. Future work should extend such efforts to longer periods and larger spatial scales.
The original contributions presented in the study are included in the article/Supplementary Material; further inquiries can be directed to the corresponding author.
Conceptualization, CS and TC; data curation, TC, CF, and KL; formal analysis, TC, CS, XG, and KL; funding acquisition, CS; investigation, TC, ZL, and JC; methodology, CF, JC, and ZL; project administration, CS; resources, TC, CS, and XG; software, TC, CF, and PZ; supervision, CS and XG; validation, TC, CS, CF, and KL; visualization, TC and ZL; writing—original draft, TC and CS; writing—review and editing TC, CS, CF, and KL.
This work was partly funded by the National Key Research and Development Program of China (Grant Nos. 2018YFD0900804, 2018YFD1100101, and 2019YFA0607101), the Strategic Priority Research Program of the Chinese Academy of Sciences (Grant No. XDA23100102), the National Natural Science Foundation of China (Grant Nos. 42101402 and 41971403), and the Natural Science Foundation of Jiangsu Province (Grant No. BK20210990).
The authors are grateful to the United States Geological Survey (USGS) for providing satellite image data for this study. In addition, the authors express their gratitude to the Global Surface Water data (https://global-surface-water.appspot.com/) generated by Joint Research Centre (JRC). Finally, they are grateful to the scientific editor and the reviewers for their careful review of the manuscript used to improve the study.
The authors declare that the research was conducted in the absence of any commercial or financial relationships that could be construed as a potential conflict of interest.
All claims expressed in this article are solely those of the authors and do not necessarily represent those of their affiliated organizations, or those of the publisher, the editors, and the reviewers. Any product that may be evaluated in this article, or claim that may be made by its manufacturer, is not guaranteed or endorsed by the publisher.
The Supplementary Material for this article can be found online at: https://www.frontiersin.org/articles/10.3389/fenvs.2022.944319/full#supplementary-material
Araujo, C. V., Silva, D. C., Gomes, L. E., Acayaba, R. D., Montagner, C. C., Moreira-Santos, M., et al. (2018). Habitat fragmentation caused by contaminants: atrazine as a chemical barrier isolating fish populations. Chemosphere 193, 24–31. doi:10.1016/j.chemosphere.2017.11.014
Awad, M. (2014). Sea water chlorophyll-a estimation using hyperspectral images and supervised artificial neural network. Ecol. Inf. 24, 60–68. doi:10.1016/j.ecoinf.2014.07.004
Barbarossa, V., Bosmans, J., Wanders, N., King, H., Bierkens, M. F. P., Huijbregts, M. A. J., et al. (2021). Threats of global warming to the world’s freshwater fishes. Nat. Commun. 12 (1), 1701. doi:10.1038/s41467-021-21655-w
Breiman, L., Friedman, J. H., Olshen, R. A., and Stone, C. J. (2017). Classification and regression trees. New York, NY: Routledge.
Cao, Z., Duan, H., Feng, L., Ma, R., and Xue, K. (2017). Climate-and human-induced changes in suspended particulate matter over Lake Hongze on short and long timescales. Remote Sens. Environ. 192, 98–113. doi:10.1016/j.rse.2017.02.007
Chen, T., and Guestrin, C. (2016). “Xgboost: A scalable tree boosting system,” in Proceedings of the 22nd acm sigkdd international conference on knowledge discovery and data mining, San Francisco, CA, August 13–17, 2016. 785–794.
Chen, B., Chen, L., Huang, B., Michishita, R., and Xu, B. (2018). Dynamic monitoring of the Poyang Lake wetland by integrating Landsat and MODIS observations. ISPRS J. Photogramm. Remote Sens. 139, 75–87. doi:10.1016/j.isprsjprs.2018.02.021
Chen, T., Song, C., Ke, L., Wang, J., Liu, K., and Wu, Q. (2021). Estimating seasonal water budgets in global lakes by using multi-source remote sensing measurements. J. Hydrol. 593, 125781. doi:10.1016/j.jhydrol.2020.125781
Chen, J. (2020). Ecosystem of the Yangtze River basin, evolution and water resources utilization of the Yangtze River. Wuhan, China: Springer, 163–220.
Chien, J.-T. (2018). Source separation and machine learning. London, United Kingdom: Academic Press.
Christopoulos, D. T. (2016). “On the efficient identification of an inflection point,” in International journal of mathematics and scientific computing, 6. (ISSN: 2231-5330).1
Comte, L., Olden, J. D., Tedesco, P. A., Ruhi, A., and Giam, X. (2021). Climate and land-use changes interact to drive long-term reorganization of riverine fish communities globally. Proc. Natl. Acad. Sci. U. S. A. 118 (27), e2011639118. doi:10.1073/pnas.2011639118
Crétaux, J.-F., Abarca-del-Río, R., Berge-Nguyen, M., Arsen, A., Drolon, V., Clos, G., et al. (2016). Lake volume monitoring from space. Surv. Geophys. 37 (2), 269–305. doi:10.1007/s10712-016-9362-6
Du, W., Li, Z., Zhang, Z., Jin, Q., Chen, X., Jiang, S., et al. (2017). Composition and biomass of aquatic vegetation in the Poyang Lake, China. Scientifica.
Fan, C., Song, C., Liu, K., Ke, L., Xue, B., Chen, T., et al. (2021). Century-scale reconstruction of water storage changes of the largest lake in the inner Mongolia plateau using a machine learning approach. Water Resour. Res. 57 (2), e2020WR028831. doi:10.1029/2020wr028831
Feng, L., Hou, X., and Zheng, Y. (2019). Monitoring and understanding the water transparency changes of fifty large lakes on the Yangtze Plain based on long-term MODIS observations. Remote Sens. Environ. 221, 675–686. doi:10.1016/j.rse.2018.12.007
Ferrari, R., Malcolm, H. A., Byrne, M., Friedman, A., Williams, S. B., Schultz, A., et al. (2018). Habitat structural complexity metrics improve predictions of fish abundance and distribution. Ecography 41 (7), 1077–1091. doi:10.1111/ecog.02580
Giannoulaki, M., Pyrounaki, M. M., Bourdeix, J.-H., Ben Abdallah, L., Bonanno, A., Basilone, G., et al. (2017). Habitat suitability modeling to identify the potential nursery grounds of the Atlantic mackerel and its relation to oceanographic conditions in the Mediterranean sea. Front. Mar. Sci. 4, 230. doi:10.3389/fmars.2017.00230
Gong, W. B., Li, H. T., Xie, S. Q., Liu, J. S., and Murphy, B. R. (2009). Two spawning stocks of icefish Neosalanx taihuensis revealed from annual reproductive cycle analyses. Fish. Sci. 75 (5), 1157–1165. doi:10.1007/s12562-009-0145-6
Grimm, A. G., Brooks, C. N., Binder, T. R., Riley, S. C., Farha, S. A., Shuchman, R. A., et al. (2016). Identification of lake trout Salvelinus namaycush spawning habitat in northern Lake Huron using high-resolution satellite imagery. J. Gt. Lakes. Res. 42 (1), 127–135. doi:10.1016/j.jglr.2015.11.011
Gui, J.-F., Tang, Q., Li, Z., Liu, J., and De Silva, S. S. (2018). Aquaculture in China: success stories and modern trends. Hoboken, NJ: John Wiley & Sons.
Harris, I., Osborn, T. J., Jones, P., and Lister, D. (2020). Version 4 of the CRU TS monthly high-resolution gridded multivariate climate dataset. Sci. Data 7 (1), 109. doi:10.1038/s41597-020-0453-3
Herold, M., Metz, J., and Romsos, J. S. (2007). Inferring littoral substrates, fish habitats, and fish dynamics of Lake Tahoe using IKONOS data. Can. J. Remote Sens. 33 (5), 445–456. doi:10.5589/m07-045
Hou, X., Feng, L., Duan, H., Chen, X., Sun, D., and Shi, K. (2017). Fifteen-year monitoring of the turbidity dynamics in large lakes and reservoirs in the middle and lower basin of the Yangtze River, China. Remote Sens. Environ. 190, 107–121. doi:10.1016/j.rse.2016.12.006
Hu, F., Zhong, H., Wu, C., Wang, S., Guo, Z., Tao, M., et al. (2021). Development of fisheries in China. Reproduction Breed. 1 (1), 64–79. doi:10.1016/j.repbre.2021.03.003
Huang, L., and Li, J. (2016). Status of freshwater fish biodiversity in the Yangtze River Basin, China, Aquatic biodiversity conservation and ecosystem services. Singapore: Springer, 13–30.
Jain, S. K., and Sudheer, K. (2008). Fitting of hydrologic models: a close look at the nash–sutcliffe index. J. Hydrol. Eng. 13 (10), 981–986. doi:10.1061/(asce)1084-0699(2008)13:10(981)
Jin, B. S., Winemiller, K. O., Shao, B., Si, J. K., Jin, J. F., and Ge, G. (2019). Fish assemblage structure in relation to seasonal environmental variation in sub-lakes of the Poyang Lake floodplain, China. Fish. Manag. Ecol. 26 (2), 131–140. doi:10.1111/fme.12333
Kao, Y.-C., Rogers, M. W., Bunnell, D. B., Cowx, I. G., Qian, S. S., Anneville, O., et al. (2020). Effects of climate and land-use changes on fish catches across lakes at a global scale. Nat. Commun. 11 (1), 2526. doi:10.1038/s41467-020-14624-2
Kutser, T. (2004). Quantitative detection of chlorophyll in cyanobacterial blooms by satellite remote sensing. Limnol. Oceanogr. 49 (6), 2179–2189. doi:10.4319/lo.2004.49.6.2179
La Notte, A., D’Amato, D., Mäkinen, H., Paracchini, M. L., Liquete, C., Egoh, B., et al. (2017). Ecosystem services classification: A systems ecology perspective of the cascade framework. Ecol. Indic. 74, 392–402. doi:10.1016/j.ecolind.2016.11.030
Le, C., Hu, C., Cannizzaro, J., English, D., Muller-Karger, F., and Lee, Z. (2013). Evaluation of chlorophyll-a remote sensing algorithms for an optically complex estuary. Remote Sens. Environ. 129, 75–89. doi:10.1016/j.rse.2012.11.001
Li, Y., Zhang, Q., Liu, X., and Yao, J. (2020). Water balance and flashiness for a large floodplain system: A case study of Poyang lake, China. Sci. Total Environ. 710, 135499. doi:10.1016/j.scitotenv.2019.135499
Lin, J. Y. (1997). Institutional reforms and dynamics of agricultural growth in China. Food Policy 22 (3), 201–212. doi:10.1016/s0306-9192(97)00009-2
Liu, X., Qin, J., Xu, Y., Zhou, M., Wu, X., and Ouyang, S. (2019). Biodiversity pattern of fish assemblages in Poyang lake basin: Threat and conservation. Ecol. Evol. 9 (20), 11672–11683. doi:10.1002/ece3.5661
Lucas, M. C., and Baras, E. (2000). Methods for studying spatial behaviour of freshwater fishes in the natural environment. Fish. Fish. (Oxf). 1 (4), 283–316. doi:10.1046/j.1467-2979.2000.00028.x
Luo, S., Song, C., Zhan, P., Liu, K., Chen, T., Li, W., et al. (2021). Refined estimation of lake water level and storage changes on the Tibetan Plateau from ICESat/ICESat-2. Catena 200, 105177. doi:10.1016/j.catena.2021.105177
Mahesh, B. (2020). Machine learning algorithms-A review. Int. J. Sci. Res. (IJSR) 9, 381–386. [Internet]. doi:10.21275/ART20203995
Mccullough, C. D., Steenbergen, J., Te Beest, C., and Lund, M. A. (2009). “More than water quality: Environmental limitations to a fishery in acid pit lakes of collie, south-west Australia,” in , Proceedings of the International Mine Water Conference (Pretoria, South Africa: International Mine Water Association), 507–511. Citeseer.
Missaghi, S., Hondzo, M., and Herb, W. (2017). Prediction of lake water temperature, dissolved oxygen, and fish habitat under changing climate. Clim. Change 141 (4), 747–757. doi:10.1007/s10584-017-1916-1
Mohammed, M., Khan, M. B., and Bashier, E. B. M. (2016). Machine learning: algorithms and applications. Boca Raton, FL: CRC Press.
Njiru, J., van der Knaap, M., Kundu, R., and Nyamweya, C. (2018). Lake victoria fisheries: Outlook and management. Lakes. Reserv. 23 (2), 152–162. doi:10.1111/lre.12220
Pauly, D., and Zeller, D. (2017). Comments on FAOs state of world fisheries and aquaculture (SOFIA 2016). Mar. Policy 77, 176–181. doi:10.1016/j.marpol.2017.01.006
Pekel, J.-F., Cottam, A., Gorelick, N., and Belward, A. S. (2016). High-resolution mapping of global surface water and its long-term changes. Nature 540 (7633), 418–422. doi:10.1038/nature20584
Penuelas, J., Gamon, J. A., Griffin, K. L., and Field, C. B. (1993). Assessing community type, plant biomass, pigment composition, and photosynthetic efficiency of aquatic vegetation from spectral reflectance. Remote Sens. Environ. 46 (2), 110–118. doi:10.1016/0034-4257(93)90088-f
Petitgas, P., Reid, D., Planque, B., et al. (2006). The entrainment hypothesis: an explanation for the persistence and innovation in spawning migrations and life cycle spatial patterns. ICES Document CM.
Qi, L., Zhang, S., Manos, A. J., Hay, D. E., McCarter, B., Wang, M., et al. (2021). Satellite remote sensing of herring (Clupea pallasii) spawning events: A case study in the strait of Georgia. Geophys. Res. Lett. 48 (7), e2020GL092126. doi:10.1029/2020gl092126
Roche, H., Buet, A., Jonot, O., and Ramade, F. (2000). Organochlorine residues in European eel (Anguilla anguilla), crucian carp (Carassius carassius) and catfish (Ictalurus nebulosus) from Vaccarès lagoon (French National Nature Reserve of Camargue)–effects on some physiological parameters. Aquat. Toxicol. 48 (4), 443–459. doi:10.1016/s0166-445x(99)00061-2
Rypel, A. L., Simonson, T. D., Oele, D. L., Griffin, J. D. T., Parks, T. P., Seibel, D., et al. (2019). Flexible classification of Wisconsin lakes for improved fisheries conservation and management. Fisheries 44 (5), 225–238. doi:10.1002/fsh.10228
Sifundza, D. S., Chakona, A., and Kadye, W. T. (2021). Distribution patterns and habitat associations of sandelia bainsii (T eleostei: A nabantidae), a highly threatened narrow-range endemic freshwater fish. J. Fish. Biol. 98 (1), 292–303. doi:10.1111/jfb.14580
Sólmundsson, J., Jónsdóttir, I. G., Ragnarsson, S. Á., and Björnsson, B. (2018). Connectivity among offshore feeding areas and nearshore spawning grounds; implications for management of migratory fish. ICES J. Mar. Sci. 75 (1), 148–157. doi:10.1093/icesjms/fsx103
Song, K., Yan, F., Ding, T., Gao, L., and Lu, S. (2020). A steel property optimization model based on the XGBoost algorithm and improved PSO. Comput. Mater. Sci. 174, 109472. doi:10.1016/j.commatsci.2019.109472
Venard, J. A., and Scarnecchia, D. L. (2005). Seasonally dependent movement of lake trout between two northern Idaho lakes. North Am. J. Fish. Manag. 25 (2), 635–639. doi:10.1577/m04-025.1
Villa, P., Bresciani, M., Braga, F., and Bolpagni, R. (2014). Comparative assessment of broadband vegetation indices over aquatic vegetation. IEEE J. Sel. Top. Appl. Earth Obs. Remote Sens. 7 (7), 3117–3127. doi:10.1109/jstars.2014.2315718
Wang, J., Zhang, Y., Yang, F., Cao, X., Bai, Z., Zhu, J., et al. (2015). Spatial and temporal variations of chlorophyll-a concentration from 2009 to 2012 in Poyang Lake, China. Environ. Earth Sci. 73 (8), 4063–4075. doi:10.1007/s12665-014-3691-x
Weijerman, M., Grüss, A., Dove, D., Asher, J., Williams, I., Kelley, C., et al. (2019). Shining a light on the composition and distribution patterns of mesophotic and subphotic fish communities in Hawai ‘i. Mar. Ecol. Prog. Ser. 630, 161–182. doi:10.3354/meps13135
Wu, G., Cui, L., He, J., Duan, H., Fei, T., and Liu, Y. (2013). Comparison of MODIS-based models for retrieving suspended particulate matter concentrations in Poyang Lake, China. Int. J. Appl. Earth Observ. Geoinf. 24, 63–72. doi:10.1016/j.jag.2013.03.001
Zadereev, E., Lipka, O., Karimov, B., Krylenko, M., Elias, V., Pinto, I. S., et al. (2020). Overview of past, current, and future ecosystem and biodiversity trends of inland saline lakes of Europe and Central Asia. Inland waters 10 (4), 438–452. doi:10.1080/20442041.2020.1772034
Keywords: fishery resource, lake fish, machine learning, model, Poyang Lake, remote sensing
Citation: Chen T, Song C, Fan C, Gao X, Liu K, Li Z, Cheng J and Zhan P (2022) Remote sensing modeling of environmental influences on lake fish resources by machine learning: A practice in the largest freshwater lake of China. Front. Environ. Sci. 10:944319. doi: 10.3389/fenvs.2022.944319
Received: 15 May 2022; Accepted: 08 July 2022;
Published: 17 August 2022.
Edited by:
Maged Marghany, Syiah Kuala University, IndonesiaReviewed by:
Mohamad Awad, National Council for Scientific Research, LebanonCopyright © 2022 Chen, Song, Fan, Gao, Liu, Li, Cheng and Zhan. This is an open-access article distributed under the terms of the Creative Commons Attribution License (CC BY). The use, distribution or reproduction in other forums is permitted, provided the original author(s) and the copyright owner(s) are credited and that the original publication in this journal is cited, in accordance with accepted academic practice. No use, distribution or reproduction is permitted which does not comply with these terms.
*Correspondence: Chunqiao Song, Y3Fzb25nQG5pZ2xhcy5hYy5jbg==
Disclaimer: All claims expressed in this article are solely those of the authors and do not necessarily represent those of their affiliated organizations, or those of the publisher, the editors and the reviewers. Any product that may be evaluated in this article or claim that may be made by its manufacturer is not guaranteed or endorsed by the publisher.
Research integrity at Frontiers
Learn more about the work of our research integrity team to safeguard the quality of each article we publish.