 Yue Pan
 Yan Chen
 Yue Liu
94% of researchers rate our articles as excellent or good
Learn more about the work of our research integrity team to safeguard the quality of each article we publish.
Find out more
ORIGINAL RESEARCH article
Front. Environ. Sci. , 18 October 2022
Sec. Environmental Economics and Management
Volume 10 - 2022 | https://doi.org/10.3389/fenvs.2022.944075
With the intensification of human activities, the vulnerability of water, energy, food and ecology systems has become more and more prominent, and the research on the vulnerability of the water-energy-food-ecology (WEFE) nexus is significant to realizing regional sustainable development. This study aims to make a comprehensive measurement of the vulnerability of the WEFE nexus in the Yangtze River Economic Belt (YREB) from 2008 to 2019, clarify the evolutionary trend of its vulnerability, and predict the vulnerability of each province (municipality) in the future, to formulate policies to reduce vulnerability. This study firstly constructs a vulnerability evaluation index system of the WEFE nexus based on the VSD framework and uses the neighborhood rough set (NRS) to reduce the attributes. Then, the TOPSIS model is used to evaluate the vulnerability of the WEFE nexus. Finally, by comparing the training accuracy of the random forest, decision tree and support vector machine (SVM) model, the SVM model is selected to predict the vulnerability of the WEFE nexus under different scenarios in 2025. The results show that the vulnerability of the WEFE nexus in the YREB showed a fluctuating downward trend from 2008 to 2019. The decline is faster in the middle and upper reaches, and slower in the lower reaches. In 2025, under a strong resource management scenario, the vulnerability of the provinces (municipalities) in the YREB will decrease significantly, while the weak and moderate resource management scenarios are not conducive to reducing vulnerability and even worsening. Therefore, in the future, the provinces (municipalities) in the upper, middle and lower reaches should make reasonable use of the resource endowments, take measurements actively according to local conditions, and continuously strengthen the management of water, energy, food and ecological resources, thus promoting the continuous improvement of the vulnerability of the WEFE nexus.
The YREB covers 11 provinces (municipalities), including Shanghai, Jiangsu, Zhejiang, Anhui, Jiangxi, Hubei, Hunan, Chongqing, Sichuan, Guizhou, and Yunnan, with an area of about 2.05 million square kilometers, and both proportions of population and GDP account for more than 40% of China (Figure 1). It is one of the regions with the strongest comprehensive strength (He et al., 2019). However, with the continuous advancement of industrialization and urbanization and the rapid development of the social economy in recent years, the YREB is also facing the problems of unreasonable water resources development and utilization, unbalanced water resources supply and demand, and increasingly severe resource-based water shortage (Kong et al., 2021). Besides, high energy-consuming industries such as the chemical industry are gathered along the Yangtze River, and the total energy consumption accounts for about 36.8% of the country. However, there is a relative shortage of energy resources, and the primary energy self-sufficiency rate is only about 50% (Chen and Xu, 2021), which leads to a high degree of energy dependence on foreign countries. In terms of food, as the population pressure continues to increase, problems such as the tight balance between food supply and demand, prominent structural contradictions, and lower food production capacity continue to emerge (Hu et al., 2019). In ecology, affected by topography, soil, precipitation and other factors, soil erosion and rocky desertification are serious, and nearly 30% of important lakes and reservoirs are eutrophication. In general, the water, energy, food and ecology systems of the YREB have characteristics of vulnerability. Actually, water, energy, food, and ecology systems are not independent of each other, and there is always a complex relationship among them that is interconnected, mutually reinforcing, and mutually constraining. Excessive focus on one system can easily lead to the other systems being affected. Therefore, it is necessary to synergize the four systems to study the WEFE nexus better. In 2020, the Chinese president pointed out that the development of the YREB requires taking into account the connection of various aspects such as water ecology and water culture, optimizing the industrial layout, and strengthening the work of protecting and restoring the ecological and environmental systems. It is also necessary to pay great attention to the issue of food security. Therefore, how to comprehensively measure the vulnerability of the WEFE nexus, clarify the evolution trend of the vulnerability, and predict the vulnerability in the future to formulate targeted policy planning has become crucial to reducing the vulnerability of the WEFE nexus.
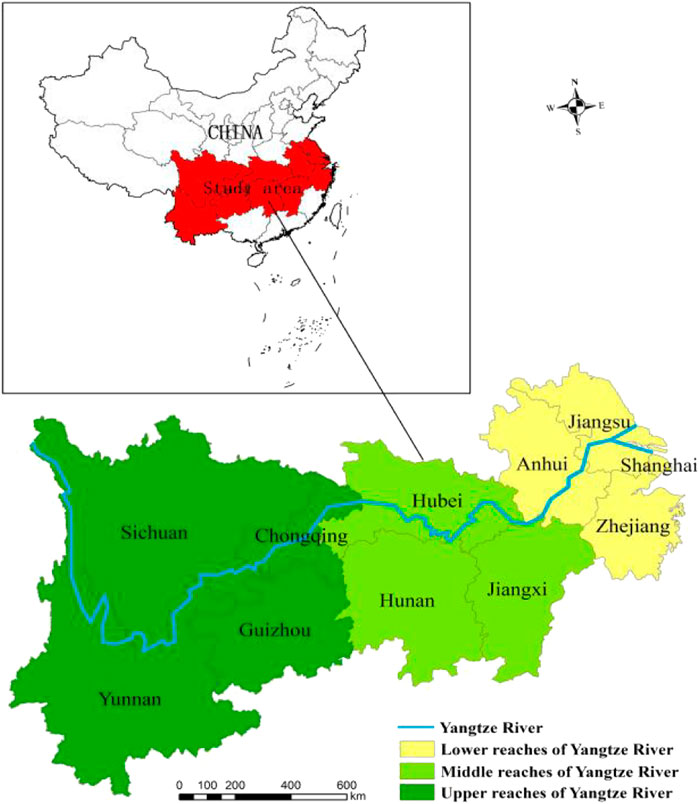
FIGURE 1. Geographic location map of the YRER.
To solve the above problems, this study used scientific research methods to carry out the study: 1) construct the vulnerability evaluation index system of the WEFE nexus in the YREB based on the VSD framework and use neighborhood rough sets for attribute simplification to eliminate redundant indexes and reduce the repetition between index information. 2) use the TOPSIS model to quantitatively evaluate the vulnerability of the WEFE nexus in the YREB from 2008 to 2019. 3) use the Support vector machine model to predict the vulnerability of the WEFE nexus in all provinces (municipalities) in 2025 under different scenarios. For the first time, this paper proposes to study on the vulnerability of the WEFE from the perspective of a complex system, which is innovative and helpful in understanding the changing trends of the vulnerability. Additionally, it can fill the gap in the field of vulnerability research in the YREB and broaden the current research perspectives of the WEFE nexus. Moreover, combining national policy planning to project the vulnerability of the WEFE nexus in each province (municipality) in 2025 under different scenarios will help formulate strategic plans for water, energy, food and ecology.
As the essential consumables in regional development, water, energy and food resources are the primary resources for human survival and development and the key to national economic development. In 2011, the Bonn Conference in Germany put forward the concept of the “water-energy-food (WEF)” nexus for the first time, which clarified the relationship between water, energy and food systems (Zhi et al., 2020). Subsequently, the WEF nexus has gradually become a research hotspot. Currently, scholars have carried out research on the coupled and coordinated development relationship of the WEF nexus (Xu et al., 2019), the sustainable development of resources (Nhamo et al., 2018) and the impact on regional economic development (Xu et al., 2021) at the national (White et al., 2018), regional (Markantonis et al., 2019), household (Gao et al., 2022) and other levels. There is a complex relationship between water, energy and food that interacts, constrains and promotes each other. For example, the development and utilization of water resources, the growth and transformation of food and other processes require the consumption of large amounts of energy. The cooling of thermal power and the growth of food are inseparable from the support of water resources. However, these processes are often also closely associated with the ecology system. The rapid development of industries such as steel and paper under increasing human activities and the massive production and consumption of water and energy causes atmospheric pollution (Mele and Magazzino, 2020; Udemba et al., 2020; Gu and Xie, 2022), affects food production, and puts pressure on the ecology system, reducing the self-regulate and self-heal ability, increasing the vulnerability, and in turn affecting the availability of resources (Wang et al., 2021a). The United Nations Economic Commission for Europe (UNECE) notes that the resources and services provided by ecology are essential to the security of the WEF nexus and the basis for achieving sustainable regional development (Wang et al., 2022). It is related to many SDG15 targets (Reyers and Selig, 2020), such as SDG15.1 (protection, restoration, and sustainable use of terrestrial and inland freshwater ecosystems and their services), SDG15.4 (protection of mountain ecosystems, including biodiversity). Therefore, it is necessary to take the ecology system as a core element and incorporate it into the WEF nexus (Ding and Chen, 2021). Only by studying water, energy, food, and ecology as a whole and reducing the vulnerability of the WEFE nexus can be more conducive to realizing sustainable regional development. However, most existing studies focus on the core relationship between water, energy and food systems. Although some scholars have added climate (Ioannou and Laspidou, 2022), land and other aspects to conduct more in-depth research, there are still fewer studies that integrate the ecology system into the WEF nexus, and they are focused on developing countries with unstable social development, scarce natural resources, weak sustainable development concepts and poor ecological environment (Shi et al., 2020). It is mainly because modeling the WEFE nexus faces the challenge of reducing multidimensional and interdependent uncertainties. At present, studies on the WEFE nexus mainly discuss water scarcity (Fasel et al., 2016), resource sector management strategies (Howells et al., 2013), water consumption in each sector (Karabulut et al., 2015), and the service value of “WEF” to social economy and natural ecology and the service value of the nexus (Sun and Xie, 2022) from the perspectives of coupling and coordination (Wang et al., 2021b) and synergistic management (Ma et al., 2021). The research method of WEFE nexus has changed from only considering the relationship between binary elements to considering the relationship between multiple elements, from statistical analysis of a single change process to modeling coupled with natural processes and human regulation (Wang et al., 2021a).
Vulnerability is a comprehensive concept including related concepts such as risk, sensitivity, adaptability, and resilience and is also an inherent property of complex systems (Yang et al., 2019). It has been included in the research agenda of IPCC and has become a research hotspot in sustainable development, global environmental status and development trends. The vulnerability was first defined by White (1974) in 1974 as “vulnerability is the exposure and sensitivity of a system and its components in the face of external pressures.” In fact, scholars in different fields have different understandings of the concept and connotation of vulnerability. The connotation of vulnerability contains four main aspects: 1) vulnerability is expressed as a combination of internal and external effects of the system, and there are interactions between internal and external elements of the system. 2) the system shows different vulnerabilities under different perturbation situations. 3) the instability within the system can cause losses and injuries when subjected to perturbations. 4) the system is sensitive to external disturbances and influences (Yang et al., 2019). Based on the definition of vulnerability, this study believes that the unbalanced development of the internal system and the disturbance of the external environment, such as human activities and natural conditions, caused the vulnerability of the WEFE nexus. Then, the system’s structure, state, and function tend to change toward imbalance and present an unstable state. Now, researches on the vulnerability of the WEFE nexus are still mainly focused on subsystems, and most of them start from the perspectives of climate change (Xie et al., 2014; Song et al., 2021), resource production (Yao et al., 2019) and supply (Wang, 2017), and resource optimization and regulation (Zhou et al., 2019). These studies are essential for the sustainable use of individual resources, but studying only the vulnerability of individual systems will ignore the correlation between water, energy, food and ecology systems, which is not conducive to integrated regulation. These studies are essential to the sustainable use of individual resources but may ignore the relationship between water, energy, food and ecology systems. Currently, only few scholars have focused on this problem and begun to investigate the vulnerability of the WEF nexus from the nexus perspective (Chen et al., 2018a).
Based on the above analysis, it is evident that research outcomes of the WEFE nexus are gradually increasing as the idea of sustainable development gains prominence and the ecology system steadily develops into a research hotspot. The WEFE nexus has now become a theory and tool to alleviate the regional WEFE tension (Bleischwitz et al., 2018). However, from the perspective of research, most existing studies focus on exploring the coupled and coordinated development relationship and interactive response relationship among water, energy, food and ecology system or discussing water shortage and water consumption from the perspective of the WEFE nexus. Besides, there is a relative lack of studies that explore the vulnerability change trend of WEFE nexus from the perspective of the complex system rather than individual subsystem. In terms of research methods, coupled coordination degree models are mostly used to measure the degree of coordination between systems, while insufficient attention has been paid to studies on non-coupled calculations, such as vulnerability. In addition, existing studies mainly focus on the current situation of the WEFE nexus in the study area, with fewer predictions of future conditions, which is not conducive to the management and regulation of water, energy, food and ecology systems. In recent years, with the development of the economy and the advancement of science and technology, the demands for water, energy and food have increased quickly, and the utilization methods have become more and more complex, which leads to high pressure on the ecology system. So, it is even more necessary to evaluate and predict the vulnerability of the WEFE nexus.
As shown in Figure 2, this study mainly includes the following four steps: the first step constructed the vulnerability evaluation index system of the WEFE nexus based on the VSD framework. The second step used the NRS to reduce the attributes and eliminate the redundancy indicators. The third step used the TOPSIS model to evaluate the vulnerability of the WEFE nexus. The fourth step compared the training accuracy of random forest, decision tree and SVM, then built a vulnerability prediction model of WEFE nexus to make scenario predictions.
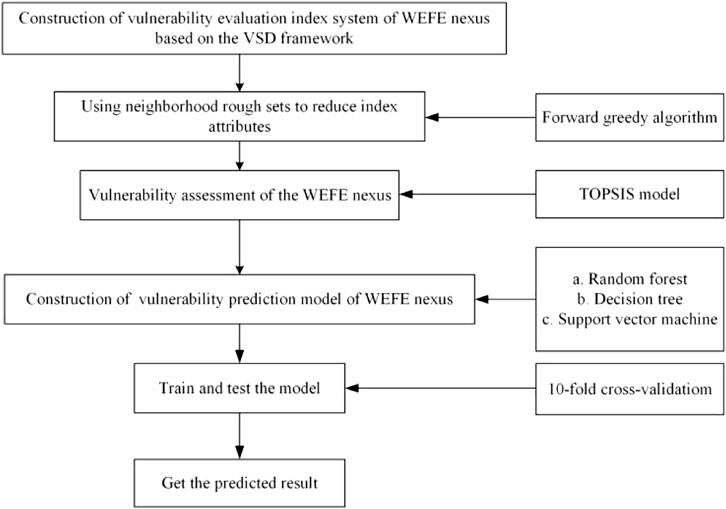
FIGURE 2. Flow chart of vulnerability assessment and prediction of WEFE nexus.
Polsky et al. (2007) decomposed system vulnerability into three elements of system exposure, sensitivity and adaptive capacity, and proposed the vulnerability scoping diagram (VSD) framework, which provides a comprehensive idea of quantitative vulnerability evaluation through a clear connotation of vulnerability and the construction method of indicator system (Yao et al., 2019). Exposure refers to how the system is affected by unbalanced internal development and external conditions such as the natural environment. Sensitivity refers to how the system’s structure, state, and function are affected. Adaptability refers to the self-recovery ability of the system. The VSD framework has been widely used in the vulnerability assessment of complex systems such as water, food, ecology, and social-ecology systems. Under the guidance of scientificity, systematization and practicability principles, the vulnerability evaluation index system of the WEFE nexus is constructed, which is shown in Table 1. When the value of the positive index is larger and the negative index is smaller, the WEFE nexus of the YREB is more vulnerable.
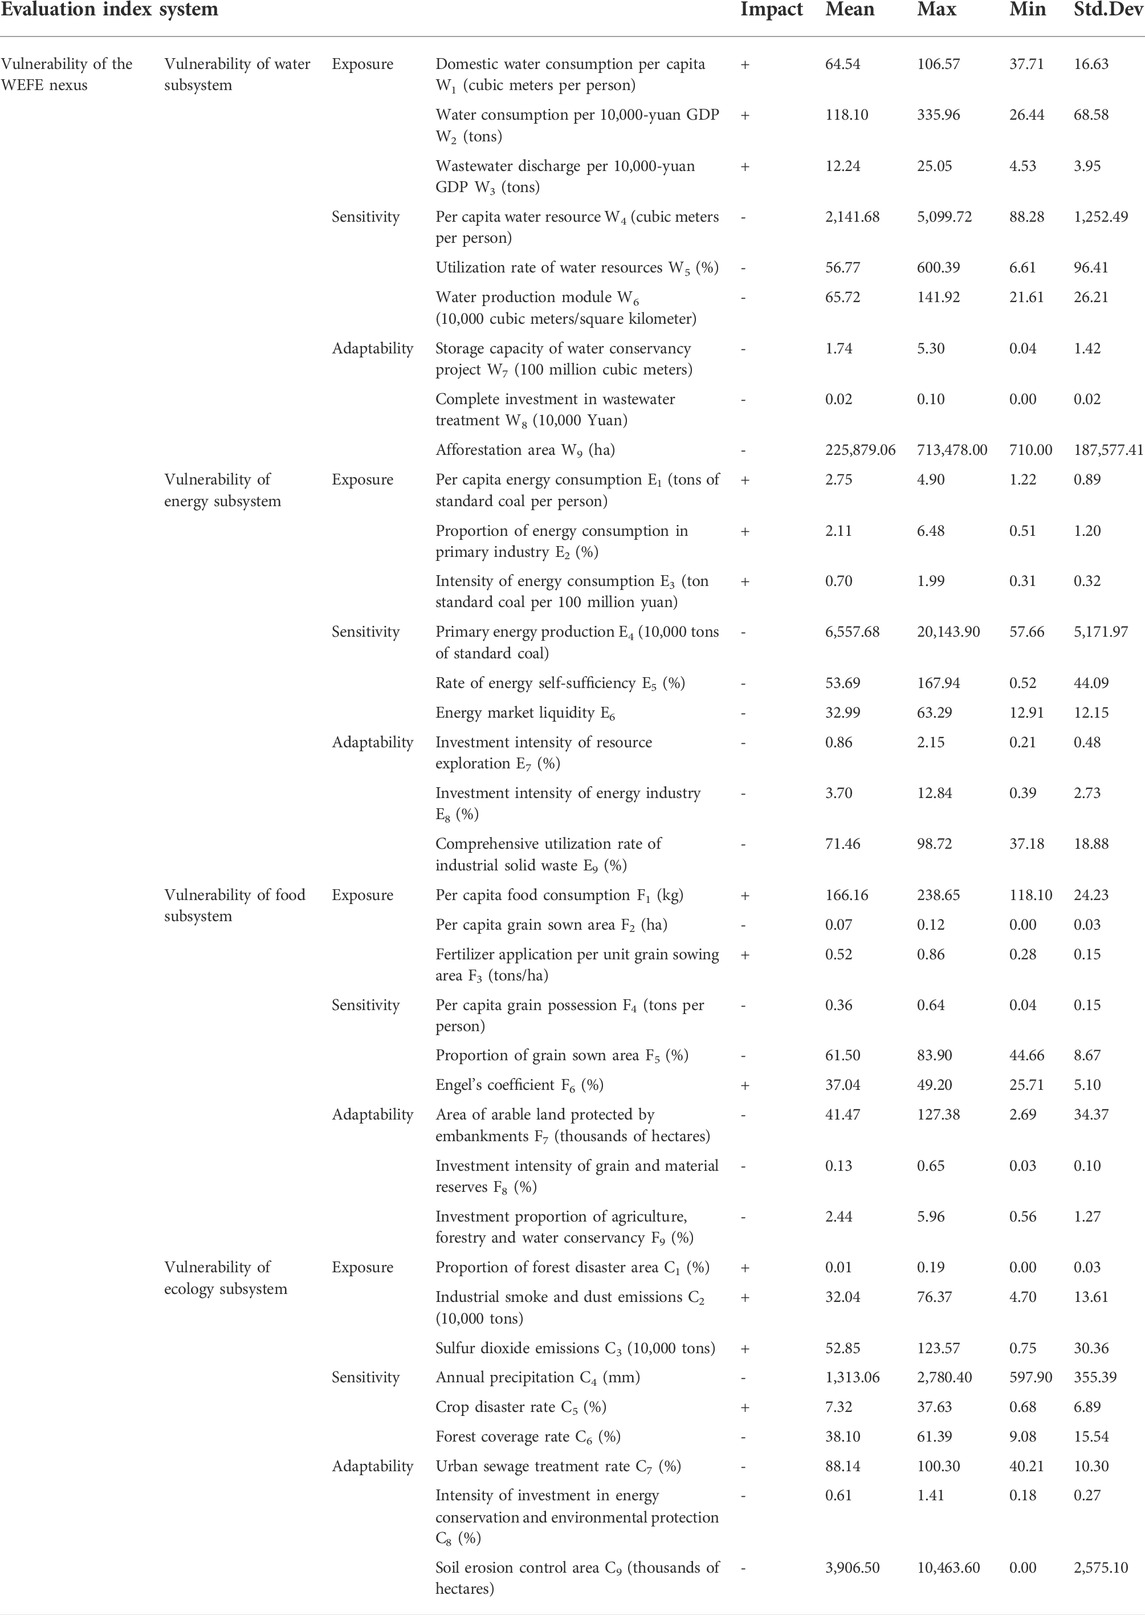
TABLE 1. Vulnerability evaluation index system of WEFE nexus.
From the process of establishing the vulnerability evaluation index system of the water-energy-food-ecology nexus, it can be seen that there are many influencing factors, and there may be redundancy and duplication among some indexes, which may impact the results of vulnerability assessments and predictions of water-energy-food-ecology nexus. Therefore, suitable methods need to be selected to eliminate the influence of indexes as much as possible. The rough set theory was initially proposed by Pawlakab (1997). It takes knowledge reduction as the core and can effectively remove redundant attributes. Recently, it has been applied to the water resource vulnerability assessment (Chen et al., 2018b). Since classical rough sets are limited to discrete data, Hu et al. (2008) introduced the neighborhood model into rough sets. Compared with the classical rough set, the neighborhood rough set does not need to discretize the index data, which can preserve the original attributes of the data and reduce the difficulty of prediction. The following are some basic definitions of neighborhood rough sets (Liu and Wang, 2021):
Definition 1. For any set
In the formula,
Definition 2.
Definition 3. A non-empty finite set
Definition 4. The neighborhood decision table is mainly described by the basic attributes of objects and their attribute values. A neighborhood decision table can be expressed as:
Definition 5. In the neighborhood decision table, let
Definition 6. The dependence of decision attribute
Definition 7. Given the neighborhood decision table
When
In this study, the forward greedy algorithm is proposed to reduce the index set of the WEFE nexus. The forward greedy algorithm is shown in Figure 3. The specific steps are as follows (An and Suo, 2016):
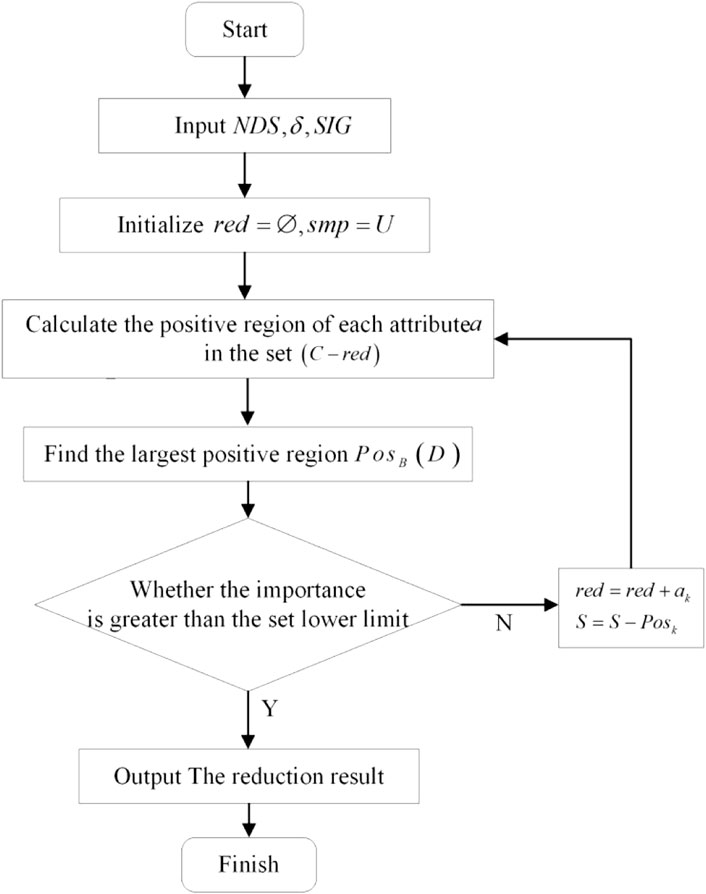
FIGURE 3. Forward greedy reduction algorithm.
Step 1: Input decision system
Step 2: Initialize the reduction set
Step 3: Calculate the positive field of the remaining attributes outside the reduction set, and find the largest positive field.
Step 4: Calculate the dependency and importance through the positive field, and judge whether it is greater than the given lower importance limit. If so, output the result. Otherwise, go back to step3.
TOPSIS is a commonly used finite-scheme multi-attribute decision method, which has been widely used in research on the security (Gu et al., 2022) and sustainable development (Qian and Liang, 2021) of the water-energy-food nexus. Its basic principle is to find and use the optimal index data and the worst index data as the positive and negative ideal solutions in alternative schemes. The quality of the evaluated scheme can be judged by comparing the distance between the scheme points and the positive and negative ideal points.
In this study, relative closeness is used to represent the vulnerability of the WEFE nexus in the provinces (municipalities) of the YREB. The greater the relative closeness, the higher the vulnerability of the WEFE nexus. The weights
The support vector machine was first proposed in 1995. It can be used for nonlinear and high-dimensional problem analysis when the sample data is small. Support vector machine regression is a branch of support vector machine, which has excellent learning performance and good generalization ability and has been widely used in system identification, vulnerability assessments (Duan et al., 2022) and prediction (Chen and Feng, 2020) in recent years. Therefore, it is also suitable for predicting the vulnerability of the WEFE nexus. The basic idea is to convert the function of low-dimensional space into high-dimensional linear mapping through nonlinear mapping to solve the problem that linear regression cannot be used in low-dimensional space (Jin and Li, 2022). Specifically as follows:
Given a training dataset
In the formula,
According to the principle of structural risk minimization, the original problem can be transformed into finding the minimum value under constraints:
In the formula,
Use the Lagrangian method to solve the above optimization problem, and the formula is as follows:
In the formula,
The above formula is introduced into the dual problem to solve, and finally, the regression function of SVM is obtained:
Most of the data in this study were obtained from the China Statistical Yearbook, China Energy Statistical Yearbook, China Environment Statistical Yearbook, China Soil and Water Conservation Bulletin, and statistical yearbooks of provinces (municipalities) from 2009 to 2020 where missing data were filled by interpolation method of adjacent years.
From the evaluation index system, it can be seen that many factors influence the vulnerability of the WEFE nexus, and there may be redundancy and duplication among some indicators. Therefore, this study first conducted the Pearson correlation analysis of the indexes and plotted the correlation coefficients of the indexes (Figure 4). The figure shows a greater correlation among the indexes of water, energy, food, and ecology system, and the overlapping information may impact the prediction results of the vulnerability of the WEFE nexus. Therefore, this study intends to use neighborhood rough sets to simplify the original index system, which will be more helpful for the subsequent evaluation and prediction.
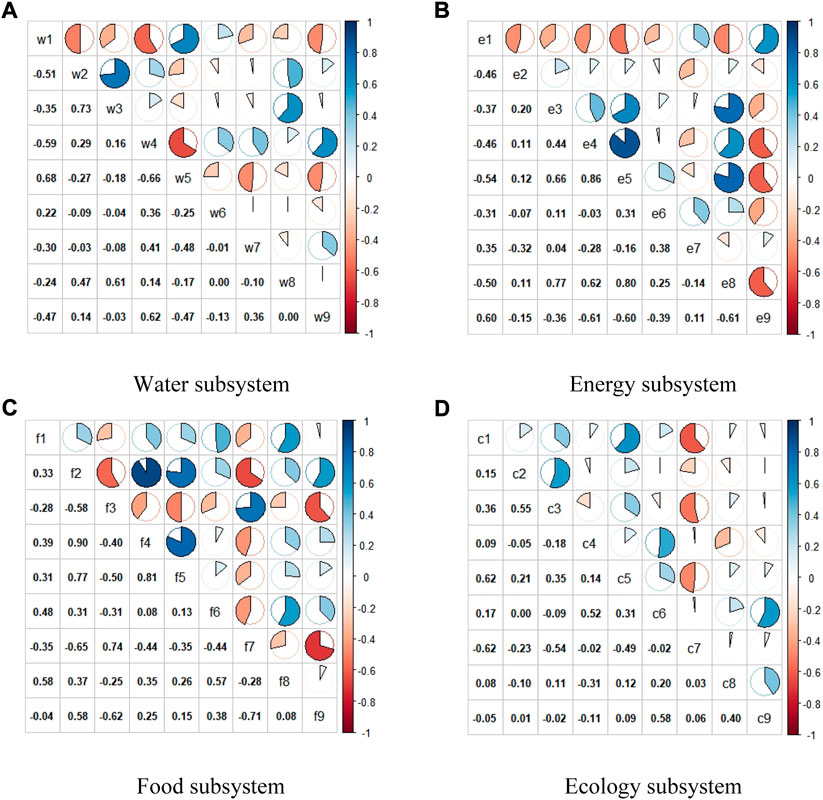
FIGURE 4. Correlation coefficient diagram of the index system: (A) Water subsystem; (B) Energy subsystem; (C) Food subsystem; (D) Ecology subsystem.
When using the neighborhood rough set to reduce the evaluation index system, both the condition and decision attributes are needed. In order to ensure the consistency of the method, this study plans to use the TOPSIS model to calculate the comprehensive value of the vulnerability of the WEFE nexus and use it as a decision-making attribute. In addition, the decision attribute corresponding to the decision table needs to be the data after discretization. The commonly used discretization methods include the equal frequency discretization method, the equal distance discretization method, and the quantile discretization method. This study intends to use the K-means clustering discretization method to discretize the comprehensive value. It is an unsupervised discretization method with a simple algorithm principle and fast convergence. It can also overcome the shortcomings of the equidistant method and the equifrequency method that cannot take the data characteristics into account.
According to the result of discretization, the minimum reduction of the original decision table is obtained by using the forward greedy algorithm and after many debugging of the parameters. Among them, the reduction set of the water resources subsystem is
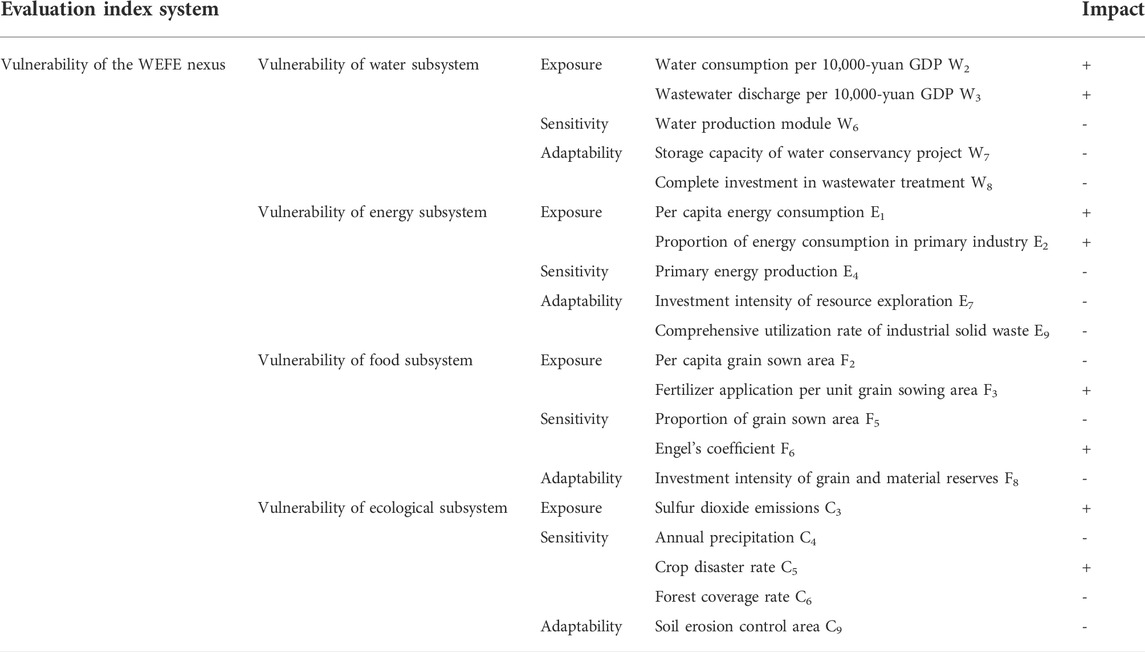
TABLE 2. Index system after attribute reduction.
According to the above formula, the vulnerability assessment results of the WEFE nexus and subsystems in the YREB from 2008 to 2019 were calculated. It can be seen from Figure 5. That the vulnerability of the WEFE nexus in the provinces (municipalities) of the YRER shows a fluctuating downward trend. In terms of average value, the average vulnerability value of the WEFE nexus in the YREB dropped from 0.5460 in 2008 to 0.4826 in 2019, a slow decline of about 11.63%, showing a generally good development trend. The vulnerability of Jiangsu and Shanghai provinces (municipalities) in the upstream region is generally higher, while the vulnerability of Guizhou and Yunnan in the downstream region is relatively low. Among them, the vulnerability of the WEFE nexus in Guizhou Province showed a rapid downward trend, from 0.5825 in 2008 to 0.4586 in 2019, with a decrease of about 21.3%, followed by Hubei, Yunnan, Jiangxi, and Hunan provinces. The vulnerability of these four provinces has dropped from 0.5816, 0.5531, 0.5342, 0.5719 to 0.4694, 0.4774, 0.4781, and 0.5004, respectively, with a decrease of 18.89%, 16.91%, 14.77%, and 13.06%. However, the three provinces (municipalities) of Shanghai, Anhui, and Jiangsu, located in the lower reaches, have a decline of only 7.34%, 4.30%, and 4.65%. From 2008 to 2019, it can be seen that the provinces (municipalities) where the vulnerability of the WEFE nexus declined rapidly were mostly concentrated in the middle and upper reaches of the Yangtze River, while the lower reaches were relatively slow. It may be due to unbalanced socio-economic development and uneven distribution of resources.
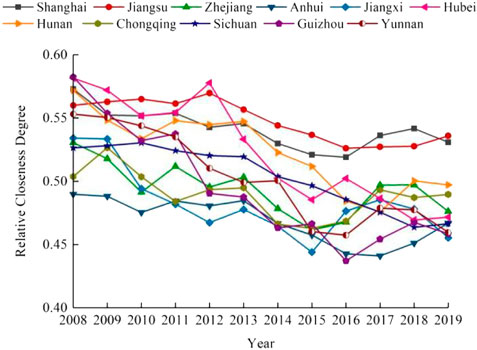
FIGURE 5. Results of vulnerability assessment of WEFE nexus.
In terms of water resources, the upper reaches of the Yangtze River are dominated by plateaus and mountainous terrains, with relatively backward socio-economic development and less water consumption. The industrial and agricultural water consumption in the middle reaches is large, and the chemical industries are concentrated along the river. As a result, the discharge of industrial sewage and wastewater destroys the stability of the water environment. The downstream area is economically developed and greatly demands water resources. Especially in Jiangsu Province, water resources have been over-exploited in recent years, and the per capita water resources are less than 600 m3, resulting in excessive pressure on water resources in Jiangsu Province. In terms of energy, the energy self-sufficiency rate of Jiangsu and Zhejiang provinces in 2019 was only 10%, unlike the energy-rich middle and upper reaches. However, the economic development of these two provinces needs to consume much energy, resulting in a high overall dependence on external energy. Hubei and Hunan Provinces, located in the middle reaches, are the primary agricultural provinces in China. However, the proportion of energy consumption in the primary industry far exceeds that in other provinces, indicating that the energy efficiency in food production and processing still needs to be improved. In terms of food, the middle and upper reaches of the region are rich in cultivated land resources, but the application of pesticides and chemical fertilizers will increase soil erosion, resulting in a decline in the quality of cultivated land and affecting food production. Shanghai, Zhejiang and other provinces (municipalities) located in the lower reaches have excellent natural conditions and advanced agricultural production technology. However, the rapid development of urbanization and industrialization will also lead to changes in the scale and structure of the labor force, causing construction land to occupy a large area of arable land and reducing the advantages of grain production. In terms of ecology, Guizhou, Sichuan, Jiangxi, Yunnan, and other provinces have strictly controlled the emission standards of industrial and agricultural pollutants in recent years, increased investment in ecological protection measures, and promoted afforestation. In 2019, the average forest coverage rate of the provinces (municipalities) in the YREB was 44.93%, about double the national average. Among them, Jiangxi, Yunnan, Zhejiang, Guizhou, Hunan and Chongqing ranked in the top 6, and the forest coverage rates were higher than 50%. However, in Shanghai and Jiangsu, located in the lower reaches, the forest coverage rate is only 14.04% and 15.2%, indicating that the ecological balance of Shanghai and Jiangsu still needs to be strengthened.
This study uses R language’s support vector machine toolkit (e1701) to build the training model. The index data reduced by the neighborhood rough set is normalized as the input data of the training model, and the vulnerability value is used as the output data. Then, the training accuracy of the random forest and decision tree models is compared. In addition, to test the reliability of the training results, this study uses 10-fold cross-validation to test the accuracy of the model. That means divide the sample set into 10 randomly, and take turns to take nine of them as the training set and 1 as the test set, then each sample can be a test set. Subsequently, the mean squared error (
Among them,
As seen in Table 3, the support vector machine model has lower
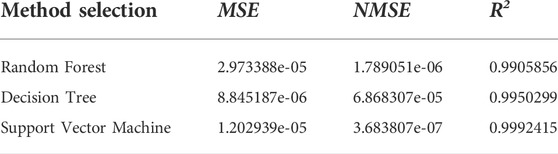
TABLE 3. Comparison of MSE, NMSE and R2 of Random Forest, Decision Tree and Support Vector Machine models.
By evaluating the vulnerability of the WEFE nexus in the YREB from 2008 to 2019, it can be seen that the vulnerability generally shows an improving trend. With the intensification of human production activities, human demand for various resources has increased sharply, and the pressure on water, energy, food and ecological resources will inevitably increase in the future. Therefore, this study takes 2019 as the base year and 2025 as the scenario year and sets three scenarios under different management strengths. Among them, scenario 1 is weak resource management. Under the scenario, the socio-economic development is slow, and the ecological environment is severely damaged, together with higher pressure on food. Besides, the utilization rate of water, energy and other resources is low, even lower than the base year level. Scenario 2 is moderate resource management. Under the scenario, the social economy is developing steadily, and the utilization rate of various resources has been improved to a certain extent compared with scenario 1, but it is still lower than that in scenario 3. Scenario 3 is strong resource management. Under the scenario, technological capabilities are rapidly improving. The utilization rate of resources is maximized, and the ecological environment governance has achieved remarkable results. All indexes have reached or even exceeded the target value. When setting the scenario data, this study comprehensively considers the level of regional social and economic development, the ability of regional scientific and technological innovation, and the target planning of policy documents such as the Opinions of the State Council on Implementing the Strictest Water Resources Management System and the 14th Five-Year Plan for Energy Development. For example, set the scenario data of the forest coverage rate in Jiangsu province in 2025 according to the “14th Five-Year Plan for National Economic and Social Development of Jiangsu Province”. For other indexes which cannot be directly determined from policy documents, the optimal value, average value and worst value of the index data of the corresponding provinces (municipalities) from 2008 to 2019 are used as the scenario data under the strong, medium and weak scenarios of resource management in 2025.
After normalizing the index data under the three different scenarios and inputting it into the trained SVM prediction model, the prediction results of the vulnerability of the WEFE nexus in the provinces (municipalities) of the YREB under different scenarios are obtained. The results are shown in Table 4. To better explore the changing trend and degree of the vulnerability of the WEFE nexus in the provinces (municipalities) in the YREB, the rate of change in the vulnerability value of the WEFE nexus in the forecast year compared with the base year was calculated, as shown in Table 5.

TABLE 4. Vulnerability values of WEFE nexus under each scenario in 2025.
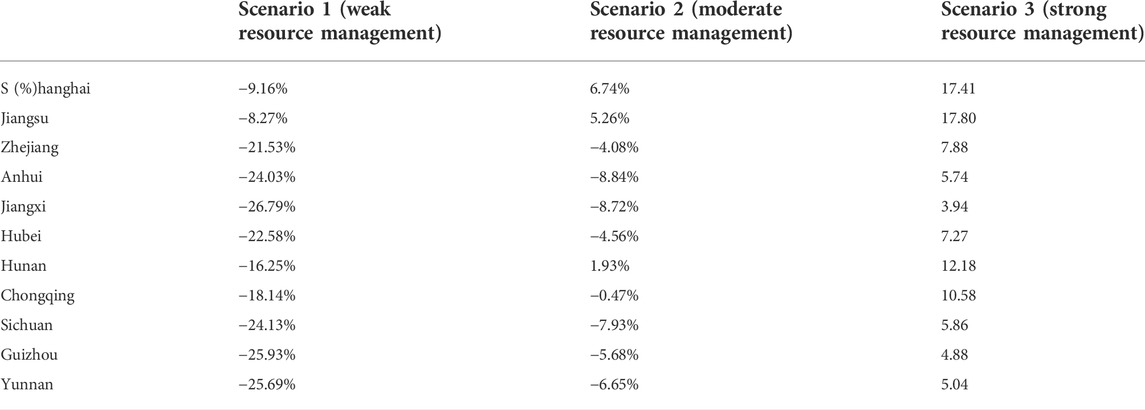
TABLE 5. Change rate of vulnerability value of WEFE nexus in each province under different scenarios.
It can be seen from the research results that, compared with the base year, the vulnerability values of the WEFE nexus in all provinces (municipalities) of the YREB have increased to varying degrees in 2025 under scenario 1 with a mean increase of 20.23%. Among them, Shanghai and Jiangsu provinces (municipalities), located in the lower reaches, have a relatively small increase, neither exceeding 10%. The three provinces of Jiangxi, Guizhou, and Yunnan have the most apparent increases in vulnerability, which are 26.79%, 25.93%, and 25.69%, respectively, indicating that weak resource management will lead to further deterioration of the vulnerability of the WEFE nexus. When a moderate resource management intensity is adopted, that is, in the case of scenario 2, except for Shanghai, Jiangsu, and Hunan, the vulnerability of the WEFE nexus in other provinces (municipalities) is still in a state of a slight deterioration. However, compared with scenario 1, there has been a clear improvement trend. Especially in Guizhou province, it has decreased by about 20.25%, followed by Yunnan and Hunan provinces, with decreases of 19.04% and 18.18%. In the case of scenario 3, the vulnerability of the WEFE nexus in all provinces (municipalities) is in good development and shows an improvement trend. The mean values of the decline in the upper, middle and lower reaches are 6.59%, 7.80% and 12.21%. Among them, the vulnerability value of Jiangsu, Shanghai and Hunan provinces (municipalities) decreased from 0.5308, 0.5359, and 0.4972 in 2019 to 0.4384, 0.4406, and 0.4366 in 2025, a decrease of 17.8%, 17.41% and 12.18%, ranking the top three. It means that strong resource management has a significant effect on reducing the vulnerability of the WEFE nexus.
From the results of the three scenarios, it can be seen that under the scenario of strong resource management, the vulnerability of the WEFE nexus in each province (municipality) has apparent changes and a significant decline, indicating that scenario 3 can effectively reverse the trend of worsening vulnerability of WEFE nexus. However, the vulnerability of the WEFE nexus is still not optimistic and even deteriorated under weak and moderate management scenarios. This suggests that provinces (municipalities) in the YREB should take advantage of the characteristics of their resource endowments in their future economic and social development, and take suitable measures to continuously strengthen the management intensity of water, energy, food and ecological resources. For example, in Jiangsu, Shanghai and other regions with relatively high levels of economic development but high water stress, the scale of water-intensive industries should be strictly controlled to improve water use efficiency further. At the same time, encourage scientific and technological innovation and industrial upgrading, and vigorously develop industries with low energy consumption and high efficiency. Areas with abundant arable land resources, such as Hubei and Hunan, should strictly control the amount of sewage discharge and the application of pesticides and fertilizers, and improve the ability to control soil erosion. For Yunnan, Sichuan, Guizhou and other regions with rich resources but relatively backward economic development levels, it can be considered to develop industries necessary for the national economic development strategy but have high demands on water resources and energy to give full play to the regional resource advantages, thereby reducing the vulnerability of the WEFE nexus.
The Yangtze River Economic Belt is a major national strategic development region in China and one of the strongest in terms of comprehensive strength. However, the continuous urbanization, industrialization and rapid population growth have put pressure on water, energy and food resources, as well as causing damage to the ecological environment. However, after the “Great Protection of Yangtze River” was proposed in 2016, the protection of the ecological environment has been highly emphasized and the efficiency of energy development and utilization has been improved (Xing et al., 2019). Nevertheless, the vulnerability value of the WEFE nexus is about 0.45 at this stage, which is still high due to the complex interactions and constraints among water, energy, food and ecology systems. Therefore, it is crucial to study the vulnerability of the WEFE nexus, explore the evolution of the vulnerability trend and forecast it to achieve sustainable development in the region.
From the evaluation results of vulnerability, although the vulnerability of the WEFE nexus in the YREB has shown a fluctuating downward trend in the past 12 years, and the WEFE nexus in all provinces (municipalities) has shown good development, there are still significant differences in the vulnerability levels in the upper, middle and lower reaches, and there is a large room for reduction. In general, the vulnerability of the middle and upper reaches of the Yangtze River decreases faster, while the lower reaches are slow, which is mainly determined by the differences in resource endowment of each province (municipality) as well as the differences in economic and technological development levels. Therefore, in response to these differences, the future development of each province (municipality) needs to strictly follow the national development planning outline, make reasonable use of their natural resources or geographical advantages, and actively take corresponding measures according to local conditions in order to reduce the degree of vulnerability of the WEFE nexus. From the predicted results of vulnerability, by comparing the vulnerability and its change rate under three different management strengths, it can be found that the scenario of stronger resource management is more beneficial in reducing the vulnerability of the WEFE nexus, especially for Jiangsu and Shanghai, where the vulnerability is still high. Therefore, each province (municipality) needs to continuously strengthen the management of water, energy, food and ecological resources, and do an excellent job of supervision and management. This will not only help ensure the sustainable use of water, energy, food and ecological resources but also promote the green and long-term development of the WEFE nexus.
For the upper reaches, although the four provinces (municipalities) of Sichuan, Yunnan, Guizhou, and Chongqing have higher levels of security in the WEF nexus (Chen and Xu, 2021), higher forest cover, better ecological development, and lower vulnerability of the WEFE nexus compared to the middle and lower reaches. In addition, influenced by factors such as geographical location, climatic conditions and resource endowment, the upper reaches are rich in hydropower, forest and mineral resources, which are important for the development of energy as well as ecology system and environmental protection in China. However, the region is facing problems such as insufficient industrial construction (Yuan et al., 2022), more backward productivity levels, and lower utilization of water resources development. In 2019, the water consumption of Yunnan and Guizhou provinces was about 66.70 m3 and 64.46 m3 of 10,000-yuan GDP, which has improved the efficiency of water consumption compared with 2008, but there is still a significant difference with Shanghai and Zhejiang. Therefore, to achieve sustainable regional development, the upper reaches must reasonably develop resources and improve the utilization rate of water resources development and energy use efficiency. Meanwhile, focus on regional environmental pollution caused by industrial wastewater and waste gas emissions, strengthen environmental protection efforts, and avoid the old path of pollution before treatment. In terms of the middle reaches, higher per capita food consumption, backward water-saving irrigation technology, and lower energy utilization have affected the coupling efficiency between systems (Qin and Tong, 2021). In addition, with the continuous adjustment of industrial structure, industries with high energy consumption in lower reaches are gradually moving to middle reaches. However, the problems of low energy use efficiency in midstream areas remain unresolved, which increases the energy subsystem’s vulnerability and puts pressure on the WEFE nexus (Heard et al., 2017). Therefore, Hunan, Hubei and other large grain provinces located in the middle reaches should continue to promote the transformation and upgrading of industrial structure, introduce advanced agricultural technology, improve water efficiency, control chemical fertilizers and pesticides, and develop a circular economy and low-carbon economy. Compared with the middle and upper reaches, the lower reaches have faster socio-economic development and more developed industry and agriculture. However, at the same time, there are problems such as more water consumption, larger industrial wastewater effluent discharge and lower per capita food sowing area. Since implementing the Yangtze River protection in 2016, Zhejiang and Anhui provinces have strictly controlled sewage and wastewater discharge, promoted the construction of ecological civilization and promoted the green development of agriculture. The study results showed that the vulnerability of the WEFE nexus in the lower reaches had been reduced, which implies a slight increase in the coupling coordination among the subsystems (Ding and Chen, 2021), indicating that the WEFE nexus is developing positively. Therefore, in future development, lower reaches should continue to take advantage of economic advantages, increase investment in agricultural innovation and technology, increase efforts in environmental protection and pollution control, and take the road of developing a circular economy.
In this study, we first established the vulnerability evaluation index system of WEFE nexus based on the VSD framework and used the forward greedy algorithm of the neighborhood rough set to reduce the attributes. Secondly, the TOPSIS model was used to evaluate the vulnerability of the WEFE nexus in the YREB. Finally, the SVM model is used to predict the vulnerability value of the WEFE nexus in the provinces (municipalities) under different scenarios in 2025. The main conclusions are as follows:
1) According to the evaluation results, from 2008 to 2019, the vulnerability of the WEFE nexus in the YREB showed a fluctuating downward trend. The mean value of the vulnerability value of the WEFE nexus decreased from 0.5460 in 2008 to 0.4826 in 2019, with a slow decline rate of about 11.63%, showing a good development trend. In terms of the situation of each province, the provinces (municipalities) whose vulnerability has declined rapidly are mostly concentrated in the middle and upper reaches, while the lower reaches are relatively slow. The vulnerability of Jiangsu and Shanghai provinces (municipalities) located in the lower reaches is generally higher, while the vulnerability of Guizhou and Yunnan in the upper reaches is relatively low. Guizhou, Hubei, Yunnan, Jiangxi, and Hunan have the most significant declines, with about 21.3%, 18.89%, 16.91%, 14.77%, and 13.06%.
2) According to the scenario prediction results, the vulnerability of the WEFE nexus in each province (municipalities) changes obviously. Among them, the vulnerability values of the WEFE nexus in Jiangsu, Shanghai and Hunan provinces (municipalities) decreased from 0.5308, 0.5359 and 0.4972 in 2019 to 0.4384, 0.4406 and 0.4366 in 2025, with a decrease of about 17.8%, 17.41% and 12.18%. In addition, other provinces also showed a downward trend. It indicates that the scenario can effectively reverse the deterioration trend of the vulnerability of the WEFE nexus. However, under weak and medium resource management, the vulnerability of the WEFE nexus is not optimistic and has even worsened. In the future, the ability to make rational use of the natural resources, take reasonable measures, and continue to strengthen the management of water, energy, food, and ecological resources is an essential factor in determining the vulnerability of the WEFE nexus can be improved.
This study has some innovations in research content and methods. First, in terms of research perspective, we pay attention to the lack of vulnerability research based on analyzing the research status of the WEFE nexus. Therefore, this study innovatively proposes studying the WEFE nexus from the vulnerability perspective. It helps to broaden the existing research perspectives of the WEFE nexus and provides new ideas for regional governance. Secondly, based on the current research results of the WEFE nexus, this study considers the complex relationship between water, energy, food and ecology system, incorporates the ecology system as the core elements into the WEF nexus, and conducts evaluation and prediction research on the vulnerability of the WEFE nexus from the perspective of the complex system rather than individual subsystem, which is conducive to the integrated regulation of water, energy, food and ecology system. Finally, in terms of research methods, this study combines two methods of neighborhood rough set and support vector machine to construct a joint vulnerability prediction model of the WEFE nexus. Using the neighborhood rough set for attribute reduction can eliminate redundant indexes and reduce the repetition and correlation between indexes. The results of the study will help to provide a comprehensive measure of the vulnerability of the WEFE nexus in the YREB, explore its vulnerability evolution trend, and clarify the overall status of the vulnerability of the WEFE nexus. In addition, by comparing the predicted values of WEFE vulnerability in each province (municipality) under three different management scenarios, the impact of different management scenarios on vulnerability can be better reflected, thus facilitating comparison and decision-making by policymakers.
The study focuses on the vulnerability assessment, and the prediction of the vulnerability of the WEFE nexus in various provinces under different scenarios, but there are also some limitations. For example, due to the data availability limitation, the research object of the study is only 11 provinces (municipalities) in the YREB. In fact, changes in how urban resources are used can also impact the vulnerability of the WEFE nexus. In the future, based on the support of more data, it will be further refined to the city level. In addition, changes in external factors such as climate and land use will also affect the vulnerability of the WEFE nexus, and these factors will be further discussed in the future.
The original contributions presented in the study are included in the article/supplementary material, further inquiries can be directed to the corresponding author.
All authors listed have made a substantial, direct, and intellectual contribution to the work and approved it for publication.
The study was supported by the National Social Science Fund of China (No. 21BGL181), Humanities and Social Science Foundation of the Chinese Ministry of Education (No. 20YJA630006) and Postgraduate Research and Practice Innovation Program of Jiangsu Province (No. KYCX21_0859).
We would appreciate the reviews and editor-in-charge for the time and effort in dealing with our manuscript. And we are grateful to all the foundations that support us.
The authors declare that the research was conducted in the absence of any commercial or financial relationships that could be construed as a potential conflict of interest.
All claims expressed in this article are solely those of the authors and do not necessarily represent those of their affiliated organizations, or those of the publisher, the editors and the reviewers. Any product that may be evaluated in this article, or claim that may be made by its manufacturer, is not guaranteed or endorsed by the publisher.
The Supplementary Material for this article can be found online at: https://www.frontiersin.org/articles/10.3389/fenvs.2022.944075/full#supplementary-material
An, R. M., and Suo, M. L. (2016). Application of attributes reduction and weights calculation through neighborhood rough set. Comput. Eng. Appl. 52 (07), 160–165. doi:10.3778/j.issn.1002-8331.1405-0403
Bleischwitz, R., Spataru, C., VanDeveer, S. D., Obersteiner, M., van der Voet, E., Johnson, C., et al. (2018). Resource nexus perspectives towards the United Nations sustainable development goals. Nat. Sustain. 1 (12), 737–743. doi:10.1038/s41893-018-0173-2
Chen, J. F., Yu, X. Y., Qiu, L., Deng, M., and Dong, R. (2018). Study on vulnerability and coordination of Water-Energy-Food system in Northwest China. Sustainability 10 (10), 3712. doi:10.3390/su10103712
Chen, Y., Feng, Y. Z., Zhang, F., and Wang, L. (2018). Assessing water resources vulnerability by using a rough set cloud model: A case study of the huai river basin, China. Entropy 21 (1), 14. doi:10.3390/e21010014
Chen, Y., and Feng, Y. Z. (2020). Assessment and prediction of water resources vulnerability in river basin based on RS-SVR model: A case study of the yellow river basin. Resour. Environ. Yangtze Basin 1, 137–149. doi:10.11870/cjlyzyyhj202001013
Chen, Y., and Xu, L. F. (2021). Evaluation and scenario prediction of the water-energy-food system security in the Yangtze River economic Belt based on the RF-haken model. Water 13 (5), 695. doi:10.3390/w13050695
Ding, T. H., and Chen, J. F. (2021). Evaluation and obstacle factors of coordination development of regional water-energy-food-ecology system under green development: A case study of Yangtze River economic Belt, China. Stoch. Environ. Res. Risk Assess. 36, 2477–2493. doi:10.1007/s00477-021-02114-w
Duan, Y., Xiong, J., Cheng, W., Wang, N., Li, Y., He, Y., et al. (2022). Flood vulnerability assessment using the triangular fuzzy number-based analytic hierarchy process and support vector machine model for the Belt and Road region. Nat. Hazards (Dordr). 110 (1), 269–294. doi:10.1007/s11069-021-04946-9
Fasel, M., Brethaut, C., Rouholahnejad, E., Lacayo-Emery, M., and Lehmann, A. (2016). Blue water scarcity in the Black Sea catchment: Identifying key actors in the water-ecosystem-energy-food nexus. Environ. Sci. Policy 66, 140–150. doi:10.1016/j.envsci.2016.09.004
Gao, M., He, R., Vezzoli, C., Ma, K., and Zhang, Y. (2022). Characterizing and defining of designing sustainable product-service systems applied to distributed water-energy-food nexus. Front. Environ. Sci. 224. doi:10.3389/fenvs.2022.864281
Gu, D. L., Guo, J. H., Fan, Y. R., Zuo, Q. T., and Yu, L. (2022). Evaluating water-energy-food system of Yellow River basin based on type-2 fuzzy sets and Pressure-State-Response model. Agric. Water Manag. 267, 107607. doi:10.1016/j.agwat.2022.107607
Gu, F. Y., and Xie, Y. (2022). “The differential impacts of coercive pressure from environmental law and proactive environmental strategy on corporate environmental performance: The case study of a pulp and paper company,” in Corporate social Responsibility and environmental management (Hoboken, NJ, USA: Wiley), 1–17. doi:10.1002/csr.2286
He, G., Xia, Y. L., Qin, Y., Zhu, Y. N., and Wang, W. W. (2019). Evaluation and spatial-temporal dynamic change of water resources carrying capacity in the Yangtze River economic Belt. Res. Soil Water Conservation 26 (01), 287–292+300. doi:10.13869/j.cnki.rswc.2019.01.042
Heard, B. R., Miller, S. A., Liang, S., and Xu, M. (2017). Emerging challenges and opportunities for the food–energy–water nexus in urban systems. Curr. Opin. Chem. Eng. 17, 48–53. doi:10.1016/j.coche.2017.06.006
Howells, M., Hermann, S., Welsch, M., Bazilian, M., Segerstrom, R., Alfstad, T., et al. (2013). Integrated analysis of climate chang-e, land-use, energy and water strategies. Nat. Clim. Chang. 3 (7), 621–626. doi:10.1038/NCLIMATE1789
Hu, H. Z., Wang, J. L., Wang, Y., and Long, X. Y. (2019). Spatial-temporal pattern and influencing factors of grain production and food security at county level in the Yangtze River basin from 1990 to 2015. Resour. Environ. Yangtze Basin 28 (02), 359–367. doi:10.11870/cjlyzyyhj201902012
Hu, Q. H., Yu, D. R., and Xie, Z. X. (2008). Numerical attribute reduction based on neighborhood granulation and rough approximation. J. Softw. 03, 640–649. doi:10.3724/SP.J.1001.2008.00640
Ioannou, A. E., and Laspidou, C. S. (2022). Resilience analysis framework for a water–energy–food nexus system under climate change. Front. Environ. Sci. 342, 820125. doi:10.3389/fenvs.2022.820125
Jin, S. Z., and Li, Q. X. (2022). Prediction of carbon emission in chongqing based on support vector regression. J. Chongqing Univ. Sci. Technol. Sci. Ed. 24 (01), 110–114. doi:10.19406/j.cnki.cqkjxyxbzkb.2022.01.018
Karabulut, A., Egoh, B. N., Lanzanova, D., Grizzetti, B., Bidoglio, G., Pagliero, L., et al. (2015). Mapping water provisioning services to support the ecosystem-water-food-energy nexus in the Danube river basin. Ecosyst. Serv. 17, 278–292. doi:10.1016/j.ecoser.2015.08.002
Kong, Y., He, W. J., Yuan, L., Zhang, Z. F., Gao, X., Degefu, D. M., et al. (2021). Decoupling economic growth from water consumption in the Yangtze River economic Belt, China. Ecol. Indic. 123, 107344. doi:10.1016/j.ecolind.2021.107344
Liu, X., and Wang, X. L. (2021). Value segmentation of airline customers based on K-means and neighborhood rough set. Operations Res. Manag. Sci. 30 (03), 104–111. doi:10.12005/orms.2021.0082
Ma, Y., Li, Y. P., Zhang, Y. F., and Huang, G. H. (2021). Mathematical modeling for planning water-food-ecology-energy nexus system under uncertainty: A case study of the aral sea basin. J. Clean. Prod. 308, 127368. doi:10.1016/j.jclepro.2021.127368
Markantonis, V., Reynaud, A., Karabulut, A., El Hajj, R., Altinbilek, D., Awad, I. M., et al. (2019). Can the implementation of the water-energy-food nexus support economic growth in the mediterranean region? The current status and the way forward. Front. Environ. Sci. 7, 84. doi:10.3389/fenvs.2019.00084
Mele, M., and Magazzino, C. (2020). A machine learning analysis of the relationship among iron and steel industries, air pollution, and economic growth in China. J. Clean. Prod. 277, 123293. doi:10.1016/j.jclepro.2020.123293
Nhamo, L., Ndlela, B., Nhemachena, C., Mabhaudhi, T., Mpandeli, S., and Matchaya, G. (2018). The water-energy-food nexus: Climate risks and opportunities in southern Africa. Water 10 (5), 567. doi:10.3390/w10050567
Pawlakab, Z. (1997). Rough set approach to knowledge-based decision support. Eur. J. Operational Res. 99 (1), 48–57. doi:10.1016/S0377-2217(96)00382-7
Polsky, C., Neff, R., and Yarnal, B. (2007). Building comparable global change vulnerability assessments: The vulnerability scoping diagram. Glob. Environ. change 17 (3-4), 472–485. doi:10.1016/j.gloenvcha.2007.01.005
Qian, X. Y., and Liang, Q. M. (2021). Sustainability evaluation of the provincial water-energy-food nexus in China: Evolutions, obstacles, and response strategies. Sustain. Cities Soc. 75, 103332. doi:10.1016/j.scs.2021.103332
Qin, T., and Tong, J. P. (2021). Spatiotemporal change of water-energy-food coupling efficiency and influencing factors in the Yangtze River Economic Belt. Resour. Sci. 43 (10), 2068–2080. doi:10.18402/resci.2021.10.11
Reyers, B., and Selig, E. R. (2020). Global targets that reveal the social-ecological interdependencies of sustainable development. Nat. Ecol. Evol. 4 (8), 1011–1019. doi:10.1038/s41559-020-1230-6
Shi, H. Y., Luo, G. P., and Zheng, H. W. (2020). Water use analysis of Syr Darya river basin:Based on "Water-Energy-Food-Ecology" nexus and Bayesian network. Acta Geogr. Sin. 75 (05), 1036–1052. doi:10.11821/dlxb202005011
Song, M., Wang, H. X., and Wang, Y. (2021). Energy system vulnerability to climate change vulnerability and adaptation initiative study. Energy China 43 (01), 26–32. doi:10.3969/j.issn.1003-2355.2021.01.005
Sun, J., and Xie, X. S. (2022). Estimation of water-energy-food (WEF) servicing values based on a case study on Guizhou province. Resour. Industries 22 (05), 37–47. doi:10.13776/j.cnki.resourcesindustries.20200902.004
Udemba, E. N., Magazzino, C., and Bekun, F. V. (2020). Modeling the nexus between pollutant emission, energy consumption, foreign direct investment, and economic growth: New insights from China. Environ. Sci. Pollut. Res. 27 (15), 17831–17842. doi:10.1007/s11356-020-08180-x
Wang, D. Q. (2017). Research on vulnerability assessment of grain supply chain network. J. Shandong Agric. Eng. Univ. 34 (05), 5–8. doi:10.15948/j.cnki.37-1500/s.2017.05.002
Wang, H. R., Zhao, W. J., Deng, C. Y., and Yan, J. W. (2022). Analysis on issues of water-energy-food nexus. J. Nat. Resour. 37 (02), 307–319. doi:10.31497/zrzyxb.20220203
Wang, M., Zhu, Y. F., Gong, S. W., and Ni, C. Y. (2021). Spatiotemporal differences and spatial convergence of the water-energy-food-ecology nexus in northwest China. Front. Energy Res. 140, 665140. doi:10.3389/fenrg.2021.665140
Wang, Y. J., Liu, Y. X., Song, S., and Fu, B. J. (2021). Research progress of the water-food-energy-ecosystem nexus. Adv. Earth Sci. 36 (07), 684–693. doi:10.11867/j.issn.1001-8166.2021.073
White, D. J., Hubacek, K., Feng, K., Sun, L., and Meng, B. (2018). The water-energy-food nexus in east asia: A tele-connected value chain analysis using inter-regional input-output analysis. Appl. Energy 210, 550–567. doi:10.1016/j.apenergy.2017.05.159
Xie, L. Y., Li, Y., and Qian, F. K. (2014). Analysis on agricultural sensitivity and vulnerability to climate change and countermeasures. China Popul. Resour. Environ. 24 (05), 25–30. doi:10.3969/j.issn.1002-2104.2014.05.005
Xing, L., Xue, M., and Hu, M. (2019). Dynamic simulation and assessment of the coupling coordination degree of the economy–resource–environment system: Case of Wuhan City in China. J. Environ. Manag. 230, 474–487. doi:10.1016/j.jenvman.2018.09.065
Xu, S. S., He, W. J., Shen, J. Q., Degefu, D. M., Yuan, L., and Kong, Y. (2019). Coupling and coordination degrees of the core water–energy–food nexus in China. Int. J. Environ. Res. Public Health 16 (9), 1648. doi:10.3390/ijerph16091648
Xu, S. S., He, W. J., Yuan, L., Degefu, D. M., Yang, Y., and Li, H. (2021). The relationship between coordination degree of the water–energy–food system and regional economic development. Sustainability 13 (3), 1305. doi:10.3390/su13031305
Yang, F., Ma, C., and Fang, H. J. (2019). Research progress on vulnerability: From theoretical research to comprehensive practice. Acta eco. Sin. 39 (02), 441–453. doi:10.5846/stxb201802020289
Yao, C. S., Yin, W., and Huang, L. (2019). Spatial-Temporal pattern and coupling coordination evolution of the vulnerability of food production and consumption ability in China. Econ. Geogr. 39 (12), 147–156. doi:10.15957/j.cnki.jjdl.2019.12.017
Yuan, L., Li, R., He, W., Wu, X., Kong, Y., Degefu, D. M., et al. (2022). Coordination of the industrial-ecological economy in the Yangtze River economic Belt, China. Front. Environ. Sci. 451, 88222. doi:10.3389/fenvs.2022.882221
Yue, J. T., Yan, X. Y., and Liu, Q. Y. (2019). Evaluation of water use efficiency in Jiangxi based on CRITIC-TOPSIS. Jiangxi Hydraul. Science& Technol. 45 (04), 275–279. doi:10.3969/j.issn.1004-4701.2019.04-08
Zhi, Y. L., Chen, J. F., and Wang, H. M. (2020). Assessment of water-energy-food nexus fitness in China from the perspective of symbiosis. China Popul. Resour. Environ. 30 (01), 129–139. doi:10.12062/cpre.20190502
Keywords: WEFE nexus, neighborhood rough set, Yangtze River Economic Belt, vulnerability, support vector machine
Citation: Pan Y, Chen Y and Liu Y (2022) Vulnerability evaluation and prediction of the water-energy-food-ecology nexus in the Yangtze River Economic Belt based on TOPSIS, neighborhood rough set and support vector machine. Front. Environ. Sci. 10:944075. doi: 10.3389/fenvs.2022.944075
Received: 14 May 2022; Accepted: 03 October 2022;
Published: 18 October 2022.
Edited by:
Qiwei Pang, Sejong University, South KoreaReviewed by:
Liang Yuan, China Three Gorges University, ChinaCopyright © 2022 Pan, Chen and Liu. This is an open-access article distributed under the terms of the Creative Commons Attribution License (CC BY). The use, distribution or reproduction in other forums is permitted, provided the original author(s) and the copyright owner(s) are credited and that the original publication in this journal is cited, in accordance with accepted academic practice. No use, distribution or reproduction is permitted which does not comply with these terms.
*Correspondence: Yan Chen, c2FuY2hlbjAwN0AxNjMuY29t
Disclaimer: All claims expressed in this article are solely those of the authors and do not necessarily represent those of their affiliated organizations, or those of the publisher, the editors and the reviewers. Any product that may be evaluated in this article or claim that may be made by its manufacturer is not guaranteed or endorsed by the publisher.
Research integrity at Frontiers
Learn more about the work of our research integrity team to safeguard the quality of each article we publish.