 Knut Alfredsen
 Ana Juárez-Goméz
 Mahmoud Saber Refaei Kenawi
 Magnus Simon Graf1
- 1Department of Civil and Environmental Engineering, Norwegian University of Science and Technology, Trondheim, Norway
- 2LOS Cable Solutions AS, Bremnes, Norway
In the transition to a society based on renewable energy, flexibility is important in balancing the energy supply as more intermittent sources like wind and solar are included in the energy mix. The storage-based hydropower systems are a renewable energy source that provides the needed flexibility since a hydropower plant can be started and stopped in minutes, and the reservoirs provide stored energy that can be utilized when the demand arises. Thereby, the hydropower plants can balance the variability in other energy sources, e.g., when there is no wind or when solar input is low. This need for increased flexibility has led research toward new hydropower turbines to provide larger ramping rates, more frequent starts and stops, and other system services. A possible drawback of the ramping operation of hydropower plants (often termed “hydropeaking”) are the adverse effects on the environment in receiving water bodies downstream of the power plant outlet, particularly when the hydropower outlets are in rivers. Rapid changes in flow can lead to stranding of fish and other biota during the shutdown of turbines and flushing of biota during the start of turbines. These effects can also be caused by other sudden episodes of water withdrawal, such as during accidental turbine shutdowns. The main objective of this study is to describe a method of designing the necessary volume of water required to mitigate a fast ramping turbine, and present the effect this has on the downstream river reach. We used a 2D hydraulic model to find the areas affected by hydropeaking operation and, furthermore, to define areas with a faster ramping rate than 13 cm/h which is used as a limit in Norwegian guidelines. Based on this, we developed a ramping regime that would prevent fast dewatering of critical areas and provide this as a basis for mitigating the effects of fast dewatering in the downstream river (River Nidelva in Norway was used as a test case). Furthermore, the effect of increasing the frequency of start–stop cycles was studied, and the proposed mitigation was evaluated for the new operational regime.
Introduction
The transition into a society based on renewable energy sources has received considerable attention over the past years as a way of combatting global warming (Edenhofer et al., 2011). The renewable energy mix contains intermittent energy sources like the wind and sun, and methods of balancing the energy supply are important to secure a constant supply. Hydropower with water storage in reservoirs is a very flexible renewable energy source which can be started and stopped in minutes and is thereby ideally suited to balance the intermittent energy sources. The reservoirs provide stored energy that can be utilized when the demand arises, which further extends the flexibility and usefulness of the hydropower systems for load balancing purposes. However, the flexible operation of hydropower plants can cause nonnatural, sub-daily fluctuating flows into receiving water bodies, often referred to as “hydropeaking” (Harby et al., 2013). This can be a serious environmental issue, particularly when the hydropower outlet is in a river (Bruder et al., 2016) as opposed to power plant outlets in fjords, reservoirs, or lakes (Halleraker et al., 2022). The term nonnatural is important since the rising and falling limb of the hydrograph during an hydropeaking operation is steeper than what is seen in the natural hydrograph in the same flow range, and the local biodiversity is normally not adapted to this anthropogenic impact (Hayes et al., 2021).
Hydropeaking in rivers can cause serious consequences for the physical environment and ecosystems downstream (e.g., Harby et al., 2013). The key factors in the assessment of peaking are the vertical ramping rate (the drop in water level pr. time unit), and the rate of dewatering (drying) of the river bed when the water level is reduced (the lateral ramping rate). The lateral ramping rate might be as important as the vertical ramping rate in the impact assessment study. Literature covers a wide range of ecological impacts from hydropeaking operations. Auer et al. (2017) reported on the flushing of biota as a turbine starts, and this can lead to changes in fish distribution. When the turbine stops, stranding or pool trapping of juvenile fish in river areas that had dried out was observed (Saltveit et al., 2001; Schmutz et al., 2015). Here, stranding refers to fish being left on dry land when the water subsides. Periods with a dry river bed can also have impacts on salmon eggs and alevins buried in the gravel (Casas-Mulet et al., 2014; Casas-Mulet et al., 2016). During peaking operations, thermal alterations (“thermopeaking”) lead to rapidly varying water temperatures (Zolezzi et al., 2011). Furthermore, impacts on invertebrates have been observed in rivers operating under a hydropeaking regime (Bruno et al., 2013; Kjærstad et al., 2018), as have morphological alterations from continuous hydropeaking (Batalla et al., 2021) that could lead to invertebrate drift and impacts on riverine and riparian plants (Bejarano et al., 2017). Benthic algae can also be influenced by hydropeaking through abrasion caused by increased flow velocity and species shifts (Greimel et al., 2018).
Hydropeaking operations can have severe impacts on fish populations in downstream rivers. Hayes et al. (2021) have shown large reductions in biomass of graylings between reference sites and sites with peak flow regime. Schmutz et al. (2015) have found that typical hydropeaking indices like peak frequency and ramping rate have explained most of the indices of biotic integrity developed for rivers in Austria. Saltveit et al. (2020) have shown that year classes of brown trout older than the young of the year disappear from heavily peaked river reaches in Norway. Through a modeling study using an individual-based model, Hedger et al. (2018) have shown that stranding of smolts may have a large impact on the population through a direct impact on returning adult Atlantic salmon, while in the younger year classes, the interaction between stranding mortality and density-dependent mortality is less clear. The varying impacts on different life stages of fish have also been shown by Hayes et al. (2019), who have proposed environmental flow rules adapted to specific life stages as a way of providing targeted mitigation measures.
Impacts from peaking operations have to be handled to reduce the adverse effects on nature, and mitigation is necessary in maintaining sustainable energy production, particularly when a hydropower plant in the energy mix has an outlet in a river rather than in a fjord or reservoir (Halleraker et al., 2022). Flow rules or operational ramping restrictions, as proposed by Hayes et al. (2019), are examples of mitigation measures related to peaking operations which aim at adapting the peaking hydrograph, and then particularly the falling limb within safe ecological limits for different life stages of target species. In accordance, some flow rules are already formalized in some countries, Moreira et al. (2019) review available flow mitigation measures and show that they are mainly developed from field or laboratory studies of specific species. An example of this is the gentle down ramping rules that are already quite widespread in many licenses of Norwegian regulated rivers (Halleraker et al., 2022). However, designing flow rules is a complex process since the dewatering of river sections is dependent on the distance from the outlet of the hydropower plant and the morphology of the river (Hauer et al., 2017). Since the lateral ramping rate might be as important as the vertical ramping rate, this should also be taken into consideration when deciding on the flow rule. The relationship between the vertical and lateral ramping rates is dependent on the morphology and shows large spatial variations (Tekle, 2021), which is best estimated through hydraulic modeling. Bakken et al. (2021) proposed an impact assessment protocol that tries to capture both factors by devising a method classifying a peaking operation into four classes from “Small” to “Very Large” comprising one measure for the rate of change (cm/h) and one factor for the dewatered area (% reduction from Qmax to Qmin). In combining these factors, both the vertical and lateral changes in dewatering are captured. The computation of the spatial variation of the rate of change would require a dense gauge network or data to do hydraulic modeling, and the estimation of the areal reduction would require fieldwork or modeling.
The challenges related to mitigation are both related to technical turbine constraints and the extra use of water caused by gradual stops. For creating a gradual stop of the power plant, it is necessary to operate the hydropower turbines at the rate of discharge defined in the mitigation protocol. This might not be possible without violating the turbine’s technical constraints. For example, overheating could occur at low turbine flow and turbine blades can be damaged by cavitation if operated outside the normal flow range. Another issue related to a gradual stop is the extra use of water required and how this influences the optimal operation of the hydropower plant and thereby the economy. Juarez et al. (2019) proposed a mitigated turbine stop for the Storåne river to reduce stranding, but here, the turbine constraints made it only possible to run a slow shutdown until the turbine reached 40% of the full capacity before a full stop was required. This puts constraints on how mitigation measures can be implemented and increase the stranding risk at the end of the shutdown period.
In addition, new operational regimes for turbines are possible and also substitution of turbines allows for a more adapted shutdown regime. An alternative to handling the restricted shutdowns directly through the turbine is to employ a dampening reservoir just downstream of the turbine outlet (Meier et al., 2016; Tonolla et al., 2017). The purpose of this is to fill the reservoir during the start of the turbine and thereby dampen the flushing effect and to gradually release water when the turbine stops to reduce the dewatering effect. The capacity of the reservoir has to be adapted to the ramping rate of the power plant, and space constraints can be an issue particularly when dampening reservoirs are retrofitted to existing power plants. An alternative solution using water storage for dampening the effect of hydropeaking has been proposed by Storli and Lundström (2019) who presented the Air Cushion Underground Cavern (ACUR), providing underground storage where compressed air is used to control the storage and release of water. This solution would be suited to underground power plants and is potentially easier to retrofit at existing power plants since no structure is required to be built at the power plant outlet.
Based on the need for a new and more flexible hydropower turbine as described above, the HydroFlex project was initiated and funded by the European Union. The project answers the call to develop turbines adapted to the future European energy market where intermittent renewable sources require load balancing to provide a stable energy supply. The objective of the HydroFlex project is to develop a variable-speed turbine that can handle high ramping rates and multiple starts and stops per day (possibly up to 30) without compromising the lifetime and efficiency of the turbine and to develop equipment like generators and converters that are required for the new operation. The project also describes the possible environmental impacts of operating the new HydroFlex turbine and evaluates potential mitigation measures.
The objectives of this study can be summarized as follows:
(1) Investigate the effects of hydropeaking in River Nidelva in Trondheim, Norway, on stranding areas for juvenile Atlantic salmon (life stages before ocean migration) using a hydraulic model under the current operational regime.
(2) Use the results from (1) to evaluate potential mitigation measures for Nidelva as a basis for an evaluation of the HydroFlex turbine.
(3) Investigate the effect of a high-frequency start and stop operation according to the HydroFlex turbine design on conditions in the river reach downstream of the powerplant outlet and how mitigation measures can be applied to this situation.
Materials and methods
Study site
River Nidelva in Norway was used as a study site in the project (Figure 1). The river is regulated through the Nea-Nidelva scheme which consists of the regulation of Nea upstream of Selbusjøen and the regulation of Nidelva downstream of Selbusjøen (Figure 1), and this project used the lower part of the river from Nedre Leirfoss to the outlet in the fjord in Trondheim city center. This reach of the river is regulated through the Nye Leirfoss power plant and the Bratsberg power plant. The Nye Leirfoss power plant has an intake in the river at the Øvre Leirfoss dam and the Bratsberg power plant has an intake in Selbusjøen (Figure 1). Bratsberg has two Francis turbines with a capacity of 50 m3s−1 each, while Nye Leirfoss has two Francis turbines of 30 m3s−1 and 60 m3s−1, respectively. In addition, there is a minimum flow release of 10 m3s−1 between Øvre and Nedre Leirfoss. Bratsberg is running the hydropeaking operation, while Nye Leirfoss contributes to a total minimum flow of 30 m3s−1 downstream of the hydropower outlet. In cases where more than the minimum flow is released into Nidelva from the power plants upstream of Øvre Leirfoss (Figure 1), Nye Leirfoss can also produce energy on some of this extra water. It is worth noting that Nidelva is used as a test case for the mitigation measures and impacts of frequent ramping with the new HydroFlex turbine, and some adaptations to the natural hydrograph and power plant installation is done to simulate future operational scenarios. There are no plans for implementing new turbines in the Nidelva power plants, and installing a high-flexibility turbine at this location might not even be economically feasible due to the low transmission capacity and is thereby a difficult access to the market for flexible energy production (Siemonsmeier et al., 2020).
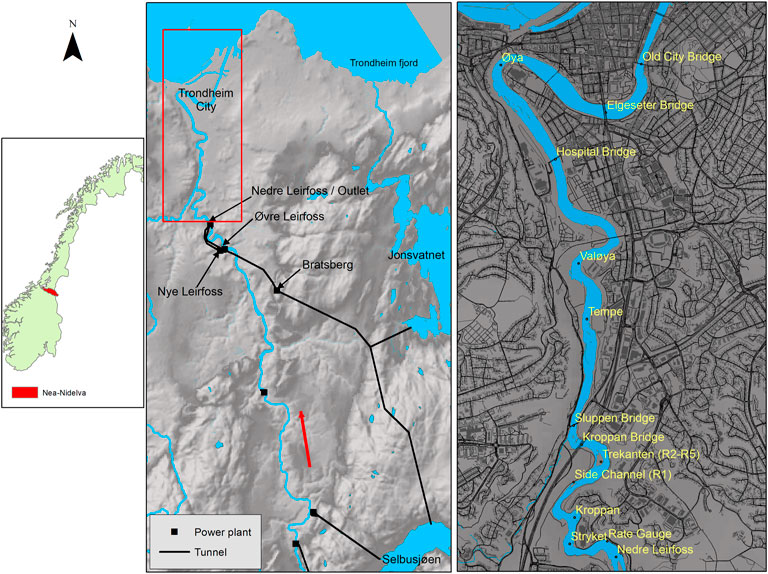
FIGURE 1. Overview of Nidelva. Left panel: the Nea-Nidelva catchment in Norway; middle panel: the Nidelva hydropower system with Selbusjøen reservoir and Bratsberg and the power plants at Øvre and Nedre Leirfoss marked. Right panel: details of River Nidelva downstream of the power plant outlet in Nedre Leirfoss.
Data collection
Water discharge data for the river were taken from the Rate gauge (123.20.0) some hundred meters downstream of the power plant outlet and from the Bratsberg power plant, both available from the database of the Norwegian Water Resources and Energy Directorate.
The frequency of future ramping was built on model simulations of the future energy market developed for the HydroFlex project by the University of Aachen (Siemonsmeier et al., 2020). By evaluating the export scenarios between the Nordic countries and Germany with a time horizon of the 2,040 s, the need for flexibility is estimated to be close to the current capacity. In this market segment, the need for 30 starts and stops does not seem to arise for the time period studied. On the other hand, increased local development of intermittent renewable resources will require more flexibility in the hydropower scenarios, and here, the increased flexibility of the new turbine could be utilized in the future. Developing output hydrographs for specific power plants based on the market scenarios was difficult, and to test the effect of scenarios increasing the flexibility above the current 1–2 daily ramping events was tested by running simulations with up to 12 starts and stops.
The bathymetry from the river used to set up the model was compiled from different sources; mainly, a measurement campaign was carried out by the project using a SonTek M9 HydroSurveyor towed by a kayak. The data were also collected from the consultant company SWECO that also used a SonTek M9 HydroSurveyor operated from a remote-controlled boat. Previously measured data from the city of Trondheim and data collected for modeling in the upper part of the river were also added to the bathymetric model of the river (Spiller et al., 2011). Particular emphasis was made to collect detailed data from areas known to have dried out during minimal flow and thereby become a potential stranding area for fish (Hvidsten 1985; Saltveit et al., 2001). This could ensure accurate computation of the stranding risk indices. The collected data were interpolated into a Digital Elevation Model (DEM) using ArcMap 10.8 (www.esri.com). The resolution of the DEM was 0.5 × 0.5 m. The DEM of the bathymetry was then integrated into the terrestrial laser scan of Trondheim to ensure that the model covers the adjacent flood plains. The terrestrial data were downloaded from the national elevation database of Norway (www.hoydedata.no).
We collected water level data for model calibration in a measurement campaign using an RTK-GPS (Leica Viva CS15, Leica Geosystems Ag). We also evaluated the model simulations against georeferenced aerial imagery taken on the 27th of August 2017 at a discharge of 98.7 m3s−1. The aerial images were downloaded from the repository of the Norwegian mapping authority (www.norgeibilder.no).
Hydraulic model and mitigation analysis
To properly capture the details of the dewatering areas, a two-dimensional hydraulic model was used (Vanzo et al., 2016; Juarez et al., 2019). The hydraulic simulations were carried out in HEC-RAS v.6.0 (Brunner 2021). Different grid sizes were tested, and finally, a model grid of 1 × 1 m was used. This grid size provided a good compromise between accuracy in estimating the stranding areas and computational speed. The upstream boundary condition was the peaking hydrograph from the power plants. While the downstream boundary condition was the tide table for the Trondheim fjord when running the dynamic simulations of peaking waves, and an average low tide for running the static simulations to estimate dry areas for a single discharge. The full momentum equation solver was used in all simulations. The model was calibrated against the observed water levels by adjusting Manning's n-value in river sections, and the model was further evaluated using the aerial imagery from the Norwegian mapping authority (www.norgeibilder.no). For evaluation against the aerial imagery, the date of the flight was retrieved from the metadata of the images, and a simulation was done for the discharge that day. The water-covered area of the model was thereafter compared with the water-covered area in the image and the difference was computed.
For the evaluation of the ramping rates and mitigation scenarios, a shutdown hydrograph from the Bratsberg power plant was created based on the observed data from the Rate gauge. From the observed hydrograph, several fast drops from full production to no production were identified and a standardized hydrograph was fitted to these data manually. This hydrograph was then used in the analysis to find the mitigation measures. For future scenarios with the HydroFlex turbine, the focus was on the requirement for a more flexible operation to balance a different mix of renewable energy sources, but the requirement for upgrades of the power plant capacity was not evaluated. It was therefore assumed that in the future, we will have the same turbine capacity in Bratsberg, and for the analysis in Nidelva, no technical constraints on the duration of the turbine stop will be considered. A hypothetical case with an artificial hydrograph with 12 sub-daily stops was made with this as the basic assumption.
The main fish species in Nidelva are Atlantic salmon (Salmo salar) and brown trout (Salmo trutta). Atlantic salmon was used as a target species in this study. Data on hydropeaking severity for Atlantic salmon and the necessary ramping rate threshold to avoid fish stranding was based on a limit of 13 cm/h proposed by Bakken et al. (2021). In the case of Nidelva, this threshold value is closely linked to the local conditions since it was developed partly on the data collected in a field experiment in Nidelva at the Trekanten site (Figure 1) (Saltveit et al., 2001). Dewatering occurs both in summer and winter, and the impact of peaking on the stranding of fish varies between seasons (Saltveit et al., 2001), but the seasons have little effect on the areas dewatered or the ramping rate.
The ramping rate was computed for several locations along the river using the standard hydrograph with particular focus on areas where total dewatering was observed in the field. For each location, the depth was recorded every 5 min from the model simulation and the dewatering rate was computed according to Equation (1).
where DR is the dewatering rate for location k, and D is the depth in meters for that location for time interval i. The interval length is constant and is 5 min. For the area upstream of the Kroppan bridge (Figure 1), detailed relationships between the time and depth were recorded for data points in both the dewatered (shown with square markers in Figure 2) and permanent wet (shown with round markers in Figure 2) areas as the basis for assessing the ramping rate and to form the basis for developing a mitigation strategy for the river. The third and most upstream section at Stryket (Figure 1) was not used in the actual computation since it was found that solving the dewatering issues for the two lower reaches would also solve the issues at the upstream site. Dewatering was computed for five different regions, region 1 is in the side channel upstream of Trekanten (Figure 1) and regions 2–5 are located at various locations in Trekanten (Figures 1, 2), covering the inlet to the side channel (R2), side channel (R4), and areas around the island (R3 and R5).
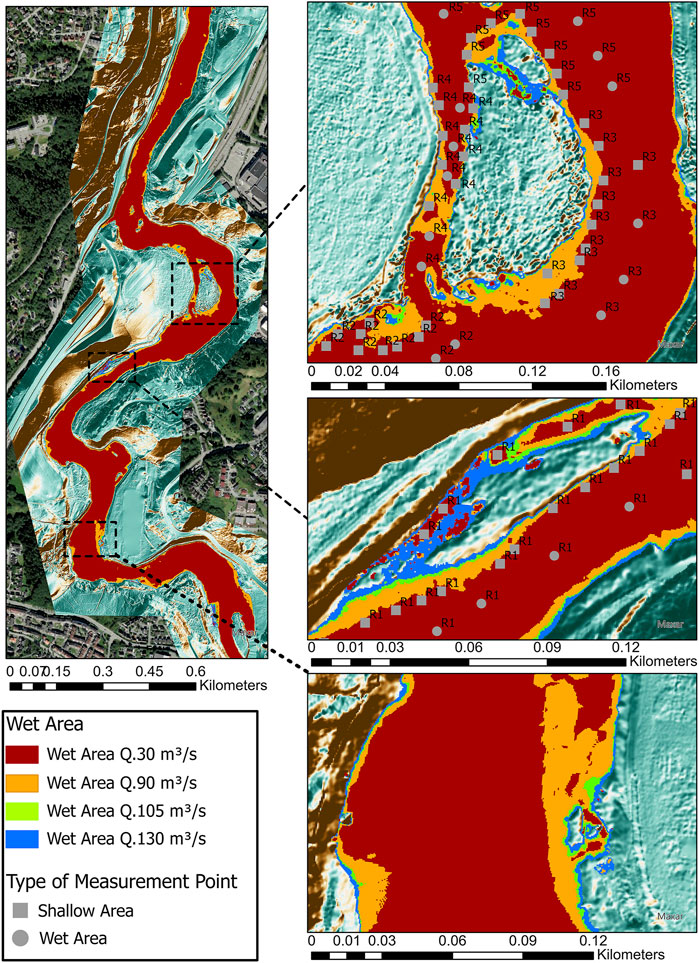
FIGURE 2. Sites where dewatering was computed for mitigation analysis. Regions 1–5 are shown on the map as R1–R5 and locations for the extraction of dewatering curves are marked with a round symbol for permanent wet areas and a square symbol for areas that dried out during down ramping. Upper left panel: an overview of the sites used for dewatering computations; upper right panel: Trekanten site (regions 2–5); middle right panel: side channel site (region 1); lower right panel: Stryket site. Adapted from Kenawi (2021).
Based on the observed turbine operation, several simulations were carried out with input hydrographs that gradually extended the time it takes for the power plant to go from full to zero production. The results were used to correlate the dewatering rate with the stoppage time to find a shutdown scenario that reduced the dewatering rate below the acceptable threshold. Using the findings from this analysis, an environmentally friendly shutdown hydrograph was made by extending the time of the shutdown and creating a recession with a milder slope. Extending the time of the stop requires more water to be released from the power plant, and the extra volume of water required was computed from the mitigated hydrograph (Kenawi 2021). In addition, to find a flow regime that prevents critical dewatering, we have also tried to conserve the use of water in the mitigation procedure to reduce the impact on power production. Flow series for the power plant according to the mitigation releases were made by modifying the observed flow series in Python to take the gradual turbine stop into account.
Analysis tools
All plotting and analysis of the spatial extent of peaking were carried out in ArcMap 10.8 and ArcGIS Pro (www.esri.com), and all other statistical analyses and plotting were done using the R programming language (R Core Team 2019).
Results
Model calibration
The comparison of the measured and simulated water levels was done for 42 points measured between Nedre Leirfoss and Tempe. The Manning numbers of the model were adjusted to minimize the differences between the observed and simulated water levels, and this led to a mean error of −0.017 cm (SD = 0.08 cm). The Manning number ranged from 0.045 to 0.090. The correlation between the observed and simulated water levels gave an r2 of 0.99. The relationship is shown in Figure 3.
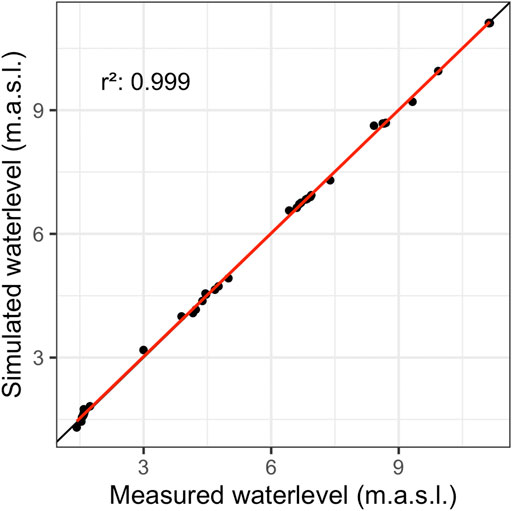
FIGURE 3. Calibration results—comparison between measured and simulated water levels.
An example of the comparison between the area from the model and the area from the aerial image is shown in Figure 4. The difference between the simulated and the observed water-covered area is 3%.
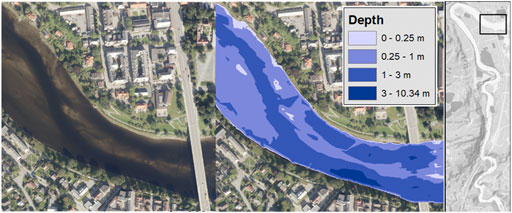
FIGURE 4. Comparison between simulated water surface extent (right panel) and aerial imagery for a discharge of 98.7 m3s−1. Image © Statkart–Geovekst.
Modeled dewatering
An observed hydrograph measured in the Bratsberg power plant at the upstream boundary is shown in Figure 5 together with the standardized hydrograph that was derived from the measured data and used in the development of the mitigation measures. For the simulation, we also added the environmental flow of 30 m3s−1 to the turbine flow.
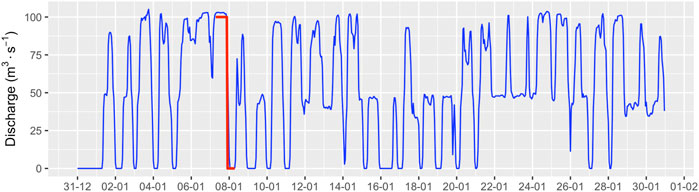
FIGURE 5. Observed production from one or two turbines in the Bratsberg power plant from 01/01/2010 to 01/02/2010. The standard hydrograph used in the dewatering analysis is shown in red. An environmental flow of 30 m3s−1 comes in addition to the release from the power plant.
The corresponding water covered areas are shown in Figure 6 for the largest stranding area upstream of the Kroppan bridge. The wetted area is shown for full production from Bratsberg (two turbines), one turbine in operation in Bratsberg, and the situation with minimum flow. At minimum flow, the blue areas will be wet, and at full production, all colored areas will be wet.
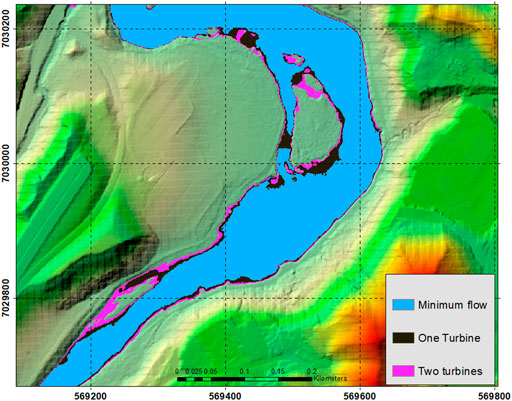
FIGURE 6. Map of dewatering in Nidelva for the standard hydrograph shown in Figure 5: minimum flow, 30 m3s−1 (blue); one turbine, 80 m3s−1 (black); and two turbines, 130 m3s−1 (pink).
The ramping simulations with multiple peaks per day show the translation of peaks downstream after each stop in Leirfossen, and an example of running a frequent ramping regime with several start–stop sequences in succession is shown in Figure 9. The duration between the falling and rising limbs of the hydrograph is shortened, and eventually, the rise of the next peak starts before the previous peak has reached its potential minimum. This then reduces the dewatered areas in the reach.
Mitigation measures
The simulations shown in Figure 6 have identified the potential dewatered areas and provided an understanding of the dewatering rates in different locations along the river. New simulations were carried out by gradually increasing the stoppage time of the turbine. Changes in depth were extracted from the two most severe stranding locations in the river (Figure 2) for points in the areas permanently wetted (marked with circles in Figure 2) and in shallow areas (marked with squares on Figure 2).
The reduction of depth is shown in Figure 7 A for all points sorted in the regions shown in Figure 2. Region 1 refers to a small side channel which is left nearly dry when the turbine stops, with the exception of some isolated ponds of water left at low flow. The average depth in region 1 reduces from 0.69 m at the start of the power plant shutdown event to 0.04 m at the end. Regions 2–4 are defined as areas around an island just upstream of the Kroppan bridge. In the side channel of the island (region 4), the average depth is 0.74 m at the start and 0.10 m at the end. Here, the wetted area at low flow is mainly at the lower end of the side channel. Region 3 represents a gravel bar on the outside of the main island and has an average depth of 0.67 m at the start and 0.05 m at the end; the water-covered areas represent the edge of the shallow part of region 3. Using the depth data for each point in the different regions, the dewatering rates for each 5-min interval were computed and the average dewatering rate for each region was then found for the current shutdown scenario (referred to as the standard hydrograph hereafter) (Table 1). The results show that for all regions, the dewatering rate is above the acceptable threshold of 13 cm/h (Bakken et al., 2021).
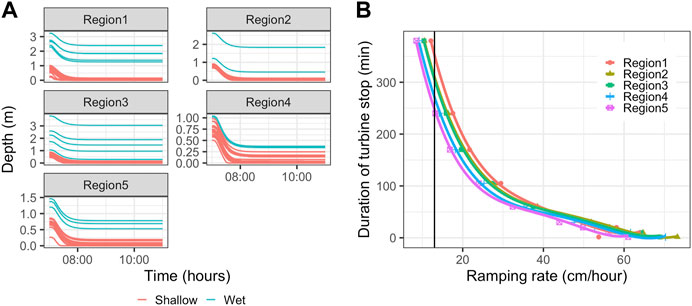
FIGURE 7. Reduction in depth computed for specific locations along the river (A) and the relationship between dewatering rates and time from a stop in the hydropower plant (B). The black line in panel (B) shows the threshold for stranding.
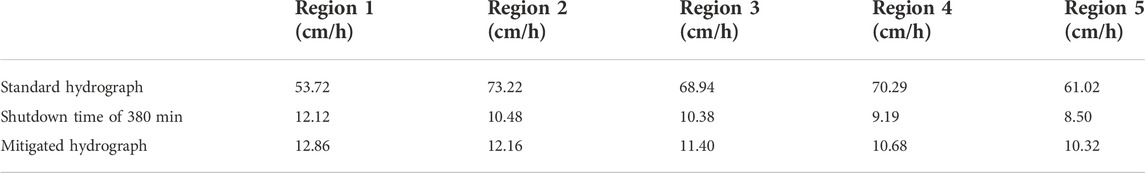
TABLE 1. Average dewatering rates for the original hydrograph, a hydrograph with a shutdown time of 380 min, and the mitigated hydrograph (Figure 8). The acceptable dewatering rate is 13 cm/h.
To estimate the necessary level of mitigation, simulations were carried out for different shutdown times for the turbine (range 0–380 min), and the dewatering rates were computed for each case similarly as was done for the standard hydrograph. The relationship between the dewatering rate and shutdown time in the turbine is shown in Figure 7B. For the longest shutdown time of 380 min, the rates are acceptable for all regions. The next step was to try to devise a shutdown scenario that also conserves as much water as possible for the power plant. To do this, the effect of reduction on flow on areal reduction was investigated from the maps shown in Figure 6. From a peak flow of 135 m3s−1 to a flow of 105 m3s−1, the river run bank is full, the dewatering of areas is small, and the power plant can shut down as normal with no restrictions. From 105 m3s−1 down to an environmental flow of 35 m3s−1, the period of shutdown should be extended to avoid high dewatering rates. Note that for the observed hydrograph used in this analysis, the environmental flow was slightly above the limit set in the regulation permit. By using the relationships between the dewatering rates, duration of turbine stop, and the simulations with the hydraulic model, a time of 270 min was found to be acceptable, providing dewatering times as shown in Table 1 in the row “Mitigated hydrograph.” The mitigated altered hydrograph is shown in Figure 8.
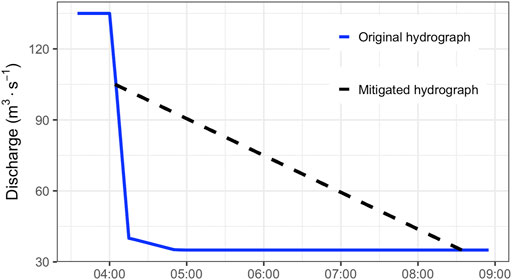
FIGURE 8. Current hydrograph (blue graph) and mitigated recession (indicated by the dashed black line).
Based on the hydrographs in Figure 8, the extra water required to mitigate the high ramping rate was computed by integrating the two curves from the start to end of the event. This shows that the extra water required to obtain the gradual recession amounts to 0.61 mill m3.
Eventually, with multiple starts and stops during a single day, the turbine will restart before the mitigated stop is finished, and the operation will run for periods where the production flow never reaches minimum flow at the hydropower outlet (Figure 9). Using the proposed mitigation method, simulations were done with the original and mitigated hydrographs to evaluate the effects (Figure 10, panel A and panel B). A video comparing the dewatering with and without mitigation is shown in Supplementary Figure S1.
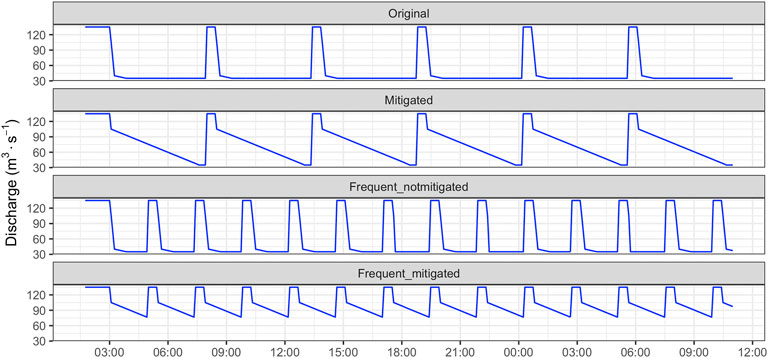
FIGURE 9. A succession of synthetic hydrographs with multiple stops per day. The two upper graphs show the standard hydrograph (original) and mitigated hydrograph (mitigated). The two lower graphs show a frequent succession of starts and stops without mitigation (frequent_notmitigated) and the frequent start–stop scenario with mitigation (frequent_mitigated).
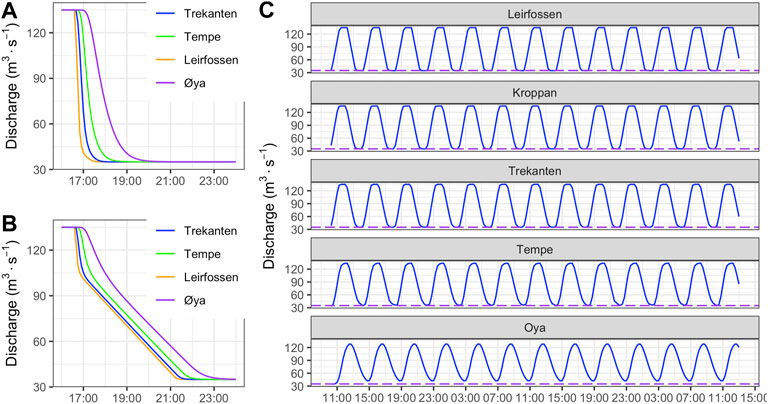
FIGURE 10. Hydrograph propagation. Panel (A) standard hydrograph; Panel (B) mitigated hydrograph; Panel (C) example of frequent start–stop hydrographs with propagation downstream from Leirfossen. The dashed line in panel C shows the level of minimum flow.
Discussion
As a part of the investigations on the feasibility of developing a hydropower turbine capable of multiple starts and stops in a day to provide increased flexibility in an energy market with an increased level of intermittent sources, the environmental impacts and potential mitigation were evaluated. The 2D-hydraulic model HEC-RAS was used to simulate the effect of various peaking hydrographs, and an operational strategy that satisfied the 13 cm/h dewatering rate from the guidelines (Bakken et al., 2021) was created and used to evaluate the potential for mitigation of the adverse effects of the peaking operation.
A detailed assessment of stranding areas and dewatering rates at a small spatial scale requires fine-scale hydraulic modeling, and it is therefore important to have a detailed digital bathymetric model of the terrain and a well-calibrated model. In this project, a special emphasis was made on measuring the potential stranding areas in detail to generate the DEM using sonar and GPS systems. For future applications, bathymetric LiDAR is a technology that could provide even more details in critical areas (e.g., Juarez et al., 2019). The evaluation of the model against measurement shows good accuracy, and this was further controlled by comparison with orthophotos from a drone survey of the stranding site upstream of the Kroppan bridge. Comparing the depth changes at region 2 (Figure 2) with the measured rapid flow variations from Saltveit et al. (2001) also shows good correspondence between the model and observations.
When compared to other studies (e.g., Hauer et al., 2014; Sauterleute et al., 2016; Juarez et al., 2019), the dried-out areas in Nidelva are moderate, with around 9% of the total wetted area of the river at a discharge of 130 m3s−1 dry at the environmental flow at 30 m3s−1. This is explained by long reaches with steep bank slopes and embankments, and a relatively high environmental flow which also contributes to reduced stranding areas. But even with moderate amounts of dry areas, stranding has been observed in Nidelva (Hvidsten 1985), and the river is relevant as a test case for mitigation measures.
From the analysis of the shutdown procedure, a stop time of 270 min was found, and the results show that we would need to release an extra 0.61 mill m3 to reduce the dewatering rate to a level less than the limit for stranding for each turbine stop. The extended stop time is most likely not technically feasible for the turbines currently in operation in Bratsberg, and probably also not economically feasible for the power plant due to the extra water released at each stop of the turbine. The economic cost of this has not been estimated in this project, but the amount of water required per peak for mitigation is significantly larger than the value reported by Juarez et al. (2019) who estimated that 0.014 mill m3 of water was required for each stop to mitigate large dewatering downstream of the Hol 1 power plant in the Storåne river (four Francis turbines, total capacity of 60 m3s−1). The mitigation proposed for Hol 1 was in principle similar to the one presented for Bratsberg with a stop time for the turbine extended from 5 min to 30 min. In Hol 1, one turbine could stop in 5 min as of today since the drop in discharge from 60 to 45 m3s−1 did not cause a large stranding risk, and after that an extended stop was implemented to prevent stranding using the same criteria as in the case presented here. The cost will also be dependent on the number of stops and the estimated price difference of the energy when water is released for environmental purposes and the best price in the market. It is worth noting that the extra water released both in this study and in the study by Juarez et al. (2019) is released through the turbine and will generate income compared to e.g. environmental flows released into bypass reaches.
It is not yet clear if the turbine setup from HydroFlex will have the potential to release water as proposed in the mitigation hydrograph due to possible operational restrictions on low flow releases, similar to the restrictions on the current turbines installed in the Bratsberg power plant (Saltveit et al., 2001). A potential mitigation strategy could be to configure the power plant such that the proposed extended stop could be handled by the turbines, either by using a turbine with the capacity of handling the discharge range specified or maybe with a more realistic method that could be to install several turbines with different capacities. This could solve the technical issues, but the extra water required could still be an issue for implementing the mitigation strategy. Retrofitting a dampening reservoir could be a solution to the need for extra water, but this is not a possible solution at the outlet in Nedre Leirfoss due to the terrain and infrastructure in the vicinity of the outlet. Given the amount of water required for mitigation, Saberi et al. (2021) show that the ACUR system could provide the necessary storage and thereby provide the dampening of the peaking operation. Utilizing a system like ACUR would also remove any technical issues related to a gradual shutdown of the turbine. Whether this is an economically feasible solution has not been evaluated further. Given the relatively restricted locations where critical dewatering is observed in Nidelva, the structural solutions could also be an option as a mitigation measure. This would involve either blocking or ensuring water-covered areas in the side channels (regions R1 and R4, Figure 2), e.g., by installing a weir at the side channel inlet or by constructing a channel that leads water into the side channels at a minimal flow. The design of this channel could be taken from the modeled water level at the inlet (Figure 6). Furthermore, the fast dewatering of the gravel bars (regions R2, R3, and R4) should be prevented either by establishing weirs or by dredging.
In the scenario shown in Figure 10, the frequency and duration of the peaks are such that the river will reach a minimum flow state between each peak. If the number of sub-daily peaks is further increased toward the goal of 30 as specified in the HydroFlex project, we will have periods where the next peak starts before the previous peak has reached the minimum flow level. This will thereby reduce the peak amplitude and reduce the dewatering effect downstream. This is even more the case if we observe the mitigated hydrographs, as shown in Figure 9. Similarly, it is observed that frequent sub-daily ramping dampens the dewatering effect far downstream in the river as the river starts rising again before the previous stop has reached the minimum level. A similar effect was seen by Burman et al. (2020) running similar hydropeaking studies in a bypass reach in the Ume river in Sweden. The downstream effect of a hydropeaking operation in a river will be closely related to the ramping rate and longitudinal dampening in the river due to the morphology which has a large effect on dewatering rates (Hauer et al., 2014; Hauer et al., 2017). The dampening effect is dependent on river morphology and needs to be investigated for each river. It is also worth noting that even if high peak frequency provides a dampening effect, it is very likely that this frequency of peaking will be a rare occurrence due to market constraints (Siemonsmeier et al., 2020) and the periods with less frequent hydropeaking could induce critical dewatering conditions.
Conclusion
Through the detailed hydraulic modeling of frequent hydropeaking, a potential mitigation strategy is devised. The strategy involves increasing the duration of the stop of the power plant to ensure that dewatering rates are below the critical level of 13 cm/h. This involves releasing an extra 0.61 million m3 at each shutdown and requires a turbine that allows the slow shutdown speed. This can be a challenge both for the water budget and economy of the hydropower plant and for the operation of the turbine. A potential solution to this could be to use a dampening reservoir built in the mountains based on the ACUR technology that could store the required water during the start of the turbine and then release this water into the river when the turbine stops, to mimic a slow turbine shutdown. When the frequency of the start and stops increases, an overlap of waves is seen in the river downstream which reduces the dried-out area for each start–stop cycle.
Data availability statement
The data sets presented in this article are not readily available because some data are collected by third parties and made available to the project, and these cannot be released without the consent from the data collectors. The data collected by the project can be had from the corresponding author on request. Requests to access the data sets should be directed to a251dC5hbGZyZWRzZW5AbnRudS5ubw==.
Author contributions
KA supervised the work and was the main author of the study; KA and AG designed the study; AG collected the data and prepared and calibrated the hydraulic model; MG prepared and ran the simulations for the HydroFlex turbine with multiple start and stops in 1 day; MK and SS carried out the simulation of the mitigation measures, designed the mitigation flow regime, and ran the simulations to evaluate its impact. All authors have contributed to the text and have read and edited the final manuscript.
Funding
This work was performed in connection with European Union’s Horizon 2020 research and innovation programme under grant agreement No. 764011, HydroFlex.
Acknowledgments
The authors would like to thank those who contributed to collecting bathymetry data for Nidelva, particularly Ronja Ehlers and Anders Foldvik for kayaking, and Markus Först and Sondre Fossheim at SWECO for running the remote-controlled boat. Also, thanks to Nils Rüther for providing data from the upper part of the river and the Trondheim community for making their data available for use. We also wish to thank Adina Moraru for help with field data collection. Flow data was provided by the Norwegian Directorate of Energy and Water Resources (NVE) through the Hydra II database, and aerial imagery by the Norwegian mapping authority through their repository (www.norgeibilder.no). Map data were collected from the Norwegian Mapping Authority and NVE.
Conflict of interest
SS was employed by the LOS Cable Solutions after his work on the project was finished.
The remaining authors declare that the research was conducted in the absence of any commercial or financial relationships that could be construed as a potential conflict of interest.
Publisher’s note
All claims expressed in this article are solely those of the authors and do not necessarily represent those of their affiliated organizations, or those of the publisher, editors, and reviewers. Any product that may be evaluated in this article, or claim that may be made by its manufacturer, is not guaranteed or endorsed by the publisher.
Supplementary material
The Supplementary Material for this article can be found online at: https://www.frontiersin.org/articles/10.3389/fenvs.2022.944033/full#supplementary-material
References
Auer, S., Zeiringer, B., Führer, S., Tonolla, D., and Schmutz, S. (2017). Effects of river bank heterogeneity and time of day on drift and stranding of juvenile European grayling (Thymallus thymallus L.) caused by hydropeaking. Sci. Total Environ. 575, 1515–1521. doi:10.1016/j.scitotenv.2016.10.029
Bakken, T. H., Harby, A., Forseth, T., Ugedal, O., Sauterleute, J., Halleraker, J. H., et al. (2021). Classification of hydropeaking impacts on Atlantic salmon populations in regulated rivers. River Res. Appl. doi:10.1002/rra.3917
Batalla, R., Gibbins, C., Alcazar, J., Brasington, J., Buendia, C., Garcia, C., et al. (2021). Hydropeaked rivers need attention. Environ. Res. Lett. 16 (2), 021001. doi:10.1088/1748-9326/abce26
Bejarano, M., Jansson, R., and Nilsson, C. (2017). The effects of hydropeaking on riverine plants: A review. Biol. Rev. 93 (1), 658–673. doi:10.1111/brv.12362
Bruder, A., Tonolla, D., Schweizer, S., Vollenweider, S., Langhans, D., and Wüest, A. (2016). A conceptual framework for hydropeaking mitigation. Sci. total Environ. 568, 1204–1212. doi:10.1016/j.scitotenv.2016.05.032
Bruno, M., Siviglia, A., Carolli, M., and Maiolini, B. (2013). Multiple drift responses of benthic invertebrates to interacting hydropeaking and thermopeaking waves. Ecohydrology 6 (4), 511–522. doi:10.1002/eco.1275
Burman, A., Andersson, A., Hellström, J., and Angele, K. (2020). Case study of transient dynamics in a bypass reach. Water 12, 1585. doi:10.3390/w12061585
Casas-Mulet, R., Alfredsen, K., Brabrand, Å., and Saltveit, S. J. (2016). Hydropower operations in groundwater-influenced rivers: Implications for atlantic salmon, Salmo salar, early life stage development and survival. Fish. Manag. Ecol. 2, 144–151. doi:10.1111/fme.12165
Casas-Mulet, R., Saltveit, S. J., and Alfredsen, K. (2014). The survival of atlantic salmon (Salmo salar) eggs during dewatering in a river subjected to hydropeaking. River Res. Appl. 31, 433–446. doi:10.1002/rra.2827
O. Edenhofer, R. Pichs-Madruga, Y. Sokona, K. Seyboth, P. Matschoss, S. Kadneret al. (Editors) (2011). IPCC special report on renewable energy sources and climate change mitigation (Cambridge UK and New York USA: Cambrigde University Press).
Greimel, F., Schültling, L., Graf, W., Bondar-Kunze, E., Auer, S., Zeiringer, B., et al. (2018). Hydropeaking impacts and mitigation. Riverine ecosystem management, 8. Springer.
Halleraker, J. H., Kenawi, M., L’Abée-Lund, J., Bakken, T. H., and Alfredsen, K. (2022). Assessment of flow ramping in water bodies impacted by hydropower operation in Norway – is hydropower with environmental restrictions more sustainable? Sci. total Environ. 832, 154776. doi:10.1016/j.scitotenv.2022.154776
Harby, A., Noack, M., Harby, A., Kemp, P., and Wood, P. (2013). Ecohydraulics - an integrated approach. I. Maddock. in Rapid flow fluctuations impacts fish aquatic eco- Syst. (Chichester: John Wiley & Sons), 1, 437.
Hauer, C., Holzapfel, P., Leitner, P., and Graf, W. (2017). Longitudinal assessment of hydropeaking impacts on various scales for an improved process understanding and the design of mitigation measures. Sci. total Environ. 575, 1503–1514. doi:10.1016/j.scitotenv.2016.10.031
Hauer, C., Unfer, G., Holzapfel, P., Haimann, M., and Habersack, H. (2014). Impact of channel bar form and grain size variability on estimated stranding risk of juvenile Brown trout during hydropeaking. Earth Surf. Process. Landf. 39, 1622–1641. doi:10.1002/esp.3552
Hayes, D., Moreira, M., Boavida, I., Haslauer, M., Unfer, G., Zeiringer, B., et al. (2019). Life stage-specific hydropeaking flow rules. Sustainability 11 (6), 1547. doi:10.3390/su11061547
Hayes, D., Schültling, L., Carolli, M., Greimel, F., Batalla, R., Casas-Mulet, R., et al. (2021). Hydropeaking: Processes, effects, and mitigation. Encyclopedia of inland waters. second edition. Warner: D. Chapman and SElsevier.
Hedger, R., Sauterleute, J., Sundt-Hansen, L., Forseth, T., Ugedal, O., Diserud, O., et al. (2018). Modelling the effect of hydropeaking-induced stranding mortality on Atlantic salmon population abundance. Ecohydrology 11 (5), e1960. doi:10.1002/eco.1960
Hvidsten, N. A. (1985). Mortality of pre-smolt Atlantic salmon Salmo Salar L and Brown trout Salmo Trutta L subjected caused by fluctuating water levels in the regulated river Nidelva. J. Fish. Biol. 27, 711–718. doi:10.1111/j.1095-8649.1985.tb03215.x
Juarez, A., Adeva-Bustos, A., Alfredsen, K., and Dønnum, B. (2019). Performance of A Two-Dimensional hydraulic model for the evaluation of stranding areas and characterization of rapid fluctuations in hydropeaking rivers. Water 11, 201. doi:10.3390/w11020201
Kjærstad, G., Ja, A., and Herland, A. (2018). Effects of hydropeaking on benthic invertebrate community composition in two central Norwegian rivers. River Res. Appl.River Res. Appl. 34, 218–231. doi:10.1002/rra.3241
Meier, P., Manso, P., Bieri, M., Schleiss, A., Schweizer, S., Fankhauser, A., et al. (2016). Hydro-peaking mitigation measures: Performance of a complex compensation basin considering future system extensions. Montreux, Switzerland: Hydropopwer and Dams.
Moreira, M., Hayes, D., Boavida, I., Schletterer, M., Schmutz, S., and Pinheiro, A. (2019). Ecologically-based criteria for hydropeaking mitigation: A review. Sci. total Environ. 657, 1508–1522. doi:10.1016/j.scitotenv.2018.12.107
R Core Team (2019). R: A language and environment for statistical computing. Vienna, Austria: R Foundation for Statistical Computing.
Saberi, O., Storli, P.-T., and Alfredsen, K. (2021). New technology to increase hydropower plant operational flexibility. Int. J. Hydraulic Eng. 10 (1), 1–7.
Saltveit, S. J., Brabrand, Å., Juarez, A., Stickler, M., and Dønnum, B. (2020). The impact of hydropeaking on juvenile Brown trout (Salmo trutta) in a Norwegian regulated river. Sustainability 12 (20), 8670. doi:10.3390/su12208670
Saltveit, S. J., Halleraker, J. H., Arnekleiv, J. V., and Harby, A. (2001). Field experiments on stranding in juvenile atlantic salmon (Salmo salar) and Brown trout (Salmo trutta) during rapid flow decreases caused by hydropeaking. Regul. Rivers Res. Mgmt. 17, 609–622. doi:10.1002/rrr.652
Sauterleute, J., Hedger, R., Hauer, C., Skoglund, H., Sundt-Hansen, L., Bakken, T. H., et al. (2016). Modelling the effects of stranding on the Atlantic salmon population in the Dale River, Norway. Sci. total Environ. 573, 574–584. doi:10.1016/j.scitotenv.2016.08.080
Schmutz, S., Bakken, T. H., Friederich, T., Greimel, F., Harby, A., Jungwirth, M., et al. (2015). Response of fish communities to hydrological and morphological alterations in hydropeaking rivers of Austria. River Res. Appl. 31, 919–930. doi:10.1002/rra.2795
Siemonsmeier, M., Wirtz, P., and Scönefeld, M. (2020). “Investigating the flexibilization of hydraulic storage power plants in the nordics,” in 2020 IEEE Electric Powe and Energy Conference (EPEC) (Edmonton, AB, Canada: IEEE).
Spiller, S., Rüther, N., Belete, K. W., and Strellis, B. (2011). Assessing environmental effects of hydropower peaking by 3D numerical modeling. 34. Dresdner Wasserbaukolloquium 2011: Wasserkraft – mehr Wirkungsgrad + mehr Ökologie = mehr Zukunft. Dresden, Germany. Dresdner Wasserbauliche Mittl. 45, 79–86.
Storli, P.-T., and Lundström, T. (2019). A new technical concept for water management and possible uses in future water systems. Water 11, 2528. doi:10.3390/w11122528
Tekle, M. (2021). Hydraulic modeling of flow ramping related to river morphology and river geometry. Trondheim, Norway: NTNU.
Tonolla, D., Bruder, A., and Schweizer, S. (2017). Evaluation of mitigation measures to reduce hydropeaking impacts on river ecosystems – A case study from the Swiss alps. Sci. total Environ. 574, 594–604. doi:10.1016/j.scitotenv.2016.09.101
Vanzo, D., Tancon, M., Zolezzi, G., Alfredsen, K., and Siviglia, A. (2016). “A modeling approach for the quantification of fish stranding risk: The case of lundesokna river (Norway),” in Proceedings from the 11th International Symposium on Ecohydraulics (Melbourne, Australia: ISE).
Keywords: hydropower, hydropeaking, hydraulic modeling, environmental impacts, hydropeaking mitigation
Citation: Alfredsen K, Juárez-Goméz A, Refaei Kenawi MS, Graf MS and Saha SK (2022) Mitigation of environmental effects of frequent flow ramping scenarios in a regulated river. Front. Environ. Sci. 10:944033. doi: 10.3389/fenvs.2022.944033
Received: 14 May 2022; Accepted: 20 October 2022;
Published: 17 November 2022.
Edited by:
Riccardo Fornaroli, University of Milano-Bicocca, ItalyReviewed by:
Daniela Rosero-López, Universidad San Francisco de Quito, EcuadorRafael Muñoz-Mas, Universitat Politècnica de València, Spain
Copyright © 2022 Alfredsen, Juárez-Goméz, Refaei Kenawi, Graf and Saha. This is an open-access article distributed under the terms of the Creative Commons Attribution License (CC BY). The use, distribution or reproduction in other forums is permitted, provided the original author(s) and the copyright owner(s) are credited and that the original publication in this journal is cited, in accordance with accepted academic practice. No use, distribution or reproduction is permitted which does not comply with these terms.
*Correspondence: Knut Alfredsen, a251dC5hbGZyZWRzZW5AbnRudS5ubw==