 Zhi Chen
 Han Yan
 Chao Yang
94% of researchers rate our articles as excellent or good
Learn more about the work of our research integrity team to safeguard the quality of each article we publish.
Find out more
ORIGINAL RESEARCH article
Front. Environ. Sci., 22 July 2022
Sec. Environmental Economics and Management
Volume 10 - 2022 | https://doi.org/10.3389/fenvs.2022.942857
This article is part of the Research TopicClimate Change Information for Regional Impact and Risk AssessmentView all 10 articles
By using micro-farm household survey data from six counties in the Hubei and Yunnan provinces, warm days, heavy precipitation, and consecutive dry days were selected as extreme weather measures, and the RClimDex software was used to empirically examine the impacts of extreme weather on farm household poverty vulnerability by setting percentile thresholds to measure extreme weather indicators in each district and county in 2017. Based on the improved Department for International Development sustainable livelihoods analysis framework, the entropy value method was used to synthesize the variables in the farm household sustainable livelihood capacity to examine their mediating effects. The results were as follows: 1) Extreme weather significantly affected farm household poverty vulnerability. Warm days were significantly and negatively related to farmers’ poverty vulnerability, while total heavy precipitation and consecutive dry days were significantly and positively related to farmers’ poverty vulnerability. 2) The impacts of extreme weather on farmers with different vulnerability characteristics varied. 3) The sustainable livelihood capacity of farm households played a partially mediating role in the process of extreme weather indicators of persistent drought index affecting the poverty vulnerability of farm households. 4) As compared to rural households engaged in non-agricultural industries, agricultural production and operation-based farming households were more vulnerable to shocks from extreme weather. Accordingly, we recommended that to improve farmers’ climate resilience, differentiated policies should be adopted according to local conditions; climate-sensitive vulnerable groups should be identified; agricultural insurance coverage should be expanded; farmers should be guided into entrepreneurship; and equalization of public services should be equalized so as to avoid farmers becoming impoverished due to extreme weather.
As globalization develops, poverty has long been not confined to a single country or region but has become a global problem. Eliminating poverty is the mission of all humanity (Ul Haq, 1995). China is the world’s largest developing country and whose poverty alleviation initiatives directly affect the governance of global poverty. By 2020, China’s battle against poverty achieved relatively good results and relieved the poverty of 98.99 million rural poor people and removed 832 poor counties and 128,000 poor villages from the poverty list, according to the current standards. China has completed the historic task of eradicating absolute poverty and successfully established a comprehensive well-off society (Huang and Zhu, 2021). However, vulnerability theory suggests that risk, vulnerability, and poverty are closely linked. The livelihoods of the average farm household are vulnerable to shocks from various risks such as climate, health, and disasters that can cause them fall below the poverty line (Azeem et al., 2016). Especially in rural areas, the frequent occurrence of sudden climatic disasters such as floods and droughts intertwined with slow-onset climate changes such as global warming, continuously intensify the harm to agricultural production. Simultaneously, extreme weather can cause severe losses to farmers’ natural, physical, human, social, and financial capital, which can leave them impoverished and at increased risk of poverty (Gentle and Maraseni, 2012).
International attention to climate changes such as extreme weather and climate warming has a long history, and scholars and policymakers were originally focused on emission reductions under different scenarios (Füssel, 2007). However, the effects of mitigation policies often take decades to test, so how to adapt to climate change is beginning to attract the attention of scholars and policymakers. The United Nations Framework Convention on Climate Change (UNFFCC), which entered into force in 1994 and was attended by 189 countries, provided the first international policy framework to guide countries in addressing climate change, followed by a wealth of research on how to improve climate change adaptation (Ford et al., 2010). The adaptations concerned abrupt climate changes, including extreme weather and climate disasters that can involve droughts, floods, heatwaves, and cold temperatures. The main characteristic of extreme weather is that it appears quickly and suddenly, and the time elapsed from the perception of the disaster to the appearance of the disaster is relatively short. During its appearance, it can destroy houses and farmland, damage public facilities, and seriously threaten the lives and property of farmers. Meanwhile, it can trigger secondary disasters such as pests and diseases as well as livestock and poultry epidemics, thus forming a chain of disaster networks that have a significant impact on agricultural production and life and be-comes an essential factor leading to poverty among farmers (Nguyen et al., 2020). Consequently, the mechanisms by which sudden climate changes, including extreme weather, affect poverty have also gradually become a focus of scholarly attention.
In academic circles, it is generally acknowledged that individual and household exposure to extreme weather hazards is a key factor in poverty. Extreme weather can exacerbate poverty directly or indirectly through threats to life and property, poverty traps, and “elite capture,” especially in less developed countries and regions (Dasgupta and Baschieri, 2010; Leichenko and Silva, 2014; Fagariba et al., 2018; Li et al., 2019; Azzarri and Signorelli, 2020). Rodriguez-Oreggia et al. (2013) argued that extreme weather, especially floods and droughts, could significantly reduce human development and increase poverty. Excessive urbanization, environmental degradation, and weak disaster response capacity could impact poor communities that were already vulnerable to extreme weather events such as floods. Walker (2014) also concluded that drought could plunge an entire country into a natural emergency with the accompanying economic downturn, which could lead to widespread poverty in rural areas. Bui et al. (2014) and Arouri et al. (2015) studied the effects of extreme weather hazards on household income, expenditures, poverty, and inequality through a survey of rural households in Vietnam. They found that all three extreme weather types, including storms, floods, and droughts, negatively impacted household income and expenditure and that climatic hazards increased rural household poverty and inequality. On this basis, Nguyen et al. (2020) collected panel data from approximately 4000 rural households in northeast Thailand and central Vietnam to examine and compare the effects of floods, droughts, and storms on the welfare of rural families in both countries. They pointed out that extreme weather shocks significantly affected household income, consumption, and poverty, in both countries, but with different severity. The aforementioned studies were empirical analyses based on field research data from regions with high climate impacts that verified the direct relationship be-tween weather extremes and poverty. However, many scholars have also explored the mechanisms of extreme weather and their impact on poverty from other theoretical perspectives.
For example, first, there is a non-benign geographic coupling effect between the distribution of poor areas and the ecologically fragile regions of China since environ-mentally weak areas are often those most severely affected by extreme weather so that extreme weather exacerbates poverty through ecological vulnerability (Tong and Long, 2003). Cao et al. (2015) constructed an economic poverty evaluation index system that considered the natural, social, and economic aspects and analyzed the degree of coupling and coordination between ecological assets and economic poverty in the concentrated contiguous hard-ship areas in Qinba, China. They found that most counties and cities in the region had significant coupling between ecological assets and economic poverty. Specifically, the lower the environmental assets, the higher the degree of monetary poverty in the region. Li and Wang (2014) analyzed the coupling characteristics of ecological environment quality and economic poverty in areas with severe environmental degradation and found that there was a high spatial autocorrelation between ecological environment quality and per capita disposable income, but the overall degree of synchronization was poor. Zhang and Feng (2020) explored the correlation, consistency, and coordination between economic poverty alleviation and ecological poverty alleviation by using the entropy value method and coupling coordination degree model in concentrated, contiguous poverty areas in Yunnan Province, China. The results showed that the coupling degree of the four regions in Yunnan Province was high, but the coupling coordination degree was low. Zhou et al. (2021) calculated the coupling degree and coupling coordination of ecosystem services and poverty livelihoods in 717 poor counties in China from 2000 to 2015. They found that ecosystem service functions showed a trend of decreasing, and then in-creasing, while the poverty levels showed an increasing trend, and the degree of conflict in the coupling relationship between ecosystem services and poverty livelihoods was high.
Second, from a sustainable livelihoods perspective, farm households are highly dependent on natural resources for their livelihood activities. Natural disasters such as extreme weather can cause significant losses to farmers’ livelihood assets, adverse im-pacts on sustainable income, and even substantial lifestyle changes, leading to poverty among farmers (Motsholapheko et al., 2015). Carter et al. (2007) analyzed the long-term effects of extreme weather on asset stocks and economic growth using the least squares (OLS) method. They showed that extreme weather was likely to deprive the poor of capital, creating a poverty trap from which they would struggle to escape. Nevertheless, some scholars have argued that the impact of natural disasters such as extreme weather on poverty have not always been negative and that poor people in developing countries were more vulnerable to extreme weather (Loayza et al., 2012). Mottaleb et al. (2013) suggested that during natural disasters such as extreme weather, farming households may increase their food expenditures and reduce their education expenditures, thus adversely affecting long-term human capital development. Van den Berg and Burger (2017) studied the impact of hurricanes on household livelihood strategies in rural areas and found that the direct or indirect effects of hurricanes resulted in more than 60% of the rural population choosing low welfare strategies that made them more vulnerable to poverty. Yiridomoh et al. (2021) studied the impact of extreme weather on rural livelihood sustainability using communities along the Black Volta River in Siva State as the unit of analysis and found that short-term, unstable extreme weather such as drought and high temperatures affected the livelihoods of farm households, thereby increasing poverty.
Finally, from a vulnerability perspective, social vulnerability has been closely related to poverty. Poverty increases vulnerability by influencing resource availability, the perceptions of the impact of natural hazards such as extreme weather, and the ability to invest in risk reduction, becoming an essential component of social vulnerability. In general, poorer communities suffer more difficulty in post-disaster recovery (Schmidtlein et al., 2011). A study by Jiang et al. (2012) found that higher agricultural dependence was more likely to trigger poverty, and natural disasters such as extreme weather significantly impacted poverty incidence. Zhang (2011) found that natural hazards such as extreme weather and poverty have overlap and consistency in poor minority communities. There were sequential and cyclical relationships among extreme weather, vulnerability, viability, and poverty. Zhou et al. (2015) constructed the first disaster risk index for China and assessed the relative risk levels at a provincial scale in China, suggesting that reducing vulnerability and population exposure to natural hazards would be an effective measure to mitigate disaster risk in Chinese hotspots. Ding et al. (2014) argued that the education level of household members and household labor capacity would play an essential role in reducing vulnerability. Increasing school attendance and educational background could reduce the vulnerability of farm households.
While all of the above studies have acknowledged poverty as part of social vulnerability, quite a few scholars have considered vulnerability as an essential aspect of poverty and thus proposed the concept of poverty vulnerability (Feng et al., 2017). The World Bank defines poverty vulnerability as the likelihood of falling into poverty in the future. Declining crop harvests, rising food prices, and significant household labor decreases can increase poverty vulnerability. Therefore, poverty should no longer be interpreted limited to fundamental social welfare indicators based on low income but should also include vulnerability to poverty caused by external shocks (W Bank, 2001). Bohua et al. (2013) argued that the main factors affecting the poverty vulnerability in farm households were relatively low economic status, inadequate social security, and poor natural environmental resources. After analyzing the impact of natural disasters such as extreme weather on the vulnerability of farm households to poverty, Thouret et al. (2013) found that maintaining water and soil, increasing the area of greenery, and increasing the proportion of low-income households could effectively counteract the risk of drought and alleviate poverty. Liu et al. (2022) measured the level of poverty vulnerability in farm households and explored the degree of differentiation, taking the Qinba mountainous region as an example. The farmers’ exposure risk and resilience were geographically differentiated, and the farmers in the central mountainous areas were at higher risk and more vulnerable to poverty from natural disasters such as extreme weather. Maganga et al. (2021) used panel data from 2010, 2013, and 2016 Living Standards Measurement Surveys in Malawi to examine the extent to which climate change affected the vulnerability of farm households to poverty and the relationship between post-poverty and poverty transition and climate change. From the existing studies, scholars have increasingly focused on the impact of extreme weather and climate changes on the poverty vulnerability of farm households and have focused their research on developing countries that have been most affected. However, their data collection on extreme weather and climate changes have been sourced from local weather stations and farmer perception surveys and have not been considered at the county level (Jalal et al., 2021; Samuels et al., 2022). Li et al. (2022) studied the impact of climate change on individual poverty vulnerability in rural China based on county-level climate data and micro-survey data (CHIPS) and found that extreme temperatures reduced poverty vulnerability. However, they only explored the effect of extreme temperatures on poverty vulnerability and did not consider the relevant role of other extreme weather such as extreme precipitation. The World Meteorological Organization (WMO) and the World Climate Research Program (WCRP), have jointly established the Expert Group on Climate Change Detection and Indices (ETCCDI), which has defined 27 representative climate indices for global and regional studies on extreme climate change (Rodriguez-Sola et al., 2022). Therefore, the inclusion of other extreme weather-related indicators in the discussion could have profound implications for the comprehensive evaluation of extreme weather on the poverty vulnerability of farm households.
The impact of extreme weather on poverty vulnerability is often more pronounced in developing countries or regions, one of which is China (Schmidtlein et al., 2011). China is one of the most at-risk countries for natural disasters. China’s meteorological disasters and derived disaster losses have accounted for more than 70% of natural disaster losses, and the average annual direct economic losses account for ap-proximately 75% of natural disaster financial losses, resulting in approximately 80% of the deaths caused by natural disasters (Zhang and Wang, 2022). According to the China Meteorological Ad-ministration disaster database, in 2018, China’s meteorological disasters caused 20.81 million hectares of crop damage, 635 deaths and disappearances, and direct economic losses of CYN 264.5 billion. In 2021, Henan, Sichuan, Shanxi, Hebei, Hubei, and Shaanxi suffered severe torrential rainfall and flooding in the second half of the year, causing a total of 59.01 million people affected, 590 deaths and disappearances due to the disaster, 152,000 collapsed houses, and direct economic losses of CYN 245.89 billion. China ranks fourth and second in the world for average annual deaths and economic losses caused by extreme weather, respectively, with an average of more than 1200 deaths per year from extreme weather events (Li and Mao, 2019). Based on the extreme weather statistics in recent years, extreme weather has become a critical risk factor impacting the vulnerability of Chinese farmers, seriously affecting their livelihoods, their safety, and their land. Therefore, studying the impact of extreme weather on farmers’ poverty vulnerability in China is of great practical importance for other developing countries to avoid poverty among ordinary farmers and prevent farmers who have left poverty from becoming impoverished again.
In summary, farmers remain at risk of becoming or returning to poverty when faced with risks such as extreme weather. Therefore, exploring the mechanisms of extreme weather on the vulnerability of farm households to poverty and providing policy recommendations are of great importance to consolidate and expand poverty alleviation in China and achieve the goal of rural revitalization. In the meantime, the inclusion of other extreme weather-related indicators in the discussion could have profound implications for the comprehensive evaluation of extreme weather on the poverty vulnerability of farm households. In this paper, the three most representative of the 27 extreme climate indicators, including warm days (TX90p), the sum of heavy precipitation (R95p), and the consecutive dry days (CDD), were selected and calculated with RClimDex software, which was developed by Zhang and Yang (Canadian Meteorological Research Centre) based on the R language environment, to explore the impact of extreme weather on the poverty vulnerability of rural off-poverty farmers in China (Zhang and Yang, 2004). These findings are of great importance to consolidate and expand poverty alleviation in China and achieve the goal of rural revitalization. In the meantime, this study also provides valuable references for other developing countries to avoid poverty among ordinary farmers and prevent farmers who have left poverty from becoming impoverished again.
More than 70% of meteorological disasters in China have occurred in the central and western poverty areas (Liu, 2019). At the beginning of 2017, there were 25 poor counties in Hubei Province in central China, with 5,721,856 people in poverty and a poverty incidence rate of 14.21%. There were 72 extreme high-temperature events, 22 extreme low-temperature events and 7 extreme precipitation events throughout the year, slightly higher than in previous years. The frequent occurrences of various climatic disasters have posed a severe threat to the safety of people and property. The vulnerability of farmers to climatic disasters has further exacerbated the problem of rural poverty. At the beginning of 2017, there were 33 poor counties in Yunnan Province, with a poor population of 4,630,210 people and a poverty incidence rate of 11.34%. The frequent occurrence of extreme weather events poses a severe threat to the property and security of the poor in these two provinces, further increasing poverty vulnerability. There were 95 extreme high temperature events, 11 extreme low temperature events and 23 extreme precipitation events throughout the year, slightly lower than previous years. Therefore, two poverty counties in Hubei Province and four poverty counties in Yunnan Province in southwestern China were selected as the subjects of this paper (as shown in Figures 1, 2). The geographical locations and climatic characteristics of the six counties were as follows:
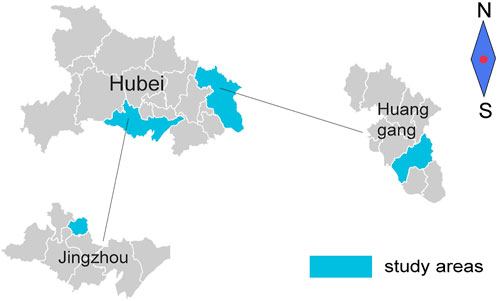
FIGURE 1. Study areas—Qichun County and Shashi District in Hubei Province.
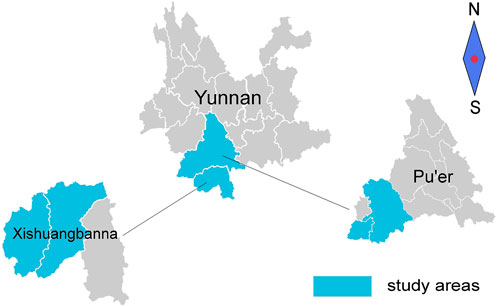
FIGURE 2. Study areas—Lancang County, Menglian County, Menghai Country and Jinghong City in Yunnan Province.
Qichun County, Huanggang City, Hubei Province (115°12′–115°56′E, 29°59′–30°40′N), is located in southeastern Hubei Province, north of the middle reaches of the Yangtze River, with an area of approximately 2398 square kilometers and a resident population of 792,101. Qichun County belongs to the subtropical continental monsoon climate, with four distinct seasons, abundant rainfall, a mild climate, an average annual frost-free period of 249.1 days, precipitation of 1341.7 mm, and 2025.8 sunshine hours with an average temperature of 16.8°C.
Shashi District, Jingzhou City, Hubei Province (112°13′–112°31′E, 30°12′–30°25′N) is located in the south of Hubei Province, on the north bank of the Jing River section of the Yangtze River, with an area of approximately 522.75 square kilometers and a resident population of 504,893 people. Shashi District belongs to the subtropical humid monsoon climate zone, with four distinct seasons, excellent heat, and abundant rainfall. The average annual temperature is 16.1°C, the annual frost-free period is 230–270 days long, the annual rainfall is generally between 958 and 1325mm, and the average relative humidity is 80%.
Lancang County, Pu’er City, Yunnan Province (99°29′–100°35′E, 22°01′–23°16′N) is located in the southwest of Yunnan Province, named after the Lancang River in the East, with an area of approximately 8807 square kilometers, the second-largest county in Yunnan Province, and a resident population of approximately 441,455. Located south of the Tropic of Cancer, Lancang County has a southern subtropical mountainous monsoon climate with wet summers and dry winters, abundant rainfall, and sufficient sunshine. Due to the complex topography and altitude difference, the three-dimensional climate is apparent, with high temperature, sufficient heat, an annual average temperature of 19.2°C, annual rainfall of 1624.0 mm, and annual sun-shine of 2098.0 h.
Menglian County, Pu’er City, Yunnan Province (99°9′–99°46′E, 22°15′–22°32′N), located in the southwest of Yunnan Province, is an essential gateway to Myanmar, Thailand, and other Southeast Asian countries. As of the end of 2018, Menglian County has an area of approximately 1893.42 square kilometers and a resident population of 144,693 people. Menglian County has a southern subtropical climate. The climate in the territory has abrupt changes, with no severe cold in winter, no summer heat, and four seasons similar to spring conditions. The average annual temperature is 19.6°C, the average annual rainfall is 1373mm, the annual rainy days are approximately 170, and the average annual sunshine is 2048.6 h. The wind speed is generally 3, with a maximum of 6–7.
Jinghong City, Xishuangbanna, Yunnan Province (100°25′–101°31′E, 21°27′–22°36′N) is located in the south of Yunnan Province, with a land area of approximately 6867 square kilometers and a resident population of 416,054. Jinghong City has a year-round high temperature and low rainfall, which means drought is heavy. The main meteorological disasters are high temperature and drought, wind and hail disasters, and torrential flooding, including winter and spring drought, which is unusually heavy.
Menghai County, Xishuangbanna, Yunnan Province (99°56′–100°41′E, 21°28′–22°28′N), located in the southwest of Yunnan Province, has a land area of 5368.09 square kilometers and a resident population of 353,720. Menghai County belongs to the tropical and subtropical southwest monsoon climate, with no severe cold in winter and summer heat, slight annual temperature differences, and significant daily temperature differences. The average annual temperature is 18.7°C, the average annual sunshine is 2088 h, the average annual rainfall is 1341mm, and the annual frost period is ap-proximately 32 days. There are many fog patches, and the average annual fog is 107.5–160.2 days.
The data used in this study were derived from the survey data of farmers’ livelihoods collected by the research team in Hubei and Yunnan provinces in 2017. To ensure the comprehensiveness and reliability of the survey data, the sample areas were selected from two provinces located in relatively rich and relatively poor areas, the questionnaire method was adopted, and a combination of stratified random sampling and targeted sampling was used to conduct the questionnaire survey among households. The specific operation was to first classify the townships in the county into high, medium and low categories according to the depth of poverty; then determine the number of sample farmers from each type of township according to the proportion of the number of farm households in each type of township to the total number of farm households in the county; finally, go to each township to draw samples from the relevant farm households according to the random principle. Eventually, 541, 326, 77, 111, 22 and 37 farming households were sampled in each of the six districts and counties (Qichun County, Shashi District, Lancang County, Menglian County, Jinghong City, Menghai County), and the final number of valid sample farmers was 1,214. The survey included demographic information, natural and physical capital, social and financial capital, agricultural and non-agricultural situations and income, consumption expenditure, agricultural policies, land and homestead status of farm households, etc. After data processing using STATA software and removing the outliers and missing values of vital variable indicators, 1,114 valid respondents were obtained.
The uneven distribution of weather stations in China is manifested by a higher density of weather stations in eastern China and fewer stations in the west, making it difficult to obtain accurate county-level extreme weather data. Therefore, this paper used global climate data from the National Oceanic and Atmospheric Administration (NOAA) Climate Prediction Center (CPC) to precisely match the geographical locations of six counties in Hubei and Yunnan at a latitude and longitude of 0.1 × 0.1, solving the problem of inaccurate climate data from local weather stations. We collected more than 10 types of day-by-day climate data such as temperature, precipitation, sunshine, and wind speed, from 1980 to 2017 in 6 counties, keeping 6 indicators: year, month, day, daily maximum temperature, daily minimum temperature, and daily precipitation.
The dependent variables in this study was poverty vulnerability. Poverty vulnerability refers to the likelihood that a household or individual will fall into poverty or persistent poverty in the future. Among the past definitions and measures of poverty vulnerability, there are three main representative ones, which are “vulnerability as expected poverty (VEP)", “vulnerability as low expected utility (VEU)", and “vulnerability as uninsured exposure to risk (VER)". Of these, the VEP is prospective and more applicable to cross-sectional data as it better reflects the dynamic characteristics of poverty than the others (Wang et al., 2020). Therefore, in this paper, the measure of poverty vulnerability of farm households in the data was selected under the definition of VEP, as proposed by Chaudhuri et al. (2002).
The theory of poverty vulnerability measurement under the VEP definition assumes that the magnitude of household poverty vulnerability is associated with the characteristics of the distribution of the household’s future welfare level, and thus the likelihood of a household or individual falling into poverty or persistent poverty in the next period is calculated through the current period household or individual characteristics variables (Xiao et al., 2020). The basic equation is shown below.
where the left-hand side of the equation represents the poverty vulnerability of household h in period t, and the right-hand side of the equation represents the probability that the per capita income level of farm household h in period t+1 is less than the poverty line.
Since the future per capita income level of a household usually depends on multiple factors, including both observable individual characteristics such as age, gender, marital status, and household characteristics such as household size, natural capital, physical capital, and social capital, and unobservable variables such as the general environment in which the household is located, the following function can be constructed to measure the future per capita income level of a household:
where
Assuming that the future per capita income of households follows a normal distribution, this paper drew on the three-step feasible generalized least squared (FGLS) method, as proposed by Amemiya (1977), to achieve a measure of vulnerability to poverty.
First, an OLS regression was performed on the logarithm of the household per capita income level
Second, since the fluctuating term of income also depended on a series of individual or household characteristic variables, the equation can be constructed as follows:
Applying the error term obtained from OLS estimation of Eq. 4, 5 yields:
Furthermore, we obtained the expectation and variance of logarithm of per capita income of farmer households by dividing both sides of Eq. 5 by
Finally, based on the above estimates, the poverty vulnerability of household h in period t was calculated as:
where
This study used the national poverty line standard household per capita income of RMB 2300/year determined in 2011 in China, the comparable 2017 price of RMB 3449/year extrapolated at constant RMB 2300/year, and the World Bank extreme poverty line standard of USD 1.9/person/day to measure the poverty vulnerability of farm households. In addition, to facilitate the interpretation and analysis of the variables, all poverty vulnerabilities obtained in this paper were multiplied by 100, and the units were uniformly converted to percentages.
The various indices (27 in total) of the extreme climate indicator system provided by ETCCDMI have been widely adopted by many scholars in geography, meteorology and agriculture in recent years (Rodriguez-Sola et al., 2022). Eleven of these indicators are related to precipitation, and sixteen are related to temperature. All extreme weather indicators reflect temperature and precipitation extreme events in terms of intensity, frequency, and duration of climate change. Since Hubei and Yunnan provinces are located in central and southwestern China, respectively, the average daily minimum temperature throughout the year rarely falls below 0°C; we did not consider the indicator used to measure shallow temperatures as our dependent variable. Finally, we selected three indicators, warm days (TX90p), the sum of heavy precipitation (R95p), and the consecutive dry days (CDD), as independent variables in this paper, used to study the effects of high temperature, flooding, and drought on poverty vulnerability, respectively. The RClimDex software was then used to calculate the three extreme climate indicators for each county in 2017. The specific process was as follows: for TX90p and R95p, the percentile threshold method was used, using the climate data of each county from 1980 to 2016 as a reference base, ranking the same indicators within this period from smallest to largest, and defining the values higher than the corresponding indicators located at 90% or 95% of the reference year as extreme climate events; for CDD, the maximum number of consecutive days with daily precipitation less than 1 mm was counted. Specific indicators are defined, as shown in Table 1.
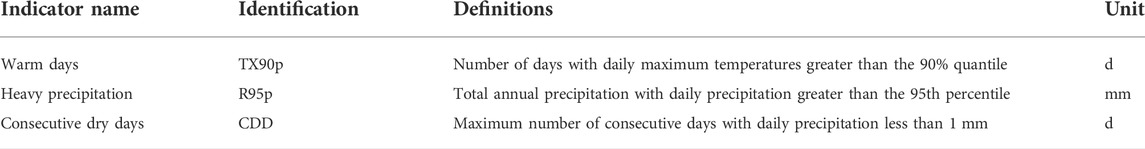
TABLE 1. Evaluation system for constructing extreme weather indicators.
The study used the sustainable livelihood capacity of farm households as a mediating variable to test the mechanisms underlying the effect of extreme weather on the vulnerability of farm households to poverty. In the construction of indicators, based on the improved DFID (Department for International Development) sustainable livelihoods analysis framework, 12 indicators in seven dimensions, namely human capital, financial capital, physical capital, natural capital, social capital, information capital, and environmental capital, were selected based on the approach of Liu et al. (2021), and the sustainable livelihood capacity of farm households was comprehensively measured. The measurements were obtained via the entropy method, and the upper and lower 1% of the measured comprehensive values were scaled down using the winsorization. The intermediate variable indicators were used to construct the evaluation system, as shown in Table 2.
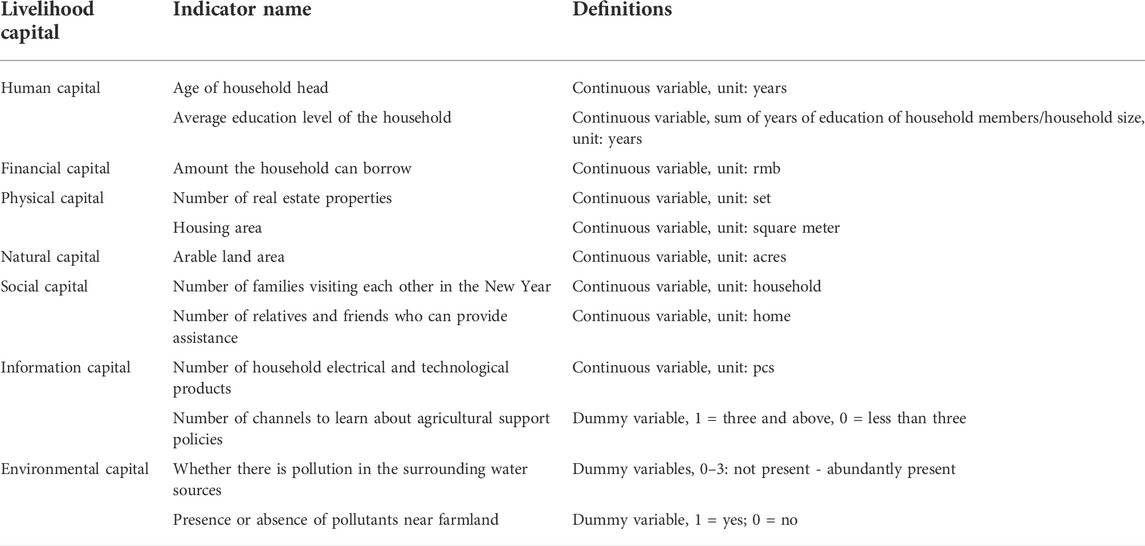
TABLE 2. Evaluation system for constructing indicators of sustainable livelihood capacity of farm households.
Based on the previous literature, this study applied individual characteristics (gender of household head, health level, marriage status, non-farm working time) and household characteristics (information accessibility, land transfer, number of farm machinery and equipment, and annual household medical expenses) as control variables; the specific definitions and related descriptions of the variables are shown in Table 3.
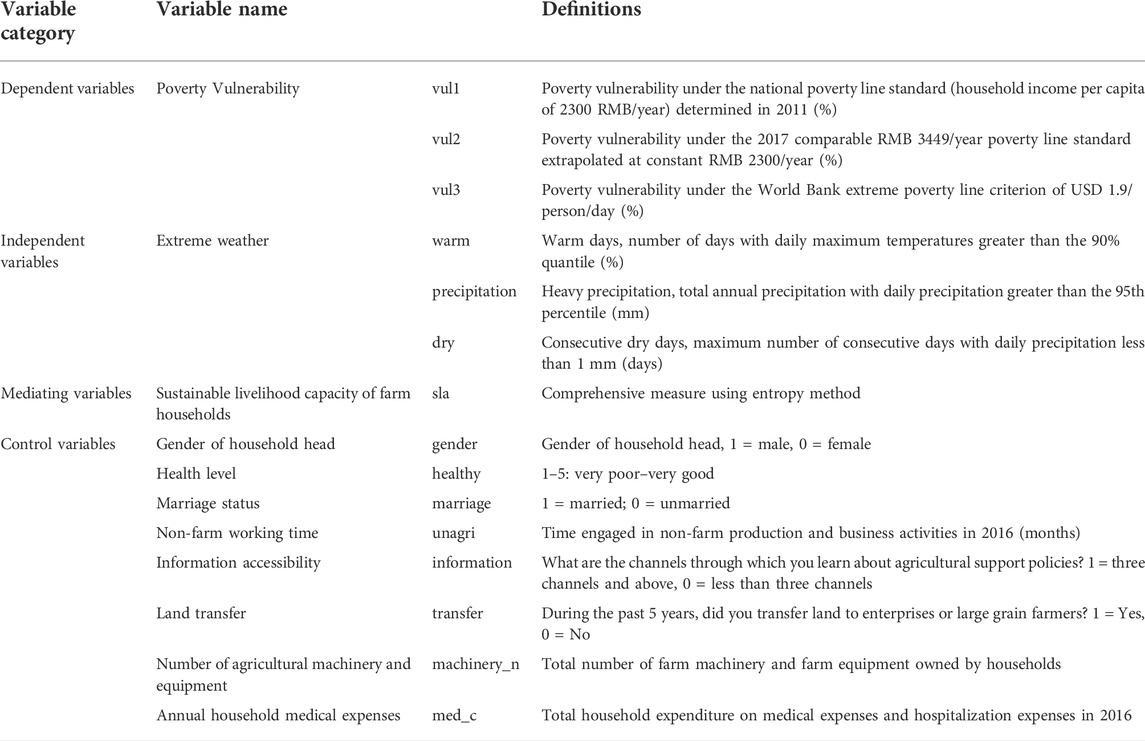
TABLE 3. Names and definitions of relevant variables.
In this study, the baseline regression model, quantile regression model and mediating effect model are constructed respectively, and the impact of extreme weather on farmers’ poverty vulnerability and the intrinsic mechanism of action are tested empirically by using STATA software, the models are constructed as follows.
To explore whether there was a significant effect from extreme weather on farmers’ poverty vulnerability, this study used OLS regression for empirical testing, and the model was determined, as follows:
where
As traditional OLS regression is essentially a mean regression analysis, the process of performing regression analysis only examined the effect of the explanatory variable x on the conditional expectation E(Y|X) of the explanatory variable y, rather than the overall conditional distribution of Y|X. Moreover, as compared to OLS regressions in which the minimized objective function is the sum of squared residuals (
where
This paper adopted a stepwise testing method, as proposed by Wen and Ye (2014), to test the mediating effect of farmers’ sustainable livelihood capacity and to identify the mechanism underpinning the effect of extreme weather on farmers’ poverty vulnerability. The model was constructed as follows:
where
In addition, in the intermediary effect test process, firstly, it was necessary to determine whether the coefficient
From the descriptive statistics results of each variable in Table 4, as the poverty vulnerability calculation had been uniformly performed by multiplying by 100, the poverty incidence corresponding to a poverty line standard of RMB 2300/year per household income was 0.18%, the poverty vulnerability corresponding to a poverty line standard of RMB 3449/year per household income was 0.74%, and the poverty line standard of USD 1.9/person/day corresponded to a poverty incidence of 1.01% for the sample farm households, which showed that the overall poverty vulnerability of the sample farm households was low. Among the extreme weather indicators, the mean value of the percentage of days with a maximum temperature > the 90% quantile was 0.12%, the mean value of total annual precipitation > the 95% quantile was 664.58 mm, and the mean number of the longest consecutive days with daily precipitation < l mm was 40.52, on average. The mean value of the control variable sustainable livelihood capacity of farm households was 0.0009. Among the personal characteristics of household heads, the health level of household heads was generally average or relatively good, and 92.73% of the respondents were male, 89.32% of the respondents were married, and the average time spent in non-agricultural production and business activities was 3.64 in months. Among the farm household characteristics, the Internet access rate was 35.73%, the percentage of land transfer households was 13.11%, the average number of farm machinery and equipment was 1.02 pcs, and the average annual household medical expense was RMB 6988.58.
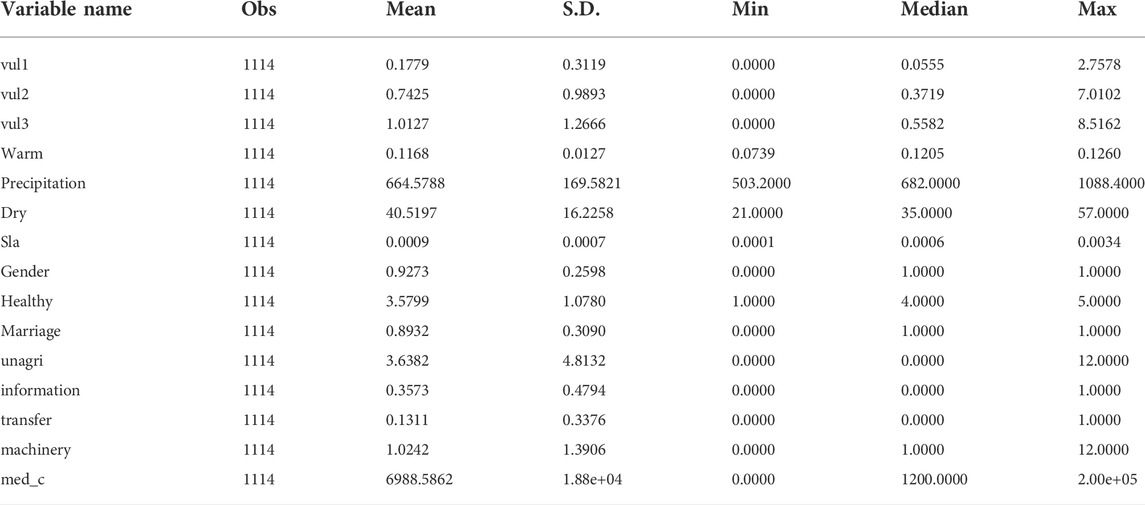
TABLE 4. Descriptive statistics of variables of related.
Before analyzing whether there was a significant effect of extreme weather on farmers’ poverty vulnerability, it was necessary to first test the variables for multicollinearity, considering that there could be cointegration problems among the variables that could bias the estimation results. Based on the test results, the maximum value of the variance inflation factor (VIF) and the mean value of VIF were both 1.01, which was less than 10; therefore, there was no multicollinearity between variables.
Based on the multicollinearity test, this study empirically analyzed the impact of extreme weather on farmers’ poverty vulnerability through OLS regression. The regression results are shown in Table 5. Mod5-1, mod5-2, and mod5-3 represented the results of the impact of extreme weather on the poverty vulnerability of farm households under the poverty line criteria of RMB 2300, RMB 3449, and USD 1.9/day, respectively.
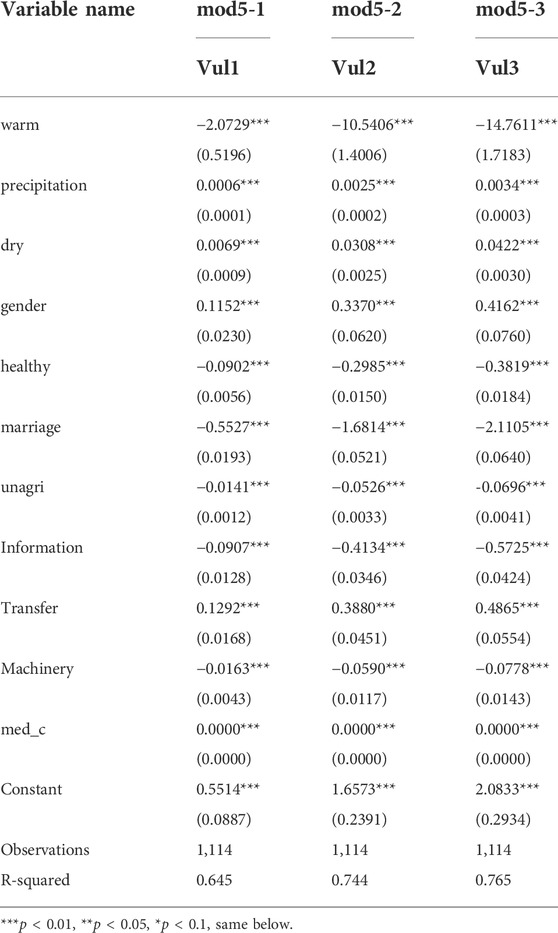
TABLE 5. Baseline regression results of the impact of extreme weather on poverty vulnerability of farm households.
The regression results showed that the effects of extreme weather indicators (warm days, heavy precipitation, and consecutive dry days) on the poverty vulnerability of farm households under different poverty-line criteria passed the test at 1% significance, and the effects of extreme weather on the poverty vulnerability of farm households increased as the poverty line criteria increased, indicating that there were significant effects from maximum temperature days, total heavy precipitation, and sustained drought days on farmers’ poverty vulnerability, i.e., extreme weather significantly affected farmers’ poverty vulnerability. Among them, the coefficients of warm days on farmers’ poverty vulnerability were negative while the coefficients of total heavy precipitation and consecutive dry days on farmers’ poverty vulnerability were positive, which indicated that the increase in high temperature days significantly reduced farmers’ poverty vulnerability, while the increase in total precipitation and consecutive dry days significantly increased farmers’ poverty vulnerability. In addition, the extreme weather indicator of maximum temperature days had a stronger effect on farm household poverty vulnerability than total precipitation and continuous dry days.
In the regression results of the control variables on the poverty vulnerability of farm households, the sex of the household head, the land transfer status of the farm household, and medical expenses all had highly significant positive relationships on the poverty vulnerability of farm households while the health level of the household head, marital status, off-farm working hours, household information accessibility, and the number of farm machinery and equipment significantly and negatively affected the poverty vulnerability of farm households. This indicated that men were more likely to fall into poverty than women; transferring land to enterprises or large grain farmers resulted in the farmers being much more likely to fall into poverty in the future than working on their own land; increasing medical expenses led to a decrease in household disposable income, which changed the household’s livelihood decisions and lifestyle, resulting in farmers being more likely to fall into poverty; better health, longer non-farm work time, and being married significantly reduced the probability of poverty in the future; the more comprehensive information regarding the external environment suggested that the richer the household’s physical capital, the more resistant the household would be to potential future risks, thus reducing the vulnerability of the household to poverty.
Table 6 shows the results of the impact of extreme weather on farmers with different degrees of poverty vulnerability under the poverty line of RMB 2300/year per capita household income, and the significance level and direction of each variable were consistent with the results of the full-sample regression (Table 5: mod5-1), which initially verified the robustness of the baseline regression results. Among them, mod6-1, mod6-2, mod6-3, mod6-4, and mod6-5 indicated the effects of extreme weather on the poverty vulnerability of farm households at the 0.1 (low vulnerability), 0.25 (low–medium vulnerability), 0.5 (medium vulnerability), 0.75 (medium–high vulnerability), and 0.90 (high vulnerability) quartiles, respectively. After testing the coefficients at each quantile, we found that
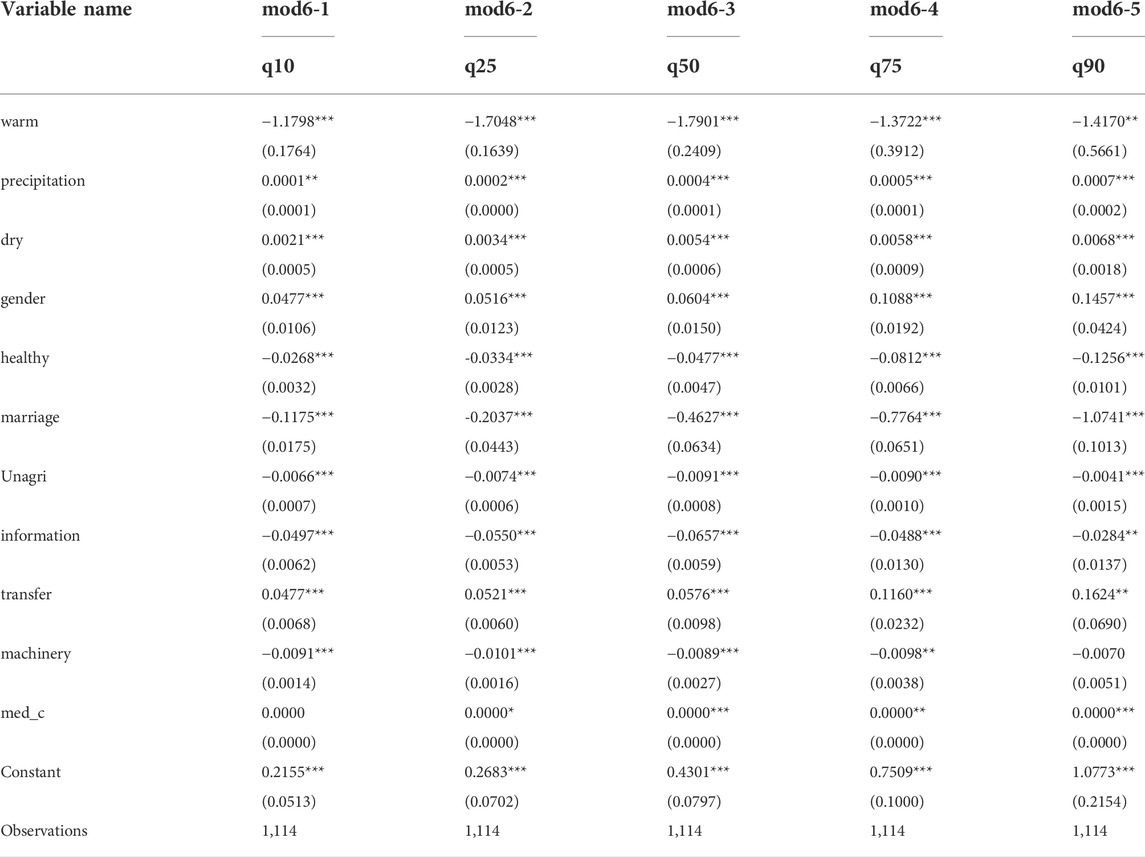
TABLE 6. Impact of extreme weather on farm households with different levels of poverty vulnerability (poor = RMB 2300/year).
A closer look at the correlation coefficients of the variables at each quantile revealed that, among the effects of warm days on the poverty vulnerability of farm households, the increase in the number of hot days had a stronger impact on households with less than a medium vulnerability, as compared to households with a medium–high vulnerability and high vulnerability, and more significantly reduced the probability of farm households entering poverty. As for the results of the effects of total heavy precipitation and consecutive dry days on the poverty vulnerability of farm households, the coefficients of the effects of total extreme heavy precipitation and persistent drought days increased with the increase in the quantile, indicating that households with high vulnerability were more likely to enter poverty when facing the shock of increased heavy precipitation and persistent drought days, as compared to households with low vulnerability.
Among the control variables, the effects of the sex of the household head, health level, and marital status on the poverty vulnerability of farm households all strengthened as the quantile rose. The effects of off-farm employment time, household information accessibility, and land transfer were stronger for households below-medium vulnerability, that is, the probability of entering poverty for households below-medium vulnerability decreased significantly as the off-farm employment time of farmers increased and the Internet access rate rose, while rural households whose land had been transferred to enterprises or large grain growers were more likely to fall into poverty. In addition, the increase in the number of farm machinery and equipment was more likely to reduce households at below-medium and high vulnerability while the impact on households with high vulnerability was relatively weaker.
Table 7 shows the regression results for different levels of vulnerability of farm households due to extreme weather under the poverty line criterion of RMB 3449. Among them, mod7-1, mod7-2, mod7-3, mod7-4, and mod7-5 indicated the impact of extreme weather on the poverty vulnerability of farm households at the 0.1 (low vulnerability), 0.25 (medium–low vulnerability), 0.5 (medium vulnerability), 0.75 (medium–high vulnerability), and 0.90 (high vulnerability) quartiles, respectively.
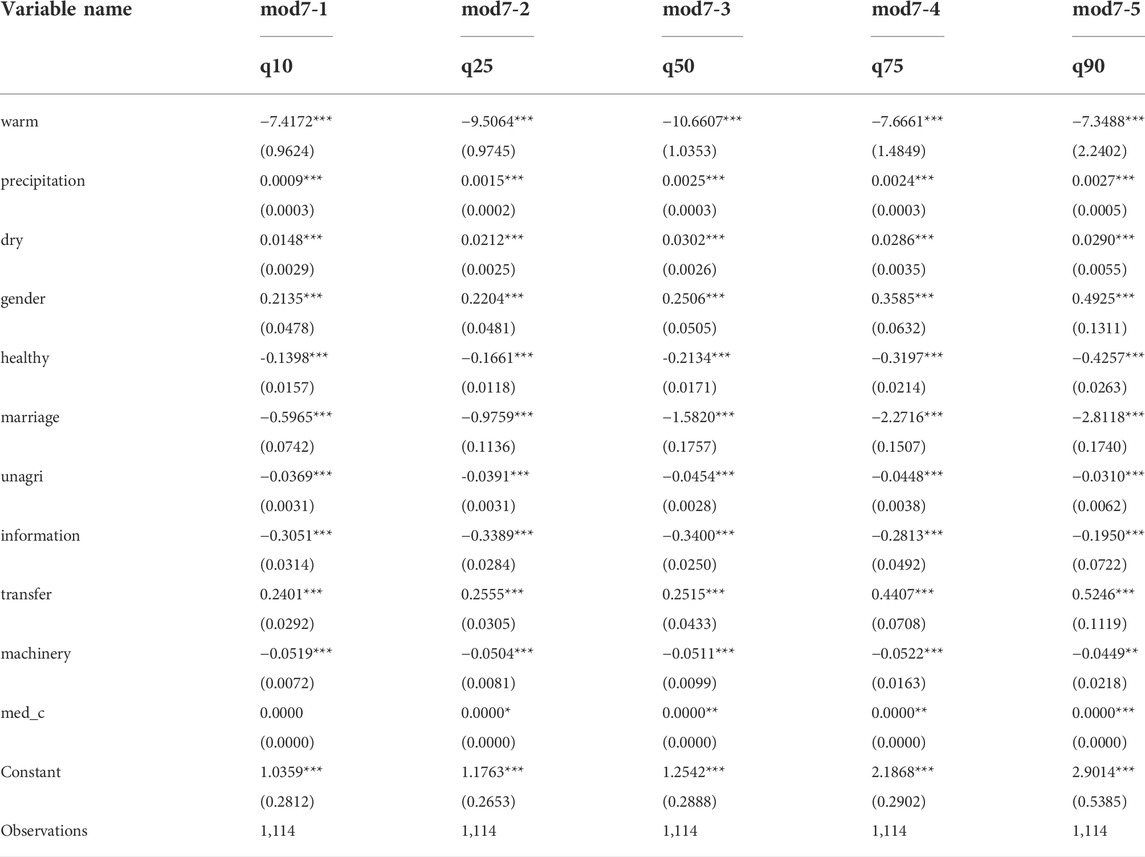
TABLE 7. Impact of extreme weather on farm households with different levels of poverty vulnerability (poor = RMB 3449/year).
In terms of significance level and direction, the quantile regression results were generally consistent with the full sample regression results (Table 5, mod 5–2). In terms of the regression results of the control variables, the trend of their impact coefficients at different quartiles was consistent with Table 6. The variation from the previous results was attributed to land transfer having a relatively greater impact on households with high vulnerability, that is, land transfer was less conducive to changing their poverty status for households with high vulnerability.
In the regression results of the core explanatory variables, the coefficient of the impact of high-heat weather on the poverty vulnerability of farm households tended to increase and then decrease as the quantile rose, and the impact of high-heat weather on medium-vulnerable households was significantly higher than that of low-vulnerable households and high-vulnerable households, which could have been due to low-vulnerable households having sufficient resource endowment and stronger risk resilience while the livelihoods of high-vulnerable households were not only affected by weather, but also by their own insufficient livelihood capital and poor sustainable livelihood capacity; therefore, to a certain extent, the impact of high-heat weather on the poverty vulnerability of farm households was limited, and eventually the effect was more obvious in medium-vulnerability households. In addition to the effects of high-temperature weather, the effects of total intense precipitation and consecutive drought days on the poverty vulnerability of farm households also differed, with the increase in intense precipitation making high-vulnerability households more vulnerable to poverty, as compared to low-vulnerability households, while the increase in the number of persistent drought days had a stronger effect on medium-vulnerability farm households. This may have been due to the low dependence of agricultural production of low-vulnerability households while high-vulnerability households themselves had less livelihood capital and a scarcity of natural capital such as arable and forest lands, thus reducing the channels through which extreme weather affects the poverty vulnerability of farm households and making the impact relatively low in intensity.
Table 8 shows the impact of extreme weather on farm households with different vulnerability characteristics for a poverty line criterion of USD 1.9/day. Mod8-1, mod8-2, mod8-3, mod8-4, and mod8-5 indicated the impact of extreme weather on the poverty vulnerability of farm households at the 0.1 (low vulnerability), 0.25 (medium–low vulnerability), 0.5 (medium vulnerability), 0.75 (medium–high vulnerability), and 0.90 (high vulnerability) quartiles, respectively.
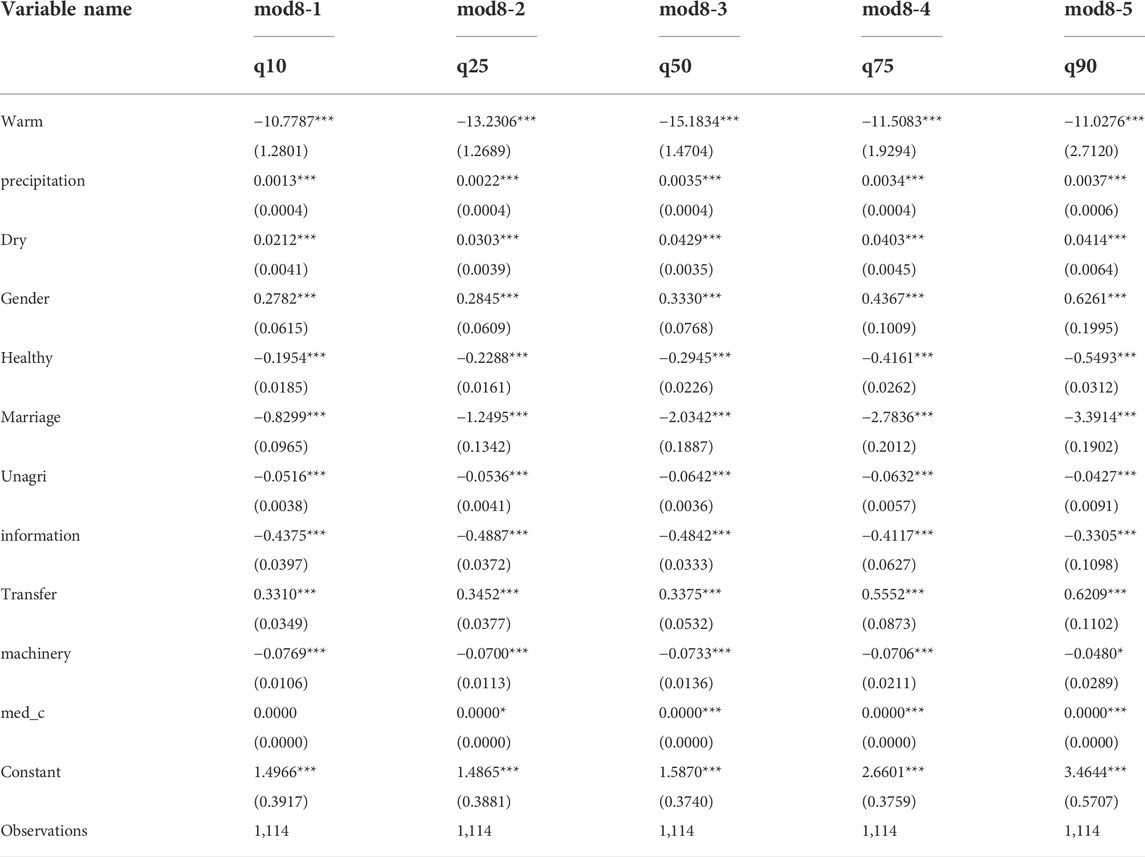
TABLE 8. Impact of extreme weather on farm households with different levels of poverty vulnerability (poor = USD 1.9/day).
Observing the impact coefficients corresponding to each quantile variable showed that the quantile regression results were consistent with the full sample regression results in terms of the direction and magnitude of significance (Table 5, mod5-3) while the trend of increase and decrease in each quantile was consistent with Table 7, but the strength of the impact increased significantly, which could be due to the threshold of crossing out of poverty becoming more and more stringent as the poverty line continued to increase, thus making the sample poverty incidence increase significantly and further driving the impact of the variables on the vulnerability of farm households to poverty. The regression results equally verify that extreme weather has a significant impact on farm households poverty vulnerability and that the impact differs significantly for farmers with different vulnerability characteristics.
The previous empirical results showed that there was a significant effect of extreme weather on the vulnerability of farm households, and there were differences in the impact on farmers with different vulnerability characteristics. Via what mechanism or channel has extreme weather affected farm household vulnerability? To further explore the in-depth logic of the impact of extreme weather on farm household poverty vulnerability, this study selected the sustainable livelihood capacity of farm households as the mediating variable and examined its effect.
Table 9 shows the results of testing the mediating effects of farmers’ sustainable livelihood capacity according to different poverty line criteria. Among the extreme weather indicators, the persistent drought days had a significant partial mediating effect on the livelihood sustainability of farm households according to the poverty line household income per capita criteria of CNY 3449 and USD 1.9 per person per day. Among them, the direct effect of continued drought days on farm household poverty vulnerability under the domestic poverty line criterion of per capita household income of RMB 3449 was 0.0053, the indirect effect through farm household sustainable livelihood capacity was 0.0001, and the total effect was 0.0054. Under the international poverty line criterion of USD 1.9 per person per day, the direct effect of the persistent drought days on the poverty vulnerability of farm households was 0.0073, and the indirect effect on the poverty vulnerability of farm households through their sustainable livelihood capacity was 0.0002, for a total effect of 0.0074. This suggested that under the poverty line household income per capita criteria of RMB 3449 and USD 1.90 per person per day, each 1% increase of the persistent drought days indirectly increased the poverty vulnerability of farm households by 0.0001 and 0.0002 percentage points, respectively, by reducing their sustainable livelihood capacity.
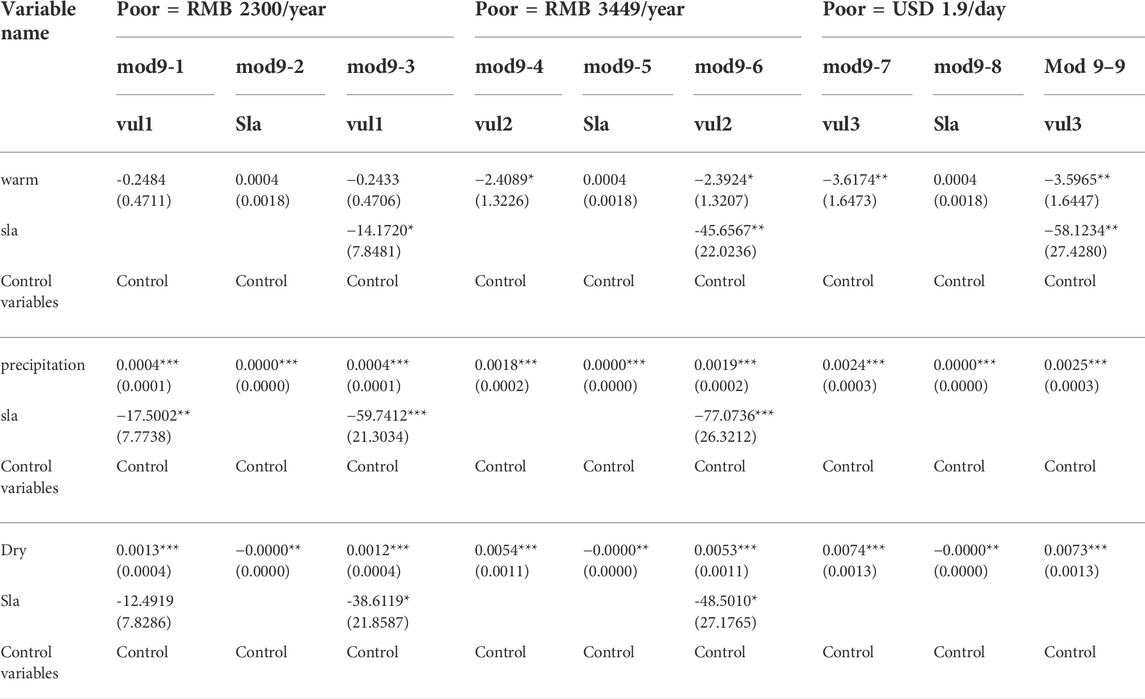
TABLE 9. Test results of mediating effects of sustainable livelihood capacity of farm households under different poverty line criteria.
Heavy precipitation under the three poverty lines, as the coefficients
Generally, non-farm employment tended to reduce the probability of a household falling into poverty in the future by effectively removing the income uncertainty caused by the variability of the natural environment and the volatility of market prices, reducing the increase in poverty vulnerability due to the risk of agricultural losses, as compared to being engaged in agricultural production (Imai et al., 2015; Sun and Duan, 2019). Therefore, considering that there were differences in the resilience of farm households under different types of employment, this study set a binary dummy variable (1 = working in non-agricultural works related to industry or service industry, 0 = working in agricultural production) with the division of farm households’ work industry to explore the impact of extreme weather on the poverty vulnerability of farm households under different employment types to investigate the mechanism of the effect.
The regression results are shown in Table 10, where mod10-1, mod10-2, and mod10-3 reflected the effects of extreme weather on the poverty vulnerability of farm households working in agricultural production, and mod10-4, mod10-5, and mod10-6 reflected the effects of extreme weather on the poverty vulnerability of farm households working in non-agricultural industries. There was a significant difference in the impact of extreme weather on the poverty vulnerability of farm households in different sectors, and rural households working in agricultural production were more vulnerable to the impact from extreme weather than those working in industry and services, that is, this category of farm households were more likely to fall into poverty under extreme weather shocks (e.g., extreme heavy precipitation, consecutive drought days). This could have been due to the higher sensitivity and vulnerability of the agricultural sector due to extreme climate change, where extreme weather shocks tended to affect the livelihood capital of farm households through agricultural economic output, weakening their sustainable livelihoods and thus significantly increasing their probability of falling into poverty.
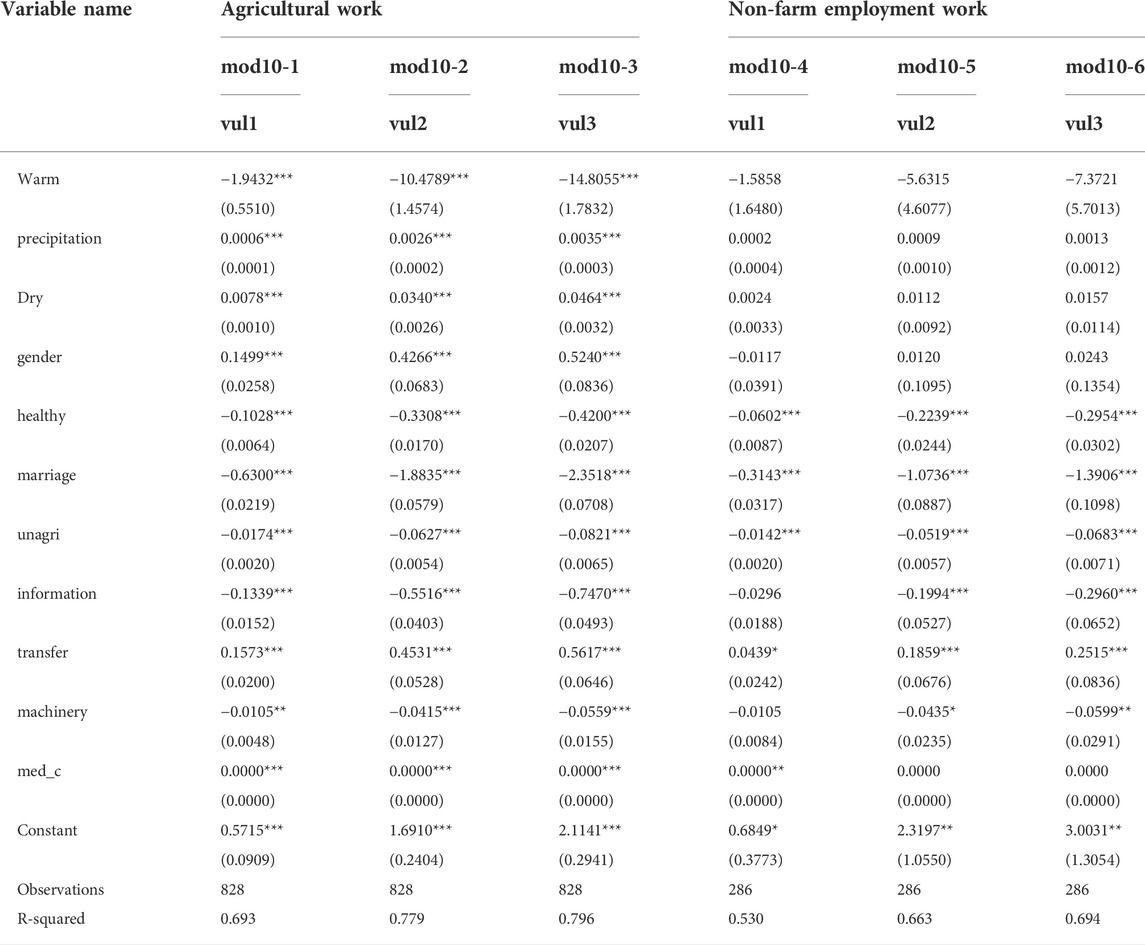
TABLE 10. Sub-sample regression results of the impact of extreme weather on poverty vulnerability of farm households (agricultural work vs non-farm employment work).
To ensure the robustness of the model regression results, this study performed a series of robustness tests on the aforementioned model. In previous works, common tests have included replacing the explained or explanatory variables, changing the data source, changing the estimation method or model, adding omitted variables, and tailoring the data. In this study, we re-estimated the poverty vulnerability of farm households by replacing the poverty line and choosing the international general poverty line standard of USD 3.1/person/day (vul4), and used the winsorization method to shrink the estimated vulnerability values by the upper and lower 1%, multiplied the processed values by 100 to transform them into percentage units, and used the constrained logit regression model to regress the effects of extreme weather. In addition, to further ensure the robustness of the regression results, this study applied a stepwise regression for empirical testing. The specific test results are shown in Table 11.
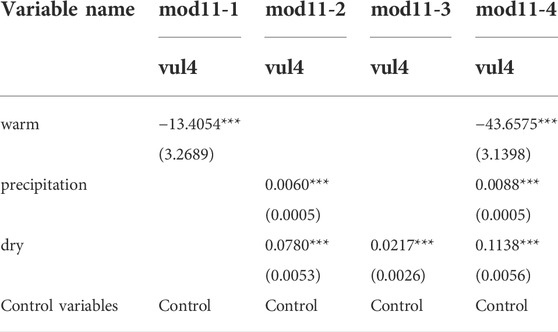
TABLE 11. Constrained logit regression estimation results (poor = USD 3.1/day/person).
Among them, mod11-1, mod11-2, and mod11-3 were the regression results of the effects of extreme weather indicators (i.e., warm days, total heavy precipitation, and consecutive dry days) on farmers’ poverty vulnerability, respectively. Mod11-4 was the regression result of the effects of extreme weather indicators all placed in the same analysis framework on farmers’ poverty vulnerability. It can be found that warm days were significantly negatively correlated with poverty vulnerability at the 1% level while total heavy precipitation and persistent drought days were significantly positively correlated with poverty vulnerability at the 1% level, and their effects on poverty vulnerability increased with an increase in extreme weather indicators, indicating that the conclusion that extreme weather had significant effects on poverty vulnerability of farmers was robust and reliable.
Based on the results of the aforementioned empirical tests, extreme weather had a significant impact on the poverty vulnerability of farm households, and those influences varied according to vulnerability characteristics of the farmers. Among them, extreme heat weather represented by warm days significantly and negatively affected farmers’ poverty vulnerability while extreme rainfall weather and drought represented by heavy precipitation totals and consecutive dry days significantly and positively affected farmers’ poverty vulnerability. The mediating variable of farm household’s sustainable livelihood capacity contributed a partial mediating effect in the process of extreme weather indicators of persistent drought days affecting rural household’s poverty vulnerability, according to the criteria of a household income per capita of RMB 3449 and USD 1.9 per person per day; each 1% increase in consecutive drought days indirectly increased the poverty vulnerability of farm households by reducing their sustainable livelihood capacity by 0.0001 and 0.0002 percentage points; there was a masking effect in the process of total heavy precipitation affecting the poverty vulnerability of farm households; there was only a direct effect in the process of warm days affecting the poverty vulnerability of farm households, and the indirect effect was not significant. In addition, farmers who were mainly engaged in agricultural production were more vulnerable to shocks from extreme weather than those who were engaged in non-agricultural industries.
The reason for this is that the high suddenness and rapid spread of extreme weather may make the transition time from the initial climate perception to the experience of climate disasters short, resulting in farmers suffering from both the ecological environment and physiological damage. On the one hand, the occurrence of climate extremes causes damage to the physical capital, natural capital, and environmental capital of farmers and threatens their living environment; on the other hand, the impact of extreme weather threatens the health of farmers’ family members and leads to the damage of human capital. On the other hand, the health of farm household members is threatened by the extreme weather, which leads to damage to human capital. The increase in medical expenses and the reconstruction of facilities after the disaster increase the impact on the financial capital of farm households. Under the double attack of the internal and external environment, the sustainable livelihood capacity of farming households is severely affected, which increases the possibility of farming households entering into poverty in the future and leads to the increase of farming households’ poverty vulnerability. For households with different vulnerability characteristics, households with high poverty vulnerability characteristics, when exposed to shocks from extreme weather, will further lengthen their transition time from disaster experience to climate adaptation, which leads to differences in the impact of extreme weather on households with different vulnerability characteristics under the interaction of different levels of sustainable livelihood capital of households.
As compared to previous studies, there were some similarities and differences in the findings of this paper. In the study by Maganga et al. (2021) on the expected poverty vulnerability of farm households as a result of climate changes, the results indicated that there was a strong correlation between farm household vulnerability and short-term climate stress, with drought, floods, and irregular rainfall all significantly increasing the likelihood of farm households falling into poverty or persistent poverty in the future and that drought had the greatest impact on farmers’ welfare losses, followed by floods. This was consistent with the results of the baseline regression test and the robustness test in this paper. Of the positive indicators of the impact of extreme weather exacerbating farmers’ poverty vulnerability, persistent drought days had the largest impact on farmers’ poverty vulnerability (Table 5, correlation coefficients of 0.0069, 0.0308, and 0.0422), followed by the impact of intense precipitation (Table 5, 0.0006, 0.0025, and 0.0034). This significant relationship had also been verified by Ahmed et al. (2009), Herrera et al. (2018), among others.
However, concerning extreme heat events (warm days) affecting farmers’ poverty vulnerability, previous studies have differed from the results of this paper. When exploring the impacts of climate changes on farmers’ poverty vulnerability, Li et al. (2022) suggested that extreme heat weather was significantly and positively related to farmers’ poverty vulnerability, that is, high temperature weather increased farmers’ poverty vulnerability and increased farmer vulnerability to poverty. Ahmed et al. (2009) found via empirical testing that global warming led to an increase in poverty vulnerability in several countries. In addition, domestic scholars such as Zhang (2014) and Cao and Chen (2016) also found the same results. The reason could be attributed to the threshold corresponding to 90% of the maximum temperature of the sample data being lower than the official daily maximum temperature, and the appropriate summer temperature was beneficial to the growth and development of crops (Arouri et al., 2015), which could reduce the poverty vulnerability of farmers to some extent.
The findings of this study provided effective policy recommendations and reference policies for reducing the poverty vulnerability of farm households and improving their sustainable livelihoods at home and abroad, enhancing the climate resilience of the world’s agricultural population, and simultaneously promoting the quality of poverty eradication in China and preventing the occurrence of return to poverty on a large scale. At the same time, there were limitations in this study that can be studied and improved upon in the future: 1) The mechanisms of extreme weather on poverty vulnerability of farm households were often varied and complex, and factors such as household consumption expenditure (Herrera et al., 2018), agricultural economic output (Liu et al., 2012), and farm household health level may also have played important roles, which should be considered in future research. 2) Due to the limitation of the data, this study only observed the relationship between poverty vulnerability and extreme weather in the Hubei and Yunnan provinces, but based on previous studies in related fields, the impact of extreme weather on poverty vulnerability of farmers in different regions could also be significantly different. 3) This study empirically examined the impact of extreme weather on the poverty vulnerability of farmers, but based on real-world situations, urban residents and various other groups (e.g., borrowing participant groups, etc.) could be affected by extreme weather and thus fall into poverty.
Using micro-farm household survey data from the Hubei and Yunnan provinces, this research empirically explored the impact of extreme weather on the poverty vulnerability of farm households by selecting warm days, heavy precipitation, and consecutive dry days as extreme weather measures. The following were the results: 1) There was a significant effect of extreme weather on the poverty vulnerability of farm households. Among them, warm days were significantly negatively correlated with farmers’ poverty vulnerability, while total heavy precipitation and persistent drought days were significantly positively correlated with farmers’ poverty vulnerability. 2) The impact of extreme weather on farmers with different vulnerability characteristics were varied. 3) The sustainable livelihood capacity of farm households played a partially mediating effect in the process of extreme weather index consecutive dry days affecting the poverty vulnerability of farm households. Under the criteria of poverty line per capita household income of RMB 3449 and USD 1.9 per person per day, each 1% increase in the persistent drought days indirectly increased the poverty vulnerability of farm households by 0.0001 and 0.0002 percentage points, respectively, through reducing their sustainable livelihood capacity; there was a masking effect in the process of the heavy precipitation total affecting farm households’ poverty vulnerability. In the process of warm days affecting farm households’ poverty vulnerability, the indirect effect was not significant. 4) As compared to rural households engaged in non-agricultural industries, those engaged in agricultural production and operation were more vulnerable to shocks from extreme weather. The results of this paper clearly indicate the significant relationship between extreme weather and poverty vulnerability of farmers and the mechanisms involved, and point the way for future research, i.e., we still need to continue to think about how to establish extreme weather risk prediction mechanisms, how to improve farmers’ adaptive capacity to extreme weather, and how to help farmers build sustainable livelihoods that can cope with extreme weather to ensure they will not return to poverty due to extreme weather. At the same time, this study provides recommendations for governments around the world to deal with extreme weather and prevent poverty return on a large scale, as follows: first, adopting differentiated policies could improve the climate resilience of farmers according to local conditions. Second, identify climate-sensitive vulnerable groups and refine policy implementation. Third, establish a risk warning mechanism to guide farmers in starting their own businesses or transitioning to non-farm employment. Fourth, expand the coverage of agricultural insurance to ensure farmers have relatively stable income when recovering from the effects of extreme weather. Fifth, promote the development of equalizing public services and improving the quality of the public service supply. Sixth, focus on ecological environmental protection, encourage the return of farmland to forests, strengthen the development of ecological compensation for resources, and encourage and focus on the development of ecological and green agriculture.
The original contributions presented in the study are included in the article/supplementary material, further inquiries can be directed to the corresponding authors.
For research articles with several authors, a short paragraph specifying their individual contributions must be provided. The following statements should be used “Conceptualization, ZC; methodology, ZC and HY; software, HY; validation, ZC HY and CY; formal analysis, CY; investigation, ZC and CY; resources, ZC; data curation, ZC; writing—original draft preparation, HY and CY; writing—review and editing, ZC; visualization, CY; supervision, YH; project administration, ZC; funding acquisition, ZC All authors have read and agreed to the published version of the manuscript”.
This research was funded by the 2021 Scientific and Technological Innovation Talents and Services Special Soft Science Research Project of Hubei Province (2021EDA006).
The authors declare that the research was conducted in the absence of any commercial or financial relationships that could be construed as a potential conflict of interest.
All claims expressed in this article are solely those of the authors and do not necessarily represent those of their affiliated organizations, or those of the publisher, the editors and the reviewers. Any product that may be evaluated in this article, or claim that may be made by its manufacturer, is not guaranteed or endorsed by the publisher.
Ahmed, S. A., Diffenbaugh, N. S., and Hertel, T. W. (2009). Climate volatility deepens poverty vulnerability in developing countries. Environ. Res. Lett. 4 (3), 034004. doi:10.1088/1748-9326/4/3/034004
Amemiya, T. (1977). The maximum likelihood and the nonlinear three-stage least squares estimator in the general nonlinear simultaneous equation model. Econometrica 45 (4), 955. doi:10.2307/1912684
Arouri, M., Nguyen, C., and Youssef, A. B. (2015). Natural disasters, household welfare, and resilience: evidence from rural Vietnam. World Dev. 70, 59–77. doi:10.1016/j.worlddev.2014.12.017
Azeem, M. M., Mugera, A. W., and Schilizzi, S. (2016). Poverty and vulnerability in the Punjab, Pakistan: a multilevel analysis. J. Asian Econ. 44, 57–72. doi:10.1016/j.asieco.2016.04.001
Azzarri, C., and Signorelli, S. (2020). Climate and poverty in Africa south of the sahara. World Dev. 125, 104691. doi:10.1016/j.worlddev.2019.104691
Bohua, L., Jia, C., and Peilin, L. (2013). Assessment and management strategy of households’ poverty vulnerability in undeveloped areas: a case of poverty-stricken ethnic minority areas in xiangxi autonomous region. Chin. Agric. Sci. Bull. 29 (23), 44–50. doi:10.3969/j.issn.1000-6850.2013.23.010
Bui, A. T., Dungey, M., Nguyen, C. V., and Pham, T. P. (2014). The impact of natural disasters on household income, expenditure, poverty and inequality: evidence from Vietnam. Appl. Econ. 46 (15), 1751–1766. doi:10.1080/00036846.2014.884706
Cao, S., Zhao, W., and Duan, F. (2015). Coupling relation analysis between ecological value and economic poverty of contiguous destitute areas in qinling-dabashan region. Acta Geogr. Sin. 34, 1295–1309. doi:10.11821/dlyj201507009
Cao, Z. J., and Chen, S. J. (2016). The formation mechanism and evolution of climate poverty from the perspective of climate risk. J. Hohai Univ. Soc. Sci. 18 (05), 52–59+91. (In Chinese). doi:10.3876/j.issn.1671-4970.2016.05.010
Carter, M. R., Little, P. D., Mogues, T., and Negatu, W. (2007). “Poverty traps and natural disasters in Ethiopia and Honduras - Science Direct[J]. World Dev. 35 (5), 835–856. doi:10.1016/j.worlddev.2006.09.010
Chaudhuri, S., Jalan, J., and Suryahadi, A. (2002). Assessing household vulnerability to poverty from cross-sectional data: a methodology and estimates from Indonesia. Discussion papers.
Chen, Q. (2010). Advanced econometrics and stata applications. Beijing, China: Higher Education Press. (In Chinese).
Dasgupta, A., and Baschieri, A. (2010). Vulnerability to climate change in rural Ghana: Mainstreaming climate change in poverty-reduction strategies. J. Int. Dev. 22 (6), 803–820. doi:10.1002/jid.1666
Ding, W., Ren, W., Li, P., Hou, X., Sun, X., Li, X., et al. (2014). Evaluation of the livelihood vulnerability of pastoral households in Northern China to natural disasters and climate change. Rangel. J. 36 (6), 535. doi:10.1071/rj13051
Fagariba, C. J., Song, S., and Baoro, S. K. G. S. (2018). Climate change adaptation strategies and constraints in northern ghana: evidence of farmers in sissala west district. Sustainability 10 (5), 1484. doi:10.3390/su10051484
Feng, J., Zhou, L., and Chen, Y. (2017). A review on the research of vulnerability to poverty. J. Desert Res. 37 (6), 1261–1270. doi:10.7522/j.issn.1000-694X.2016.00076
Ford, J. D., Keskitalo, E., Smith, T., Pearce, T., Berrang-Ford, L., Duerden, F., et al. (2010). Case study and analogue methodologies in climate change vulnerability research. WIREs. Clim. Change 1 (3), 374–392. doi:10.1002/wcc.48
Füssel, H.-M. (2007). Vulnerability: a generally applicable conceptual framework for climate change research. Glob. Environ. Change 17 (2), 155–167. doi:10.1016/j.gloenvcha.2006.05.002
Gentle, P., and Maraseni, T. N. (2012). Climate change, poverty and livelihoods: adaptation practices by rural mountain communities in Nepal. Environ. Sci. Policy 21, 24–34. doi:10.1016/j.envsci.2012.03.007
Herrera, C., Ruben, R., and Dijkstra, G. (2018). Climate variability and vulnerability to poverty in Nicaragua. J. Environ. Econ. Policy 7 (3), 324–344. doi:10.1080/21606544.2018.1433070
Huang, W., and Zhu, W. (2021). Multidimensional evaluation of the consolidation and expansion of targeted poverty alleviation: an empirical analysis of poverty alleviation practice in B city of G province in China. J. Manag. World 37 (10), 111–128. (in Chinese). doi:10.19744/j.cnki.11-1235/f.2021.0158
Imai, K. S., Gaiha, R., and Thapa, G. (2015). Does non-farm sector employment reduce rural poverty and vulnerability? Evidence from Vietnam and India. J. Asian Econ. 36, 47–61. doi:10.1016/j.asieco.2015.01.001
Jalal, M. J. E., Khan, M. A., Hossain, M. E., Yedla, S., and Alam, G. M. M. (2021). Does climate change stimulate household vulnerability and income diversity? Evidence from southern coastal region of Bangladesh. Heliyon 7 (9), e07990. doi:10.1016/j.heliyon.2021.e07990
Jiang, J., Ma, J., and Xu, Y. (2012). Grey relational analysis on agricul- ture disaster vulnerability and rural poverty. J. Anhui Agric. Sci. 40 (9), 5308–5309. doi:10.13989/j.cnki.0517-6611.2012.09.084
Koenker, R., and Bassett, G. W. (1978). Regression quantiles. Econometrica 46 (1), 33. doi:10.2307/1913643
Leichenko, R., and Silva, J. A. (2014). Climate change and poverty: vulnerability, impacts, and alleviation strategies. WIREs Clim. Change 5 (4), 539–556. doi:10.1002/wcc.287
Li, H., Zhou, Y., and Wei, Y. D. (2019). Institutions, extreme weather, and urbanization in the greater mekong region. Ann. Am. Assoc. Geogr. 109 (4), 1317–1340. doi:10.1080/24694452.2018.1535884
Li, J-Y., and Wang, Y-H. (2014). Spatial coupling characteristics of eco-environment quality and economic poverty in Lüliang area. Yingyong Shengtai Xuebao 25 (6), 1715–1724. doi:10.13287/j.1001-9332.20140409.015
Li, J., and Mao, J. (2019). Impact of the boreal summer 30‒60-day intraseasonal oscillation over the asian summer monsoon region on persistent extremerainfall over eastern China. Chin. J. Atmos. Sci. 43 (4), 796–812. doi:10.3878/j.issn.1006-9895.1809.18145
Li, Q., Sun, P., Li, B., and Mohiuddin, M. (2022). Impact of climate change on rural poverty vulnerability from an income source perspective: a study based on CHIPS2013 and county-level temperature data in China. Int. J. Environ. Res. Public Health 19 (6), 3328. doi:10.3390/ijerph19063328
Liu, C. (2019). The status quo, causes and Countermeasures of China's climate poverty. J. Environ. Econ. 4 (04), 148–162. (in Chinese). doi:10.19511/j.cnki.jee.2019.04.010
Liu, G. G., Ge, Y. X., Li, Y., and Zhang, H. N. (2021). Impact of ecological compensation on sustainable livelihood capacity of farmers in water source area* ——based on the improved DFID livelihood analysis framework. Chin. J. Agric. Resour. Regional Plan.,1–13. Available at: (In Chinese)http://kns.cnki.net/kcms/detail/11.3513.S.20210930.1418.002.html.
Liu, J., Xu, X. F., and Luo, H. (2012). An empirical study on the impact of extreme weather and climate events on my country's agricultural economic output. Sci. Sin. 42 (07), 1076–1082. (In Chinese).
Liu, Q., Jiang, J., Yang, X., Zhang, J., and Yang, X. (2022). Poverty vulnerability measurement and its impact factors of farmers: Based on the empirical analysis in Qinba Mountains. Geogr. Res. 41 (2), 307–324. doi:10.11821/dlyj020201156
Loayza, N. V., Olaberria, E., Rigolini, J., and Christiaensen, L. (2012). Natural disasters and growth: Going beyond the averages. World Dev. 40 (7), 1317–1336. doi:10.1016/j.worlddev.2012.03.002
Maganga, A. M., Chiwaula, L., and Kambewa, P. (2021). Climate induced vulnerability to poverty among smallholder farmers: Evidence from Malawi. World Dev. Perspect. 21, 100273. doi:10.1016/j.wdp.2020.100273
Motsholapheko, M. R., Kgathi, D. L., and Vanderpost, C. (2015). An assessment of adaptation planning for flood variability in the Okavango Delta, Botswana. Mitig. Adapt. Strateg. Glob. Chang. 20 (2), 221–239. doi:10.1007/s11027-013-9488-5
Mottaleb, K. A., Mohanty, S., Hoang, H. T. K., and Rejesus, R. M. (2013). The effects of natural disasters on farm household income and expenditures: a study on rice farmers in Bangladesh. Agric. Syst. 121, 43–52. doi:10.1016/j.agsy.2013.06.003
Nguyen, T. T., Nguyen, T.-T., Le, V.-H., Managi, S., and Grote, U. (2020). Reported weather shocks and rural household welfare: Evidence from panel data in Northeast Thailand and Central Vietnam. Weather Clim. Extrem. 30, 100286. doi:10.1016/j.wace.2020.100286
Rodriguez-Oreggia, E., De La Fuente, A., De La Torre, R., and Moreno, H. A. (2013). Natural disasters, human development and poverty at the municipal level in Mexico. J. Dev. Stud. 49 (3), 442–455. doi:10.1080/00220388.2012.700398
Rodriguez-Sola, R., Casas-Castillo, M. C., Zhang, J. J. H., Kirchner, R., Alarcon, M., Periago, C., et al. (2022). A study on correlations between precipitation ETCCDI and airborne pollen/fungal spore parameters in the NE Iberian Peninsula. Int. J. Biometeorol. 66, 1189. doi:10.1007/s00484-022-02277-3
Samuels, M., Masubelele, M., Cupido, C., Swarts, M., Foster, J., De Wet, G., et al. (2022). Climate vulnerability and risks to an indigenous community in the arid zone of South Africa. J. Arid Environ. 199, 104718. doi:10.1016/j.jaridenv.2022.104718
Schmidtlein, M. C., Shafer, J. M., Berry, M., and Cutter, S. L. (2011). Modeled earthquake losses and social vulnerability in Charleston, South Carolina. Appl. Geogr. 31 (1), 269–281. doi:10.1016/j.apgeog.2010.06.001
Sun, B. C., and Duan, Z. M. (2019). The impact of off-farm employment on poverty vulnerability of rural households. Mod. Finance Economics-Journal Tianjin Univ. Finance Econ. 39 (09), 97–113. (In Chinese). doi:10.19559/j.cnki.12-1387.2019.09.008
Thouret, J.-C., Enjolras, G., Martelli, K., Santoni, O., Luque, J., Nagata, M., et al. (2013). Combining criteria for delineating lahar-and flash-flood-prone hazard and risk zones for the city of Arequipa, Peru. Nat. Hazards Earth Syst. Sci. 13 (2), 339–360. doi:10.5194/nhess-13-339-2013
Tong, Y., and Long, H. (2003). Study on sustainable development in the poor areas coupled with vulnerable eco-environment. China Popul. Resour. Environ. 2, 50–54. doi:10.3969/j.issn.1002-2104.2003.02.010
Van den Berg, M., and Burger, K. (2017). “Natural hazards, poverty traps and adaptive livelihoods in Nicaragua,” in The social and behavioural aspects of climate change (London, England: Routledge), 96–113.
Walker, S. P. (2014). Drought, resettlement and accounting. Crit. Perspect. Account. 25 (7), 604–619. doi:10.1016/j.cpa.2013.06.005
Wang, X. H., Chen, L., and Fu, Y. (2020). Financial diversity, entrepreneurship choice and poverty vulnerability of farmers. J. Agrotechnical Econ. (09), 63–78. (In Chinese). doi:10.13246/j.cnki.jae.2020.09.005
Wen, Z. L., and Ye, B. J. (2014). Analyses of mediating effects: The development of methods and models. Adv. Psychol. Sci. 22 (05), 731. (In chinese). doi:10.3724/sp.j.1042.2014.00731
W Bank (2001). World development report 2000/2001: Attacking poverty[J]. World Bank Publications 39 (6), 1145–1161. doi:10.1111/j.1467-7660.2008.00511.x
Xiao, P., Liu, C. H., and Li, Y. P. (2020). Is family education expenditure beneficial to the reduction of future poverty for farmers? Empirical analysis based on vulnerability of poverty. Educ. Econ. 36 (05), 3–12. (In Chinese).
Yang, D., Wang, X. L., and Tang, Y. (2020). Agricultural subsidies, farmers' income increase and income inequality. J. Huazhong Agric. Univ. Sci. Ed. (05), 60–70+171. (In Chinese). doi:10.13300/j.cnki.hnwkxb.2020.05.007
Yiridomoh, G. Y., Sullo, C., and Bonye, S. Z. (2021). Climate variability and rural livelihood sustainability: evidence from communities along the Black Volta River in Ghana. Geojournal 86 (4), 1527–1543. doi:10.1007/s10708-020-10144-0
Zhang, D. (2011). The association between disaster and poverty in the minority poverty community of the contiguous area. Inn. Mong. Socal Sci. 32 (5), 127–132. doi:10.3969/j.issn.1003-5281.2011.05.026
Zhang, Q. (2014). Poverty traps and elite capture: The wealth gap in pastoral areas of Inner Mongolia under the influence of climate change. Acad. Bimest. (05), 132–142. (In Chinese). doi:10.16091/j.cnki.cn32-1308/c.2014.05.055
Zhang, W. X., and Wang, J. L. (2022). Flood monitoring of Heilongjiang River basin in China and Russia transboundary region based on SAR backscattering characteristics. J. Geo-information Sci. 24 (4), 802–813. (in Chinese). doi:10.12082/dqxxkx.2022.210018
Zhang, X., and Yang, F. (2004). RClimDex (1.0) user manual. Climate Research Branch Environment Canada, 22 (Climate Research Branch of Meteorological Service of Canada).
Zhang, Y., and Feng, L. (2020). “The coupling relationship between economic poverty alleviation and ecological poverty alleviation in concentrated and contiguous poverty-stricken areas: Take yunnan province as an example,” in Paper presented at the International Conference on Green Development and Environmental Science and Technology (ICGDE), Changsha, PEOPLES R CHINA, 2020 Sep 18-20.
Zhou, L., Guan, D., Yuan, X., Zhang, M., and Gao, W. (2021). Quantifying the spatiotemporal characteristics of ecosystem services and livelihoods in China's poverty-stricken counties. Front. Earth Sci. 15 (3), 553–579. doi:10.1007/s11707-020-0832-2
Keywords: extreme weather, farm households, poverty vulnerability, sustainable livelihood capacity, adaptive strategy
Citation: Chen Z, Yan H and Yang C (2022) A study on the impact of extreme weather on the poverty vulnerability of farming households—evidence from six counties in the hubei and yunnan provinces of china. Front. Environ. Sci. 10:942857. doi: 10.3389/fenvs.2022.942857
Received: 13 May 2022; Accepted: 05 July 2022;
Published: 22 July 2022.
Edited by:
Rupakumar Kolli, Indian Institute of Tropical Meteorology, IndiaReviewed by:
Nyong Princely Awazi, The University of Bamenda, CameroonCopyright © 2022 Chen, Yan and Yang. This is an open-access article distributed under the terms of the Creative Commons Attribution License (CC BY). The use, distribution or reproduction in other forums is permitted, provided the original author(s) and the copyright owner(s) are credited and that the original publication in this journal is cited, in accordance with accepted academic practice. No use, distribution or reproduction is permitted which does not comply with these terms.
*Correspondence: Zhi Chen, Y2hlbnpoaTcyOUBmb3htYWlsLmNvbQ==; Han Yan, eWFuaGFuMTI4QG91dGxvb2suY29t; Chao Yang, eWFuZ2NoYW93dWhhbkBvdXRsb29rLmNvbQ==
Disclaimer: All claims expressed in this article are solely those of the authors and do not necessarily represent those of their affiliated organizations, or those of the publisher, the editors and the reviewers. Any product that may be evaluated in this article or claim that may be made by its manufacturer is not guaranteed or endorsed by the publisher.
Research integrity at Frontiers
Learn more about the work of our research integrity team to safeguard the quality of each article we publish.