 Xiaojiang Xia
 Yang Zhang
 Yue Zhang
 Tiechuan Rao
94% of researchers rate our articles as excellent or good
Learn more about the work of our research integrity team to safeguard the quality of each article we publish.
Find out more
ORIGINAL RESEARCH article
Front. Environ. Sci., 10 August 2022
Sec. Land Use Dynamics
Volume 10 - 2022 | https://doi.org/10.3389/fenvs.2022.942577
This article is part of the Research TopicTowards Sustainable Urban Development: Use of Geographic Big Data for Spatial PlanningView all 25 articles
In the new era, the vitality of urban space is an important engine of urban development, and the improvement of urban space vitality is the core component of urban spatial structure optimization and space renewal. However, the availability of data is an important issue in the evaluation of urban space vitality, and continuous vitality monitoring of the entire city is difficult to achieve through traditional methods of field research and questionnaire interviews. Due to this challenge, the traditional vitality assessment methods have serious limitations in the analysis of vitality causes and the guidance of urban space development. Using mobile phone signaling data, this study takes Changsha City as an example to measure the urban spatial vitality and uses the SEM model to analyze how market intervention, traffic accessibility, and spatial characteristics affect the density and stability of urban spatial populations. The results show that the overall urban space vitality density and vitality stability demonstrates an obvious “center–periphery” pattern, and the vitality of the urban center area is in a “high density–low stability” state. The overall urban vitality density on rest days is slightly lower than that on weekdays, and the stability of vitality on rest days is significantly higher than that on weekdays. Market intervention and transportation accessibility support vitality density, but not vitality stability, and spatial characteristics are the opposite. The findings can provide insights relevant to urban spatial planning and design.
Since the implementation of the reform and opening-up policy, China has experienced unprecedented urbanization (Jin et al., 2017). Land-dominated urbanization (Zeng et al., 2018) has led to explosive growth of urban built-up areas (Huang et al., 2017). Many large cities have also entered a concentrated outbreak period of “urban diseases” (Hui et al., 2014) such as “ghost towns,” “traffic congestion,” and “environmental deterioration.” Such rapid urban space expansion has concerned scholars about the creation of urban space vitality (Batty, 2016). The government has also noticed the potential problems in the process of urbanization and has made urban physical examination and promotion of urban vitality an important strategic task for urban space development in the new era (Wang et al., 2022). At present, the development of urban space in China has fully entered the era of stock development, and the supply of new construction land in a large number of cities has been severely restricted (Xia et al., 2020; Dong et al., 2021). The development model of China’s large cities has gradually shifted from incremental planning to stock planning (Xia et al., 2019). In this context, the academic community and the general public have generally recognized that using the huge stock space formed by rapid urbanization (Wang et al., 2017; He et al., 2018) to enhance the vitality of space is an important means to improve the quality of urban space and alleviate urban diseases. Therefore, an understanding of urban vitality is essential for cities to be vibrant and sustainable (Lang et al., 2016). The study of urban spatiotemporal vitality pattern provides a new way to alleviate the problems of blind urban expansion and resource allocation imbalance (Liu and Long, 2019). Moreover, analyzing the temporal and spatial laws of urban space vitality and its impact mechanism can effectively provide an important basis for enhancing urban space vitality and promoting high-quality development of urban space.
Since Jacobs proposed the concept of urban vitality, it has received extensive attention from multiple disciplines (Delclòs-Alió et al., 2019). The connotation and dimension of the concept of urban vitality are one of the important issues to be studied in urban planning disciplines (Pakoz and Isik, 2022). Urban vitality is the source and driving force of urban development, which directly affects urban development and the satisfaction of the urban population (Lan et al., 2020; Guo et al., 2022). Researchers generally believe that urban vitality reflects the interaction between various human activities and existing urban facilities, and plays a crucial role in promoting comprehensive, coordinated, and sustainable urban development (Wu. et al., 2018; Mouratidis and Poortinga, 2020). Urban vitality represents the level of human activities in different times and spaces of the city (Li et al., 2016; Li and Liu, 2016), and good urban vitality reflects the relationship between urban space and urban population. Human relationships also reflect the quality of urban space (Jin et al., 2017).
At present, academia has carried out numerous research works on the vitality of urban space. In terms of study area type, current research on urban vitality mainly focuses on urban parks (Zhu et al., 2020; Mu et al., 2021; Mushkani and Ono, 2021), commercial centers (Guo et al., 2022) and communities (Li et al., 2022), waterfront space (Liu et al., 2021; Niu et al., 2021), urban streets (Gehl et al., 2006), and other aspects of spatial vitality measurement and analysis of influencing factors. In addition, many scholars often use urban vitality to evaluate the quality of urban development (Lan et al., 2020; Jiang et al., 2022). In terms of data usage, availability of data used to be the primary issue for quantitative analysis of urban vitality (Sung and Lee, 2015; Ye et al., 2017). In recent years, the development of information and communication technology and perception technology has provided new data, methods, and research objects for urban vitality research (García-Palomares et al., 2018; Kim, 2018). A wealth of microscale geographic open data, including social media data, mobile phone trajectories, points of interest (POIs), night-lighting data (Zheng et al., 2017), location-based service data (Jin et al., 2017), and smart card records, can be used for quantitative and systematic studies of urban density and urban vitality (Liu et al., 2015; Xia et al., 2017; Wu and Niu, 2019; Tu et al., 2020). Compared with traditional census and survey data, these geotagged big data have a large sample size, high penetration rate, and strong timeliness, which have significant advantages for us to study urban vitality further (Ye et al., 2017; Wu, et al., 2018), thereby promoting the research paradigm shift of dynamic observation of static data analysis items (Liu and Long, 2019). In recent years, many studies have attempted to analyze spatial big data from different sources to explore urban vitality (Tang et al., 2018; Lu et al., 2019). For example, mobile phone signaling data (MPSD) can provide more objective and high-resolution data for urban spatial vitality research (Birenboim and Shoval, 2016; Chen and Akar, 2016; Delclòs-Alió et al., 2019). In terms of selection of influencing factors, in the evaluation of urban vitality at a regional or national level with cities as the basic units, socio-economic data are mainly selected as influencing factors. Examples of these socio-economic data are per capita gross domestic product and per capita fiscal revenue (Lan et al., 2020; Shi et al., 2021). In the research on the vitality of urban interior space, the selection of influencing factors is mainly based on public service facilities (education, entertainment facilities, etc.), landscape elements (human landscape elements, natural landscape elements), and traffic accessibility (subway, taxi) as the main body (Delclòs-Alió et al., 2019; Mouratidis and Poortinga, 2020; Li et al., 2021; Niu et al., 2021; Yue et al., 2021). In terms of research methods, global and local regression models (Fan et al., 2021), space syntax (Xu and Chen, 2021), and other methods are widely used. In recent years, structural equation model methods have been increasingly applied to urban space research for causal analysis, especially for latent variables that cannot be directly observed (Mouratidis and Poortinga, 2020; Liu et al., 2021).
In summary, in-depth research on urban vitality and its influencing factors can help shed light on the complex relationship between urban vitality and socio-economic order (Lang et al., 2016; Li et al., 2022). Moreover, it can help urban planners and policymakers develop effective urban sustainability plans (Laman et al., 2019; Meng and Xing, 2019). Urban planners often expect to plan and build a space with high vitality, yet spaces with high vitality cannot be attributed to planning alone. The formation of spatial vitality is significantly affected by market economic activities. Therefore, planners trying to plan or update urban space to enhance urban vitality must master the status and influencing factors of urban space vitality. However, for urban planners, little research and discussion have been conducted on the spatial and temporal characteristics of the overall spatial vitality of a city, for example, what affects urban spatial vitality, and what factors are the most important. This involves many issues: how the vitality of urban space is affected by factors of the built environment and how to optimize the spatial structure on the overall scale of the city to enhance the vitality of space. In addition, current research mainly uses regression models to explain the impact of various environmental characteristics on the vitality of urban local areas or specific functional areas. Although this method can obtain the correlation and statistical significance between built environment elements and spatial vitality, it is difficult to use for establishing the causal relationship between variables and for analyzing the complex relationship between urban spatial vitality and influencing factors. In particular, factors such as spatial accessibility and market economic activities have an important impact on the vitality of urban space, but these variables cannot be directly observed. Traditionally, some distance factors such as the location and agglomeration of commercial facilities are often used to replace accessibility and market economic activities, but whether these indicators can be accurately measured has not been verified. In addition, compared with other emerging data, MPSD has obvious advantages in analyzing the vitality of urban space. On the one hand, MPSD is a direct response of individuals in urban populations with very high spatial resolution and smaller granularity. On the other hand, MPSD can have better timeliness, which is an important reason why many current research works use MPSD (De Nadai et al., 2016; Yue et al., 2016).
Therefore, this research will use MPSD data to measure the vitality of urban space, analyze the situation of urban space vitality, and use a structural equation model to analyze the causes of urban space vitality. We focus on the distribution pattern of urban spatial vitality in different times, the vitality persistence (vitality stability), and its relationship with the urban built environment. This study is organized as follows: the introduction section gives the background of this study and a descriptive literature review. The latter consists of a summary of the reviewed articles and examines the concept of urban vibrancy and related studies in MPSD. Section 2 explains the research methods, including the data and analytical methods used. Section 3 elaborates the analysis results. Section 4 discusses the findings from the viewpoint of urban planning practices. Section 5 concludes the study. Our study follows the trend of academic research and attempts to use advanced spatiotemporal analysis techniques to conduct an in-depth analysis of urban vitality to advance the scientific understanding of sustainable urban development.
Changsha is the capital city of Hunan Province, an important central city in the middle reaches of the Yangtze River. The city was identified by the Chinese Central Government as an important political, economic, educational, cultural, and transportation center in the central region. With the continuous economic development of Changsha Zhuzhou and Xiangtan urban agglomerations and the continuous advancement of national strategies such as the rise of Central China, the middle reaches of the Yangtze River, the Yangtze River Economic Belt, and the “One Belt and One Road” initiative, the development of Changsha has ushered in a significant period of opportunity. Furthermore, its international status has been elevated. As China continues to shift its development focus to the central region, Changsha’s future becomes promising. Changsha is one of the most famous cities in China. The spatial behavior of urban people is typical, making it a good research area for urban vitality research (Figure 1).
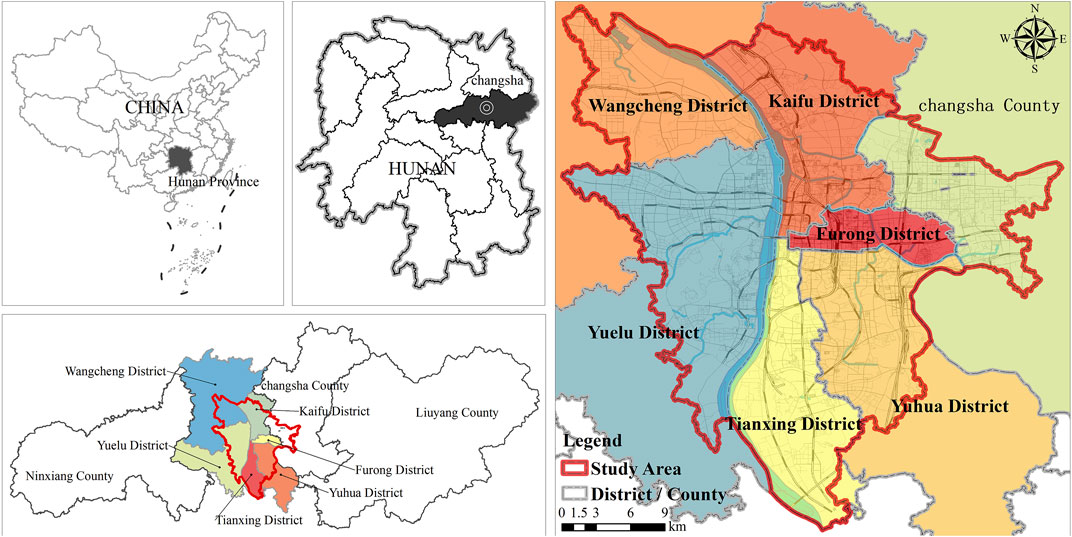
FIGURE 1. Research area.
Changsha City has six districts and three counties. The spatial activities of urban people mainly occur in the areas that have been built in the city. By comparing satellite maps and administrative boundary data, we selected Tianxing District, Yuelu District, Yuhua District, Kaifu District, most of Wangcheng District, Furong District, and part of Xingsha County as the study area (Table 1).
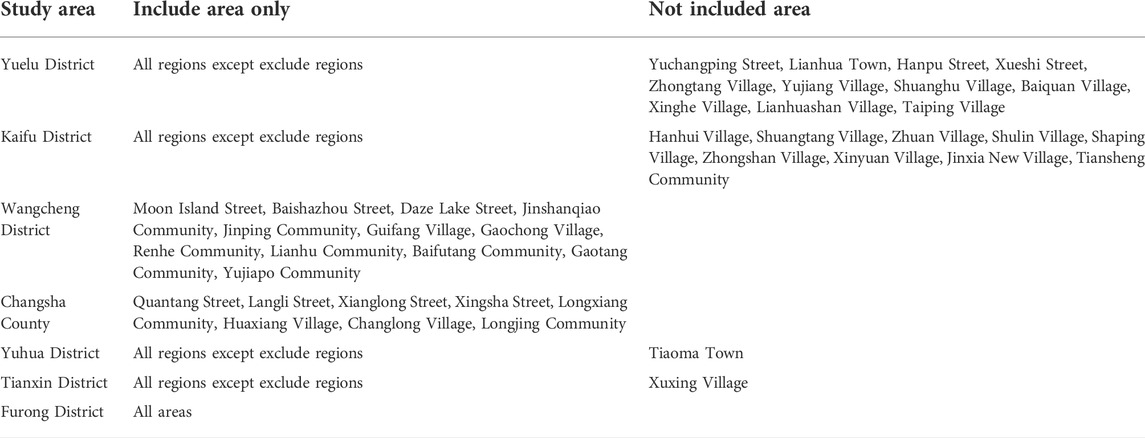
TABLE 1. Detailed scope of the study area.
This study used four types of data, namely, MPSD, POI data, road network data, and the administrative boundaries of the study area. First, the MPSD are obtained from Hunan Mobile Company. The data covered weekdays and weekends in July 2021 when weather conditions were good. In order to protect privacy, Hunan Mobile uses a 200 m × 200 m grid to count the number of people distributed in time and space. Mobile phone data depict the spatiotemporal characteristics of the activities of individuals (Qian et al., 2021). Several previous studies have proven that MPSD are effective in determining the temporal and spatial distribution of the urban population (Fan et al., 2018; Xiao et al., 2019; Yin et al., 2021). We selected hourly cell phone signal data from 9 a.m. to 9 p.m. for the following reasons. First, during the night period (21:00–06:00), urban residents are mainly concentrated in urban living spaces, and the usage of urban public space is small. Second, from 6:00 a.m. to 9:00 a.m., urban traffic commutes make the spatial activity highly dynamic and the response to the spatial vitality inaccurate.
The POI data in July 2021 were obtained from the online map service platform GAODE map (http://lbs.amap.com/) by calling the open API Python programming. Each POI data include name, address, longitude, and latitude. After data cleaning, coordinate transformation, and sorting, the effective data volume exceeded 300,000. On this basis, we established a database of different types of POI in the study area. The road network data which were used to extract the study area were obtained from the OpenStreetMap (http://www.openstreetmap.org/). Changsha administrative division boundary data come from the Institute of Geography and Resources, Chinese Academy of Sciences.
Urban space vitality density refers to the intensity of crowd activities in the urban space at a certain moment, usually expressed by the ratio of the total population to the research unit area. The larger the index value, the stronger the vitality. This study is based on the general scale of urban block units in Changsha City, and the study unit is divided into 800 m × 800 m grids for analysis. Table 2 shows the formulas for calculating the space vitality density during the research period.

TABLE 2. Vitality density formulas for weekdays and weekends.
Vitality stability refers to the degree of dynamic changes in the intensity of urban crowd activity during the overall study period, that is, the degree of dispersion of the intensity of urban crowd activity in a specific time period in the time dimension, which is usually measured by the standard deviation. The smaller the value, the more stable the vitality. For the convenience of follow-up statistics, we have carried out reverse normalization of this value, so that the larger the index after normalization, the stronger the stability of the indicated vitality. Table 3 shows the calculation formula of vitality stability.
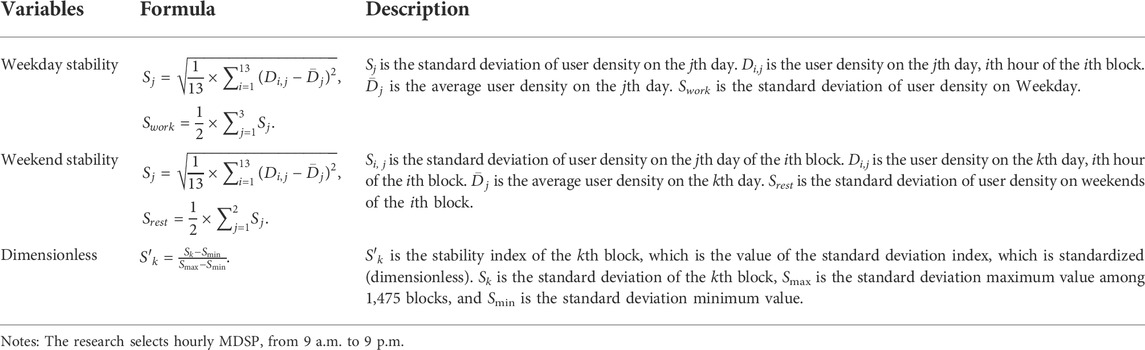
TABLE 3. Vitality stability formulas for weekday and weekends.
Since the development of the SEM model in the 1990s, it has promoted the research process in the fields of psychology, economics, sociology, and spatial planning (Halkos et al., 2021; Liu et al., 2021; Tong et al., 2021). The main advantage of using SEM over multivariate regression models and univariate regression is the opportunity to model complicated interrelationships among dependent and/or independent variables (Najaf et al., 2018). SEM can estimate direct effects, indirect effects, and total effects, which gives a deeper and more comprehensive insight into the links between variables than ordinary linear models (Tong et al., 2021). In addition, SEM can be applied to cope with the problem of endogeneity when it is caused by simultaneous causality (Jo and Jeon, 2021; Tong et al., 2021; Shami et al., 2022). In order to ensure the reliability of the SEM model, a large number of fitting parameters have been developed, including goodness-of-fit index (GFI), normed fit index (NFI), comparative fit index (CFI), and Tucker–Lewis coefficient (TLI). On this basis, we choose the most commonly used indicators, namely, TLI, NFI, GFI, SRMR, and CFI to test SEM (Xie et al., 2020).
AMOS is an added SPSS module and is specifically used for SEM. Through AMOS, we can draw models graphically using simple drawing tools. AMOS performs the computations for SEM and displays the results quickly (Shami et al., 2022). These features provide great convenience for this research.
Taking Changsha urban built-up area as a case study area, the structural equation model was elaborated and consists of a measurement model and a structural model (Figure 2). In previous urban population density studies, shopping facilities, catering facilities, entertainment facilities, hotel accommodation facilities, and daily life service facilities are widely used factors (Li et al., 2019; Yang et al., 2021; Chen et al., 2022; Li et al., 2022). Subway, taxis, and other modes of transportation, which are components of transportation accessibility, are almost mandatory factors in all studies on population density distribution and spatial vitality (Yue et al., 2021; Guo et al., 2022). Scholars have also adopted elements such as spatial landscape and cultural attractions (Lin et al., 2021; Niu et al., 2021; Xu and Chen, 2021). The spatial behavior and spatial flow of urban people mainly consider the influence of three aspects: the push end, the pull end, and the link channel between the two. The research on the vitality of urban space mainly considers the tension end and the link channel. The link channel refers to the accessibility of traffic, whereas the pull section refers to the spatial attribute that meets the public needs of the urban population. The functional attributes of public space come from two ways: one is the land-use attribute given by spatial planning, and the other is the dynamic and stable attribute formed by the continuous operation of the market economy. For the renewal of urban built-up areas, it is more reasonable to consider the dynamic and stable attributes generated by market operation, which is also the dynamic demand for urban space vitality. However, the spatial dynamism of government-led facilities such as educational facilities and medical facilities is moot. This type of facility is planned in accordance with the configuration standard of public service facilities, and it is not necessary to enhance the vitality of the space. Therefore, we choose the average vitality density and vitality stability of weekdays and weekends as endogenous variables. According to the attributes of urban space facilities, urban functional facilities are divided into three types of endogenous variables: market-led facilities, spatial quality, and traffic accessibility. A geographic information system will be an effective tool for visualizing the results. The following three hypotheses are proposed to verify the relationship between urban space vitality and built environment characteristics.
H 1. The greater the density of market-led implementation, the more vibrant the urban space.
H 2. The greater the traffic accessibility, the more vibrant the urban space.
H 3. The better the quality of the space, the more vibrant the urban space.
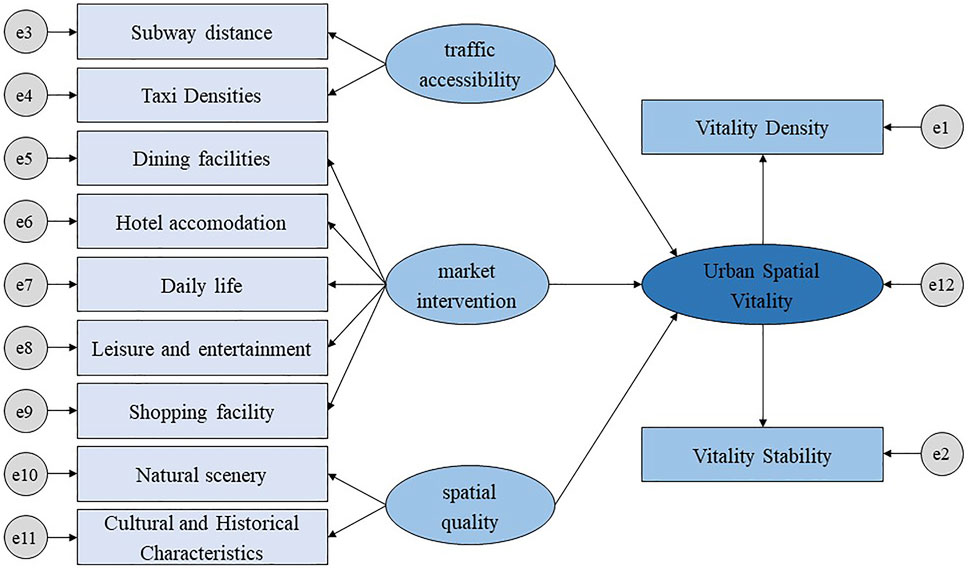
FIGURE 2. Conceptual structural model.
The exogenous variables of this study are the functional characteristics of the urban built environment. Except for the parameter of traffic accessibility, which is the same as the index used by a large number of scholars, we have made innovations in other exogenous variables. According to the construction and use attributes of functional space, an environmental factor index system that is composed of market intervention facility, spatial quality, and traffic accessibility of the urban space has been constructed.
The implementation of a large number of commercial administrations in the city has fully considered the vitality of the urban space when selecting the site and has an impact on the vitality of the city. Among them, the layout and scale of commercial facilities, catering facilities and living service facilities are mainly determined by the market environment. Therefore, this study integrated the number of commercial facilities, catering facilities, living service facilities, leisure and entertainment facilities, and hotel accommodation facilities per unit area into the market intervention facility index system.
Whether the urban space has good natural scenery and cultural and historical characteristics are important parameters to measure the attractiveness of the space. The spatial quality of this research refers to scenic spots with natural landscape attributes and historical sites with cultural and historical attributes. It is quantified by spatial density.
Traffic accessibility refers to the convenience of transportation to a specific space in a city, and is used as a common indicator in the study of urban space vitality (Niu et al., 2021; Guo et al., 2022). Numerous scholars usually take the development of urban public transportation as an important parameter to measure traffic accessibility (Yang et al., 2021; Yue et al., 2021). Inspired by this convention, this study mainly used the number of taxis per unit area and the distance to nearby subway stations as indicators to measure traffic accessibility. The significance of urban bus stops is poor in the analysis process, so the factor of bus stops is not included in the model analysis. To ensure the convenience of data processing, the accessibility indicators are normalized (dimensionless). In addition, the distance from the subway station is reversely processed to ensure that the larger the value, the closer the distance to the subway station.
Figure 3 shows the spatial distribution of all these observed variables.
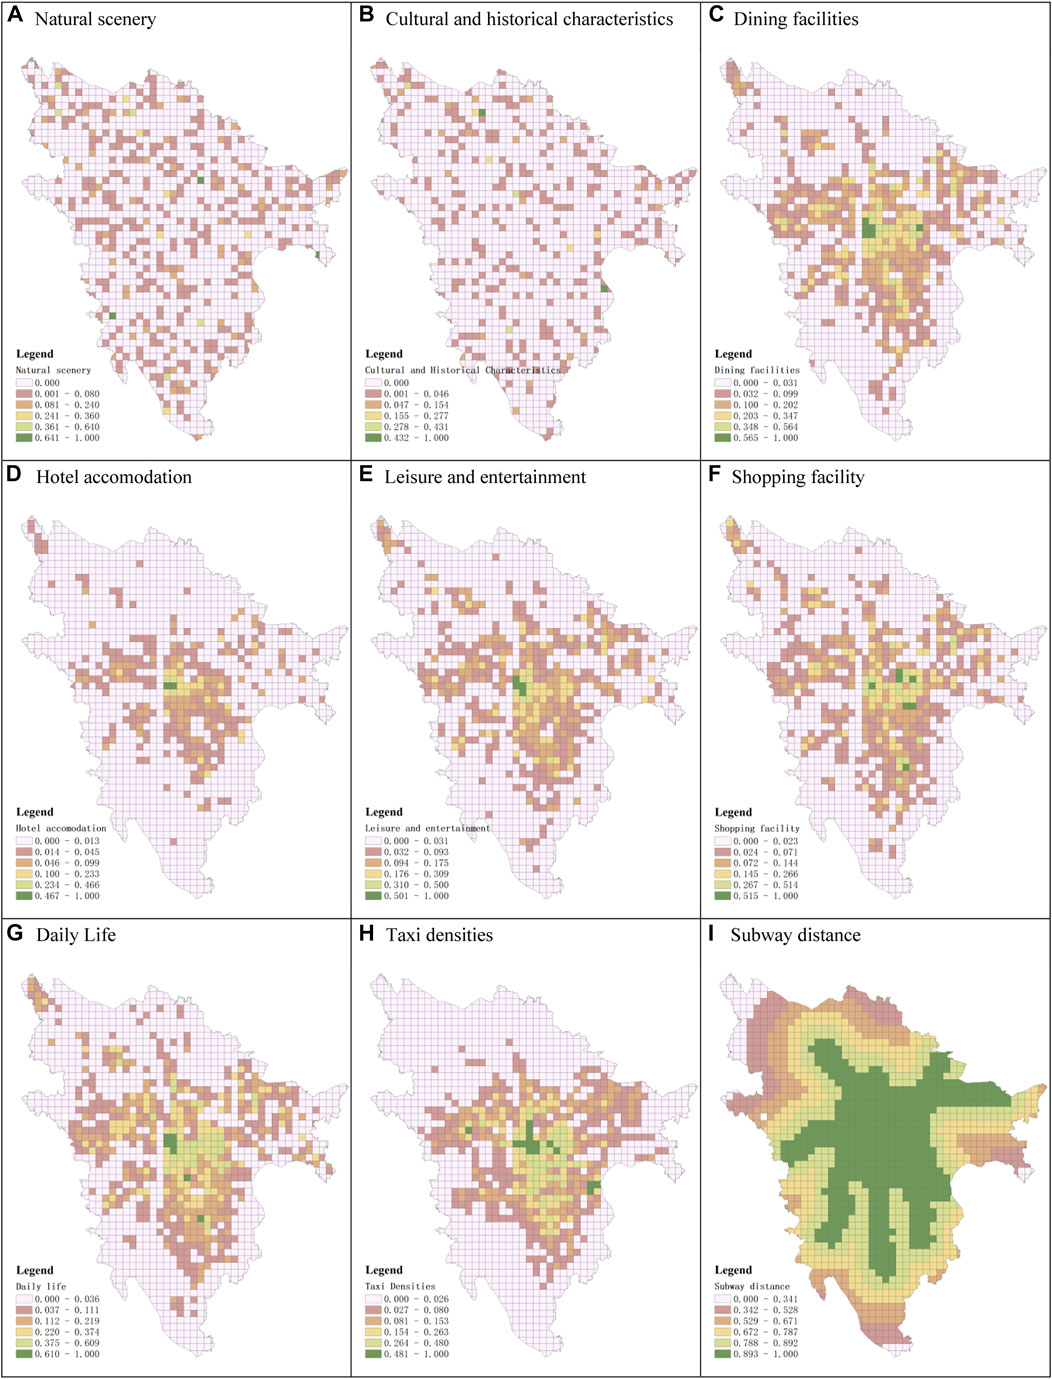
FIGURE 3. Spatial distribution of independent variables. (A) Natural scenery. (B) Cultural and historical characteristics. (C) Dining facilities. (D) Hotel accommodation. (E) Leisure and entertainment. (F) Shopping facility. (G) Daily life. (H) Taxi densities. (I) Subway distance.
This research uses urban spatial vitality as an endogenous variable. Urban spatial vitality refers to the distribution of people in space and the balance of time dimensions. According to previous studies on urban space vitality (Li et al., 2020; Liu et al., 2021), this research takes vitality stability and vitality density as observed variables. Given the overall reverse difference between the vitality density and vitality stability of Changsha City, to ensure the stability of the model, the vitality density and vitality stability will be modeled separately. At the same time, the spatial vitality between weekdays and weekends has differences, so they are evaluated separately.
In order to ensure the validity of model fitting evaluation and hypothesis testing, this study conducted reliability and validity tests on variables. In this study, Cronbach’s coefficient alpha (CCA) and composite reliability (CR) were used to test the reliability of the data, and the validity was assessed by calculating the mean variance (AVE). Both CCA and CR should be greater than 0.7, and AVE should be kept above 0.5 (Halkos et al., 2021; Liu et al., 2021). In this study, confirmatory factor analysis was used to measure the reliability and validity of the variables (Table 4). The analysis results show that the variables used in the study have good reliability and discriminant validity except for the assumption of spatial characteristics. Among them, the CCA value of spatial characteristic elements is slightly lower than the suggested value, because the spatial distribution of natural landscape and human landscape is often mutually exclusive. Moreover, the analysis unit of the study fails to include a wider range of spatial elements. Overall, the hypotheses and variables constructed by the study set the requirements for compound analysis.
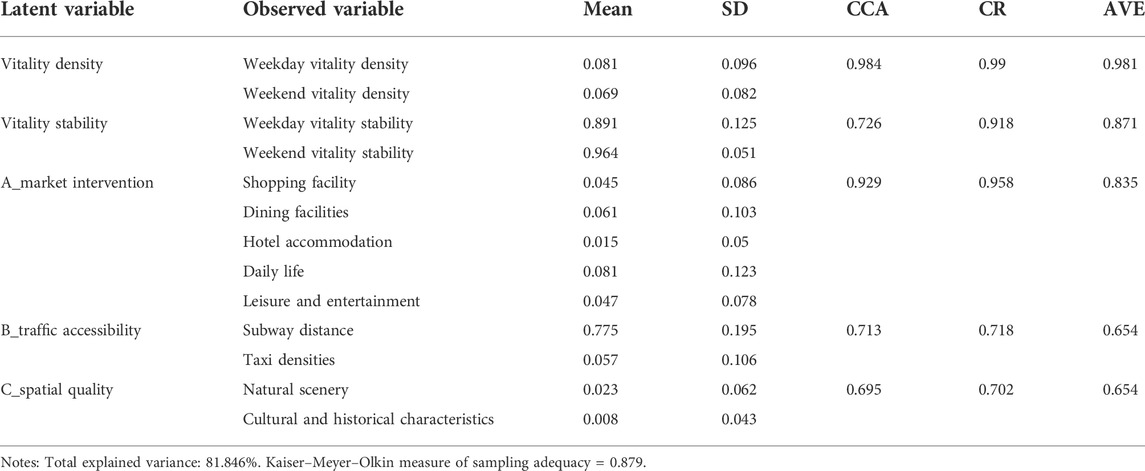
TABLE 4. Reliability and validity of all variables (N = 1,475).
We divided the values of vitality density into 10 levels at natural breaks in classification (Jenks). Levels 1–10 represent density from low to high (Figure 4). The spatial vitality of urban crowds in Changsha shows a similar spatial pattern on both weekdays and rest days, that is, the central urban area is a high-vitality density area, and the urban peripheral area is a low-vitality density area. In particular, the spatial vitality of urban crowds in Changsha can be divided into three-level areas. The first-level area is the city center area; the second-level area is the Xianjia Lake–Meixi Lake area, Xingsha area, and Jingwanzi area; and the third-level area is the Jinxia area, Moon Island area, high-speed railway, and exhibition area. In terms of the difference in vitality density between weekday and rest days, the changes in the urban center are the most significant. For rest days, the vitality density in the central area of the city generally shows a downward trend, the range of high density is shrinking and the agglomeration intensity is increasing. It shows that the urban crowd gathers in the core area of the city center at a high density on rest days, and urban crowds do not tend to gather in urban areas on rest days.
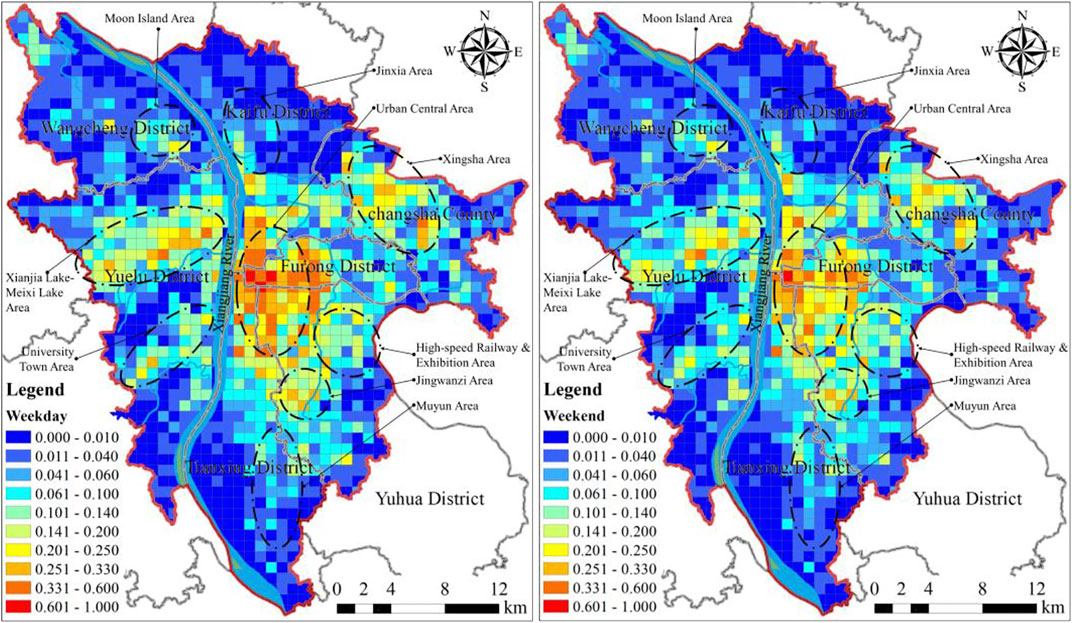
FIGURE 4. Weekday (left) and weekend (right) density of human activities.
We divided values of vitality stability into 10 grades at natural breaks (Figure 5). The closer the color of the block is to red, the higher the stability; the closer to blue, the lower the stability. The overall stability of urban vitality and the density of urban vitality show a reverse pattern, that is, high-density areas show a state of low stability, and low-density areas are in a state of high stability. This result fully shows that the mobility of the urban population is significant. In particular, the stability of the city center is low. A significant difference exists in the stability of urban vitality on weekday and rest days. The stability of urban space vitality on rest days has been significantly improved, especially in the outer areas of the city center. Combined with the analysis of vitality density and vitality stability, the vitality density and vitality stability of the peripheral areas of the city center are both higher.
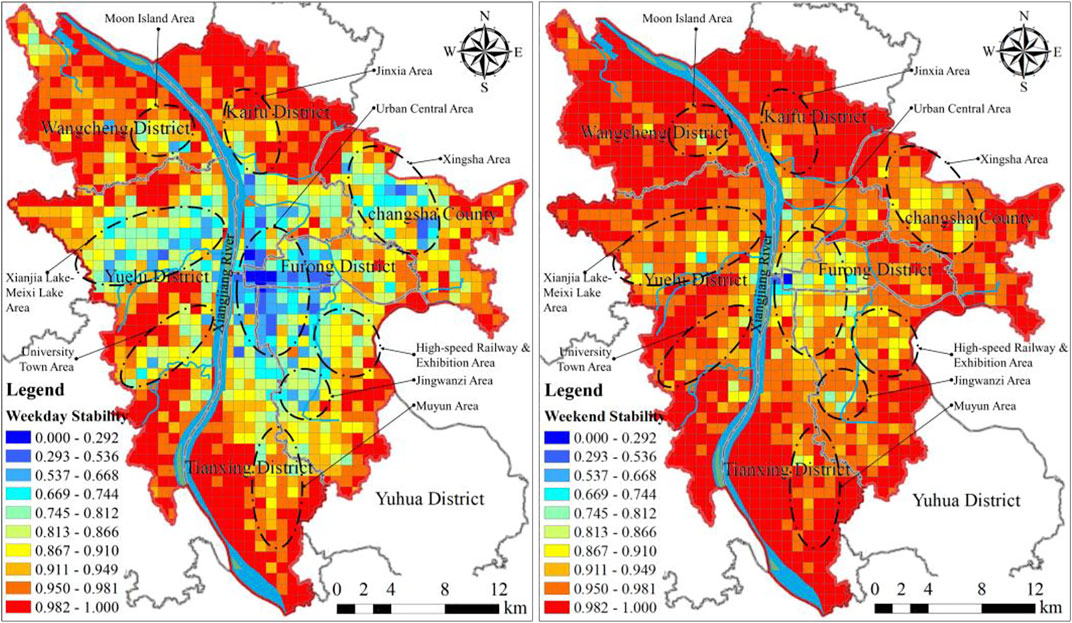
FIGURE 5. Weekday (left) and weekend (right) stability of human activities.
The previous research results have shown that the urban spatial vitality density and stability of Changsha City generally present opposite spatial states. Therefore, to ensure the model analysis’s accuracy, we separately carried out the model analysis of vitality density and stability. Model 1–model 4 depict the activity density of weekdays, vitality density of rest days, vitality stability of weekdays, and vitality stability of rest days, respectively. Table 5 shows the goodness-of-fit measures of the model, including GFI, CFI, NFI, TLI, and SRMR. All indices surpassed the recommended threshold for SEM, indicating a satisfactory level of goodness-of-fit.
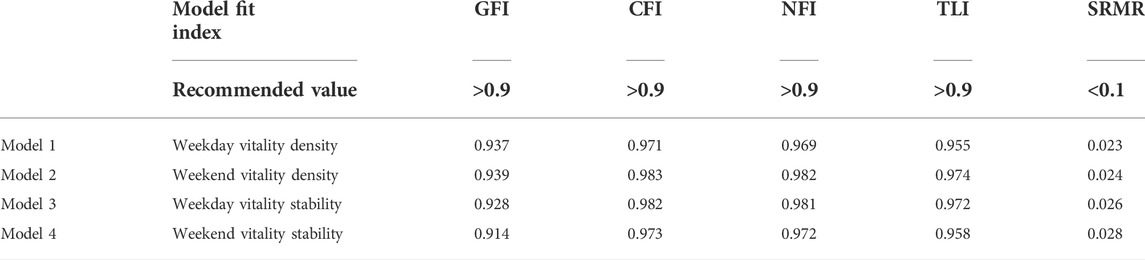
TABLE 5. Model fit indicators.
The results of the model (Table 6) show that the direct impact of traffic accessibility on the vitality of urban space is 0.74 and 0.669 on weekdays and weekends, respectively. That is, the higher the transit accessibility of the waterfront open space, the higher the level of vitality. The effect of traffic accessibility on the stability of space vitality is the opposite, with −0.803 and −0.474 on weekdays and weekends, respectively. Moreover, the impact of traffic accessibility on weekdays is higher than that on rest days, the negative impact of traffic accessibility on stability is weaker on weekends, and the positive impact on vitality density is also weaker.
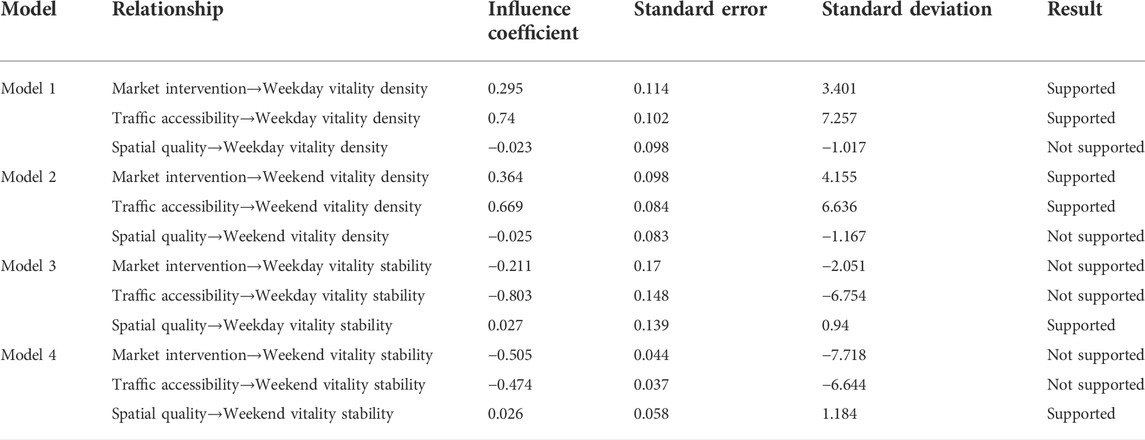
TABLE 6. Hypotheses tests.
This study is consistent with the view of traditional urban space vitality analysis that good transportation accessibility can increase the frequency of interaction between urban population and urban space, thereby enhancing the vitality of urban space (Delclòs-Alió and Miralles-Guasch, 2018; Niu et al., 2021; Yang et al., 2021). Some research results reveal the negative impact of transportation accessibility on urban vitality (Liu et al., 2021). This study also found that good transportation accessibility leads to a decrease in the stability of urban vitality.
Market intervention factors have a positive impact on the vitality of urban space, and their impact factors are 0.295 and 0.364 on weekdays and weekends, respectively. Thus, market intervention factors have a greater impact on the vitality of urban space on weekends. People tend to patronize market intervention facilities on weekends, and their consumption behavior is also more intensive. The factors of market intervention have a negative impact on the stability of urban spatial vitality on weekdays and weekends, and the impact is greater on weekends. This result fully shows that the more concentrated urban market facilities, the more unstable the urban vitality, especially on weekends.
Five observed variables representing attributes of the market intervention were found to positively affect the vitality: shopping facility, dining facilities, hotel accommodation, daily life, and leisure and entertainment. The results of shopping facilities and dining facilities are in line with previous findings (Xia et al., 2020; Li et al., 2021).
The influence of spatial quality on the vitality density and vitality stability of urban space is small whether it is a weekday or a rest day. The direct impact of spatial quality on the vitality density of urban space is −0.023 and −0.025 on weekdays and weekends, respectively. The direct impact of spatial quality on the stability of urban space vitality is 0.027 and 0.026 on weekdays and weekends, respectively. Thus, the richer the urban spatial quality, the lower the urban vitality density, and the better the sustainability of crowd space agglomeration.
In general, the intensity of the influence of spatial elements on the urban spatial vitality density is in descending order: traffic accessibility, market intervention, and spatial characteristics. Among them, the influence of spatial characteristics is small. Spatial characteristics have similar effects on the stability of urban vitality during weekdays and weekends. The influence of traffic accessibility on the stability of urban spatial vitality on weekdays is greater than that on rest days, and the impact of market intervention factors on the stability of urban spatial vitality on weekdays is smaller than that on rest days.
The research results show that the vitality density and vitality stability of the urban population are in opposite states whether it is a work day or a rest day. The spatial distribution pattern of its vitality density is basically consistent with previous studies (Delclòs-Alió and Miralles-Guasch, 2018; Liu and Long, 2019; Guo et al., 2021), that is, the urban center area has a high-vitality density, and the vitality density of urban fringe areas continues to decrease. However, the opposite pattern characteristics of vitality density and vitality stability are different from the research results of Shanghai waterfront space (Liu et al., 2021). We comparatively analyzed the results of this study and found a significant difference between the vitality distribution status of city-wide regions and smaller regions. In a smaller area, high dynamism and high stability coexist, but this situation is almost non-existent on the overall scale of the city. This finding illustrates the value of studying the spatial dynamism of a city as a whole. The impact of urban transportation accessibility on urban vitality density is significant; and the better the accessibility, the greater the vitality density. This finding is consistent with other research results (Lu et al., 2019; Niu et al., 2021). However, the effect of traffic accessibility on the stability of urban vitality is the opposite. In particular, efficient urban traffic often leads to high-frequency flow of urban people, but it is not conducive to the continuous gathering of urban people in the same space. The impact of market-led facilities on the vitality of urban spaces is similar to that of urban transport accessibility.
The study of urban spatial vitality patterns and influencing factors has important implications for urban spatial optimization and spatial structure adjustment. The urban spatial structure is the distribution state of different spatial attributes or spatial functions in the city, including the agglomeration and connection of spatial elements. From the perspective of attribute types, the spatial structure can be divided into the spatial structure of population distribution, green space structure, commercial spatial structure, and employment spatial structure (Wu and Plantinga, 2003; Gong et al., 2017; Mathey et al., 2021; Zhou, 2022). The agglomeration of public space and the connection between different agglomeration points have obvious interactive characteristics with the spatial agglomeration of urban people. This study clarifies the impact of different functional spaces on urban vitality, which has a good reference for urban space optimization and structural adjustment.
Research shows that the vitality and stability of urban space are affected by the elements of the urban built environment. In turn, the improvement of the vitality of urban public space will promote the optimization of urban space quality and its spatial structure. Urban transportation accessibility is the most critical factor affecting urban vitality, followed by market intervention attributes. The improvement in the stability of urban spatial vitality on weekends is mainly due to the decrease in the influence of traffic accessibility and the increase in the influence intensity of the elements of the market intervention attribute. Therefore, the adjustment of urban spatial structure should pay attention to the elements of urban traffic and market intervention attributes, and consider them together. The layout of facilities related to market intervention attributes should be increased in the periphery of the city center, especially the Jinxia area, Muyun area, University Town area and Moon Island area; in the Xianjiahu–Meixihu area and Xingsha area, short-distance traffic should be improved. The accessibility of the high-speed rail station, the exhibition area, and the Jingwanzi District to the city’s central business district should be improved.
The elements of spatial characteristic attributes have a weak negative impact on the urban spatial vitality density, but at the same time, they have a weak positive impact on the vitality stability. This may have a strong relationship with the environmental quality, scale, and supporting facilities of urban natural and human landscapes. Therefore, urban spaces with spatial characteristics should be optimized through landscape planning, environmental improvement, and regional support.
The improvement of urban space vitality is one of the core purposes of urban renewal and stock planning. At present, China’s urbanization process has entered the era of stock development. How to enhance the vitality of urban space through space optimization and create a city full of vitality is particularly urgent. Analyzing the spatial distribution of urban spatial vitality density and stability can provide important methods for urban physical examination and urban planning evaluation by ensuring that planners and policymakers can quickly and effectively identify urban-wide spatial vitality issues. The research analyzes the degree of influence of different influencing factors on the vitality of urban space, which provides a direct basis for the formulation of urban space development policy and space renewal. For example, in the optimization of market-led facilities, market-led facilities must be given proper guidance through urban policies, taxation, space environment improvement, and other methods to promote their rational layout. Spatial quality is the only element that has a positive effect on the vitality and stability of urban space. Thus, the optimization of urban space should focus on the combined planning or adjustment of featured spaces and other types of urban spaces.
The study analyzes the distribution pattern of urban spatial vitality density in different time periods and analyzes the urban vitality stability status on the basis of hourly changes in the urban population. Through SEM, the influencing factors of urban space vitality are discussed. The research provides a useful reference for urban spatial structure adjustment, stock planning and urban renewal, urban vitality enhancement, and spatial quality optimization.
However, similar to any empirical research, this study suffers from limitations. On the one hand, the research is insufficient in the analysis of urban function mixed feature intervention, micro-spatial features and design features, and spatial–temporal heterogeneity of influencing mechanisms. On the other hand, although an epidemic did not occur in the study area during the period selected in this study, the subsequent interference of the novel coronavirus disease (COVID-19) was insufficiently explained in this study. These shortcomings will be addressed through model optimization and feature mining, which we may explore in future research.
The purpose of this study was to analyze the distribution pattern of urban population in urban space at different time periods and to analyze the influencing factors of spatial vitality. The research uses MPSD to reveal the spatial vitality density and vitality stability of urban population on weekdays and rest days. On this basis, the influence mechanism of urban vitality density and vitality stability in different time periods was analyzed using the SEM model. The research provides a useful reference for urban space optimization and structural adjustment. The result shows
1) On the urban scale, the overall spatial vitality density and vitality stability show a reverse pattern, that is, the high-vitality density area presents a low-vitality stability state, and the low-vitality density area presents a low-vitality state. The city center area has the highest density of vitality due to the attraction of commercial centers. The city’s vitality density continues to decline from the urban center to the urban periphery.
2) The overall urban vitality density on rest days is slightly lower than that on weekdays, and the stability of vitality on rest days is significantly higher than that on weekdays. Xianjia Lake–Meixi Lake area, Xingsha area, Jingwanzi area, and University Town area performed better in rest day vitality density and vitality stability.
3) According to the structural equation model hypothesis, each model supports two hypotheses and rejects one hypothesis. Urban transportation accessibility has the greatest impact on the city’s vitality density at various time periods and the stability of the vitality on weekday, followed by market intervention facilities, and the least impact is on spatial characteristics. The impact of rest day traffic accessibility is slightly smaller than that of market intervention facilities. Urban transportation accessibility and market intervention facilities have a positive impact on urban vitality density and a negative impact on urban vitality stability. Spatial features are the opposite.
This study fully demonstrates a significant interaction between urban spatial vitality and vitality stability and the urban built environment. The adjustment of urban spatial structure should strengthen the coordination between the construction of urban transportation networks and the improvement of urban market intervention facilities to jointly promote the improvement of urban vitality and spatial quality. Taking Changsha City as an example, the study analyzes the spatial distribution pattern of spatial vitality density and vitality stability at the urban scale. The study uses MPSD and spatial facility location data. Considering that these types of data are easy to obtain, this method can inform other urban or regional studies. In addition, our research results provide a direct reference for the optimization of urban spatial environment. Particularly in the preliminary work of urban renewal and stock planning, it can play a key role, such as in the identification of urban problem spaces, the selection of renewal modes, and the cognition of spatial characteristics.
The original contributions presented in the study are included in the article/Supplementary Material; further inquiries can be directed to the corresponding author.
XX: conceptualization, methodology, and formal analysis. YZ: conceptualization and methodology. YZ: data curation and formal analysis. TR: writing—review and editing. YZ: writing—review and editing.
This work was financially supported by the Philosophy and Social Sciences Fund major projects in Sichuan Province, SC21EZD002, the Philosophy and Social Science Research Fund of the Chengdu University of Technology, YJ2021-QN007, and Open Foundation of the Research Center for Human Geography of Tibetan Plateau and Its Eastern Slope (Chengdu University of Technology), Grant number RWDL2021-YB010. Also, we want to thank the anonymous reviewers for their valuable suggestions and comments that contributed to improving the quality of the manuscript.
The authors declare that the research was conducted in the absence of any commercial or financial relationships that could be construed as a potential conflict of interest.
All claims expressed in this article are solely those of the authors and do not necessarily represent those of their affiliated organizations, or those of the publisher, the editors, and the reviewers. Any product that may be evaluated in this article, or claim that may be made by its manufacturer, is not guaranteed or endorsed by the publisher.
Batty, M. (2016). Empty buildings, shrinking cities and ghost towns. Environ. Plann. B. Plann. Des. 43 (1), 3–6. doi:10.1177/0265813515619858
Birenboim, A., and Shoval, N. (2016). Mobility research in the age of the smartphone. Ann. Am. Assoc. Geogr. 06 (2), 293–291. doi:10.1080/00045608.2015.1100058
Chen, N., and Akar, G. (2016). Effects of neighborhood types & socio-demographics on activity space. J. Transp. Geogr. 54, 112–121. doi:10.1016/j.jtrangeo.2016.05.017
Chen, Z., Dong, B., Pei, Q., and Zhang, Z. (2022). The impacts of urban vitality and urban density on innovation: Evidence from China's Greater Bay Area. Habitat Int. 119, 102490. doi:10.1016/j.habitatint.2021.102490
De Nadai, M., Staiano, J., Larcher, R., Sebe, N., Quercia, D., and Lepri, B. (2016). “The death and life of great Italian cities: A mobile phone data perspective,” in Proceedings of the 25th International Conference on World Wide Web, Montréal Québec Canada, April 11 - 15, 2016. Paper presented at the.
Delclòs-Alió, X., Gutiérrez, A., and Miralles-Guasch, C. (2019). The urban vitality conditions of Jane Jacobs in Barcelona: Residential and smartphone-based tracking measurements of the built environment in a Mediterranean metropolis. Cities 86, 220–228. doi:10.1016/j.cities.2018.09.021
Delclòs-Alió, X., and Miralles-Guasch, C. (2018). Looking at Barcelona through Jane Jacobs’s eyes: Mapping the basic conditions for urban vitality in a Mediterranean conurbation. Land Use Policy 75, 505–517. doi:10.1016/j.landusepol.2018.04.026
Dong, Y.-H., Peng, F.-L., and Guo, T.-F. (2021). Quantitative assessment method on urban vitality of metro-led underground space based on multi-source data: A case study of Shanghai inner ring area. Tunn. Undergr. Space Technol. 116, 104108. doi:10.1016/j.tust.2021.104108
Fan, Z., Duan, J., Luo, M., Zhan, H., Liu, M., Peng, W., et al. (2021). How did built environment affect urban vitality in urban waterfronts? A case study in nanjing reach of Yangtze River. ISPRS Int. J. Geoinf. 10 (9), 611. doi:10.3390/ijgi10090611
Fan, Z., Pei, T., Ma, T., Du, Y., Song, C., Liu, Z., et al. (2018). Estimation of urban crowd flux based on mobile phone location data: A case study of beijing, China. Comput. Environ. Urban Syst. 69, 114–123. doi:10.1016/j.compenvurbsys.2018.01.005
García-Palomares, J. C., Salas-Olmedo, M. H., Moya-Gómez, B., Condeço-Melhorado, A., and Gutiérrez, J. (2018). City dynamics through Twitter: Relationships between land use and spatiotemporal demographics. Cities 72, 310–319. doi:10.1016/j.cities.2017.09.007
Gehl, J., Kaefer, L. J., and Reigstad, S. (2006). Close encounters with buildings. Urban Des. Int. 11 (1), 29–47. doi:10.1057/palgrave.udi.9000162
Gong, Y., Lin, Y., and Duan, Z. (2017). Exploring the spatiotemporal structure of dynamic urban space using metro smart card records. Comput. Environ. Urban Syst. 64, 169–183. doi:10.1016/j.compenvurbsys.2017.02.003
Guo, X., Chen, H., and Yang, X. (2021). An evaluation of street dynamic vitality and its influential factors based on multi-source big data. ISPRS Int. J. Geoinf. 10 (3), 143. doi:10.3390/ijgi10030143
Guo, X., Yang, Y., Cheng, Z., Wu, Q., Li, C., Lo, T., et al. (2022). Spatial social interaction: An explanatory framework of urban space vitality and its preliminary verification. Cities 121, 103487. doi:10.1016/j.cities.2021.103487
Halkos, G., Leonti, A., and Sardianou, E. (2021). Activities, motivations and satisfaction of urban parks visitors: A structural equation modeling analysis. Econ. Anal. Policy 70, 502–513. doi:10.1016/j.eap.2021.04.005
He, Q., He, W., Song, Y., Wu, J., Yin, C., Mou, Y., et al. (2018). The impact of urban growth patterns on urban vitality in newly built-up areas based on an association rules analysis using geographical ‘big data. Land Use Policy 78, 726–738. doi:10.1016/j.landusepol.2018.07.020
Huang, D., Liu, Z., Zhao, X., and Zhao, P. (2017). Emerging polycentric megacity in China: An examination of employment subcenters and their influence on population distribution in Beijing. Cities 69, 36–45. doi:10.1016/j.cities.2017.05.013
Hui, C., Xianghui, W., Xiqiang, Z., and Shaoli, Z. (2014). “The evaluation of Chinese urban traffic management system Application based on intelligent traffic control technology,” in Paper presented at the 2014 7th International Conference on Intelligent Computation Technology and Automation, Changsha, China, Oct. 25 2014 to Oct. 26 2014.
Jiang, Y., Han, Y., Liu, M., and Ye, Y. (2022). Street vitality and built environment features: A data-informed approach from fourteen Chinese cities. Sustain. Cities Soc. 79, 103724. doi:10.1016/j.scs.2022.103724
Jin, X., Long, Y., Sun, W., Lu, Y., Yang, X., Tang, J., et al. (2017). Evaluating cities' vitality and identifying ghost cities in China with emerging geographical data. Cities 63, 98–109. doi:10.1016/j.cities.2017.01.002
Jo, H. I., and Jeon, J. Y. (2021). Overall environmental assessment in urban parks: Modelling audio-visual interaction with a structural equation model based on soundscape and landscape indices. Build. Environ. 204, 108166. doi:10.1016/j.buildenv.2021.108166
Kim, Y.-L. (2018). Seoul's Wi-Fi hotspots: Wi-Fi access points as an indicator of urban vitality. Comput. Environ. Urban Syst. 72, 13–24. doi:10.1016/j.compenvurbsys.2018.06.004
Laman, H., Yasmin, S., and Eluru, N. (2019). Using location-based social network data for activity intensity analysis: A case study of New York city. J. Transp. Land Use 12 (1), 723–740. doi:10.5198/jtlu.2019.1470
Lan, F., Gong, X., Da, H., and Wen, H. (2020). How do population inflow and social infrastructure affect urban vitality? Evidence from 35 large- and medium-sized cities in China. Cities 100, 102454. doi:10.1016/j.cities.2019.102454
Lang, W., Chen, T., and Li, X. (2016). A new style of urbanization in China: Transformation of urban rural communities. Habitat Int. 55, 1–9. doi:10.1016/j.habitatint.2015.10.009
Li, F., Li, F., Li, S., and Long, Y. (2020). Deciphering the recreational use of urban parks: Experiments using multi-source big data for all Chinese cities. Sci. Total Environ. 701, 134896. doi:10.1016/j.scitotenv.2019.134896
Li, J., Li, J., Yuan, Y., and Li, G. (2019). Spatiotemporal distribution characteristics and mechanism analysis of urban population density: A case of xi'an, shaanxi, China. Cities 86, 62–70. doi:10.1016/j.cities.2018.12.008
Li, M., Shen, Z., and Hao, X. (2016). Revealing the relationship between spatio-temporal distribution of population and urban function with social media data. Geojournal 81 (6), 919–935. doi:10.1007/s10708-016-9738-7
Li, Q., Cui, C., Liu, F., Wu, Q., Run, Y., Han, Z., et al. (2021). Multidimensional urban vitality on streets: Spatial patterns and influence factor identification using multisource urban data. ISPRS Int. J. Geoinf. 11 (1), 2. doi:10.3390/ijgi11010002
Li, S.-m., and Liu, Y. (2016). The jobs-housing relationship and commuting in Guangzhou, China: Hukou and dual structure. J. Transp. Geogr. 54, 286–294. doi:10.1016/j.jtrangeo.2016.06.014
Li, X., Li, Y., Jia, T., Zhou, L., and Hijazi, I. H. (2022). The six dimensions of built environment on urban vitality: Fusion evidence from multi-source data. Cities 121, 103482. doi:10.1016/j.cities.2021.103482
Lin, Y., Shui, W., Li, Z., Huang, S., Wu, K., Sun, X., et al. (2021). Green space optimization for rural vitality: Insights for planning and policy. Land Use Policy 108, 105545. doi:10.1016/j.landusepol.2021.105545
Liu, S., Lai, S.-Q., Liu, C., and Jiang, L. (2021). What influenced the vitality of the waterfront open space? A case study of huangpu river in Shanghai, China. Cities 114, 103197. doi:10.1016/j.cities.2021.103197
Liu, X., Song, Y., Wu, K., Wang, J., Li, D., Long, Y., et al. (2015). Understanding urban China with open data. Cities 47, 53–61. doi:10.1016/j.cities.2015.03.006
Liu, S, and Long, Y. (2019). Urban vitality area identification and pattern analysis from the perspective of time and space fusion. Sustainability 11 (15), 4032. doi:10.3390/su11154032
Lu, S., Shi, C., and Yang, X. (2019). Impacts of built environment on urban vitality: Regression analyses of beijing and Chengdu, China. Int. J. Environ. Res. Public Health 16 (23), 4592. doi:10.3390/ijerph16234592
Mathey, J., Hennersdorf, J., Lehmann, I., and Wende, W. (2021)., 125. Germany, 107519. doi:10.1016/j.ecolind.2021.107519Qualifying the urban structure type approach for urban green space analysis – a case study of Dresden, GermanyEcol. Indic.
Meng, Y., and Xing, H. (2019). Exploring the relationship between landscape characteristics and urban vibrancy: A case study using morphology and review data. Cities 95, 102389. doi:10.1016/j.cities.2019.102389
Mouratidis, K., and Poortinga, W. (2020). Built environment, urban vitality and social cohesion: Do vibrant neighborhoods foster strong communities? Landsc. Urban Plan. 204, 103951. doi:10.1016/j.landurbplan.2020.103951
Mu, B., Liu, C., Mu, T., Xu, X., Tian, G., Zhang, Y., et al. (2021). Spatiotemporal fluctuations in urban park spatial vitality determined by on-site observation and behavior mapping: A case study of three parks in zhengzhou city, China. Urban For. Urban Green. 64, 127246. doi:10.1016/j.ufug.2021.127246
Mushkani, R. A., and Ono, H. (2021). The role of land use and vitality in fostering gender equality in urban public parks: The case of Kabul city, Afghanistan. Habitat Int. 118, 102462. doi:10.1016/j.habitatint.2021.102462
Najaf, P., Thill, J.-C., Zhang, W., and Fields, M. G. (2018). City-level urban form and traffic safety: A structural equation modeling analysis of direct and indirect effects. J. Transp. Geogr. 69, 257–270. doi:10.1016/j.jtrangeo.2018.05.003
Niu, Y., Mi, X., and Wang, Z. (2021). Vitality evaluation of the waterfront space in the ancient city of Suzhou. Front. Archit. Res. 10 (4), 729–740. doi:10.1016/j.foar.2021.07.001
Pakoz, M. Z., and Isik, M. (2022). Rethinking urban density, vitality and healthy environment in the post-pandemic city: The case of Istanbul. Cities 124, 103598. doi:10.1016/j.cities.2022.103598
Qian, C., Li, W., Duan, Z., Yang, D., and Ran, B. (2021). Using mobile phone data to determine spatial correlations between tourism facilities. J. Transp. Geogr. 92, 103018. doi:10.1016/j.jtrangeo.2021.103018
Shami, M. R., Rad, V. B., and Moinifar, M. (2022). The structural model of indicators for evaluating the quality of urban smart living. Technol. Forecast. Soc. Change 176, 121427. doi:10.1016/j.techfore.2021.121427
Shi, J., Miao, W., Si, H., and Liu, T. (2021). Urban vitality evaluation and spatial correlation research: A case study from Shanghai, China. Land 10 (11), 1195. doi:10.3390/land10111195
Sung, H., and Lee, S. (2015). Residential built environment and walking activity: Empirical evidence of Jane Jacobs’ urban vitality. Transp. Res. Part D Transp. Environ. 41, 318–329. doi:10.1016/j.trd.2015.09.009
Tang, L., Lin, Y., Li, S., Li, S., Li, J., Ren, F., et al. (2018). Exploring the influence of urban form on urban vibrancy in shenzhen based on mobile phone data. Sustainability 10 (12), 4565. doi:10.3390/su10124565
Tong, D., Yuan, Y., and Wang, X. (2021). The coupled relationships between land development and land ownership at China’s urban fringe: A structural equation modeling approach. Land Use Policy 100, 104925. doi:10.1016/j.landusepol.2020.104925
Tu, W., Zhu, T., Xia, J., Zhou, Y., Lai, Y., Jiang, J., et al. (2020). Portraying the spatial dynamics of urban vibrancy using multisource urban big data. Comput. Environ. Urban Syst. 80, 101428. doi:10.1016/j.compenvurbsys.2019.101428
Wang, M., Madden, M., and Liu, X. (2017). Exploring the relationship between urban forms and CO2 emissions in 104 Chinese cities. J. Urban Plan. Dev. 143 (4). doi:10.1061/(asce)up.1943-5444.0000400
Wang, X., Zhang, Y., Yu, D., Qi, J., and Li, S. (2022). Investigating the spatiotemporal pattern of urban vibrancy and its determinants: Spatial big data analyses in Beijing, China. Land Use Policy 119, 106162. doi:10.1016/j.landusepol.2022.106162
Wu, C., Ye, X., Ren, F., and Du, Q. (2018). Check-in behaviour and spatio-temporal vibrancy: An exploratory analysis in Shenzhen, China. Cities 77, 104–116. doi:10.1016/j.cities.2018.01.017
Wu, J., and Plantinga, A. J. (2003). The influence of public open space on urban spatial structure. J. Environ. Econ. Manage. 46 (2), 288–309. doi:10.1016/s0095-0696(03)00023-8
Wu, J., Ta, N., Song, Y., Lin, J., and Chai, Y. (2018). Urban form breeds neighborhood vibrancy: A case study using a GPS-based activity survey in suburban beijing. Cities 74, 100–108. doi:10.1016/j.cities.2017.11.008
Wu, W., and Niu, X. (2019). Influence of built environment on urban vitality: Case study of Shanghai using mobile phone location data. J. Urban Plan. Dev. 145 (3). doi:10.1061/(asce)up.1943-5444.0000513
Xia, C., Wang, H., Zhang, A., and Zhang, W. (2017). A high-performance cellular automata model for urban simulation based on vectorization and parallel computing technology. Int. J. Geogr. Inf. Sci. 32 (2), 399–424. doi:10.1080/13658816.2017.1390118
Xia, C., Yeh, A. G.-O., and Zhang, A. (2020). Analyzing spatial relationships between urban land use intensity and urban vitality at street block level: A case study of five Chinese megacities. Landsc. Urban Plann. 193, 103669. doi:10.1016/j.landurbplan.2019.103669
Xia, C., Zhang, A., Wang, H., Zhang, B., and Zhang, Y. (2019). Bidirectional urban flows in rapidly urbanizing metropolitan areas and their macro and micro impacts on urban growth: A case study of the Yangtze River middle reaches megalopolis, China. Land Use Policy 82, 158–168. doi:10.1016/j.landusepol.2018.12.007
Xiao, Y., Wang, D., and Fang, J. (2019). Exploring the disparities in park access through mobile phone data: Evidence from Shanghai, China. Landsc. Urban Plan. 181, 80–91. doi:10.1016/j.landurbplan.2018.09.013
Xie, M., Chen, J., Zhang, Q., Li, H., Fu, M., Breuste, J., et al. (2020). Dominant landscape indicators and their dominant areas influencing urban thermal environment based on structural equation model. Ecol. Indic. 111, 105992. doi:10.1016/j.ecolind.2019.105992
Xu, Y., and Chen, X. (2021). Quantitative analysis of spatial vitality and spatial characteristics of urban underground space (UUS) in metro area. Tunn. Undergr. Space Technol. 111, 103875. doi:10.1016/j.tust.2021.103875
Yang, J., Cao, J., and Zhou, Y. (2021). Elaborating non-linear associations and synergies of subway access and land uses with urban vitality in Shenzhen. Transp. Res. Part A Policy Pract. 144, 74–88. doi:10.1016/j.tra.2020.11.014
Ye, Y., Li, D., and Liu, X. (2017). How block density and typology affect urban vitality: An exploratory analysis in shenzhen, China. Urban Geogr. 39 (4), 631–652. doi:10.1080/02723638.2017.1381536
Yin, L., Lin, N., and Zhao, Z. (2021). Mining daily activity chains from large-scale mobile phone location data. Cities 109, 103013. doi:10.1016/j.cities.2020.103013
Yue, W., Chen, Y., Thy, P. T. M., Fan, P., Liu, Y., Zhang, W., et al. (2021). Identifying urban vitality in metropolitan areas of developing countries from a comparative perspective: Ho chi minh city versus Shanghai. Sustain. Cities Soc. 65, 102609. doi:10.1016/j.scs.2020.102609
Yue, Y., Zhuang, Y., Yeh, A. G. O., Xie, J.-Y., Ma, C.-L., Li, Q.-Q., et al. (2016). Measurements of POI-based mixed use and their relationships with neighbourhood vibrancy. Int. J. Geogr. Inf. Sci. 31 (4), 658–675. doi:10.1080/13658816.2016.1220561
Zeng, C., Song, Y., He, Q., and Shen, F. (2018). Spatially explicit assessment on urban vitality: Case studies in Chicago and Wuhan. Sustain. Cities Soc. 40, 296–306. doi:10.1016/j.scs.2018.04.021
Zheng, Q., Deng, J., Jiang, R., Wang, K., Xue, X., Lin, Y., et al. (2017). Monitoring and assessing “ghost cities” in Northeast China from the view of nighttime light remote sensing data. Habitat Int. 70, 34–42. doi:10.1016/j.habitatint.2017.10.005
Zhou, N. (2022). Research on urban spatial structure based on the dual constraints of geographic environment and POI big data. J. King Saud Univ. - Sci. 34 (3), 101887. doi:10.1016/j.jksus.2022.101887
Keywords: space vitality, spatial pattern, environmental influence, (MPSD) mobile phone signaling data, Changsha
Citation: Xia X, Zhang Y, Zhang Y and Rao T (2022) The spatial pattern and influence mechanism of urban vitality: A case study of Changsha, China. Front. Environ. Sci. 10:942577. doi: 10.3389/fenvs.2022.942577
Received: 12 May 2022; Accepted: 14 July 2022;
Published: 10 August 2022.
Edited by:
Jiaxing Cui, Central China Normal University, ChinaReviewed by:
Qingsong He, Huazhong University of Science and Technology, ChinaCopyright © 2022 Xia, Zhang, Zhang and Rao. This is an open-access article distributed under the terms of the Creative Commons Attribution License (CC BY). The use, distribution or reproduction in other forums is permitted, provided the original author(s) and the copyright owner(s) are credited and that the original publication in this journal is cited, in accordance with accepted academic practice. No use, distribution or reproduction is permitted which does not comply with these terms.
*Correspondence: Yang Zhang, emhhbmd5YW5nMjAyMEBjZHV0LmVkdS5jbg==
Disclaimer: All claims expressed in this article are solely those of the authors and do not necessarily represent those of their affiliated organizations, or those of the publisher, the editors and the reviewers. Any product that may be evaluated in this article or claim that may be made by its manufacturer is not guaranteed or endorsed by the publisher.
Research integrity at Frontiers
Learn more about the work of our research integrity team to safeguard the quality of each article we publish.