- 1School of Metallurgy and Environment, Central South University, Changsha, China
- 2Department of Science and Environmental Studies, The Education University of Hong Kong, Tai Po, China
The spatial distribution, migration characteristics, and ecological risks of heavy metals in manganese (Mn) contaminated sites were studied by field investigation and geostatistical analysis. In this study, surface soil samples were collected from an Mn mine wasteland and the soil in this area was polluted by Mn, Pb, Cu, Cd, Zn, and Cr, and the corresponding element concentrations were 16.3, 15.4, 15.0, 9.90, 6.10, and 1.1 times of the limited standard, respectively. In addition, the soil in different samples in the same region has obvious heterogeneity. By using X-ray fluorescence spectrometry (XRF) and inductively coupled plasma-mass spectrometry (ICP-MS), the heavy metal concentrations in soil samples were determined. ICP-MS corroborated XRF for soil heavy metal determination and showed that XRF was a reliable and quick alternative for heavy metal determination in soil. To discover heavy metal distribution trends, distribution maps of heavy metals were created using the Kriging interpolation method. The geoaccumulation index (Igeo), improved Nemerow index (INI), and potential ecological risk index (RI) was used to assess the pollution degree and the environmental risk of metal pollution in the study area. The contamination degree of heavy metal is Mn > Cd > Pb > Zn > Cu > Cr. The spatial distribution and risk assessment of heavy metals in manganese contaminated sites will help to monitor the migration trajectory of heavy metals in mining areas and protect the soil from long-term accumulation of heavy metals. It provides the basis for heavy metal pollution remediation strategy and ecological risk management.
Introduction
Long-term mining of metal mines is often accompanied by serious heavy metal pollution problems. With the mining, processing, and smelting of metal ores by enterprises, a large number of mine wastes are generated (Kefeni et al., 2017). These mining wastes are usually stored directly, in which heavy metals enter soil and water through atmospheric transmission, rainfall leaching, and surface runoff (Sd et al., 2022), causing serious harm to the local ecological environment and human health.
Due to the high content of heavy metals in abandoned areas of Mn mining area, the survival rate of vegetation is low and the landscape value is poor (Wei et al., 2014). Heavy metal pollution may further affect human health through the soil, water, and atmosphere. The contents of Mn, chromium, and lead in the crust are low, but with industrial activities, a large number of bivalent Mn is released into water and soil (Farjana et al., 2019). In addition, the landfill of Mn ore waste is one of the important causes of excessive Mn in soil, which seriously endangers the health of surrounding residents (Petitjean et al., 2021). For example, pregnant women’s long-term exposure to high concentrations of heavy metals easily leads to low birth weight, premature delivery, and fetal malformation (Luo et al., 2018). Scholars’ studies have shown that the main reason for the excessive heavy metals in the soil of Mn ore wasteland is the nonstandard treatment and disposal of chemical waste and metal waste in the production process of a large number of Mn products (Tsurtsumia et al., 2019). After entering the natural environment, due to the interaction of natural systems, heavy metals may spread to many parts of the ecosystem (Farrell et al., 2020). Due to the high content of heavy metals in the soil around the Mn mining wasteland, some countries, including China, have taken measures to formulate pollutant emission standard limits for the Mn production industry.
Most Mn deposits in China are distributed in some provinces in the south, which has also caused a series of environmental problems (Jiang et al., 2019). In Hunan Province of China, due to the exploitation and smelting of Mn ore, a large number of solid wastes have been produced, and inappropriate treatment and disposal harm the environment and human health. Most Mn mines in Hunan province are shut down due to environmental regulations. Despite years of natural recovery, the number of plants remains low, perhaps due to the abundance of Mn and other heavy metals in the soil (Luo et al., 2020).
Few investigations on the distribution and causes of heavy metal pollutants in contaminated sites of metal mines. Spatial interpolation methods are usually used to characterize environmental pollution problems (Liu and Yan, 2021). Investigations of heavy metals transport patterns and prospective risk area evaluations have used the spatial interpolation method (Trojanowska and Wietlik, 2020). The visualization of heavy metal soil pollution can provide a basis for pollution control, environmental remediation, and human and environmental health risk assessment (Lin et al., 2019).
This research aimed to discuss the distribution and transport properties of heavy metals utilizing a study area of soil. The aims of this study were: 1) Characteristics of heavy-metal fluctuation in emissions in areas with active polluted sites; 2) The spatial distribution at both the mining and polluted sites; and 3) The characteristics of the mode of transport are largely used to determine the danger of heavy metal.
Materials and methods
Study area description, samples collection, and pre-treatment
The location of this study is located in an Mn mine in Hunan Province, China (Figure 1). The dominant wind direction in this area is northwest wind. The majority of the waste generated during the mining process has been built up at random throughout the years, resulting in a mine waste region. The study area is an Mn mine wasteland filled with slag from mining, mineral processing, and smelting. The upper soil is about 50 cm. Even in the 50-year-old slag layer’s natural recovery, the vegetation is mostly herbaceous plants, with few shrubs and trees, and the plant cover. There were mining and smelting activities in the northwest of the study area.
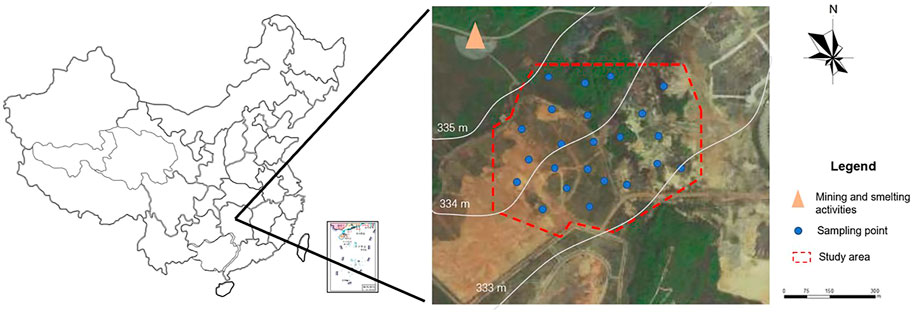
FIGURE 1. The distribution map showing the location of the study area and sampling point. The blue point is the sampling point, and the red line region is the scope of the study area. There were mining and smelting activities around the triangle area. The prevailing wind in the region is northwesterly.
We collected 23 soil samples in the study area (Figure 1). After removing soil impurities, the soil samples were collected at the surface until 5–15 cm depth. All samples were stored in a pollutant-free environment and transported back to the laboratory. The location of the sampling points was established using the Global Positioning System (GPS). The sample was placed in a 60°C oven for 10 h to constant weight. Then the sample particle size was crushed to less than 0.15 mm for heavy metal determination. Soil samples with particle size less than 2 mm for pH determination.
Heavy metal determination by ICP-MS and XRF
The pH values were measured by a pH meter, with a soil-water ratio of 1:2.5 (W/V). 0.25–0.5 g (accurate to 0.0001 g) of air-dried and screened samples were placed in the digestion tank, and 6 ml nitric acid, 3 ml hydrochloric acid, and 2 ml hydrofluoric acid were added in turn to make the sample and digestion solution fully mixed. After digestion, the solution in the digestion tank was transferred to the crucible, and the digestion tank and the cover were washed with deionized water and poured into the crucible. Place the crucible on a temperature-controlled heating device to remove the residual acid in the solution. The solution was heated and concentrated until the residual acid of the solution was removed. After cooling, the crucible is washed with deionized water, and then all liquids are put in a 25 ml volumetric flask. The solution was determined by Inductively Coupled Plasma mass spectrometry (ICP-MS) (Agilent, 7700x, California, United States).
High-definition X-ray fluorescence (HDXRF) technology adopted by E-MAX (XOS, America): The technology uses advanced monochromatic and focused optical devices to greatly improve the signal-to-noise ratio. In this system, the hyperbolic curved crystal optical device transfers the multi-color light from the ray source into the monochromatic light and effectively focuses on the small area of the measured sample. The sample was excited by a focused monochromatic beam to emit a fluorescence X-ray. The detector processes the signal to obtain the elements and concentration contained in the sample.
Methodology for determining pollutant levels
Geochemical pollution indices, including the Geo-accumulation index, were used to determine the level of pollution of particular heavy metals in soils (Igeo) (Kamani et al., 2017), To determine the degree of pollution, single metal geoaccumulation indexes were produced (Liu et al., 2022) expression:
Here, i is the heavy metal element, r is the samples, Tri is the toxic reaction factor (unit less); Cri is the single pollution coefficient (unit less); Csi means the calculated concentration (mg/kg); Cni refers to the background (mg/kg). CSample is the heavy metal concentration, and CBackground is the metal’s local background concentration. To compensate for the lithospheric effects in the background matrix, a factor of 1.5 was added to the equation. The Geo-accumulation Index (Igeo) and Ecological Risk Index (Eri) have the same link between contamination level and value (Table 1).
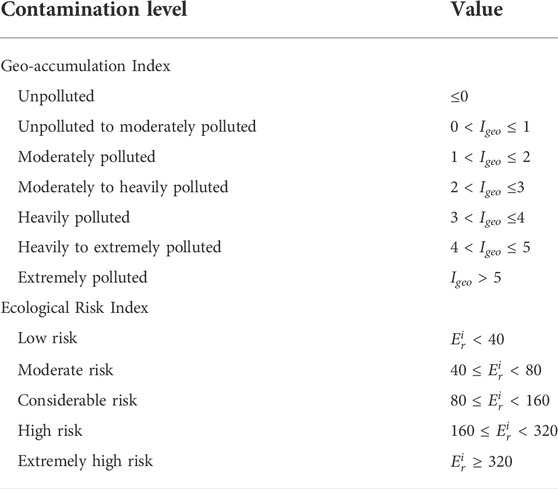
TABLE 1. The Geo-accumulation Index (Igeo) and Ecological Risk Index (Eri) have the same link between contamination level and value.
The Improved Nemerow index (INI) was created to measure the total ecological risks of all heavy metals considered. Unlike the Igeo index, which can only assess the level of pollution produced by individual components, the INI (no unit) index may analyze the total pollution generated by all elements. It has the following definition:
The maximum and average values of Igeo for heavy metals are Igeomax and Igeoavg, respectively. The INI categorization level was established in (Table2).
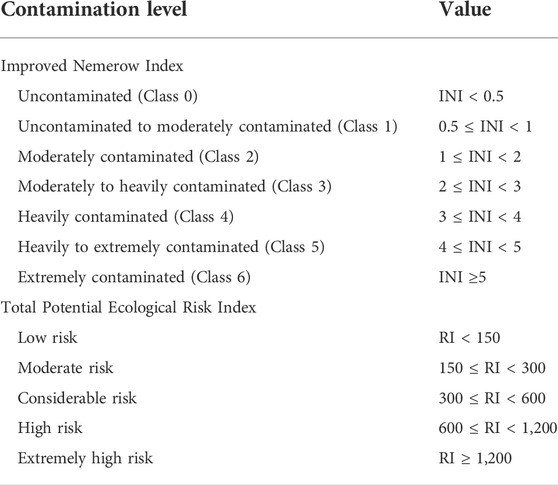
TABLE 2. The Improved Nemerow Index (INI) and Total Potential Ecological Risk Index have a similar association between value and classification level (RI).
The potential ecological risk (RI) index was created to estimate the possible impact of contaminants on ecosystems (Lars, 1980), This can be used to assess the level of risk that all soil heavy metals pose to the ecosystem. The following formula can be used to compute the RI:
To assess the possible ecological damage posed by overall levels of contamination in surface sediments, the toxicity of heavy metals is taken into account. It can assess the risk of single heavy metals and the ecological risk of multiple heavy metals in a given study area. Where RI (no unit) is the total potential ecological risk index for all heavy metals, Eri (no unit) is the single ecological risk index for a given element, Tri is the toxic response coefficient (no unit), Cfi (no unit) is the element’s pollution coefficient, Ci is the element’s measured concentration (mg/kg), and Cbi is the element’s reference value (mg/kg). Mn, Cu, Cr, Zn, Pb, and Cd had Tri values of 1.5, 2, 1, 5, and 30 respectively. The RI assessment criteria were displayed in Table 2.
Statistical analysis
The following descriptive statistics were used: mean median, maximum, minimum, standard deviation, and coefficient of variation. To depict the degree of dispersion distribution of distinct heavy metals and to indirectly suggest the activity of the selected elements in the studied environment, standard deviation and coefficient of variation were added.
All statistical analyses were performed at a significance level of 0.05 using the SPSS for Windows software version 16.0 (SPSS Inc., Chicago, IL, United States). To determine the level of contamination, the Kriging interpolation method was used (Kumar, 2015). The spatial distribution maps of heavy metals in the study area were graphically and digitally presented using spatial interpolation and GIS mapping.
Results and discussion
Physico-chemical characteristics
Table 3 shows descriptive data for the basic parameters and heavy metal concentrations in soils. The mobility and solubility of heavy metals in soils are related to pH (Huang et al., 2013). Wide pH ranges in soils (3.61–7.44) may be linked to the influence of external variables at each sampling location. The pH of the soils surrounding the contaminated area is influenced by a variety of causes, including mining and smelting activities (Shao and Zhu, 2020). The property parameters of the obtained samples in general indicated a lot of variation in the study area. It can be seen that the contents of six heavy metals in the soil of the mining area are significantly different. In all samples, heavy metal elements (Mn, Pb, Cu, Cd, Zn, and Cr) contented in 50.2–55,569.2 mg/kg, 5.8–1,585.3 mg/kg, 17.4–727.1 mg/kg, 0–5.4 mg/kg, 0–213.6 mg/kg, 62.7–1,386.9 mg/kg. Since this area was the area of Mn tailings, the Mn content was far higher than other heavy metals, followed by Pb, Zn, Cu, Cd, and Cr content the lowest. Compared with the soil background value of Hunan Province, the six metals in the study area exceeded the standard in varying degrees. In the measured samples, the maximum exceeding the rate of Mn reached 121 times. The average exceeding rates of Mn, cadmium, lead, copper, zinc, and chromium were 16.3, 15.4, 15.0, 9.9, 6.1, and 1.1 times, respectively. In all sampling points, the same heavy metal elements exceed the standard degree was different, Cu, Cd, and Pb content higher than the background value of soil in Hunan Province exceed the standard rate of 92%, Mn and Zn was 83%, Cr exceeds the standard site was less, 42%. The coefficients of variation (CV) for Mn, Cr, Pb, Cd, Zn, and Cu are 216.5%, 72.2%, 103.7%, 92.7%, 75.2%, and 87.6%, respectively, according to the variation coefficients. Natural or extrinsic causes are linked to spatial variability (Zhao et al., 2010). The fact that the element data is so variable shows that the spatial distribution of these items is not uniform (Ahmed A. and Jianhua et al., 2015). Furthermore, the great variability could be due to natural fluctuations as well as external causes. The weathering of parent materials is primarily responsible for natural variability, whereas anthropogenic actions are responsible for extrinsic variability. Mn, Cu, Pb, Zn, Cd, and Cr have far higher concentrations than background concentrations, and their high variability (35% ˂ CV) suggests that their concentration distributions may be influenced by natural variation as well as human activities such as pollutant emissions from industrial enterprises; tailings wind erosion, and mining and smelting (Li et al., 2017). Traceability analysis of heavy metal pollution shows that metal mining and processing activities have the highest contribution rate to heavy metals.

TABLE 3. Heavy metal concentrations and fundamental characteristics in soils sampled in this study (mg/kg): Descriptive statistics.
Comparison of heavy metal contents determined by ICP-MS and XRF
XRF has been consistently refined and enhanced in recent years, and its precision has substantially improved. The concentration of heavy metals in soil was determined using an XRF instrument made by a specific technological business, and the results were compared to the ICP-MS. Heavy metal content in samples was determined by E-MAX based on HDXRF. We compared the average content of heavy metals in soil obtained by ICP-MS and XRF methods (Figure 2). The results showed that the average Mn content determined by ICP-MS is 7000 mg/kg, the XRF is 8,200 mg/kg, and the error is 14.6%. For Pb Mn content determined by ICP-MS is 432 mg/kg, XRF is 712 mg/kg, and the error is 40%. ICP-MS values of the other four elements (Cd, Cr, Zn, Cu) are close to XRF values. The above results show that in addition to Pb, the errors of the other five heavy metals determined by IC-MS and XRF are within 15%, in other words, the findings could support the use of XRF to determine the heavy metal content in the soil.
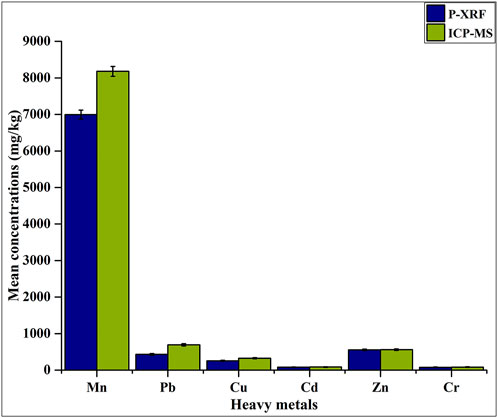
FIGURE 2. Comparative of ICP-MS and XRF method for determination of soil heavy metal concentration. The heavy metals include Mn, Pb, Cu, Cr, Cd and Zn.
Spatial distribution of heavy metals in Mn contaminated sites
To gain visual information on the spatial distributions of the heavy metals, kriging interpolation was used on all of the samples as a digital mapping method. The following three observations are drawn from the spatial distribution maps of Mn, Cu, Pb, Zn, Cd, and Cr (Figure 2). The Mn, Cu, Pb, Zn, Cd, and Cr distribution trends are comparable, indicating that the contaminants are released from a single source. In the absence of other pollution sources, pollution levels of Mn, Cu, Pb, Zn, Cd, and Cr are slightly greater in the major wind direction (northwestern) than in other directions (Figure 3). This is because trace metal-containing soil is disseminated by the wind and enters the topsoil via dry and wet deposition from the atmosphere, resulting in disparities in metal distribution patterns in the soil (Liang et al., 2017). Windborne transport and atmospheric deposition of dust may have a significant influence on the spread of pollutants (Liu et al., 2019). According to the findings, the impacted region and heavy metal transport pathways were most likely revealed in the study area. Cr, Mn, and Cd have smooth and consistent distribution patterns. Cr, Mn, and Cd geographical distributions likewise revealed an ambiguous association between their distribution trends and the Mn contaminated. This could indicate that natural mechanisms such as weathering and leaching of source elements were mostly responsible for their distributions (Li et al., 2021).
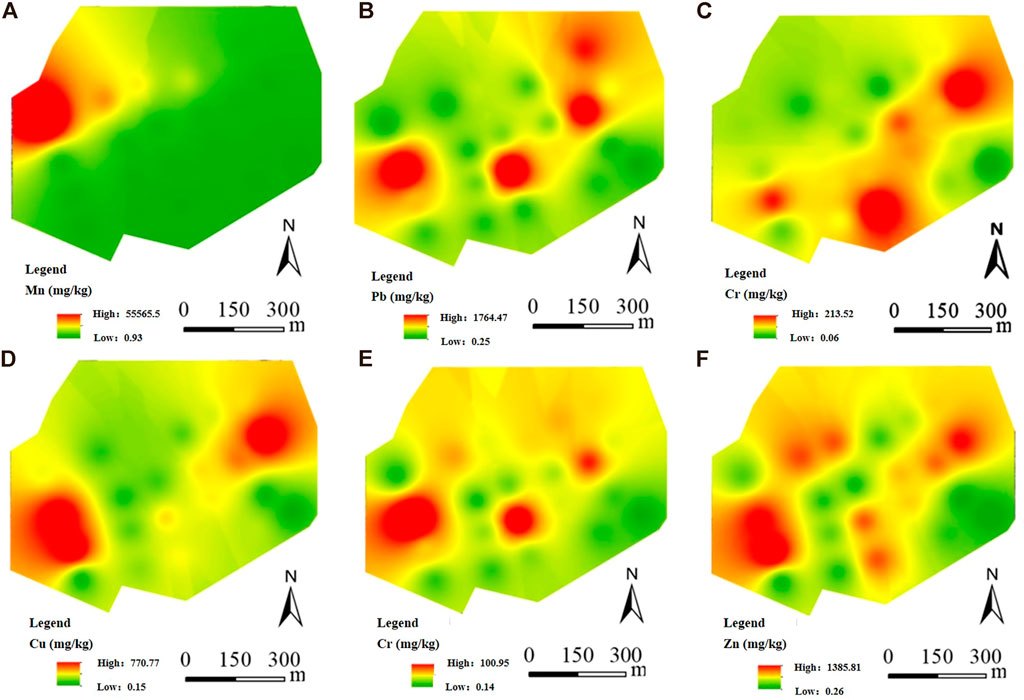
FIGURE 3. Spatial distribution characteristic maps of heavy metals concentration (Mn, Pb, Cu, Cr, Cd, and Zn) in surface soil over the study area. revised: Spatial distribution characteristic maps of heavy metals concentration [(A–F): Mn, Pb, Cu, Cr, Cd and Zn] in surface soil over the study area.
Pollution levels, ecological risk assessment, and recommendation treatment strategies
The Kriging interpolation method was used to construct distribution maps to detect heavy metal distribution trends. To estimate the environmental risk of metal contamination in the study area, the geoaccumulation index (Igeo), improved Nemerow index (INI) and the potential ecological risk index (RI) were utilized.
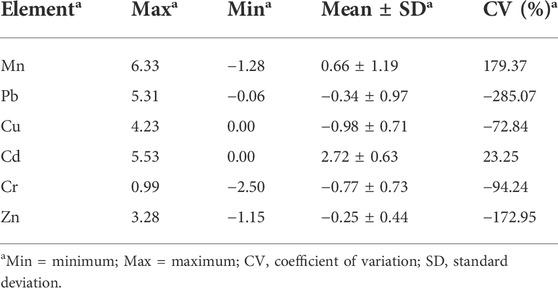
Through an in-depth evaluation of single metal geographic accumulation, we can determine the degree of heavy metal environmental pollution and evaluate its potential risk (Jamil et al., 2022). The results show that the geological accumulation index of Cr is less than 1, indicating that the site Cr is pollution-free and mild pollution, and most areas are mild pollution (Table 1 and Table 4). In particular, the maximum Igeo of Mn, Cd, and Pb exceeded 5 and belong to extremely polluted levels, which were 6.33, 5.53, and 5.31, respectively. Among them, the Igeo of Mn was the largest. As a result, their accumulation in soils posed a clear threat to the environment’s quality. The pollution area of Mn is concentrated in the northwest direction of the site, while the pollution area of Pb and Cd is scattered and shows spatial heterogeneity, indicating that the Pb and Cd have strong migration. Overall, the contamination degree of heavy metal is Mn > Cd > Pb > Zn > Cu > Cr. Nevertheless, the Igeo values of Mn, Cu, Pb, Zn, Cd, and Cr have considerable CV values, indicating that heavy metal pollution levels vary considerably in surface soil in the study area, possibly due to wind and vegetation cover (Remon et al., 2005). In addition, the Kriging method was used to interpolate the Igeo values of six heavy metals to determine the distribution of pollution degree (Figure 4). An interesting result is that Mn pollution is higher at high altitudes and lower at low altitudes, which may be caused by the leaching and migration of tailings by rainwater (Guo et al., 2017). Due to wind, natural weathering, or rainwater leaching, heavy metals in Mn tailings can spread and diffuse throughout the region (Chandrasekaran et al., 2015).
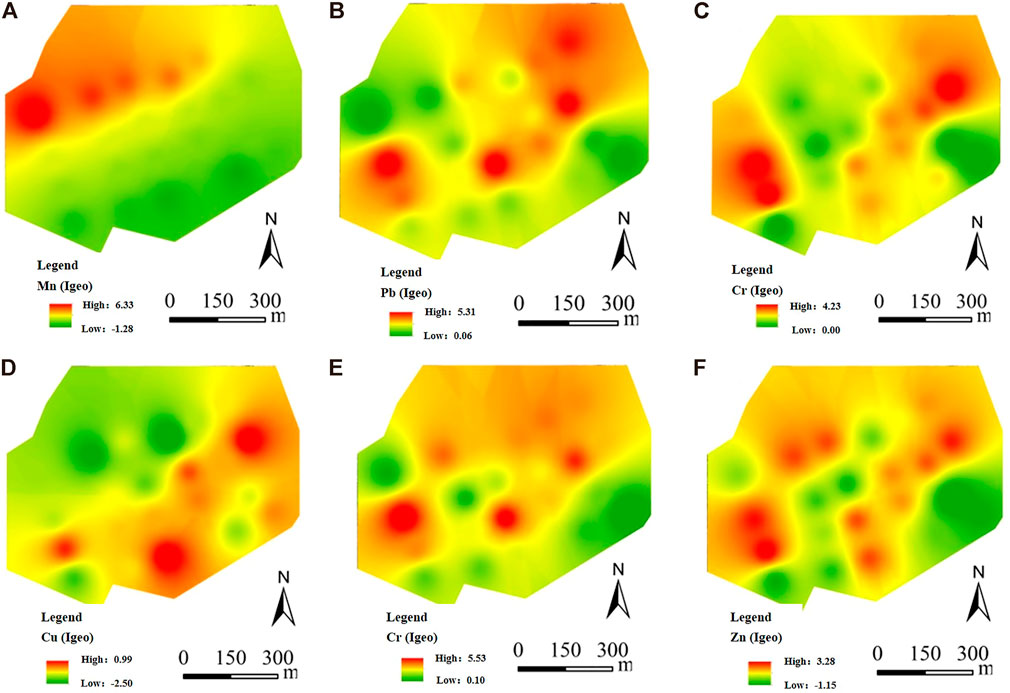
FIGURE 4. Spatial distribution characteristic maps of heavy metal [(A–F): Mn, Pb, Cu, Cr, Cd, and Zn] geoaccumulation index (Igeo) maps. Heavy pollution is red and light pollution is green.
The Igeo can only reflect the pollution degree caused by a single heavy metal, but cannot reflect the comprehensive pollution degree of composite heavy metals (Jie et al., 2012). Therefore, INI was used to further evaluate the ecological risk of total heavy metals in the surface soil of Mn-contaminated sites. The results showed that the northwest side of the site was seriously polluted by the overall heavy metals, and the maximum value of INI is 8.17, which is lower than that in the southeast (Figure 5A). We also assessed the potential ecological risk (RI) of overall heavy metal pollution (Figure 5B). The results showed that the highest ecological risk of heavy metals was in the west, middle, and northeast of the site. The RI of heavy metals in the southeast and north-central regions is low, which may be due to the vegetation cover in this part of the region, which reduces the risk of heavy metal migration. There is a certain correlation between the overall heavy metal pollution degree presented by INI and the ecological risk predicted by RI (Sakan et al., 2015).
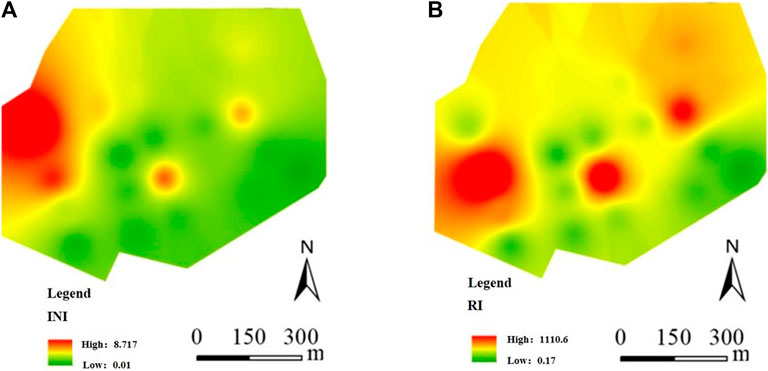
FIGURE 5. Heavy metal contamination in soils was assessed using the improved Nemerow index (INI) and the Potential Ecological Risk Index (RI).
Some treatment strategies are proposed for heavy metal pollution and ecological risk in the study area. Lightly polluted heavy metals in the study area can be used by phytoremediation and microbial remediation methods, such as planting heavy metal enrichment tree species and adding Mn, Cd, and Pb mineralized bacteria to contaminated soil. Heavy pollution in the study area can be repaired by chemical methods, such as adding heavy metal passivation materials (phosphate materials, alkaline materials, and biochar materials).
Conclusion
The distribution patterns of heavy metals in soils around an Mn contaminated site in central China were disclosed using tools, methodologies, and indices. Trace metals (Mn, Cu, Pb, Zn, Cd, Cr) in the topsoil of the Xiangtan Mn contaminated site and the surrounding area were investigated for their source, spatial distribution, and ecological danger. The spatial distribution maps of heavy metals in the research area were created using spatial interpolation and the GIS mapping approach. Wind, distance, and vegetation coverage all have an impact on the spatial distribution patterns of Cu, Zn, Cr, Cd, Pb, and Mn. XRF results showed that heavy metals in the region exceeded the standard to varying degrees, and the values exceeding the standard were 16.3–1.1 times. Mn content was the highest, and its highest concentration exceeded the standard value by about 121 times. The comparison results of XRF and ICP-MS showed that there were certain differences in the measurement results of different methods, but the differences were within the acceptable range of research. Their regional distribution trends also align with the primary wind direction, according to the findings. The assessment of environmental quality will be used to monitor and protect soils in the contaminated site.
Data availability statement
The original contributions presented in the study are included in the article/supplementary material, further inquiries can be directed to the corresponding authors.
Author contributions
The overarching research goals were developed by CW and YL. YL and GK carried out experiments and conducted the first draft of the manuscript. YL reply to the reviewer’s comment and revised the manuscript. WL guided the study and reviewed the manuscript. YC reviewed the manuscript and proposed some important advice.
Funding
This work was financially supported by the Hunan Key Research and Development Program of China (2020WK 2005), National Natural Science Foundation of China (No. 42177392), and Dean’s Research Fund 2020/21 (Project code: 04626) of the Education University of Hong Kong.
Conflict of interest
The authors declare that the research was conducted in the absence of any commercial or financial relationships that could be construed as a potential conflict of interest.
Publisher’s note
All claims expressed in this article are solely those of the authors and do not necessarily represent those of their affiliated organizations, or those of the publisher, the editors and the reviewers. Any product that may be evaluated in this article, or claim that may be made by its manufacturer, is not guaranteed or endorsed by the publisher.
References
Ahmed A., A., and Jianhua, L. (2015). Environmental Monitoring of Heavy Metal Status and Human Health Risk Assessment in the Agricultural Soils of the Jinxi River Area, China. Human and Ecological Risk Assessment 21 (4), 952–971. doi:10.1080/10807039.2014.947851
Chandrasekaran, A., Ravisankar, R., Harikrishnan, N., Satapathy, K. K., Prasad, M. V. R., and Kanagasabapathy, K. V. (2015). Multivariate statistical analysis of heavy metal concentration in soils of Yelagiri Hills, Tamilnadu, India. Spectrochim Acta. A Mol. Biomol. Spectrosc. 137, 589–600. doi:10.1016/j.saa.2014.08.093
Farjana, S. H., Huda, N., Mahmud, M., and Lang, C. (2019). A global life cycle assessment of manganese mining processes based on EcoInvent database. Sci. Total Environ. 688 (20), 1102–1111. doi:10.1016/j.scitotenv.2019.06.184
Farrell, M., Perkins, W. T., Hobbs, P. J., Griffith, G. W., and Jones, D. L. (2010). Migration of heavy metals in soil as influenced by compost amendments. Environ. Pollut. 158 (1), 55–64. doi:10.1016/j.envpol.2009.08.027
Guo, J., Lou, M., Miao, Y., Wang, Y., Zeng, Z., and Liu, H. (2017). Trans-Pacific transport of dust aerosols from East Asia: Insights gained from multiple observations and modeling. Environ. Pollut. 230, 1030–1039. doi:10.1016/j.envpol.2017.07.062
Huang, L. M., Deng, C. B., Huang, N., and Huang, X. J. (2012). Multivariate statistical approach to identify heavy metal sources in agricultural soil around an abandoned Pb–Zn mine in Guangxi Zhuang Autonomous Region, China. Environ. Earth Sci. 68, 1331–1348. doi:10.1007/s12665-012-1831-8
Jamil, M., Malook, I., Rehman, S. U., Khan, M. D., Fayyaz, M., Aslam, M. M., et al. (2022). Multivariate geo-statistical perspective: Evaluation of agricultural soil contaminated by industrial estate’s effluents. Environ. Geochem. Health 44 (1), 57–68. doi:10.1007/s10653-021-01007-9
Jiang, F., Ren, B., Hursthouse, A. S., and Zhou, Y. (2019). Trace metal pollution in topsoil surrounding the xiangtan manganese mine area (south-central China): Source identification, spatial distribution and assessment of potential ecological risks. Int. J. Environ. Res. Public Health 15 (11), 2412. doi:10.3390/ijerph15112412
Jie, C., Qing, L., and Hui, Q. (2012). Application of improved nemerow index method based on entropy weight for groundwater quality evaluation. Int. J. Environ. Sci. 2. doi:10.6088/ijes.00202030015
Kamani, H., Mirzaei, N., and Ghaderpoori, M. (2017). Concentration and ecological risk of heavy metal in street dusts of Eslamshahr, Iran. Hum. Ecol. Risk Assess. 24 (4), 1–10. doi:10.1080/10807039.2017.1403282
Kefeni, K. K., Msagati, T. A. M., and Mamba, B. B. (2017). Acid mine drainage: Prevention, treatment options, and resource recovery: A review. J. Clean. Prod. 151, 475–493. doi:10.1016/j.jclepro.2017.03.082
Kumar, S. (2015). Estimating spatial distribution of soil organic carbon for the Midwestern United States using historical database. Chemosphere 127, 49–57. doi:10.1016/j.chemosphere.2014.12.027
Lars, H. (1980). An ecological risk index for aquatic pollution control.a sedimentological approach. Water Res. 14, 975–1001. doi:10.1016/0043-1354(80)90143-8
Li, X., Yang, H., Zhang, C., Zeng, G., Liu, Y., and Xu, W. (2017). Spatial distribution and transport characteristics of heavy metals around an antimony mine area in central China. Chemosphere 170, 17–24. doi:10.1016/j.chemosphere.2016.12.011
Li, C., Zheng, L., and Jiang, C. (2021). Characteristics of leaching of heavy metals from low-sulfur coal gangue under different conditions[J]. Int. J. Coal Sci. Technol. 8 (4), 780–789. doi:10.1007/s40789-021-00416-6
Liang, J., Feng, C., Zeng, G., Zhong, M., Gao, X., and Li, X. (2017). Atmospheric deposition of mercury and cadmium impacts on topsoil in a typical coal mine city, Lianyuan, China. Chemosphere 189 (DEC), 198–205. doi:10.1016/j.chemosphere.2017.09.046
Lin, H., Zhu, Y., Ahmad, N., and Han, Q. (2019). A scientometric analysis and visualization of global research on brownfields. Environ. Sci. Pollut. Res. 26 (1–3), 17666–17684. doi:10.1007/s11356-019-05149-3
Liu, R., Guo, L., Men, C., Wang, Q., Miao, Y., and Shen, Z. (2019). Spatial-temporal variation of heavy metals’ sources in the surface sediments of the Yangtze River Estuary. Mar. Pollut. Bull. 138, 526–533. doi:10.1016/j.marpolbul.2018.12.010
Liu, Z., and Yan, T. (2021). Comparison of spatial interpolation methods based on ArcGIS. J. Phys. Conf. Ser. 1961 (1), 012050–012056. doi:10.1088/1742-6596/1961/1/012050
Liu, X., Chen, S., Yan, X., Liang, T., Yang, X., El-Naggar, A., et al. (2022). Evaluation of potential ecological risks in potential toxic elements contaminated agricultural soils: Correlations between soil contamination and polymetallic mining activity. GeoJournal 300, 113679. doi:10.1016/j.jenvman.2021.113679
Luo, L., Shen, Y., Wang, X., Chu, B., Xu, T., Liu, Y., et al. (2018). Phytoavailability, bioaccumulation, and human health risks of metal(loid) elements in an agroecosystem near a lead-zinc mine. Environ. Sci. Pollut. Res. 25 (24), 24111–24124. doi:10.1007/s11356-018-2482-4
Luo, X., Ren, B., Hursthouse, A. S., Jiang, F., and Deng, R.-J. (2020). Potentially toxic elements (PTEs) in crops, soil, and water near Xiangtan manganese mine, China: potential risk to health in the foodchain. Environ. Geochem. Health 42 (7), 1965–1976. doi:10.1007/s10653-019-00454-9
Petitjean, Q., Choulet, F., Walter-Simonnet, A. V., Mariet, A. L., Laurent, H., Rosenthal, P., et al. (2021). Origin, fate and ecotoxicity of manganese from legacy metallurgical wastes. Chemosphere 277, 130337. doi:10.1016/j.chemosphere.2021.130337
Remon, E., Bouchardon, J. L., Cornier, B., Guy, B., Leclerc, J. C., and Faure, O. (2005). Soil characteristics, heavy metal availability and vegetation recovery at a former metallurgical landfill: Implications in risk assessment and site restoration. Environ. Pollut. 137 (2), 316–323. doi:10.1016/j.envpol.2005.01.012
Sakan, S., Dević, G., Relić, D., Anđelković, I., Sakan, N., and Đorđević, D. (2015). Evaluation of sediment contamination with heavy metals: The importance of determining appropriate background content and suitable element for normalization. Environ. Geochem. Health 37 (1), 97–113. doi:10.1007/s10653-014-9633-4
Sd, A., Ira, B., and Mkt, A. (2022). Antimony and arsenic particle size distribution in a mining contaminated freshwater river: Implications for sediment quality assessment and quantifying dispersion. Environ. Pollut 305. doi:10.1016/j.envpol.2022.119204
Shao, M., and Zhu, Y. (2020). Long-term metal exposure changes gut microbiota of residents surrounding a mining and smelting area. Sci. Rep. 10 (1), 4453. doi:10.1038/s41598-020-61143-7
Trojanowska, M., and Wietlik, R. (2020). Investigations of the chemical distribution of heavy metals in street dust and its impact on risk assessment for human health, case study of Radom (Poland). Hum. Ecol. Risk Assess 26 (7), 1907–1926. doi:10.1080/10807039.2019.1619070
Tsurtsumia, G., Shengelia, D., Koiava, N., Lezhava, T., Gogoli, D., Beriashvili, L., et al. (2019). Novel hydro-electrometallurgical technology for simultaneous production of manganese metal, electrolytic manganese dioxide, and manganese sulfate monohydrate. Hydrometallurgy 186, 260–268. doi:10.1016/j.hydromet.2019.04.028
Wei, Y., Hou, H., Li, J. N., ShangGuan, Y., Xu, Y., Zhang, J., et al. (2014). Molecular diversity of arbuscular mycorrhizal fungi associated with an Mn hyperaccumulator—phytolacca americana, in Mn mining area. Appl. Soil Ecol. 82, 11–17. doi:10.1016/j.apsoil.2014.05.005
Keywords: manganese (Mn) contaminated site, soil, heavy metal, geoaccumulation index, ecological risk index
Citation: Lv Y, Kabanda G, Chen Y, Wu C and Li W (2022) Spatial distribution and ecological risk assessment of heavy metals in manganese (Mn) contaminated site. Front. Environ. Sci. 10:942544. doi: 10.3389/fenvs.2022.942544
Received: 12 May 2022; Accepted: 29 July 2022;
Published: 02 September 2022.
Edited by:
Weijun Fu, Zhejiang Agriculture and Forestry University, ChinaReviewed by:
Xiangrui Xu, Zhejiang University City College, ChinaYuanpeng Wang, Xiamen University, China
Min Hu, Changzhou University, China
Copyright © 2022 Lv, Kabanda, Chen, Wu and Li. This is an open-access article distributed under the terms of the Creative Commons Attribution License (CC BY). The use, distribution or reproduction in other forums is permitted, provided the original author(s) and the copyright owner(s) are credited and that the original publication in this journal is cited, in accordance with accepted academic practice. No use, distribution or reproduction is permitted which does not comply with these terms.
*Correspondence: Chuan Wu, d3VjaHVhbkBjc3UuZWR1LmNu; Waichin Li, d2FpY2hpbkBlZHVoay5oaw==
 Yangtao Lv
 Gilbert Kabanda
 Yueru Chen1
 Chuan Wu
 Waichin Li