
94% of researchers rate our articles as excellent or good
Learn more about the work of our research integrity team to safeguard the quality of each article we publish.
Find out more
ORIGINAL RESEARCH article
Front. Environ. Sci., 03 October 2022
Sec. Water and Wastewater Management
Volume 10 - 2022 | https://doi.org/10.3389/fenvs.2022.941836
This article is part of the Research TopicAdvanced Physico-Chemical Technologies for Water Detoxification and DisinfectionView all 7 articles
 María Angélica Álvarez Bayona1,2*
 Aymer Maturana Córdoba1
 Romel J. Gallardo Amaya2Amner Muñoz Acevedo3
Glyphosate is currently the herbicide with the highest use worldwide for weed control. It has been detected in different water sources, including drinking water, which could be generating potential damage to human health. In the Metropolitan Area of Cúcuta, intensive rice cultivation is predominant, and as it grows in flooded areas, the use of herbicides has greater contact with water bodies, which are used as sources of supply. Based on this, the concentration of glyphosate was quantified in five sampling points of surface and drinking water of the Pamplonita and Zulia rivers, using UV-Vis spectrophotometry, establishing that the concentration found in drinking water (216 and 204.5 µg/L) was below the maximum allowable limits of countries such as the United States, Canada, and Australia and above those of the European Union and the United Kingdom. Once the occurrence was identified, the removal capacity of glyphosate was evaluated using membrane technology through reverse osmosis (RO) and nanofiltration (NF) in a pilot plant, for which response surface optimization models were implemented, and 100% removals were obtained, with repeatability close to 1% with respect to other reported investigations, highlighting that the NF process was more efficient even though the molecular weight of glyphosate was below the limit of the membrane. In contrast, it was determined that, according to the concentrations found in the drinking water supplied to the Metropolitan Area of Cúcuta, this has a low risk according to the guidelines for drinking water quality in Canada and a moderate risk according to the World Health Organization (WHO). The conventional systems currently used for water purification are insufficient to remove traces of contaminants such as herbicides. Therefore, it is necessary to implement new technologies.
Glyphosate is a widely used non-selective herbicide used mainly in agriculture to control weeds in crops. It is also used in forestry, domestic, and urban applications in the control of invasive species in aquatic systems and wetlands and the eradication of illicit crops. Since 1974 in the United States, more than 1.6 billion kilograms of active ingredient glyphosate have been applied (Benbrook, 2016). Globally, the glyphosate market is expected to grow from $8,510 million in 2021 to $8,880 million in 2022 at a compound annual growth rate (CAGR) of 4.32% (Solutions et al., 2022), a situation that is not unfamiliar in developing countries, where its use has also intensified.
Until a few decades ago, its use and exposure were very limited, which is why it was classified as not very dangerous, but with its massive adoption, the adverse effects that it can generate on health and the environment became evident (Bravo and Naranjo, 2016). The International Agency for the Study of Cancer (IARC) of the World Health Organization (WHO) in 2015 reclassified glyphosate as probably carcinogenic to humans (category 2A), given that the evidence is limited, although sufficient in animals (International agency for research on cancer, 2015).
The intensive use of glyphosate has generated an increase in its concentrations in different environmental matrices. Many studies have shown that once glyphosate is applied, it is strongly adsorbed by soil components such as clay, iron oxides, and humic acids (van Bruggen et al., 2018); suffering a mainly biological degradation being its main metabolite aminomethylphosphonic acid (AMPA), so its presence in surface and groundwater would be unlikely. However, several investigations have reported levels of glyphosate and its metabolite in different water sources. In Alberta, a province in western Canada dedicated to grain cultivation, levels between 0.2 and 6.079 µg/L were detected in surface water (Anderson et al., 2015). For its part, in the United States, investigations of the presence of the herbicide have been reported in several states. In Ohio, in the runoff of an agricultural basin, concentrations were detected up to 4 months after the application of glyphosate at high doses (2 µg/L) (Edwards et al., 1980). In Washington, Maryland, Iowa, and Wyoming, samples were taken before and after the application of the herbicide to soybean and corn crops in spring ponds and adjacent streams, finding concentrations up to 328 µg/L that exceeded the freshwater aquatic life standard of 65 µg/L (Battaglin et al., 2005–2006). In Northern Missouri, temporal patterns in glyphosate concentrations measured weekly during the growing season were investigated, detected in 44% of samples, more frequently in urban than agricultural streams and in concentrations similar to those in streams with high agricultural land use (>40% row crop) (Mahler et al., 2017).
In Latin America, samples of groundwater, drinking water, bottled water, and farmers’ urine were taken from Mexico due to the excessive use of herbicide in this community, determining the highest concentrations in the groundwater (1.42 μg/L). However, the study also established that glyphosate, when absorbed orally, is excreted unaltered because the tests carried out on the workers at the study site established the presence of glyphosate in their urine (0.47 µg/L) (Rendón-Von Osten and Dzul-Caamal, 2017). Likewise, in surface water in Argentina, it was detected in approximately 15% of the samples analyzed (Aparicio et al., 2013). In the villages of Puente Boyacá, Bojirque, and Montoya in the municipality of Ventaquemada (Boyacá), in Colombia, areas dedicated to agricultural work, the presence of glyphosate was determined in different water sources near the crops, such as streams and reservoirs, mainly in June and July. Finding values were between 201 and 2,777 μg/L (Alza-Camacho et al., 2016).
Consequently, some countries have regulated the maximum permissible limits of glyphosate in different water sources. In Canada, the Ministry of Environment set the maximum concentration in drinking water at 280 μg/L [Health Canada (HC), 2006] and established a long-term threshold for the protection of aquatic life in freshwater at 800 μg/L [CCME (Canadian Council of Ministers of the Environment), 2012]. The United States Environmental Protection Agency determined that the maximum concentration in drinking water is 700 μg/L and set benchmarks for aquatic life between 1,800 and 49,900 μg/L (USEPA, 2007). In the European Union, glyphosate does not belong to the list of priority substances in surface water. However, it is expected to enter the list in 2022 with a maximum concentration of 398.6 μg/L (CIRCABC, 2022). In the case of drinking water, a parametric value of 0.5 μg/L is established for total pesticides and 0.1 μg/L for each individual pesticide (Drinking Water Inspectorate, 2010).
Among the processes currently used for water purification is membrane technology, which is based on the use of hydrostatic pressure to remove suspended solids and high molecular weight solutes and allow the passage of water and low molecular weight solutes (Rodriguez-Narvaez et al., 2017), using membranes with different pore sizes. In the case of microfiltration (MF), 1–0.1 µm, and uncertainty factor (UF), 0.1–0.01 µm, only suspended solids can be removed, and in the case of nanofiltration (NF), 0.01–0.001 µm and selective semipermeable membranes [reverse osmosis (RO), pore size <0.001 µm, and direct osmosis (FO)] (Maroneze et al., 2014) dissolved solutes can be separated. Their use has increased considerably; one of the great advantages of these filtration systems is that they can retain many pollutants in water (Maroneze et al., 2014). However, they do not allow their degradation so that these pollutants are concentrated in the form of the concentrated waste stream in impermeable components (or concentrate), requiring further treatment and, therefore, increasing the cost of the process (Homem and Santos, 2011). Membrane treatments are very promising, especially with new research in the development of antifouling and self-healing membranes (Richardson, 2008). Properties of membrane materials and contaminants, such as pore size, hydrophobicity, functional groups, pKa, in addition to the quality of the treated water, are some of the complex factors that influence removal (Rodriguez-Narvaez et al., 2017).
Regarding the removal of glyphosate using membrane technology, several studies have been published showing high percentages, as is the case of an experiment carried out in China for the treatment of drinking water during sudden natural phenomena, in which UF was used as pretreatment and RO as the main process for the test, obtaining removals between 99.39 % and 99.95% for a concentration of approximately 49 mg/L (Qingling et al., 2017). Likewise, a study was carried out in Argentina for the treatment of synthetic and natural waters contaminated with commercial formulations of glyphosate, using an NF pilot plant, demonstrating that more than 85% of the herbicide could be eliminated for a concentration of 48 mg/L (Saitúa et al., 2012). Another study in the Netherlands evaluated the robustness of a drinking water treatment plant equipped with RO. It then activated carbon filtration to remove an initial concentration of 0.01 mg/L, where 90% removal was obtained (Schoonenberg Kegel et al., 2010). In France, tests were carried out on a laboratory scale to determine the removal using NF membranes with distilled water enriched with 0.002 mg/L of AMPA and glyphosate, obtaining values greater than 95% (Roche, 2004).
The department of Norte de Santander, Colombia, bases its economy on the agricultural sector due to its varied climatic conditions; the Metropolitan Area of Cúcuta and its neighboring municipalities are located in the warm zone, where the most representative crop is rice, with 24% and a planted area of 41,071 ha/year (Solutions et al., 2022). This is a plant that grows in flooded areas. The use of herbicides such as glyphosate for weed control has greater contact with bodies of water in areas very close to the city’s drinking water catchment sources, where only a conventional system is used for treatment (desanding, pre-sedimentation, coagulation-flocculation, sedimentation, clarification, filtration, and disinfection). In this research, a detailed analysis of the occurrence of glyphosate in surface sources (Pamplonita and Zulia rivers) and in the drinking water that supplies the Metropolitan Area of Cúcuta was carried out, evaluating its removal through membrane technology, demonstrating that the results obtained may represent a viable and sustainable alternative for the removal of herbicides that are widely used in the region. On the contrary, the level of risk of exposure to glyphosate in drinking water was calculated according to the Guidelines for Drinking Water Quality of Canada and the WHO.
The study was carried out in areas where the largest amount of rice crops is concentrated. Thus, three sampling points were taken in the Pamplonita River and two in the Zulia River (Figure 1). Additionally, two points were taken in the drinking water supplying the Metropolitan Area of Cúcuta, corresponding to the El Portico and El Carmen de Tonchala plants. The fact that these studies were carried out during September is highlighted, a season with the highest temperatures (≈28°C) in the region, according to the climatological information given by the Institute of Hydrology, Meteorology, and Environmental Studies (IDEAM). In addition, the transition to the rainy season occurs in this period. Therefore, rice planting is in the post-emergence phase, requiring the application of herbicides.
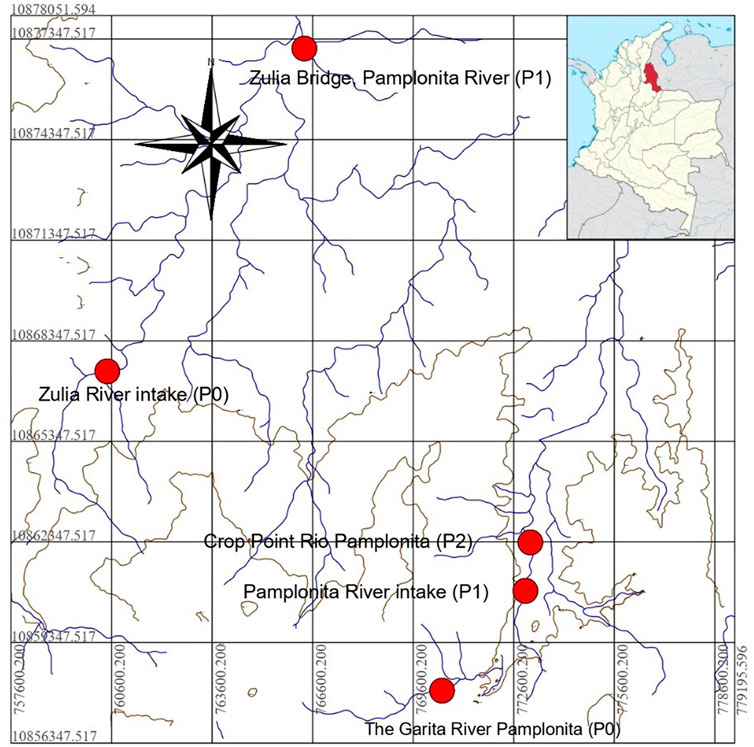
FIGURE 1. Study sites.
The sampling and characterization of the chosen study sites were carried out following the guidelines established by American Public Health Association (American Public Health Association, 2017). For the physicochemical and microbiological analysis, 2.5 L of water was taken, as well as 1.0 L for the analysis of glyphosate in each of the sampling sites. The samples were stored at a temperature of 4°C and protected from light.
The materials used are distilled water; glyphosate (N-phosphonomethyl) isopropylamine salt; Glifosol Concentrate Soluble SL, concentration 480 g/L (Arysta, France); ninhydrin [=2,2-dihydroxy-1H-indene-1,3(2H)-dione; Merck, India], sodium molybdate (R.A.Chemical, India), dichloromethane (Merck, India), Whatman filters (Membrane Circles, Cellulose Nitrate, White Plain, 0.45 µm 47 mm 100/pk).
The equipment used is UV-Vis DR 5000 Spectrophotometer, Memmert Water Bath, IKA RV 10 digital Rotary Evaporator, Adams Analytical Centrifuge, and Vacuum Pump.
The method used for the quantification of glyphosate was the one proposed by Nagaraja and Bhaskara (2006), where the reaction of the amino group of the glyphosate molecule with ninhydrin in the presence of sodium molybdate as a catalyst, with the elimination of a water molecule, gives rise to products I and II, forming a purple-colored product in the neutral aqueous medium.
The calibration curve was made with a small modification regarding the volumes of the reagents of the proposed method, according to Tzaskos et al. (2012). In order to carry out the procedure, a stock solution of 500 mg/L of glyphosate was prepared, where aliquots ranging from 0.0625 to 180 µL were transferred to test tubes, and 500 µL of 5% ninhydrin, 500 µL of molybdate, and 5% sodium were added to each of the tubes. The tubes were sealed and kept in a water bath at a temperature of 85°C for 12 min. The samples were then cooled to room temperature and quantitatively transferred to 5 ml volumetric flasks. The volume was completed with distilled water. Then, the reading was made with the spectrophotometer, where the maximum wavelength was 568 nm. From these data, the triplicate calibration curve was constructed with absorbance as a function of glyphosate concentration in the range of 0.0625–18 mg/L. For the instrument blank, 500 µL of ninhydrin and 500 µL of sodium molybdate were used, up to a total volume of 5 ml.
In Table 1, method validation can be observed where the correlation coefficient, determination, intercept, and slope of the data obtained from the average calibration curve are presented. The limit of quantification (LOQ) was determined by considering the ratio of the standard deviation of the blanks and the slope of the calibration curve multiplied by a factor of 10. The limit of detection (LOD) was determined by considering the same ratio but multiplied by a factor of 3.3.
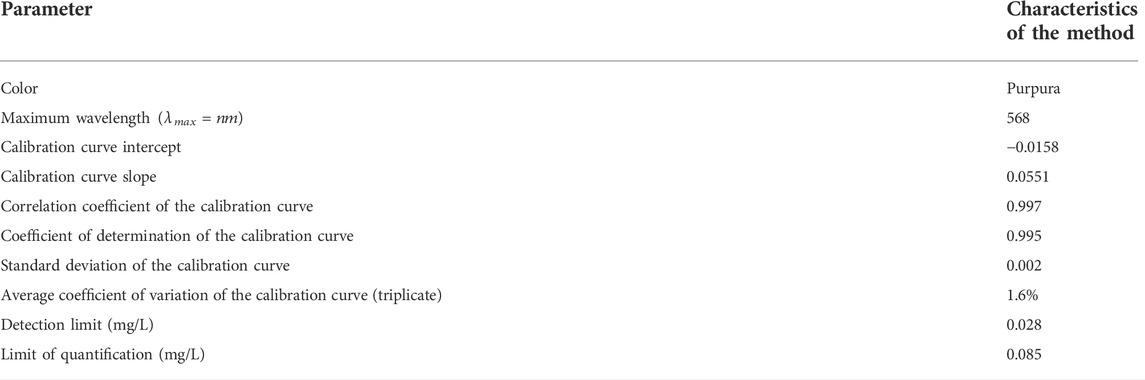
TABLE 1. Characteristics of the glyphosate derivatization method with ninhydrin and sodium molybdate.
In order to determine method recovery and losses (Supplementary Table S1), three concentrations were considered, which were within the calibration curve (in duplicate), for which an amount of glyphosate was added to a volume of 100 ml of drinking water from the Universidad del Norte, and the extraction of the herbicide was carried out using 100 ml of dichloromethane (four times in samples of 25 ml of water) to remove organic compounds. The aqueous phase with glyphosate was rotoevaporated to 5 ml. Then, the concentration was determined with the proposed method, thus obtaining a coefficient of variation between 0.5% and 1.97%, which indicates very little dispersion among the data.
The experimental setup was carried out on a Sterlitech-scale bench, which is composed of a feed tank connected to a Hydracell recirculation pump. The operating system consisted of passing the feed flow from the tank connected to a chiller, through the Hydracell pump, to the CF042D cell where the membrane (RO or NF) and the flow that was rejected by it were recirculated from the back to the feed tank as a concentrate. For its part, the flow that passed through the membrane was the permeate that was practically free of contaminants. Figure 2 shows the operation of the experimental setup.
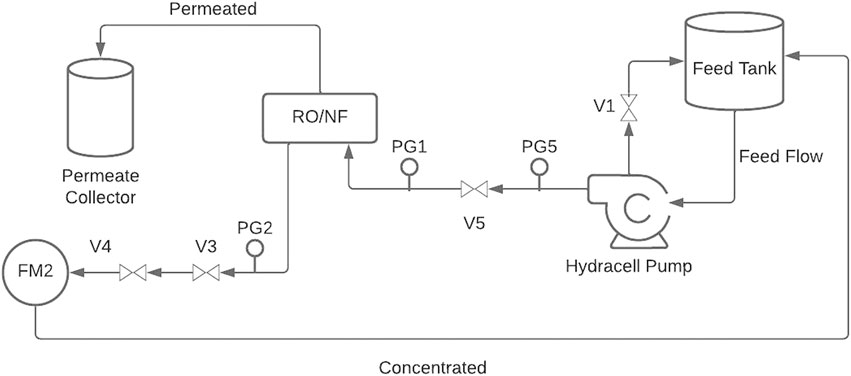
FIGURE 2. Process diagram. V1, feed pump relief valve; V3, low-pressure feed flow control valve; V4, high-pressure feed flow control valve; V5, pump outlet control valve; PG1, feed flow inlet pressure gauge; PG2, feed flow outlet pressure gauge (concentrate); FM2, feed flow meter.
As previously mentioned, there are MF, UF, NF, RO, and FO within the membrane technology, which differ according to the pore size, the type of material with which they are made, the uses, and the typical operating characteristics. Two RO membranes (AG and AK) and one NF membrane (CK) produced by GE Osmonics were used for this research. The RO membranes chosen were thin film (polyamide) membranes, in which no pore size or molecular weight cutoff (MWCO) is applied, indicating that they could be used for glyphosate removal as the MWCO of glyphosate is 169.07 Da (ChemSpider, 2022). This value is below the MWCO limit of the NF membrane (∼2,000 Da), whose material was cellulose acetate. However, research has reported high rejections due to the combined effect of Donnan exclusion and dielectric exclusion (Yaroshchuk, 2001; Vezzani and Bandini, 2002; Szymczyk and Fievet, 2005), as well as the high hydrophilicity of glyphosate (hydration of the molecule), which also contributes to retention (Braeken et al., 2005). The operating parameters of the pilot plant, such as pH, permeate flux, pressure, and temperature, of each membrane were determined according to the properties and characteristics of each membrane (Supplementary Table S2), with previous studies that allowed establishing the value of the minimum and maximum operating limits.
The operating parameters chosen for the removal of glyphosate were pressure, the feed flow temperature, and its speed at the inlet of the Hydracell pump. Herbicide concentration and pH were selected as constant parameters. High, moderate, and low concentrations of glyphosate were taken, the first according to the capacity of the test bench to eliminate them (5,000 mg/L), considering that concentrations in this range can be detected in wastewater produced in pesticide factories containing a variety of toxic and non-biodegradable organic pollutants (Rahmani et al., 2021), which can enter the effluent during formulation, production, and reactor washing (Zhang and Pagilla, 2010; Pliego et al., 2014). Studies have reported pesticide concentrations in wastewater as more than 2,000 mg/L (Goodwin et al., 2018). In the United Kingdom, for example, pesticides in wastewater are highly variable, and concentrations ranging from 0.1 to 107 mg/L have been detected (Goodwin et al., 2018). With respect to moderate concentrations, values above the maximum permissible limits in drinking water in some countries consulted were considered, thus establishing 1 mg/L, and low concentrations were taken considering the value found in the drinking water supplied in the Metropolitan Area of Cúcuta.
The pH value is a very important factor in the process of both NF and RO in the feed flow so that, in all the concentrations of the process, it was taken as neutral (7) because, in the sources investigated, the highest percentage removal was usually around that value (Roche, 2004; Liu et al., 2012; Saitúa et al., 2012; Xie et al., 2010).
According to what was established, the operating parameters with respect to the type of membrane and the technology to be treated were pressure, temperature, and feed flow velocity, establishing the minimum and maximum working ranges, which can be seen in Table 2.
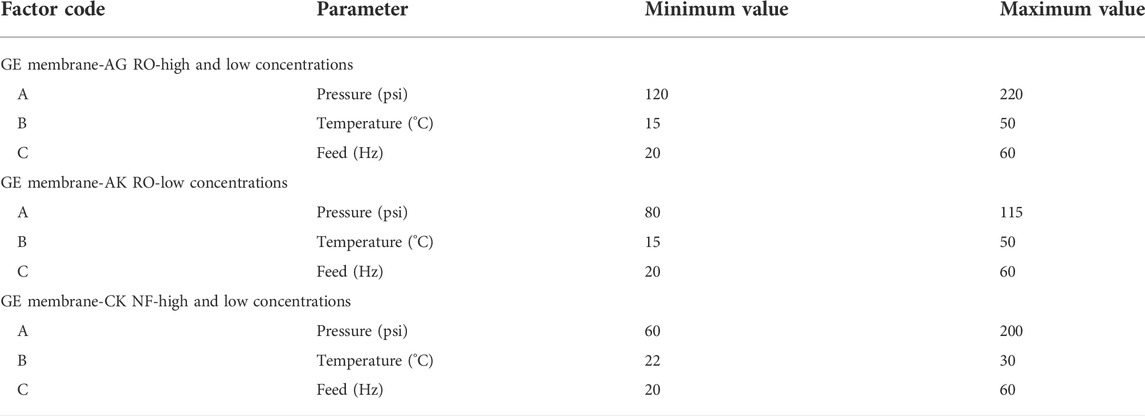
TABLE 2. Operating parameters and their ranges.
As there were three independent variables studied—pressure (A), temperature (B), and feed flow velocity (C)—the design of experiments was a central composite rotational design (CCRD) as it is more efficient for this number of variables in solving research problems when trying to find an optimal (Azargohar and Dalai, 2005); thus, the experimental design matrix (Supplementary Table S3) consisted of eight factorial points, six axial points, and six replicates at the central points, indicating that, in total, 20 experiments were required, where (−1) equals the minimum value, (1) the maximum, and (0) the mean. As it was a CCRD, two axial points were generated for each variable of α and −α. The axial distance equation is as follows:
where F is the number of runs in the factorial portion of the design, and considering that there were three variables, for a 2k factorial, the F value was 8 and the axial points were placed at a distance of α = 1.68179.
Glyphosate removal was selected as the response variable and determined by making the ratio of permeate concentration to that of the feed flow. These were calculated according to the established method for quantification.
In order to predict the response, a second-order polynomial mathematical model was formed to predict the response as a function of the independent variables involving their interactions. The performance of the process is expressed by the following quadratic equation (second-order polynomial mathematical model) (Azargohar and Dalai, 2005):
where Y is the predicted response,
The procedure was performed in duplicate for each of the study sites. In total, 500 ml of raw and drinking water samples was taken and filtered. Then, the extraction and rotary evaporation were done in parts with volumes of 100 ml. Once a concentration of 5 ml of the sample was obtained, it was centrifuged for 10 min to ensure there were no suspended solids. Then, the glyphosate was quantified with the proposed method, considering the losses determined in the validation. Then, Table 3 presents the data obtained.
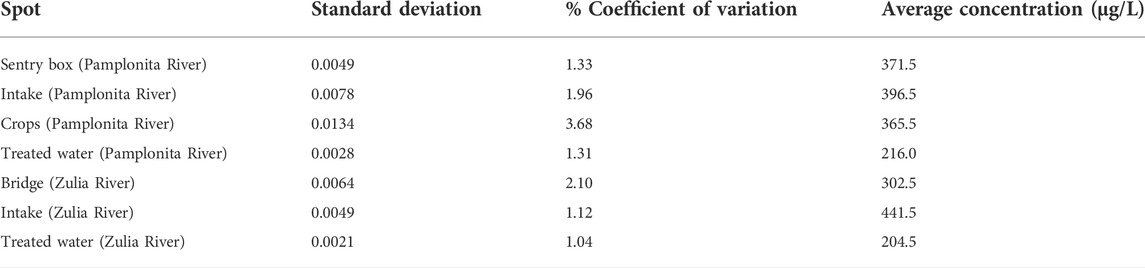
TABLE 3. Mean glyphosate concentration measured by this study at each of the Pamplonita and Zulia River sampling sites.
According to the maximum permissible values of glyphosate in drinking water at the international level (Supplementary Table S4), the water supplied in the Metropolitan Area of Cúcuta complies with the regulations of countries such as the United States (E. UNITED STATES ENVIRONMENTAL PROTECTION AGENCY, 2009), Canada [Health Canada (HC), 2006], and Australia (National Health and Medical Research Council, 2007) but not with the limits established by the United Kingdom (Drinking Water Inspectorate, 2010) and the European Union (Dolan et al., 2013). For its part, in Colombia, Resolution 2115 of 2007 (Author Anonymous, 2007) in Article 7 contemplates that the total sum of the concentrations of pesticides must not exceed 100 µg/L, and considering that the results obtained are higher, none of the samples would be complying with national regulations for drinking water.
Different concentrations of glyphosate were taken, aiming at its elimination when using the selected RO and NF membranes, for which the response surface models were implemented, obtaining the optimal values of the operating parameters and the response variable. Experimental design matrix, 3D surfaces plots, analysis of variance (ANOVA), and normal plot of residuals were generated using Design Expert 11 software.
The model proposed for the experimental design was a quadratic model with a coefficient of determination (R2) of 0.9932, adjusted as 0.9870 and predicted as 0.9618. Considering that the closer the R2 value is to unity, the more precise the value of the responses will be (Seenuvasan et al., 2014). Likewise, a standard deviation of the data of 0.0158 was obtained, as well as a mean elimination of 97.85% and a coefficient of variation of 0.0161%. The importance of the factors and their interactions at various levels can be observed in the ANOVA (Supplementary Table S5) of the model, determining that, for the removal of glyphosate using RO membrane (GE-AG), pressure, temperature, feed flow rate, and iteration between each of them and their squares were important variables in the experimental design process with very little p-value (p < 0.05).
For this research, the percentage contribution graph was elaborated to identify the factors that present the greatest cumulative effect in the system and filter out the less significant ones. The main variables involved in the glyphosate removal process were highlighted. The percentage contribution is calculated according to the following equation (percentage contribution) (Mojarrad et al., 2018):
where
Figure 3 shows that the most representative variable in the system for the removal of glyphosate is the square of pressure (A) and temperature (B), pressure (A), and iteration between pressure (A) and feed flow rate (C).
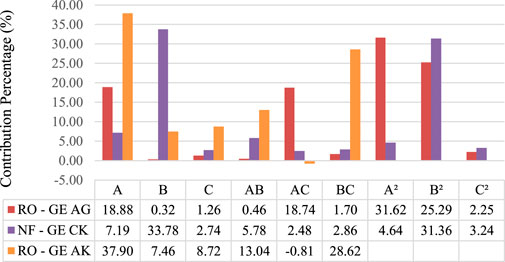
FIGURE 3. ontribution percentage variables for glyphosate removal.
The model equation for the percent removal of glyphosate using the RO membrane at high concentrations can be seen in Eq. 2, where each of the coefficients was calculated using a multiple regression analysis technique from the experimental data with the aid of Design Expert 11 software. The positive and negative signs of each term indicate synergistic and antagonistic effects, respectively (Eq. 4: glyphosate removal high concentration—RO (membrane GE–AG):
For the adequacy of the model, the lack of fit (LOF) test, the graphical analysis of the residuals, the actual versus predicted response, and the regression parameter R2 were used. The F-value of the highest model was 161.28, with a very low probability value (p < 0.0001), establishing that it was significant. In the LOF F-value, the F-value is 1.88, implying that the LOF is not significant in relation to the pure error. The quality of the model was evaluated based on the correlation coefficient R2 and the standard deviation values.
Figure 4A shows the comparison between the experimental data and the predicted values obtained from the statistical model, where most of them were close to the line of fit, establishing that the experimental values were similar to those determined by the model. Regarding the graph of the residuals in Figure 4B, it could be observed that they had a normal distribution and were independent, following an approximately symmetrical pattern. Therefore, it can be established that the model developed is adequate for the prediction and optimization of glyphosate removal.
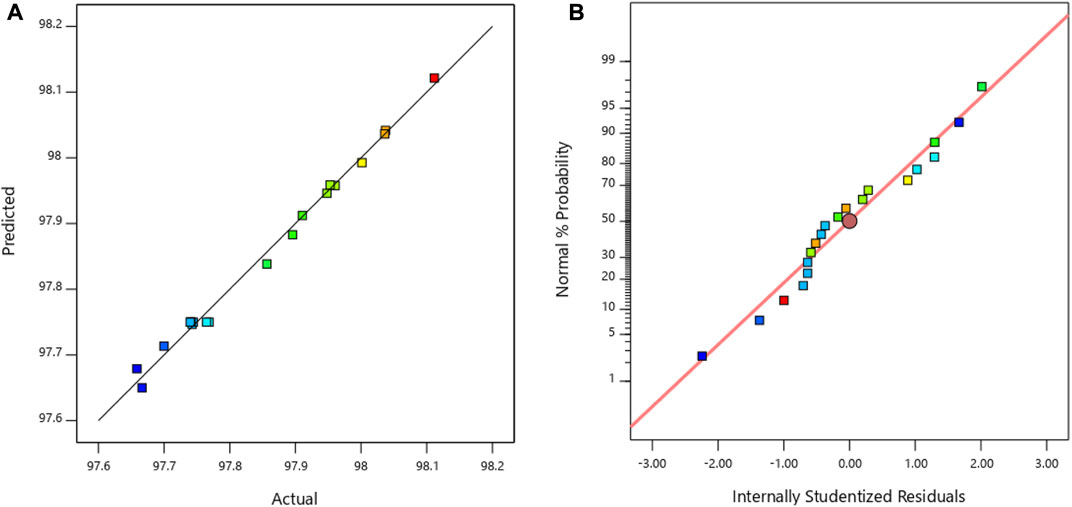
FIGURE 4. (A) Correlation between model predictions and experimental data. (B) Normal % probability plotted versus residual.
For the interpretation of the iteration between variables, it is advisable to analyze the use of 3D plots for the regression model (Aktaş, 2005). The circular nature of the contour plot means that the interactive effects between the variables are not significant, and the optimal values of the test variables cannot be easily obtained (Anupam et al., 2011). The maximum percentage removal of glyphosate using the RO membrane is indicated by the confined area on the smaller curve of the graph with the other variable held at zero, where the elliptical nature of the contours estimates that the interaction between the individual variables is significant. In Figures 5B,D,F, the response surface plots can be seen when leaving one of the variables fixed, where clear peaks are established, indicating that the maximum values of the responses are attributed to pressure, temperature, and feed flow rate. The contour plots for glyphosate removal can be seen in Figures 5A,C,E. According to Figure 5A, when the feed flow velocity variable is kept fixed, as the pressure and temperature increase, the percentage of removal also increases. In contrast, Figure 5C shows that when the temperature is kept fixed, the percentage of removal increases when the pressure increases. However, it remains constant in a range of 150–190 psi and then increases again. Regarding temperature, the percentage of removal decreases as it increases. Figure 5E shows that when the pressure is kept fixed, as the temperature increases, the percentage of removal increases and remains constant as the feed flow rate increases.
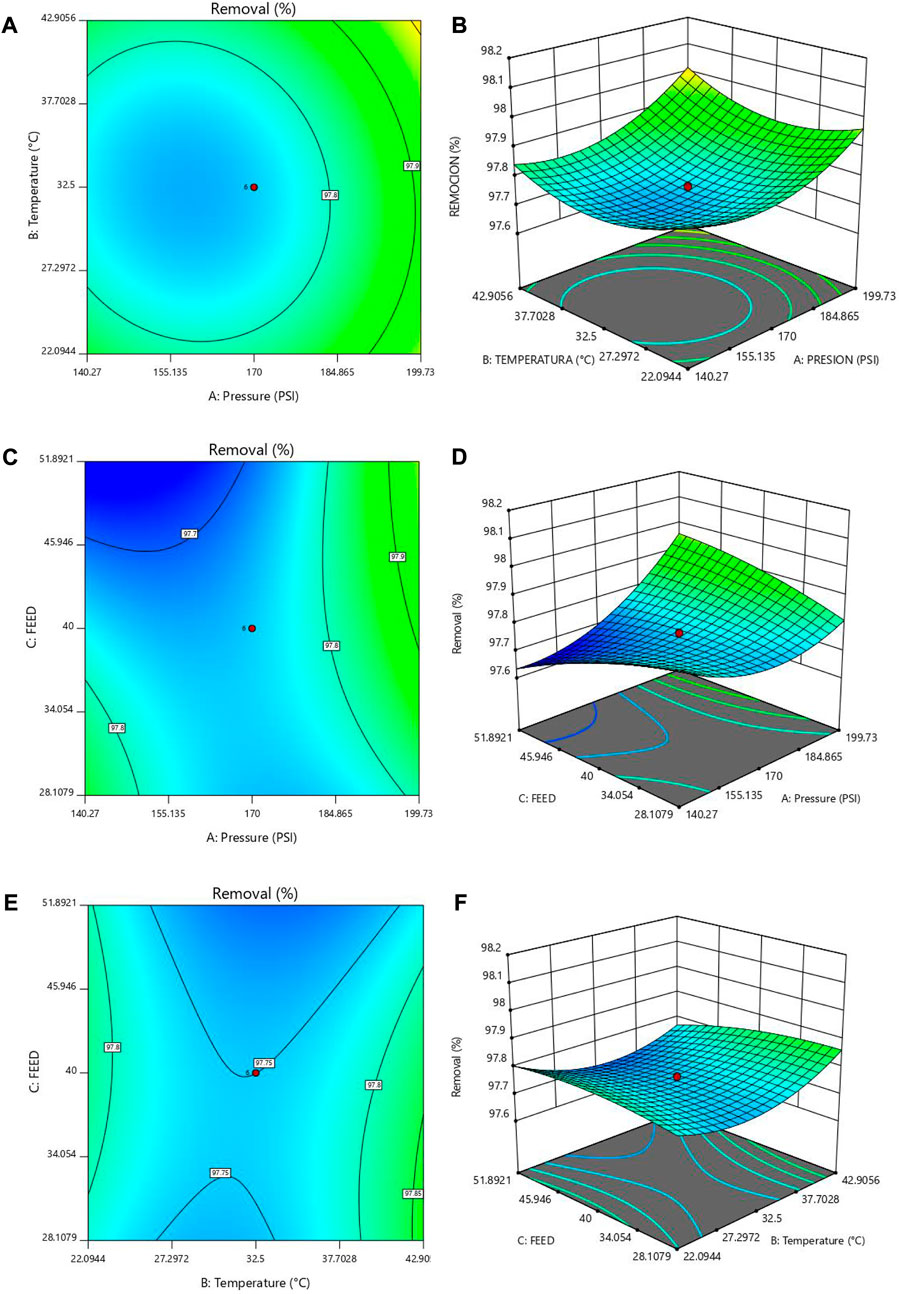
FIGURE 5. Glyphosate removal contour: (A) constant—feed flow rate, (C) constant—temperature, (E) constant—pressure. Glyphosate removal response surface: (B) constant—feed flow velocity, (D) constant—temperature, (F) constant—pressure.
According to the above analysis, it can be established that the maximum percentage of removal is subject to the variables of pressure, temperature, and feed flow velocity. The optimal operating conditions suggested for the model for the three variables are 199.7 psi, 42.9°C, and 51.9 Hz, respectively (Supplementary Figure S1), with a desirability of 1.0, indicating that the process has the maximum efficiency at that operating condition. Based on these values, the optimum glyphosate removal rate for the model was 98.04%. Therefore, with these parameters, an observed removal rate of 97.90 ± 0.01% per duplicate was obtained, which was within the predicted range of 97.8902%–98.1605% at a 95% confidence level.
For the case of glyphosate removal at high concentrations using the NF membrane, it was determined that the proposed experimental model was quadratic, with a coefficient of determination (R2) very close to the unity of 0.9571, adjusted as 0.9186 and predicted as 0.7944. The standard deviation of the data was 0.0188, with a mean removal of 99.13% and a coefficient of variation of 0.0189%. According to the ANOVA (Supplementary Table S6) of the model, all three variables (pressure, temperature and feed flow rate), were important variables in the process of glyphosate removal through the NF membrane with very small p-values (p < 0.05). Likewise, Figure 3 shows that, according to the percentage of contribution, the most representative variable of the system for the elimination of glyphosate was the temperature and its square.
The equation of the model to obtain the percentage of glyphosate removal according to the experimental design was as follows (Eq. 5: removal of high concentration glyphosate—NF-GE—CK membrane):
For the adequacy of the model, the F-value of the highest model was 24.81 with a very low probability value (p < 0.0001), establishing that this was significant. The F-value of the LOF is 1.18, which implies that the LOF is not significant in relation to the pure error. Likewise, the quality of the model was evaluated from the correlation coefficient R2 and the standard deviation values. Figure 6A shows that the experimental values were similar to those determined by the model since most of them were close to the fit line. In Figure 6B, the graph of the residuals presents a normal and symmetrical distribution. Therefore, the adjusted model was adequate for the prediction and optimization of the removal of glyphosate.
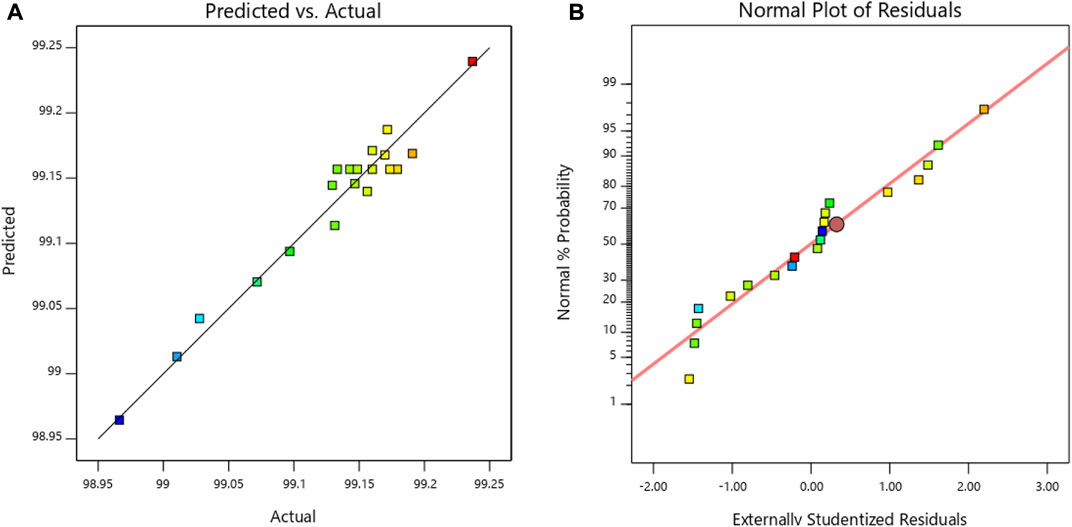
FIGURE 6. (A) Correlation between model predictions and experimental data. (B) Normal % probability plotted versus residual.
With respect to the iterations between the variables, Figures 7B,D,F show the response surface when one of the variables is left fixed. Figure 7A shows that when the feed flow rate variable is kept fixed, as the pressure increases, the percentage of removal decreases, remains constant in the range of 100–130 psi, and then begins to increase again. In contrast, when the temperature begins to increase, the percentage of removal begins to decrease. Figure 7C shows that when the temperature is kept fixed, the percentage of removal remains constant when the pressure increases in the range of 90–160 psi and then increases again. Regarding temperature, the percentage of removal remains constant. Figure 7E shows that when the pressure is kept fixed, as the temperature increases, the percentage of removal increases and remains constant as the feed flow rate increases.
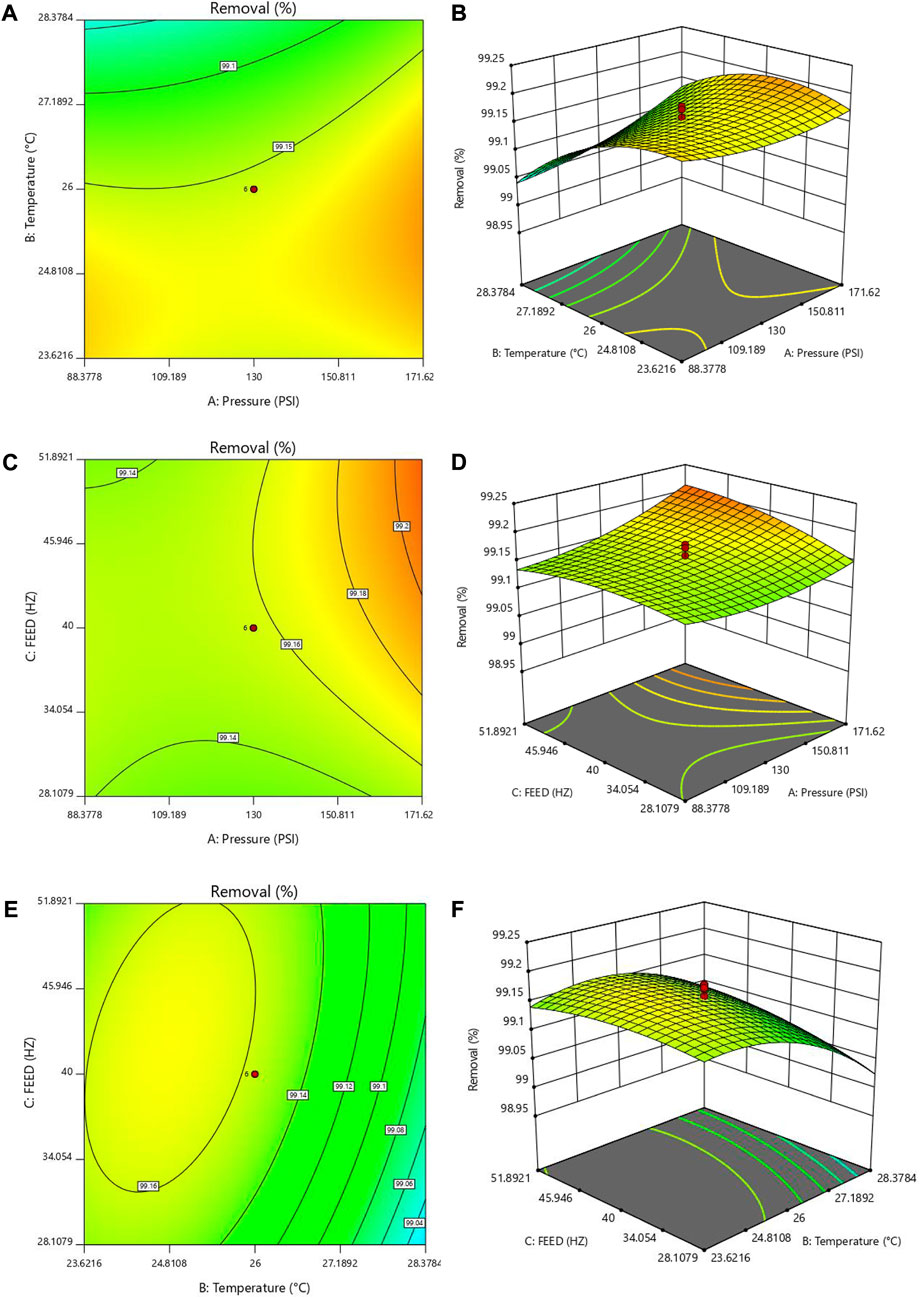
FIGURE 7. Glyphosate removal contour: (A) constant—feed flow rate, (C) constant—temperature, (E) constant—pressure. Glyphosate removal response surface: (B) constant—feed flow velocity, (D) constant—temperature, (F) constant—pressure.
Accordingly, the maximum percentage of removal is subject to the variables of pressure, temperature, and feed flow velocity, where the optimal operating conditions suggested for the model are 171.6 psi, 25.9°C, and 51.9 Hz, respectively (Supplementary Figure S2), with a desirability of 0.905, indicating that the process practically has the maximum efficiency in that operating condition, with an optimal percentage of glyphosate removal for the model of 99.21%. Therefore, with these parameters, an observed removal percentage of 99.19% ± 0.01% was obtained in duplicate, which was within the predicted range of 99.1885%–99.2499% with a confidence level of 95%.
In all the runs carried out in the experimental design, a 100% removal of glyphosate was achieved with an initial concentration of 1 mg/L for both the RO GE–AG membrane and the NF GE–CK membrane.
The removal of glyphosate at moderate concentrations using a second RO membrane determined that the proposed experimental model was 2F1, with a coefficient of determination (R2) close to the unity of 0.9009, adjusted as 0.8551 and predicted as 0.6908. The standard deviation of the data was 3.07, with a mean removal of 88.15% and a coefficient of variation of 3.48%. The ANOVA (Supplementary Table S7) of the model allowed establishing that the three variables (pressure, temperature, and feed flow rate) were significant in the experimental design process with a very small p-value (p < 0.05). As for the percentage contribution in Figure 3, the most representative variable of the system for glyphosate removal was pressure and the iteration between temperature and feed flow rate.
The equation of the model to obtain the percentage of glyphosate removal according to the experimental design was as follows (Eq. 6: glyphosate removal moderate concentration—RO (GE membrane-AK):
In model fit, the F-value of the highest model was 19.69 with a very low probability value (p < 0.0001), which establishes that it is significant. The F-value of LOF was 1.30, implying that the LOF is not significant in relation to the pure error. The quality of the model was evaluated from the correlation coefficient R2 and the standard deviation values. Figure 8A shows that the experimental values were similar to those determined by the model. In Figure 8B, the graph of the residuals presented a normal and symmetrical distribution. Therefore, the adjusted model was adequate for the prediction and optimization of glyphosate removal.
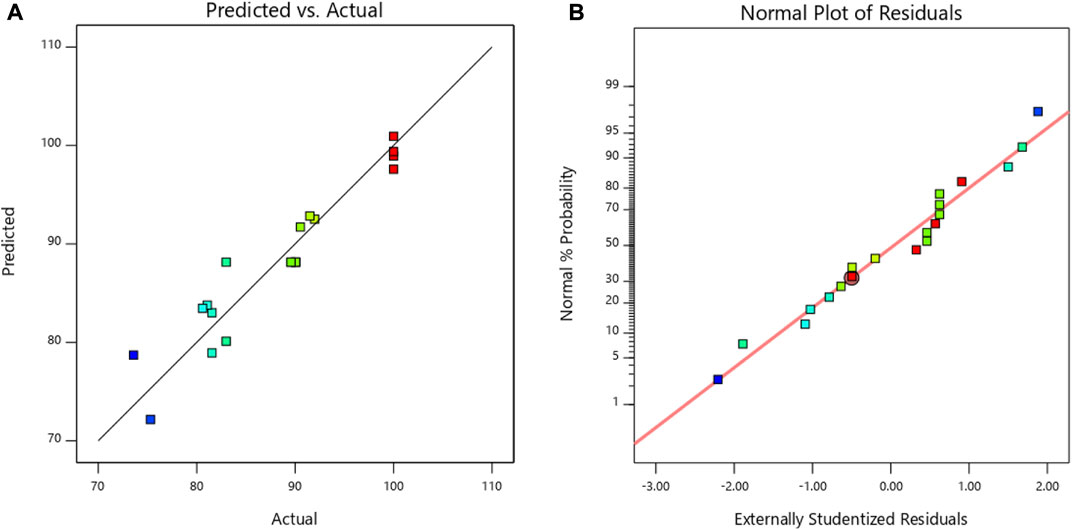
FIGURE 8. (A) Correlation between model predictions and experimental data. (B) Normal % probability plotted versus residual.
Figures 9B,D,F show the response surfaces when one of the variables is left fixed. Figure 9A shows the contour when the feed flow velocity variable is kept fixed, where it is observed that, as the pressure increases, the percentage of removal increases and when the temperature increases, the percentage of removal begins to decrease. Figure 9C shows that when the temperature is kept fixed, the percentage of removal increases from 80% to 95% as the pressure increases and decreases as the feed flow velocity increases. Figure 9E shows that when the pressure is kept fixed, as the temperature and the feed flow velocity increase, the percentage of removal decreases. Based on the above, it can be established that the maximum percentage of removal is subject to the variables of pressure, temperature, and feed flow rate, where the optimal operating conditions suggested for the model are 102.5 psi, 22.5°C, and 28.20 Hz, respectively (Supplementary Figure S3), with a desirability of 1.0, indicating that the process has the maximum efficiency in that operating condition, with an optimal percentage of glyphosate removal for the model of 100%. Therefore, with these parameters, an observed removal percentage of 97.45% ± 0.03% was obtained in duplicate, which was within the predicted range of 93.8703 %–106.26% with a confidence level of 95%
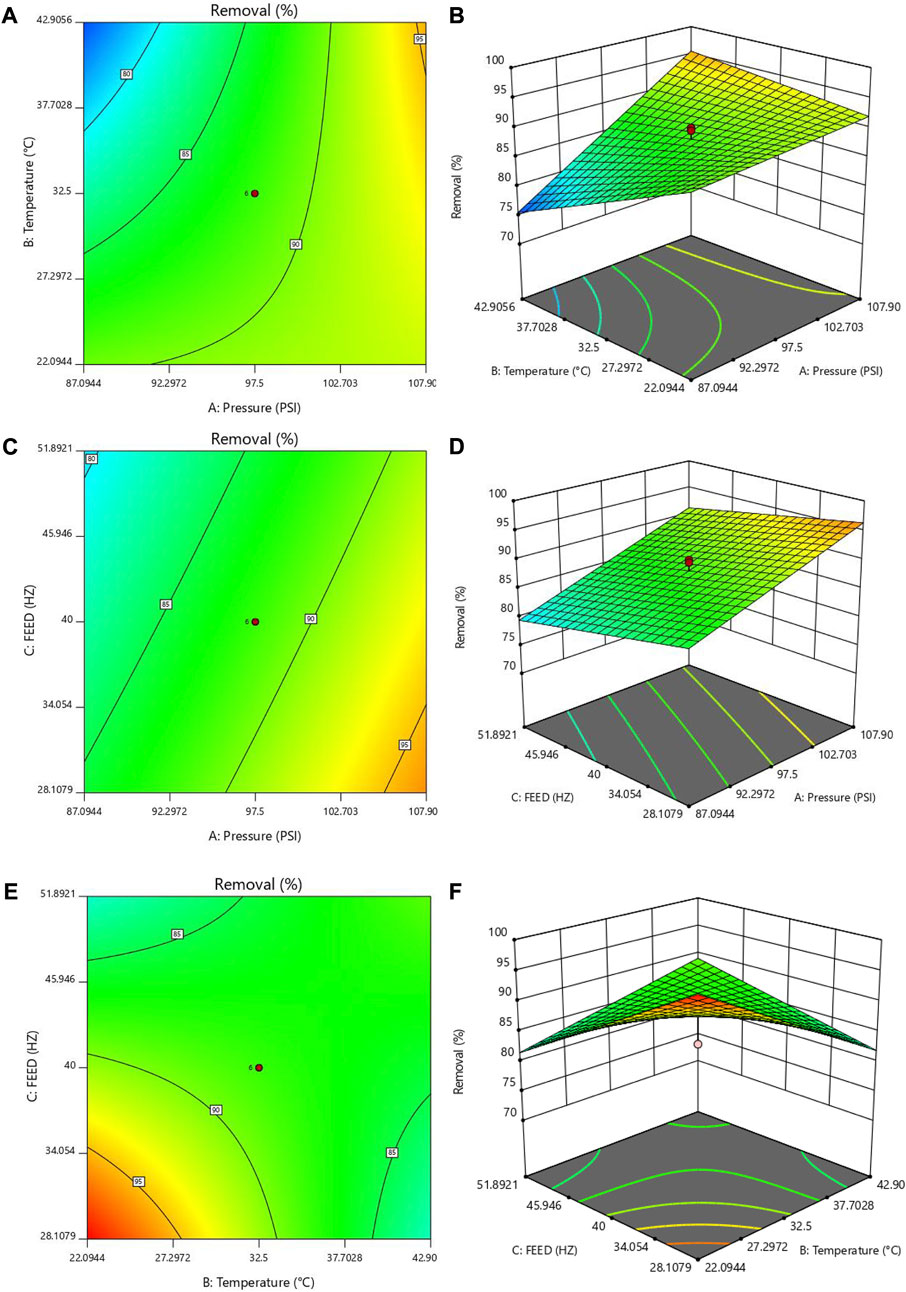
FIGURE 9. Glyphosate removal contour: (A) constant—feed flow rate, (C) constant—temperature, (E) constant—pressure. Glyphosate removal response surface: (B) constant—feed flow velocity, (D) constant—temperature, (F) constant—pressure.
In all the runs carried out in the experimental design, a 100% removal of glyphosate was achieved with initial concentrations of 0.2160 ± 0.0028 and 0.2045 ± 0.0021 mg/L, corresponding to those found in the drinking water of the El Pórtico and El Carmen plants from Tonchala (Pamplonita River and Zulia), using RO (GE–AG and GE–AK) and NF (GE–CK) membranes.
Once the presence of glyphosate in drinking water was determined, the quantitative risk assessment was carried out considering the most restrictive No Observed Adverse Effects Level (NOAEL) found in the literature, which in this case was 3.0 mg/kg-d (Health Canada (HC), 2006), with which the tolerable daily intake (TDI) is determined according to Eq. 7 (World Health Organization, 2017), for an uncertainty factor (UF) of 100%; Canada’s drinking water quality regulations are based on this same NOAEL (Health Canada (HC), 2006):
The reference value (GV) for exposure to glyphosate was calculated in Eq. 8 (World Health Organization, 2017), where TDI is 0.03 mg/kg per day, bodyweight bw is 70 kg, TDI fraction P is 20%, and consumption C is 1.5 L per day to the values established in the Canadian Drinking Water Quality Guidelines. The result was a reference value of 0.28 mg/L per day. However, the WHO sets different values, for example, bodyweight of 60 kg, TDI fraction P of 20%, and consumption C of 2.0 L per day. For this reason, it was calculated in both ways. In this case, the reference value was 0.18 mg/L per day as follows:
Once these values were determined, the average concentrations of glyphosate found in the drinking water of the two supply sources (Río Pamplonita and Zulia) were taken. The risk quotient was calculated according to Eq. 9 (EPA, 2011), where ED corresponds to the concentration found in the drinking water, resulting in a low risk according to Canadian drinking water quality regulations (HQ = 0.1–1.0) and a moderate risk according to WHO (HQ = 1.1–10), and the results are presented in Table 4:
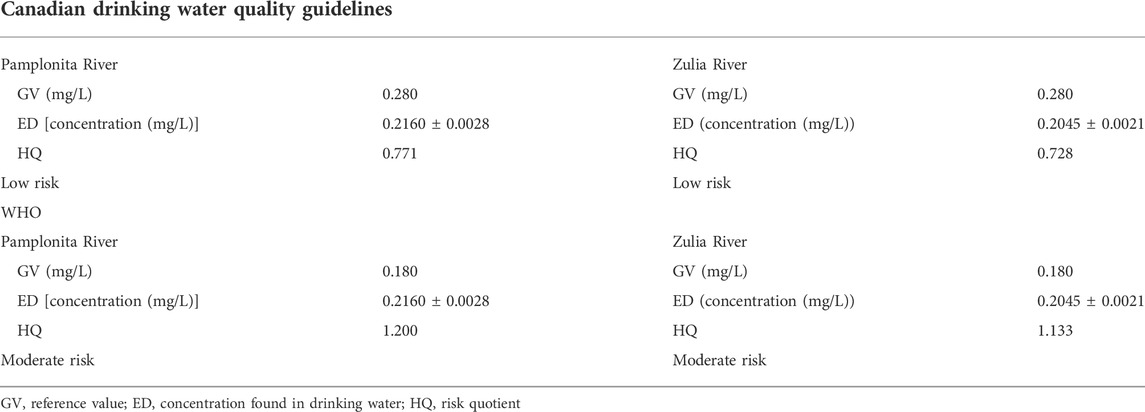
TABLE 4. Risk assessment for glyphosate.
Guidelines for interpreting HQ calculations are as follows (Lemly, 1996):
With the results of the quantification of glyphosate in drinking water, it can be observed that the conventional treatment carried out in the two plants that supply the Metropolitan Area of Cúcuta is currently insufficient to eliminate its concentration as the concentration found in drinking water corresponds to 54% and 46% of that found in the raw water of the Pamplonita and Zulia rivers, respectively. This may be generating potential damage to the health of consumers, such as reproductive problems, mental disorders such as attention deficit hyperactivity disorder (ADHD), autism, Alzheimer’s, and Parkinson’s diseases. Therefore, it is necessary to use additional technologies that allow the elimination of this type of contaminants, such as membrane treatment, which could be used in a hybrid way together with conventional treatment and improve the quality of the water supplied to a population. In contrast, it is recommended that the environmental and health authorities legislate specifically in relation to monitoring and permissible limits of herbicides in drinking water, as well as surface water catchment sources for drinking water. This is not done as, in Colombia, Article 8 of Resolution 2115 of 2007 (Author Anonymous, 2007) establishes that the total sum of pesticide concentrations may not exceed 0.1 mg/L. In this case, it would be non-compliant.
In addition to the above, it is necessary that the environmental and health authorities update their water and sanitation regulations to include technically enforceable guidelines that establish the obligation, considering local contexts, to introduce advanced potabilization treatments that effectively remove the concentration of contaminants that cannot be eliminated with conventional treatments.
In this research, we wanted to demonstrate not only that membrane treatment is capable of eliminating the concentration of glyphosate at low concentrations, but also that it can be used when they are very high, as was the case of 5,000 mg/L, where removal percentages of more than 99% were obtained, and in moderate concentrations of 1 mg/L with removals of 100%, to represent a viable and sustainable alternative for the solution of agrochemical contamination problems, which could be replicated in other areas that have to face this type of challenges.
In a design of experiments, it is important to correctly identify the operating parameters and the iteration that exists between them so that these influence the response variables. That is why before carrying out this research, preliminary tests of all the possible parameters that could be considered were carried out, which were discarded one by one until obtaining the definitive ones, which were pressure, temperature, and feed flow velocity. Thus, in the experimental designs, the operating parameters presented iteration among them, which allowed determining which were the values that should be considered to obtain the optimum glyphosate removal value. For example, in the removal of 5,000 mg/L using the GE-AG membrane, the operating variables were 199.7 psi, 42.9°C, and 51.9 Hz, with an optimum removal of 98.04%. Therefore, tests were performed with this data, and it was observed that the removal values were within the expected range of 97.8902%–98.1605%, with a confidence level of 95%. Likewise, in each of the experimental designs performed for the different membranes and concentrations, it was verified that the observed removal values were within 95% of the predicted ranges, using the optimum operating parameters.
Likewise, it is important to highlight that carrying out a correct design of experiments allows obtaining reliable information faster with statistical evidence, which can be applied to a real process, in addition to reducing development and production costs.
ANOVA established that the experimental values obtained agreed satisfactorily with the values predicted by the models. At high concentrations, the square of the pressure is the variable that contributes the most when using the RO membrane for the removal of glyphosate, whereas the temperature is in the NF; in the case of moderate concentrations when using the second RO membrane, the pressure is the variable that contributes the most. The response surface and contour plots showed that the maximum percentage of glyphosate removal is subject to the variables of pressure, temperature, and feed flow rate.
According to the optimization of the operating variables in the removal of glyphosate at a concentration of 5,000 mg/L using RO’s GE-AG membrane, the temperature should have a value of 42.9°C. However, this value has no practical application in real conditions, thus representing a distant option as it must be adjusted to the environmental conditions of the study area, which has a temperature between 28°C and 30°C throughout the year, which would influence efficiency. However, when analyzing the models obtained, it can be observed, for example, in Figure 5A, where the feed flow velocity variable is kept fixed, that the percentage of removal in the ambient temperature range is higher than 97%. Likewise, in Figure 5E when the pressure variable is kept fixed, the percentage of removal is also higher than 97%. For this reason, the optimum temperature value can be lowered to the practical limit conditions, obtaining high percentages of removal.
It is important to highlight in this research that, for the removal of glyphosate in moderate concentrations, two RO membranes were used. The first was the GE–AG membrane, which removed 100% of the herbicide in each of the runs of the experimental design. The second membrane used was the GE–AK, which obtained an average removal of 88.15% and an optimum of 100%, which shows that not all membranes are equal as they have different characteristics. For example, the first one has a typical operating pressure of 225 psi and the other of 115 psi, which explains the higher percentage of removal.
When comparing the value of the percentage of removal of glyphosate using RO membranes with other investigations, similar values can be observed. For example, Hopman et al. (1995) obtained a removal greater than 90% with an RO membrane in groundwater, although with an initial concentration of 2 µg/L. For their part, Schoonenberg Kegel et al. (2010) reported less than 90% removal in surface water with an initial concentration of 2 µg/L. However, another study showed that when using UF as a pretreatment for RO, the removal values increase (99.4%, 99.8%, and 99.9%, for an initial concentration of 0.066, 12.50, and 49.70 mg/L, respectively) (Qingling et al., 2017).
Likewise, when comparing the results of the percentage of elimination using the NF membrane, similar values were obtained with respect to other investigations. For example, removals greater than 95% (Roche, 2004), 85% (Saitúa et al., 2012), and 96.8% (Yuan et al., 2018) were obtained in simulated water from pilot plants. However, their initial concentrations were 2 µg/L, 250 mg/L, and 50 µg/L, respectively.
However, for glyphosate removal, NF is the most efficient process in all cases, as in this research, where high rejections were obtained even though its molecular weight was below the molecular weight cutoff of the membrane, as it is related to the combined effect of Donnan Exclusion and Dielectric Exclusion. One study concluded that, in the process of ion permeation through the membrane, dielectric exclusion increased with increasing electrolyte concentration (Saitúa et al., 2012). Likewise, the high hydrophilicity of glyphosate (log Kow = −5.4) also contributed to the retention. In contrast, it should be noted that the membranes used in the investigations have different references. However, nowadays, the commercial ones are manufactured with similar technologies and characteristics.
It is important to highlight that one of the main drawbacks when using membrane processes is the need for additional treatment to the concentrate stream. Therefore, some studies have been reported on the treatment of discharge into surface water, wastewater, the use of evaporation ponds, disposal in deep wells, and sprinkler irrigation, among others. However, it must be considered that some of the mentioned methods can generate potential damage to the environment. Therefore, it is necessary to include methods that allow correct disposal of the concentrate. For example, in China, treatment of wastewater generated during the production of glyphosate (J. LANXING, 2010) with high concentrations is carried out through the following steps: dilution of salt content; pH adjustment; use of anaerobic biochemistry, materialization, and aerobic biochemistry; and providing a simple and practical low-cost process, which is highly efficient and reliable. The results show that the treated effluent can reach the “National Integrated Wastewater Discharge Standard” (GB-8978-1996) (FAO and FAOLEX, 1998).
The main conclusion of this research is as follows:
1) The presence of glyphosate in the bodies of water and the drinking water that supplies the Metropolitan Area of Cúcuta is analytically evidenced, which would indicate that the purification system currently used is insufficient to remove the contaminant.
2) The concentration of glyphosate was below the maximum permissible values established by law for drinking water in the United States, Canada, and Australia and not for those established in the United Kingdom and the European Union.
3) According to Colombian regulations, the concentration of glyphosate found in the drinking water of the Metropolitan Area of Cúcuta would be in breach because it is higher than 0.1 mg/L.
4) The optimization of the model and the experimental tests performed allowed determining the maximum experimental removal of glyphosate, generating excellent results with any of the membranes used; however, the NF was more efficient, as in other reported investigations.
5) According to the guidelines for the quality of drinking water in Canada, the water that supplies the Metropolitan Area of Cúcuta would be at low risk and according to WHO, at moderate risk, establishing that there would not be a relationship between international regulations as they have different parameters, and on the contrary, warning that, to the extent that the use of the herbicide increases in the study area or the one that influences it, the risk may increase significantly given that this will produce a higher concentration in the water.
The original contributions presented in the study are included in the article/Supplementary Material. Further inquiries can be directed to the corresponding author.
MAB contributed as the principal investigator of the project, AMC contributed as the project director, RGA as the co-investigator and AMA contributed as the project co-director.
The authors would like to give special thanks to Minciencias and Universidad del Norte for their support to the research from which this work was derived, by means of the funding granted through Call No. 753 for the Department of Norte de Santander. In addition, thanks to División de Investigación y Extensión - DIE of Universidad Francisco de Paula Santander Ocaña for their support in funding the preparation, application and publication of this work.
The authors declare that the research was conducted in the absence of any commercial or financial relationships that could be construed as a potential conflict of interest.
All claims expressed in this article are solely those of the authors and do not necessarily represent those of their affiliated organizations or those of the publisher, the editors, and the reviewers. Any product that may be evaluated in this article, or claim that may be made by its manufacturer, is not guaranteed or endorsed by the publisher.
The Supplementary Material for this article can be found online at: https://www.frontiersin.org/articles/10.3389/fenvs.2022.941836/full#supplementary-material
Aktaş, N. (2005). Optimization of biopolymerization rate by response surface methodology (RSM). Enzyme Microb. Technol. 37 (4), 441–447. doi:10.1016/j.enzmictec.2005.03.010
Alza-Camacho, W. R., García-Colmenares, J. M., and Chaparro-Acuña, S. P. (2016). Determinación voltamétrica de paraquat y glifosato en aguas superficiales. Corpoica Cienc. Tecnol. Agropecu. 17 (3), 331–345. doi:10.21930/rcta.vol17_num3_art:510
American Public Health Association (2017). “American water works association., and water environment federation,” in Standard methods for the examination of water and wastewater. 23rd ed. (Washington D. C).
Anderson, A.-M., Byrtus, G., and Humphries, D. (2015). Glyphosate residues in Alberta’s atmospheric deposition, soils and surface waters/. doi:10.5962/bhl.title.102010
Anupam, K., Dutta, S., Bhattacharjee, C., and Datta, S. (2011). Adsorptive removal of chromium (VI) from aqueous solution over powdered activated carbon: Optimisation through response surface methodology. Chem. Eng. J. 173 (1), 135–143. doi:10.1016/j.cej.2011.07.049
Aparicio, V. C., de Gerónimo, E., Marino, D., Primost, J., Carriquiriborde, P., and Costa, J. L. (2013). Environmental fate of glyphosate and aminomethylphosphonic acid in surface waters and soil of agricultural basins. Chemosphere 93 (9), 1866–1873. doi:10.1016/j.chemosphere.2013.06.041
Author Anonymous (2007). Ministerio de la Protección social Ministerio de Ambiente Vivienda y desarrollo territorial. Bogota: Resolución 2115 de 2007, 23.
Azargohar, R., and Dalai, A. K. (2005). Production of activated carbon from Luscar char: Experimental and modeling studies. Microporous Mesoporous Mater. 85 (3), 219–225. doi:10.1016/j.micromeso.2005.06.018
Battaglin, W. A., Rice, K. C., Focazio, M. J., Salmons, S., and Barry, R. X. (2005-20062009). The occurrence of glyphosate, atrazine, and other pesticides in vernal pools and adjacent streams in Washington, DC, Maryland, Iowa, and Wyoming, 2005–2006. Environ. Monit. Assess. 155 (1–4), 281–307. doi:10.1007/s10661-008-0435-y
Benbrook, C. M. (2016). Trends in glyphosate herbicide use in the United States and globally. Environ. Sci. Eur. 28 (1), 3–15. doi:10.1186/s12302-016-0070-0
Braeken, L., Ramaekers, R., Zhang, Y., Maes, G., Van Der Bruggen, B., and Vandecasteele, C. (2005). Influence of hydrophobicity on retention in nanofiltration of aqueous solutions containing organic compounds. J. Memb. Sci. 252 (1–2), 195–203. doi:10.1016/j.memsci.2004.12.017
Bravo, E., and Naranjo, A. (2016). América Latina fumigada y crisis de las commodities. El caso del glifosato de Monsanto. Cienc. politi. 11 (21), 229–250. doi:10.15446/cp.v11n21.60295
CCME (Canadian Council of Ministers of the Environment) (2012). Canadian water quality guidelines for the protection of aquatic life. Gatineau: Glyphosate.
ChemSpider (2022). ChemSpider- chemistry search and share. Glyphosate: Royal Society of Chemistry. Available at: http://www.chemspider.com/Chemical-Structure.3376.html?rid=d4d684ea-01aa-49ab-a888-58c3c955ba7d.
Dolan, T., Howsam, P., Parsons, D. J., and Whelan, M. J. (2013). Is the EU drinking water directive standard for pesticides in drinking water consistent with the precautionary principle? Environ. Sci. Technol. 47 (10), 4999–5006. doi:10.1021/es304955g
Drinking Water Inspectorate (2010). Drinking water inspectorate, UK DW guideline. [Online]. Available: http://www.dwi.gov.uk.
Edwards, W. M., Triplett, G. B., and Kramer, R. M. (1980). A watershed study of glyphosate transport in runoff. J. Environ. Qual. 9 (4), 661–665. doi:10.2134/jeq1980.00472425000900040024x
EPA (2011). Risk characterization. USA: Environmental Protection Agency. Available: http://www.epa.ohio.gov/portals/30/Brownfield_Conference/%0Adocs/Presentations/3-Risk characterization.pdf.
E. UNITED STATES ENVIRONMENTAL PROTECTION AGENCY (2009). National primary drinking water guidelines. 1, 7. Epa 816-F-09-004[Online]. Available: https://www.epa.gov/sites/production/files/2016-06/documents/npwdr_complete_table.pdf.
Goodwin, L., Carra, I., Campo, P., and Soares, A. (2018). Treatment options for reclaiming wastewater produced by the pesticide industry. Int. J. Water Wastewater Treat. 4 (1), 1–15. doi:10.16966/2381-5299.149
Health Canada (HC) (2006). “Guidelines for Canadian drinking water quality: Guideline technical document glyphosate,” in Water Quality and health Bureau, Healthy Environments and consumer safety Branch, 1–5. [Online]. Available: https://www.canada.ca/en/health-canada/services/publications/healthy-living/guidelines-canadian-drinking-water-quality-guideline-technical-document-glyphosate.html#fn30.
Homem, V., and Santos, L. (2011). Degradation and removal methods of antibiotics from aqueous matrices - a review. J. Environ. Manage. 92 (10), 2304–2347. doi:10.1016/j.jenvman.2011.05.023
Hopman, R., Beerendonk, E. F., and Puijker, L. M. (1995). Glyphosate and AMPA in the production of drinking water. KIWA Rep. SWE 95.026. [Online]. Available: email: Ronald.Hopman@kiwa.
International agency for research on cancer (2015). “Evaluation of five organophosphate insecticides and herbicides,” in World health organization, international agency for research on cancer (Lyon, France: IARC Monographs), 112, 1–2. doi:10.1111/j.1742-6723.2004.00593.x
Lemly, A. D. (1996). Evaluation of the hazard quotient method for risk assessment of selenium. Ecotoxicol. Environ. Saf. 35 (2), 156–162. doi:10.1006/eesa.1996.0095
Liu, Z. Y., Xie, M., Ni, F., and Xu, Y. H. (2012). Nanofiltration process of glyphosate simulated wastewater. Water Sci. Technol. 65 (5), 816–822. doi:10.2166/wst.2012.808
Mahler, B. J., van Metre, P. C., Burley, T. E., Loftin, K. A., Meyer, M. T., and Nowell, L. H. (2017). Similarities and differences in occurrence and temporal fluctuations in glyphosate and atrazine in small Midwestern streams (USA) during the 2013 growing season. Sci. Total Environ. 579, 149–158. doi:10.1016/j.scitotenv.2016.10.236
Maroneze, M. M., Zepka, L. Q., Vieira, J. G., Queiroz, M. I., and Jacob-Lopes, E. (2014). A tecnologia de remoção de fósforo: Gerenciamento do elemento em resíduos industriais. Rev. ambiente agua 9 (3), 445–458. doi:10.4136/ambi-agua.1403
Mojarrad, M., Noroozi, A., Zeinivand, A., and Kazemzadeh, P. (2018). Response surface methodology for optimization of simultaneous Cr (VI) and as (V) removal from contaminated water by nanofiltration process. Environ. Prog. Sustain. Energy 37 (1), 434–443. doi:10.1002/ep.12704
Nagaraja, P., and Bhaskara, B. L. (2006). Sensitive spectrophotometric assessment of carbofuran using dapsone as a new chromogenic reagent in formulations and environmental samples. Eclet. Quim. 31 (4), 43–48. doi:10.1590/S0100-46702006000400006
National Health and Medical Research Council (2007). Australian drinking water guidelines paper 6: National water quality management Strategy, version 3.4 Updated October 2017, no. October. 2011.
Pliego, G., Zazo, J. A., Pariente, M. I., Rodriguez, I., Petre, A. L., Leton, P., et al. (2014). Treatment of a wastewater from a pesticide manufacture by combined coagulation and Fenton oxidation. Environ. Sci. Pollut. Res. 21 (21), 12129–12134. doi:10.1007/s11356-014-2880-1
Qingling, G., Liqin, Z., Shu, G., Bailong, X., Xinyang, W., and Yueping, Y. (2017). Study on reverse osmosis for drinking water purification in sudden natural disaster emergency. Zhejiang Univ. Journals 44 (6), 666–674. [Online]. Available: http://www.zjujournals.com/sci/CN/abstract/abstract2598.shtml.
Rahmani, A., Leili, M., Seid-mohammadi, A., Shabanloo, A., Ansari, A., Nematollahi, D., et al. (2021). Improved degradation of diuron herbicide and pesticide wastewater treatment in a three-dimensional electrochemical reactor equipped with PbO2 anodes and granular activated carbon particle electrodes. J. Clean. Prod. 322, 129094. doi:10.1016/j.jclepro.2021.129094
Rendón-Von Osten, J., and Dzul-Caamal, R. (2017). Glyphosate residues in groundwater, drinking water and urine of subsistence farmers from intensive agriculture localities: A survey in hopelchén, campeche, Mexico. Int. J. Environ. Res. Public Health 14, 595–596. doi:10.3390/ijerph14060595
Richardson, S. D. (2008). Environmental mass spectrometry: Emerging contaminants and current issues. Anal. Chem. 80 (12), 4373–4402. doi:10.1021/ac800660d
Roche, L. (2004). Traitabilité de composés phytosanitaires sur une filière de traitement. JIE Poitiers, Conférence 32. November 30 – December 1 (in French).
Rodriguez-Narvaez, O. M., Peralta-Hernandez, J. M., Goonetilleke, A., and Bandala, E. R. (2017). Treatment technologies for emerging contaminants in water: A review. Chem. Eng. J. 323, 361–380. doi:10.1016/j.cej.2017.04.106
Saitúa, H., Giannini, F., and Padilla, A. P. (2012). Drinking water obtaining by nanofiltration from waters contaminated with glyphosate formulations: Process evaluation by means of toxicity tests and studies on operating parameters. J. Hazard. Mat. 227 (228), 204–210. doi:10.1016/j.jhazmat.2012.05.035
Schoonenberg Kegel, F., Rietman, B. M., and Verliefde, A. R. D. (2010). Reverse osmosis followed by activated carbon filtration for efficient removal of organic micropollutants from river bank filtrate. Water Sci. Technol. 61 (10), 2603–2610. doi:10.2166/wst.2010.166
Seenuvasan, M., Sathish Kumar, K., Anil Kumar, M., Iyyappan, J., and Rini Gnana Suganthi, J. (2014). Response surface estimation and canonical quantification for the pectin degrading Fe3O4-SiO2-nanobiocatalyst fabrication. Int. J. Chemtech Res. 6 (7), 3618–3627.
Szymczyk, A., and Fievet, P. (2005). Investigating transport properties of nanofiltration membranes by means of a steric, electric and dielectric exclusion model. J. Memb. Sci. 252 (1–2), 77–88. doi:10.1016/j.memsci.2004.12.002
Tzaskos, D. F., Marcovicz, C., Dias, N. M. P., and Rosso, N. D. (2012). Development of sampling for quantification of glyphosate in natural waters. Cienc. Agrotec. 36 (4), 399–405. doi:10.1590/s1413-70542012000400003
van Bruggen, A. H. C., He, M., Shin, K., Mai, V., Jeong, K., Finckh, M., et al. (2018). Environmental and health effects of the herbicide glyphosate. Sci. Total Environ. 616–617, 255–268. doi:10.1016/j.scitotenv.2017.10.309
Vezzani, D., and Bandini, S. (2002). Donnan equilibrium and dielectric exclusion for characterization of nanofiltration membranes. Desalination 149 (1–3), 477–483. doi:10.1016/S0011-9164(02)00784-1
World Health Organization (2017). Guidelines for drinking-water quality. FourthGeneva: World Health Organization. [Online]. Available: https://apps.who.int/iris/handle/10665/254637.
Xie, M., Liu, Z., and Xu, Y. (2010). Removal of glyphosate in neutralization liquor from the glycine-dimethylphosphit process by nanofiltration. J. Hazard. Mat. 181 (1–3), 975–980. doi:10.1016/j.jhazmat.2010.05.109
Yaroshchuk, A. E. (2001). Non-steric mechanisms of nanofiltration: Superposition of donnan and dielectric exclusion. Sep. Purif. Technol. 22 (23), 143–158. doi:10.1016/S1383-5866(00)00159-3
Yuan, J., Duan, J., Saint, C. P., and Mulcahy, D. (2018). Removal of glyphosate and aminomethylphosphonic acid from synthetic water by nanofiltration. Environ. Technol. (United Kingdom) 39 (11), 1384–1392. doi:10.1080/09593330.2017.1329356
Keywords: glyphosate, reverse osmosis, nanofiltration, contaminants, removal
Citation: Álvarez Bayona MA, Maturana Córdoba A, Gallardo Amaya RJ and Muñoz Acevedo A (2022) Occurrence of glyphosate in surface and drinking water sources in Cúcuta, Norte de Santander, and its removal using membrane technology. Front. Environ. Sci. 10:941836. doi: 10.3389/fenvs.2022.941836
Received: 11 May 2022; Accepted: 09 September 2022;
Published: 03 October 2022.
Edited by:
Yaneth Alejandra Bustos Terrones, Instituto Tecnológico de Culiacán, MexicoReviewed by:
Atikah Mohd Nasir, Universiti Kebangsaan Malaysia, MalaysiaCopyright © 2022 Álvarez Bayona, Maturana Córdoba, Gallardo Amaya and Muñoz Acevedo. This is an open-access article distributed under the terms of the Creative Commons Attribution License (CC BY). The use, distribution or reproduction in other forums is permitted, provided the original author(s) and the copyright owner(s) are credited and that the original publication in this journal is cited, in accordance with accepted academic practice. No use, distribution or reproduction is permitted which does not comply with these terms.
*Correspondence: María Angélica Álvarez Bayona, bWFhbHZhcmV6YkB1ZnBzby5lZHUuY28=
Disclaimer: All claims expressed in this article are solely those of the authors and do not necessarily represent those of their affiliated organizations, or those of the publisher, the editors and the reviewers. Any product that may be evaluated in this article or claim that may be made by its manufacturer is not guaranteed or endorsed by the publisher.
Research integrity at Frontiers
Learn more about the work of our research integrity team to safeguard the quality of each article we publish.