 Shule Li
 Jingjing Yan1*
 Qiuming Pei
 Fei Liu
95% of researchers rate our articles as excellent or good
Learn more about the work of our research integrity team to safeguard the quality of each article we publish.
Find out more
ORIGINAL RESEARCH article
Front. Environ. Sci. , 24 June 2022
Sec. Freshwater Science
Volume 10 - 2022 | https://doi.org/10.3389/fenvs.2022.941726
This article is part of the Research Topic Interactions between Groundwater and Human Communities: Perspectives on the Resources, Environments, Threats and Sustainable Development View all 18 articles
Overly rapid urban expansion in the past has significantly changed water resources, resulting in an imbalance between water resources and the sustainable development of new urbanization. To facilitate the sustainable development and utilization of water resources and promote the high-quality development of new urbanization, this study constructs evaluation index systems for water resources and new urbanization. The analytic hierarchy process, entropy method and projection pursuit method are used to determine the weight of each index, and Hebei Province is taken as an example for empirical analysis. The results indicate an upward trend for water resources in Hebei during the 2000–2019 period, while the water resources support capacity and water environmental pollution showed trends of gradual improvement but changed greatly, the water ecological carrying capacity gradually increased, and the negative impact of water disaster damage on the comprehensive situation of regional water resources gradually increased. Meanwhile, a qualitative breakthrough has been made in the development of new urbanization. Based on their evaluation results data, the long-term equilibrium relationship between water resources and new urbanization as well as the dynamics are empirically analyzed using a vector autoregressive model with a variable cointegration test, generalized impulse responses, and a decomposition prediction method using evaluation result data for the 2000–2019 period. There is indeed a supporting and inhibiting dynamic relationship between new urbanization and water resources as well as its components. At the early stage of urbanization, the endowment of water resources, the background value of the water environment, the ecological capacity of water and man-made water disasters were not fully considered, which led to the sharp contradiction between water resources and new urbanization. For a period, the decline in water resource support capacity and serious water environmental pollution have gradually become important factors limiting new urbanization in Hebei, and the constraining effects of the reduced water ecological carrying capacity and water disaster damage have gradually decreased. For future development, decision makers in Hebei should take measures such as adjusting the economic growth mode, improving resource utilization efficiency and technical level, and fully considering the positive role of new urbanization in promoting water resources and water environments. At the same time, Hebei Province should reduce the rate of water resource consumption by strengthening water conservation measures, optimizing the water utilization structure, and increasing investments in water pollution prevention and control to enhance the stability of water environments to realize the coordinated development of water resources and new urbanization.
Urbanization is the inevitable trend of social and economic development and an important symbol of national modernization (Castells-Quintana 2017; Ahmad et al., 2019). Since the reform and opening up in 1978, urbanization in China has developed rapidly, with the urbanization rate of the resident population increasing by nearly three times, the urban population increasing by four times, and the actual built-up area expanding by more than 20 times, resulting in a drastic change in the urban landscape (Su et al., 2016, Guan et al., 2018a; Chen et al., 2019a). As the world’s second largest economy, China’s urbanization process has become a major event affecting the process of mankind in the 21st century, which has a significant impact on the development of China and even the world (Chen et al., 2013; Tan et al., 2016). China is now a primarily urban society in terms of urban population and spatial morphology. However, in terms of lifestyle as well as unbalanced regional and urban-rural development, there are still large gaps regarding standards for urban society in China (Wei and Zhang 2017, Guan et al., 2018b; Fang et al., 2019b). According to the law of urbanization development in developed countries, China will still be in the stage of rapid development with a growth rate of 30%–70% in the next 10–15 years (Wang et al., 2015; Chen et al., 2016). It is imperative to apply scientific and reasonable research methods to systematically analyze urbanization and comprehensively improve the level of urbanization both quantitatively and qualitatively. Therefore, in 2014, the Chinese government clearly put forward the strategic task of promoting the development of new-type urbanization (Fang et al., 2015; Taylor 2015), which involves not only the fundamental issue of coordinated development of the national economy but also the sustainable development of rational utilization and long-term protection of resources and environment (Chan 2014; Zeng et al., 2020). In recent years, with the steady advancement of China’s new urbanization, relevant academic research has gradually stepped into the stage of steady deepening. The research hotspots mainly include the following aspects: the theoretical connotation and development framework of new urbanization (Yang and Jiang 2018), the evaluation system of new urbanization (Cobbinah et al., 2015; Anwar et al., 2017; Zhong et al., 2020), the impact effect of new urbanization (Shang et al., 2018), the coupling and coordination between new urbanization and ecological environment (Liu et al., 2018, Wang J. et al., 2019), population urbanization and the equalization of basic public services (Chen et al., 2019b; Li and Liu 2021), the integration of new urbanization and rural revitalization (Fang et al., 2015; Li et al., 2018), and ecological civilization and sustainable development (Wang and Chen 2019; Zhao et al., 2019).
Water resources, as the material on which human beings depend for survival, support the development of society and economy (Wang H. et al., 2020; Liu H. et al., 2022). The understanding of hydrogeochemical characteristics such as nitrogen, fluoride, and major ions analysis could help to evaluate the risk of groundwater to human health (Ahmed and Ali 2011; Wang W. et al., 2020; Xiao et al., 2022). In recent work, fuzzy comprehensive quantitative evaluation, Drosophila optimization algorithm and Monte Carlo simulation method were used to evaluate hydrogeological risk and predict water quality evolution (Ouelhazi et al., 2014; Shojaei et al., 2015; Wang X. et al., 2019; Ruan et al., 2021), which could avoid the degradation of groundwater quality, improve the fragility of water resource systems and water ecological conditions, and improve the sustainable utilization capacity of regional water resources. Meanwhile, the coordinated development of water resources, economy and society has gradually attracted much attention (Ma et al., 2018; Song et al., 2018; Mou et al., 2019). Through multi-index dynamic comprehensive analysis and evaluation of water resources carrying capacity, including principal component analysis, system dynamics, ecological footprint, modeling studies can estimate the maximum development capacity and supporting capacity of regional water resources (Leeuwen and Sjerps 2015; Magri and Berezowska-Azzag 2019; Wang et al., 2018; Mou et al., 2020). Furthermore, in order to maintain a good ecological environment in the process of water resources development and utilization, and reduce flood and drought disasters, most studies focused on water resources security supply, water resources security evaluation and water resources security early warning system by using the DPSIR conceptual framework, artificial neural network, water footprint and other methods (Malzer et al., 2010; Kot et al., 2015; Roeger and Tavares 2018; Rickert et al., 2019).
With the continuous advancements in urbanization, excessive urban expansion has significantly altered water resources, making it difficult to balance the relationship of urban size and population growth with water resources (Du et al., 2006; Fang et al., 2021; Tang et al., 2021). Every 1% increase in China’s urbanization rate leads to a 0.58% increase in total water consumption (Barron et al., 2013; Shen et al., 2014). Population agglomeration, urban expansion, and economic development have caused damage and pose threats to water resource supplies and water environmental protection, and water resources are not aligned with the sustainable development of new urbanization. In some studies, researchers studied the restrictive effects of water resources on production, life and ecology in the development of urbanization through quantitative and qualitative analysis methods such as entropy method and spatial spillover effect (Meinzen-Dick and Appasamy 2002; Tiffen 2003; Bao and Fang 2012). In contrast, some scholars use multivariate statistical techniques, multi-objective analysis and spatial spillover effects to analyze the impact of urbanization on water resources (Panagopoulos, 2014; Dong et al., 2016; Bao and Chen 2017; Zhang et al., 2018, Wang H. et al., 2020, Liu S. K.et al., 2022). In addition, there are also studies that focus on the two independent systems of water resources and urbanization from the perspective of systems (Liu et al., 2018). In their work, a system coordinated development degree model was established to analyze the interaction and coupling effect of water resources and urbanization (Wu et al., 2017; Zhang et al., 2019). Currently, there is a comprehensive understanding of water resources including resources, environment, ecology and disasters (Wang et al., 2018); hence, this study constructs comprehensive evaluation index systems for multifactor water resources and new urbanization, empirically tests the process and extent of their interaction using a vector autoregressive model and explores the idea of the coordinated development of new urbanization and water resources in Hebei Province, China, as an example.
Hebei surrounds the capital of Beijing and the municipality of Tianjin in a semi-ring shape, is the only province in China that encompasses two major municipalities, and has unique location advantages (Figure 1). Despite development guidance through the Beijing-Tianjin-Hebei (JingJinJi) integration, the economic growth and urbanization of Hebei have been slower than those of other major economic provinces in the country. In 2019, Hebei dropped from sixth place to 13th place in the national GDP ranking of provinces, and the urbanization rate for the permanent population ranked 19th and below the national average (Fang et al., 2019a; Li et al., 2019; Liang et al., 2019).
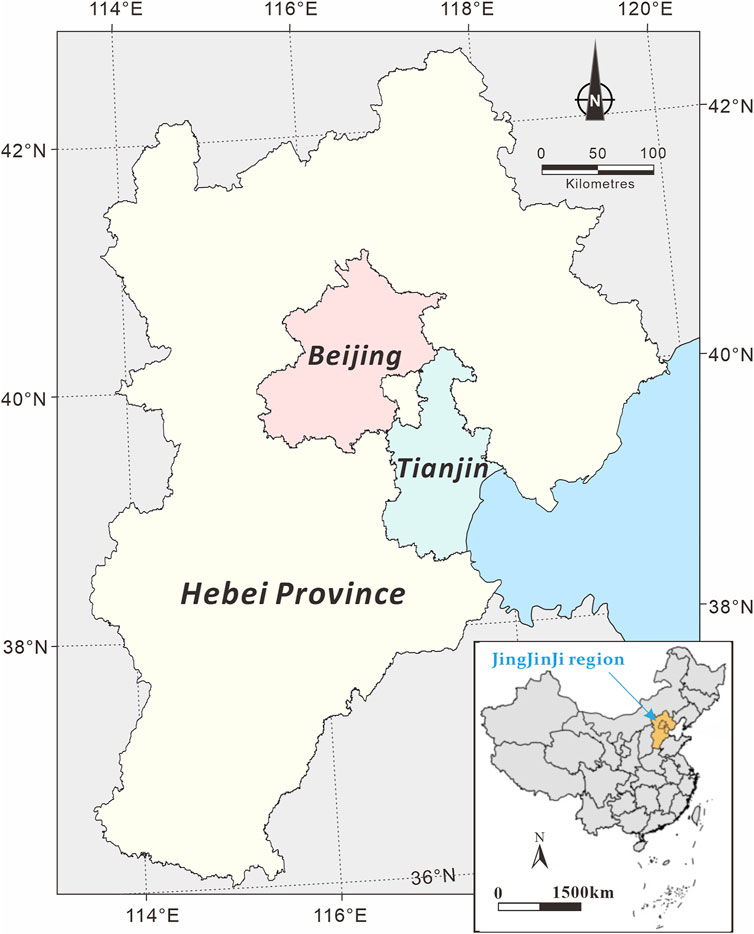
FIGURE 1. Geographical location of Hebei Province. The map is modified from (Yao 2017).
Hebei is located in the Haihe River Basin, which experiences the most water scarcity in China. As a province with extreme water shortages, in 2019, the per capita water resources in Hebei were 149.9 m3, only 7% of the national per capita water resources. The cumulative amount of groundwater overdraft is approximately 180 billion m3, forming the world’s largest groundwater funnel, which is the main cause of ground subsidence in the JingJinJi area, producing a series of water environment and ecological issues, such as vegetation degradation and soil salinization that seriously endanger human life and production (Xie et al., 2017; Xie et al., 2018). In the long term, if water resource constraints are not fully considered, the aforementioned water resource problems will seriously limit the scale of urbanization in Hebei because of economic growth, spatial expansion, population agglomeration, and the increase in consumption (Ma et al., 2020).
China formally began compiling data for and releasing the China Water Resources Bulletin in 1997, followed soon after by Hebei compiling data for and releasing the Hebei Water Resources Bulletin. For this reason, the sample interval for the present study is 2000–2019, considering the availability and reliability of other data. The data are mainly derived from the statistical data and field survey data reported in the China Statistical Yearbook, China Urban Statistical Yearbook, China Urban and Rural Construction Statistical Yearbook, and Hebei Statistical Yearbook for the corresponding years.
The data of indexes included in the water resource and new urbanization evaluation index systems cannot be directly compared due to the differences in value ranges caused by factors such as units of measure, dimensional processing, and positive and negative index values. To eliminate the differences in indexes and make the indexes comparable under statistical standards, the index values are normalized using min-max normalization. The indexes are divided into two categories: positive (+) and negative (−). The larger the value of a positive index is, the greater the positive contribution to the system; in contrast, the smaller the value of a negative index is, the greater the negative contribution to the system. With m evaluation indexes x1, x2, … , xm and the raw index data of n cities xij (i = 1, 2, … , n; j = 1, 2, … , m), the specific equations are as follows:
Normalization for positive index:
Normalization of negative index:
where Bij is the normalized data, min xij is the minimum value, and max xij is the maximum value.
Due to the difference in research direction, the connotation explanation and research content of water resources are different. Based on the existing research results this study sorted out the “four water issues” in the process of water resource development in China, such as the declining support capacity for water resources, serious pollution of water environments, a reduction in the water ecological carrying capacity, and serious damage from water disasters (Larsen Tove et al., 2016; Xia et al., 2017; Schellenberg et al., 2020). A water resource evaluation index system consisting of four primary indexes, nine secondary indexes, and 33 tertiary indexes is constructed (Table 1). The problem-oriented evaluation index system can not only simplify the number of indicators but also make the independence and importance of indicators clearer, which is conducive to the development of water resource potential and the alleviation of the contradiction between people and resources. The four primary indicators are described as follows:
1) Water resource support capacity (WRSC). The WRSC is mainly manifested in the current level of scientific and technological development, as well as the supporting limit of regional water resources to the development population, society and economy. However, with the rapid development of urbanization, the demand for water resources is increasing daily, and the contradiction between supply and demand is prominent. WRSC has difficulty supporting urban development, and even becomes the bottleneck restricting social development. The evaluation of the WRSC mainly includes water resource quantity, water supply problem and water consumption problem. Among them, the water resource quantity mainly reflects the endowment of regional water resources. The water supply problem reflects the degree of water resources development and utilization and the perfection of basic water supply facilities. The water consumption problem mainly reflects the regional water consumption level, the degree of water structure optimization and the comprehensive water use efficiency.
2) Water environmental pollution (WEP). Because of the irreplaceable nature of water resources, the quality of the water environment has direct and indirect influences on the ecological environment, atmospheric environment, soil environment and even the social environment. The WEP evaluation is mainly carried out from three aspects: water quality improvement, pollution emission and sewage treatment. Pollution emissions include agricultural pollution emissions, urban pollution emissions and industrial pollution emissions. Sewage treatment includes urban sewage treatment capacity and sewage resource utilization.
3) Water ecological carrying capacity (WECC). With the development of the social economy, the threat of human activities to water ecosystem is increasing, and the function of the water ecosystem is seriously degraded. The sustainability of the WECC can be reflected by three aquatic habitat indicators: river connectivity, forest and grass coverage and proportion of water area.
4) Water disaster damage (WDD). Water disasters generally refer to the fact that too much or too little water affects or destroys human production and life. The evaluation of WDD is mainly carried out through two aspects: flood disasters caused by too much water and drought disasters caused by too little water.
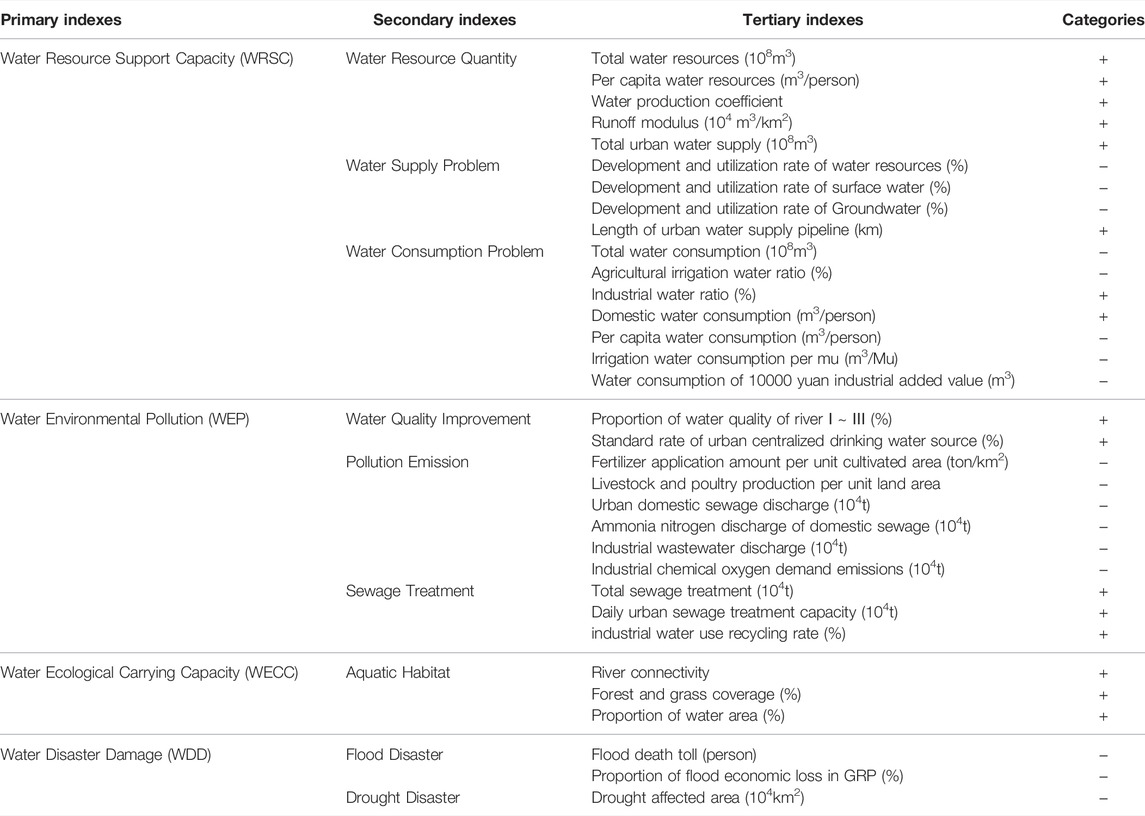
TABLE 1. Water resources evaluation index system.
In the context of complex and severe domestic and international situations, the level of urbanization in the new era can no longer be reflected using a single index, i.e., population urbanization rate (Li et al., 2018; Gu 2019). The “new” of new urbanization is defined as that with China’s development entering the transition period; its development mode, the driving force and the target are different from the traditional extensive urbanization development (Shen et al., 2015; Lu and Ke 2018; Nong et al., 2018; Yu 2021). In other words, it has a connotative economic growth mode, harmonious social development mode, intensive resource utilization mode, innovative science and technology driving ability and the principle of coordinated urban-rural planning. Therefore, for new urbanization, its measurement standard also needs to adopt the comprehensive evaluation method of multiple indicators to grasp the achievements, difficulties and challenges in the process of urbanization, and promote healthy and sustainable development. On this basis, the present study establishes a new urbanization evaluation index system consisting of five primary indexes, 12 secondary indexes, and 48 tertiary indexes (Table 2), which can more clearly reflect the achievements, difficulties and challenges in the process of urbanization development.
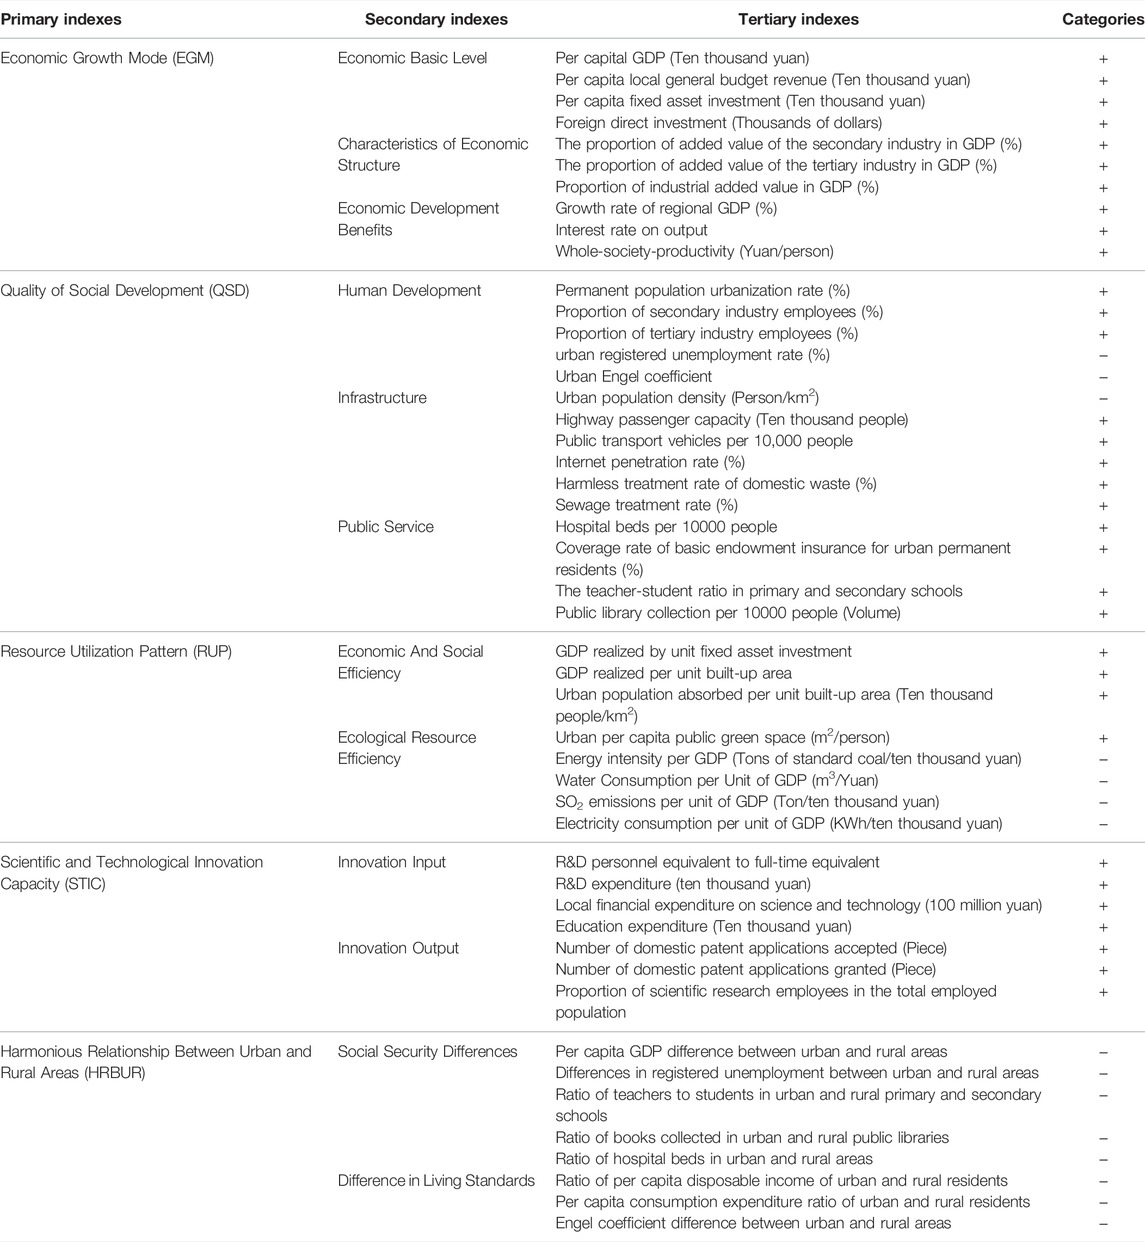
TABLE 2. New urbanization evaluation index system.
In the above index selection process, because of the different degrees of influence of indexes on the overall system, the final selection results directly affect the feasibility and accuracy of the final evaluation results for water resources and the new urbanization development level. Therefore, it is particularly important to choose an appropriate method to handle the index weights. Considering that each weighting method has certain limitations, to reduce the differences caused by different weighting methods, the subjective weighting analytic hierarchy process, the objective weighting entropy method, and the projection pursuit method, which can identify multiple-index, multiyear high-dimensional evaluation indexes, are selected to determine the index weights, and the comprehensive weight obtained by calculating their mean values reduces, to a certain extent, the limitations and drawbacks of individual weighting methods (Liu et al., 2018).
The VAR model is an econometric model that has been widely used in economic research in recent years for the comprehensive analysis of multiple mutual economic variables. It is usually used to predict interconnected time series systems and analyze the dynamic impact of random disturbances on variable systems (Sun 2017; Schulterbrandt Gragg et al., 2018) and to model the relationship between variables through an unstructured approach. It is expressed in Eq. 1:
where
The principle of the VAR model is to construct the model by taking each endogenous variable as a function of all endogenous variables in the system. Therefore, to analyze the relationship between water resources and new urbanization, this study is based on the evaluation index systems constructed in Sections 2.1, 2.2. The obtained evaluation results for water resources and new urbanization are used as empirical analysis data in the VAR model. This avoids the problem that a single index cannot fully reflect the endogenous variable of the water resources and new urbanization system.
The weights of evaluation indexes for water resources in Hebei are calculated according to Subsection 2.3; the results are shown in Supplementary Table S1. The data for Hebei from 2000 to 2019 are processed to calculate the scores for each water resource dimension. The values are greater than 0 and not greater than 1, and the larger the value is, the better the comprehensive situation for water resources. As seen in Figure 2, the comprehensive evaluation results for water resources in Hebei increase from 0.302 in 2000 to 0.587 in 2019, exhibiting an overall upward trend, with fluctuations. Among them, there was a downward trend in 2004–2006 and 2012–2014. During this period, the change in water resources may be due to the rapid development of the secondary industry and the improvement of living standards, resulting in difficulties in supporting water resources and the deterioration of the water environment.
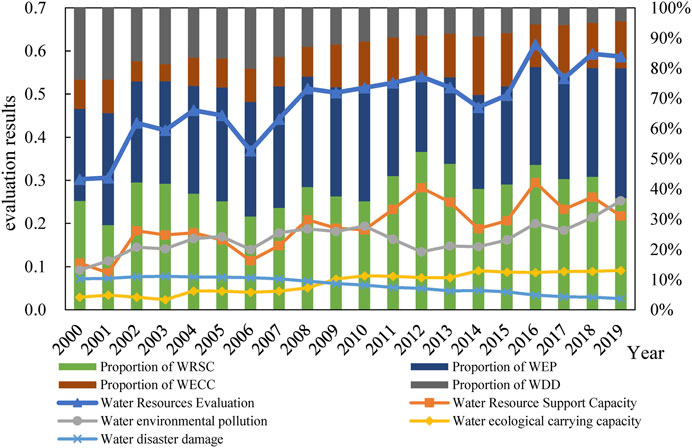
FIGURE 2. Comprehensive evaluation results of water resources in Hebei Province from 2000 to 2019.
Specifically, the average evaluation score of the WESC in Hebei Province from 2000 to 2019 accounted for 40%, which is the basis of urban water resource development potential, shows a phased upward trend but with large fluctuations. According to the calculation, the fluctuation of water resource quantity in the WESC dimension is large, indicating that the load carried by the natural endowment of water resources in Hebei, a region with poor water resources, has exhibited an increasing trend year by year as the economic aggregates and population density grow and the demand for water resources increases continuously. However, the evaluation scores of water supply problem and water use problem are on the rise, which indicates that due to the gradual shortage of water resources, people attach great importance to water resources and begin to implement stricter measures to limit the development and protection policies of water resources to ensure the sustainability of water resources.
The WEP dimension is also an important factor affecting water resources in Hebei. Among them, with the development of the decision-making and deployment of special actions to promote water quality improvement and comprehensive treatment in Hebei, the water quality improvement increased from 0.01 in 2000 to 0.61 in 2019, and the water quality of centralized drinking water sources was comprehensively improved. In terms of pollution emission and sewage treatment, when the urbanization level transits from development to maturity, the development mode of extensive economy in the traditional stage of urbanization will result in a large amount of pollution discharge, and the pollution discharge score will also drop. When the level of urbanization reaches a certain level, the pressure on the environment gradually decreases and the WEP score fluctuates upward as Hebei promotes the implementation of special actions for improving water quality and the comprehensive management of water quality.
Focusing on the WECC, Hebei in recent years has implemented a number of measures, such as long-term recuperation mechanisms, protection and management, ecological replenishment, and comprehensive prevention and control of soil erosion to treat and restore ecologically overloaded rivers and lakes. As a result, the degraded ecological spaces of rivers and lakes as well as the water ecological situation continued to improve, and the WECC score increased from 0.029 in 2000 to 0.091 in 2019.
Regarding the WDD dimension, the rapid economic development and urban construction have increased the vulnerability of the ecological environment, and the WDD score decreased from 0.072 in 2000 to 0.026 in 2019. The proportion of WDD also dropped from 24% to 4%, which gradually reduced the positive impact on water resources in Hebei Province. This may even lead to the frequent occurrence of extreme natural disasters in the future.
The weights of the evaluation indexes for new urbanization in Hebei are calculated based on Subsection 2.3, and the results are provided in Supplementary Table S2.
The data for Hebei from 2000 to 2019 are processed to calculate the comprehensive score for new urbanization and the score for each dimension; the results are shown in Figure 3. The overall development level of new urbanization in Hebei shows a fluctuating upward trend, from 0.164 in 2000 to 0.815 in 2019. Except for the coordinated urban-rural relationship, which shows an increasing and then decreasing trend, the economic growth mode, social development quality, resource utilization mode, and technological innovation capacity all show steady growth trends.
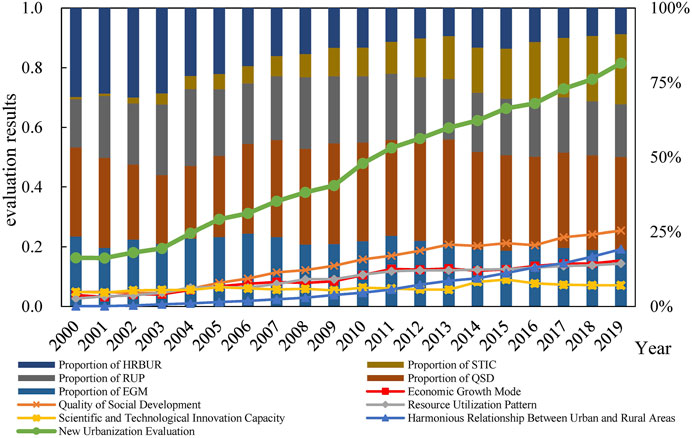
FIGURE 3. Comprehensive evaluation results of new urbanization in Hebei Province from 2000 to 2019.
Specifically, first, the evaluation score of the QSD from 2000 to 2019 accounted for 31%, which made the largest contribution to the development level of new urbanization. This shows that in recent years, Hebei has paid attention to the “people-oriented” social infrastructure construction and improvement of the public service system, and its role has been gradually enhanced. Second, the STIC increased from the lowest score among the five dimensions in 2000 to second in 2019, reflecting the undeniable role and status of the STIC in promoting the rapid development of new urbanization. However, through calculation, it can be seen that the development of the STIC is mainly manifested in the investment of innovation input, while the innovation output ability is relatively weak. Third, the EGM exhibits a fluctuating upward trend, and its contribution to the level of urbanization is consistently third among the five dimensions. Although Hebei has a good economic basic level, its role in economic and efficient development and continuous optimization of industrial institutions is not obvious enough. Fourth, the RUP shows an upward trend of fluctuating, with a relatively stable share. During the whole research period, the RUP remained in fourth place, with relatively little development compared with that for the first three dimensions, especially the weight of economic and social efficiency of 0.053, which was much lower than the ecological resource efficiency of 0.104. Finally, the HRBUR decreases from first among the five dimensions in 2000 to last, reflecting the widening of the urban-rural income gap and the gradual increase in urban-rural conflicts, which may affect the sustainable development of new urbanization in the future.
Because the present study mainly examines whether the “four water issues” in Hebei has an impact on new urbanization, only the relationships between WRSC, WEP, WECC, and WDD, and the development of new urbanization are analyzed; the five dimensions of new urbanization are not discussed in detail. For ease of discussion, the water resource support capacity, water environment pollution, water ecological carrying capacity, and water disaster damage in the comprehensive situation of water resources are denoted by R1, R2, R3, and R4, respectively, and new urbanization is denoted by U.
Before cointegration analysis, to avoid pseudo-regression, it is first necessary to perform the augmented Dickey-Fuller (ADF) stationarity test on the time series data of the variables. Nonstationary data need to be differenced to become stationary.
The test results are shown in Table 3. For the sample interval at the 5% significance level, the hypothesis that all variables have unit roots does not pass the significance test; therefore, the five series are all nonstationary. After the first-order difference, the null hypotheses for DR3, DR4, and DU at the 5% significance level are rejected, and hence, the series are stationary. These results indicate that the first-order difference of each series from 2000 to 2019 is stationary and integrated in the same order, satisfying the precondition of the cointegration test.
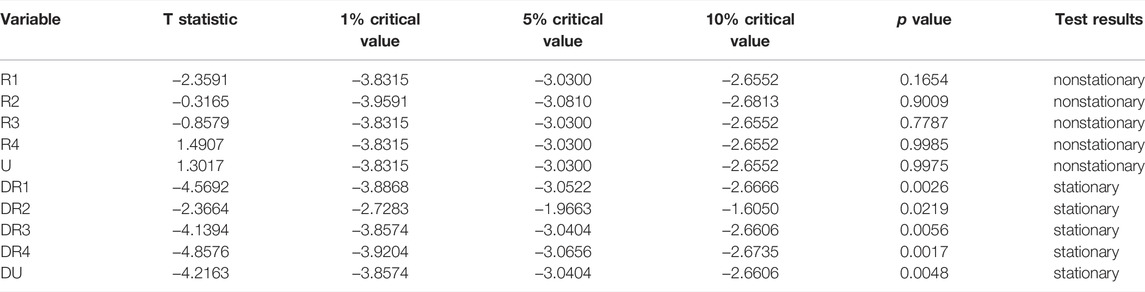
TABLE 3. ADF unit roots test of variable series.
The cointegration test refers to the stationarity of the series obtained from a certain linear combination of two or more nonstationary variable series. The obtained results are analyzed using EViews 9.0 software and provided in Table 4. The trace statistic and the maximum eigenvalue are both greater than the critical value of 5%; therefore, there is a cointegration relationship between R1, R2, R3, R4, and U.

TABLE 4. J-J cointegration test.
The optimal lag order is an important precondition of the VAR model. Only when the lag order is determined can the form of the VAR model be decided. To determine the order of vector autoregression, the results of six tests are used in the present study for comprehensive judgment, and all support an optimal lag order of 2.
The cointegration analysis results indicate that there is a cointegration relationship between the two variables, that is, there is a long-term equilibrium relationship between the two variables. However, to examine the short-term causal relationship between the two, the tested stationary series are substituted into the model based on the previous test results and the selected lag period, the model parameters are estimated using the least squares method, and the coefficient matrix of the VAR model is fitted using Eq. 3. The model estimation results are shown in Table 5. The degree of influence and significance of each variable and its lagged term on that variable as well as the fitting effect of the regression equation all pass the test of independent and identical distribution of residuals.
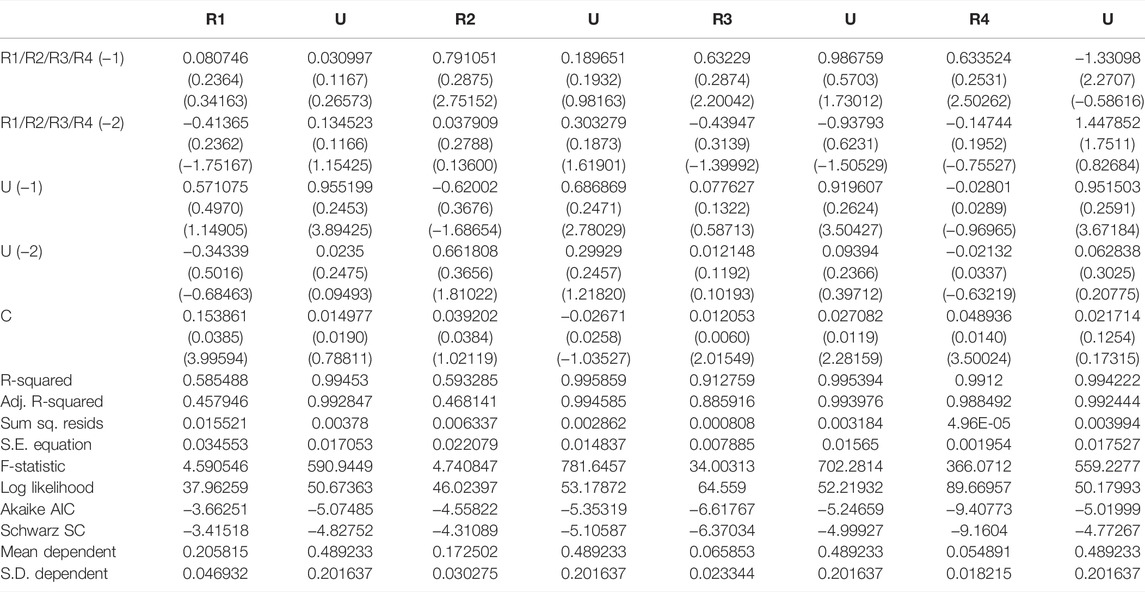
TABLE 5. VAR model estimation results.
The modules of all roots obtained by EViews 9.0 software were used to analyze the stability of the model. If the model is unstable, the results are not credible. As seen in Table 6, the modules of the roots are all less than 1, indicating that the four VAR models established between R1, R2, R3, R4, and U in the present study are stable and that the various tests based on this model are valid.

TABLE 6. Stability test results of VAR model.
As determined from the earlier test and analysis, there is indeed a causal relationship between water resources and new urbanization. To further investigate the relationship, the present study introduces the impulse response function (IRF) to describe the response of an endogenous variable to errors, that is, the trajectory of the influence of an information impact with the standard deviation added to the disturbance term on the current and future values of endogenous variables can visually depict the dynamic interaction between water resources and new urbanization as well as its effect. It is expressed as follows:
where
Figures 4A,B shows two indexes, i.e., R1 and U, and their mutual impact effect as well as the dynamic response of the system. First, the influence of the impact of one standard deviation to U on R1 is generally positive, increasing gradually in the first two periods, reaching a maximum in the second period and then starting to decline, decreasing to 0 in the fourth period, and then increasingly slightly but basically close to the X-axis. Second, the influence of the impact of adding one standard deviation to R1 on U is negative in the first period, then begins to increase, reaching a maximum in the third period and then starting to decline and basically remaining stable after the sixth period. These results indicate that the rapid growth of urbanization in Hebei in the short term leads to a gradual increase in the development and utilization of water resources and a decrease in the WESC; however, when urbanization reaches a certain level, the rapid consumption of water resources and serious water supply shortages can be alleviated with the popularization of economical and intensive water use.
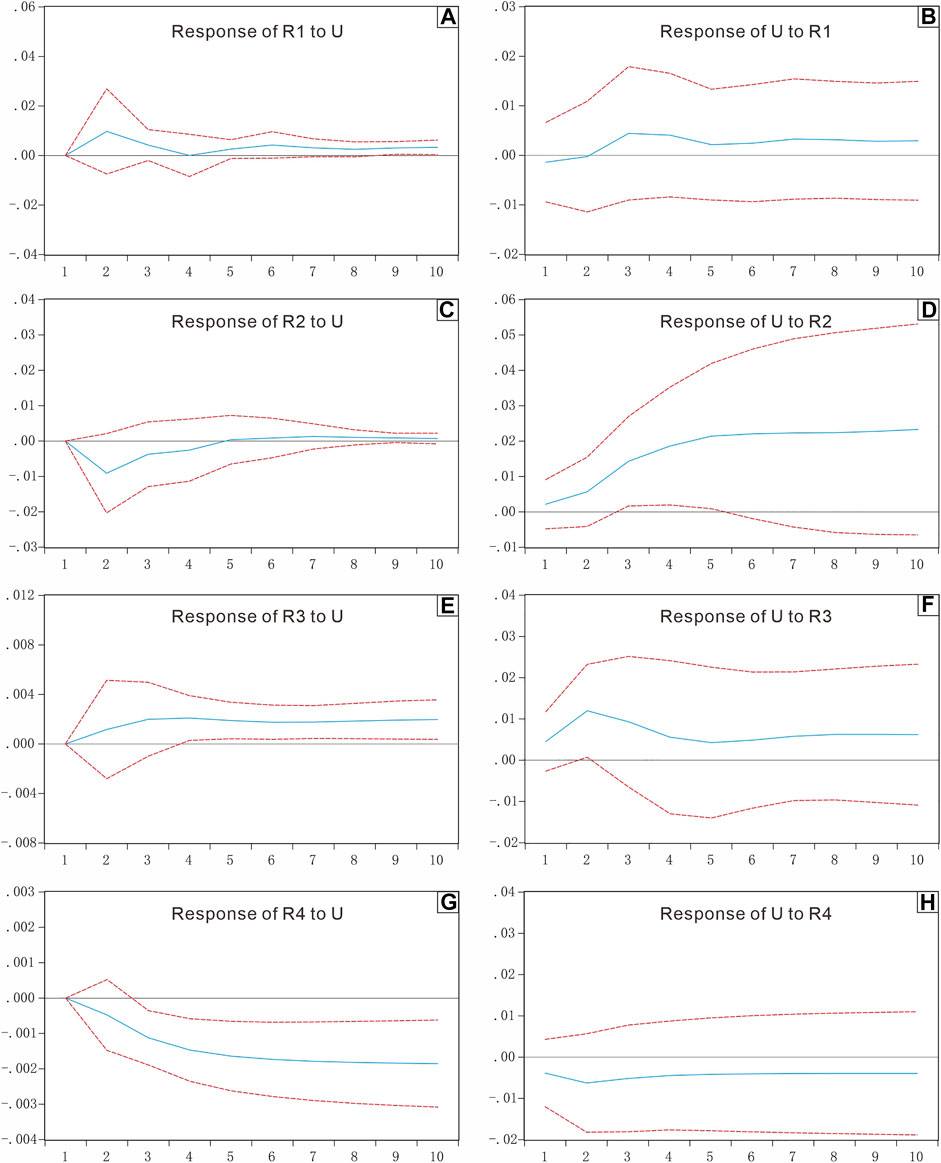
FIGURE 4. Diagrams show impulse response of water resources and new urbanization for R1 to U (A), U to R1 (B), R2 to U (C), U to R2 (D), R3 to U (E), U to R3 (F), R4 to U (G) and U to R4 (H).
As seen from Figures 4C,D, the influence of one standard deviation to U on R2 starts to be negative, the first period is 0, the second period reaches the minimum value, then it starts to rise, and it becomes positive convergence on the X-axis from the fifth period. In contrast, the influence of the impact of one standard deviation on R2 on U is the smallest in the first period, and then gradually increases. This indicates that in the short term, the WEP increases with advancements in urbanization. In other words, current urbanization development occurs at the expense of water environments, but it gradually weakens and tends to be rationalized in the long term.
As shown in Figures 4E,F, the influence of one standard deviation to U on R3 is generally positive. The impact in the first period is 0, then it starts to rise, and the fourth period reaches its maximum, and then changes steadily. Second, the influence of the impact of one standard deviation to R3 on U is generally positive, which is the smallest value in the first period, then gradually increasing, and the largest in the second period, then decreasing. In the short term, the stronger is the WECC of a city, the faster is its urbanization development. However, as urbanization advances, the requirements for the WECC become increasingly higher, and the stresses on the WECC become increasingly more obvious.
In Figures 4G,H, the influence of the impact of one standard deviation to U on R4 is generally negative. The influence of the first period is 0, and then it begins to decline. Similarly, the influence of the impact of one standard deviation to R4 on U is generally negative, with the maximum in the first period, then a slight decrease, the minimum in the second period, and then a slow increase. In the short term, with the advancement of urbanization in Hebei, the expansion of cities and towns encroaching on farmland and the three-dimensional development of urban space, the regional flood control and drainage capacity will decline, which will lead to certain water disasters. However, the WDD has a stable and destructive effect on urbanization. The greater the degree of WDD in a city is, the slower its urbanization development).
Unlike the IRF method, VAR variance decomposition decomposes the prediction mean square error (MSE) of the endogenous variable in the model into m parts associated with each equation according to its cause, so that it can be decomposed into subvariables associated with the random disturbance terms. By analyzing the relative importance of endogenous variables in the model to the impact of each information set, the relative contribution of each variable is calculated to understand the relative importance of each information set to the endogenous variables of the model. This study uses the VAR variance decomposition method to investigate the degree of influence of water resources and new urbanization in Hebei. The prediction error of the VAR model in the first s periods is given as follows.
where
From the perspective of R1, the contribution of U to the fluctuation in R1 increases from 0% in the first period to 10.69% in the 10th period; the contribution of R1 to the fluctuation in U increases from 0.67% in the first period to 2.83% in the 10th period (Figure 5A). This result indicates that the decrease in WRSC in the initial stage is mainly influenced by Hebei’s own resource endowment; however, with the development of urbanization, the massive consumption of resources affects the role of water resources in guaranteeing the development of urbanization. The amount of water resources is sufficient, and the increase in the level of urbanization is mainly affected by urban development itself. However, when the demand for water resources gradually exceeds the upper limit of the regional water resource endowment, it is difficult for water resources to support urban development and will play a constraining role in urbanization development.
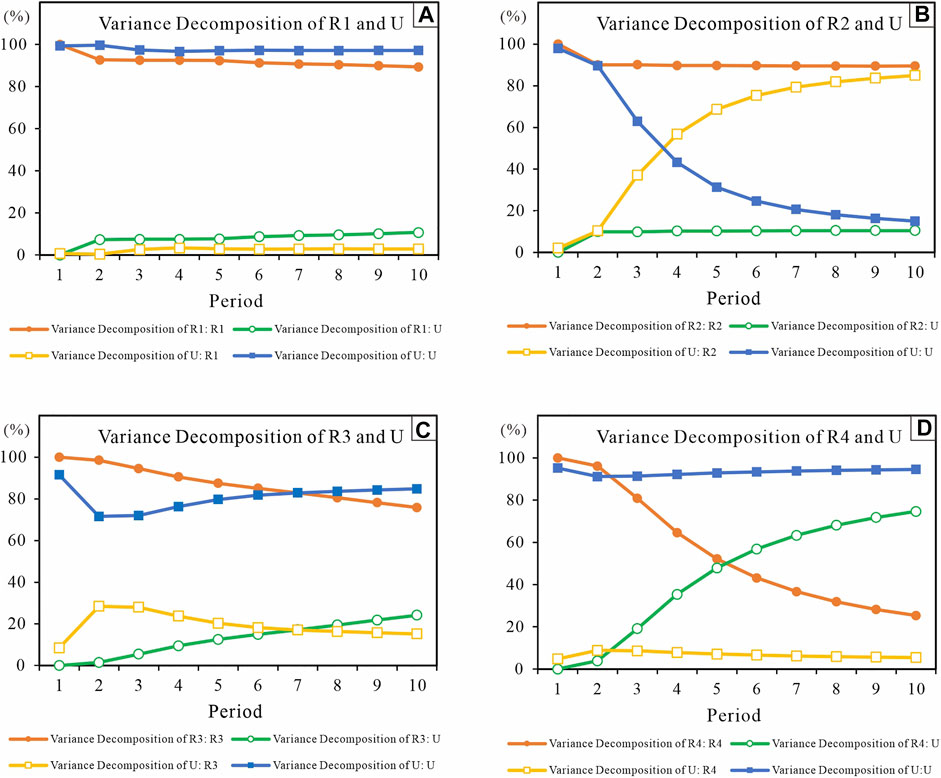
FIGURE 5. Diagrams show variance decomposition of water resource and new urbanization for R1 and U (A), R2 and U (B), R3 and U (C) and U to R4 (D). Data are given in Supplementary Table S3.
Figure 5B for the variance decomposition result. The contribution of U to the fluctuation in R2 increases from 0% in the first period to 10.5% in the tenth period; the contribution of R2 to the fluctuation in U increases from 2.11% in the first period to 84.98% in the tenth period. WEP is more influenced by its own environmental capacity endowment in the early stage of urbanization development, but urbanization produces increasingly more disturbance to the regional water environment. The level of urbanization development is less affected by WEP in the early stage, but when environmental pollution exceeds the natural endowment of the environmental capacity, water pollution gradually constrains urbanization in Hebei.
The difference in WECC is that the contribution of U to the fluctuation in R3 increases from 1% in the first period to 24.17% in the 10th period; the contribution of R3 to the fluctuation in U increases from 8.5% in the first period to 28.41% in the second period and decreases to 15.19% in the 10th period, which is still higher than that in the first period (Figure 5C). This result indicates that the changes in water ecology in the early stage of urban development are mainly influenced by itself but that the increase in the level of urbanization gradually affects the carrying capacity of regional water ecology. The initial development of urbanization does cause a decrease in the WECC, which in turn inhibits the sustainable development of urbanization through feedback effects. However, with continuous improvements in water ecology, the serious constraints on urbanization are reduced but a certain inhibiting effect remains.
As shown in Figure 5D, the contribution of U to the fluctuation in R4 increases from 0% in the first period to 74.63% in the 10th period; the contribution of R4 to the fluctuation in U increases from 4.83% in the first period to 8.85% in the second period and decreases to 5.47% in the 10th period. In terms of WDD, urban development is more influenced by natural factors during the early stages, but urbanization indeed causes water disaster events, which in turn affect the progress of urban development. However, with continuous improvements in the water disaster prevention and control system in Hebei, the constraints of the WDD on urbanization gradually decrease, but there is still a certain inhibiting effect compared with the initial stage of development.
Based on the time series data of evaluation results for water resources and new urbanization in Hebei from 2000 to 2019, this study establishes a VAR model for water resources and new urbanization to analyze the dynamic response relationship between the two. The following conclusions and recommendations are provided.
1) During the 2000–2019 period, the comprehensive evaluation results for water resource in Hebei Province showed a fluctuating upward trend, reflecting gradual improvement in the comprehensive situation of water resource. In particular, water resource support capacity and water environment pollution have changed significantly. The average proportion of water resources support capacity and water environmental pollution in water resources evaluation results is as high as 75%, although they show a trend of gradual improvement. If the constraints of resources and environmental capacity are not fully considered, when resource consumption and pollution discharge reach a certain limit, the self-recovery function of resources and environmental elements in urban areas will be destroyed, thus inhibiting the sustainable and healthy development of water resources. Through the same evaluation results, the water ecological carrying capacity gradually increases, while the negative impact of water disasters on the comprehensive situation of regional water resources gradually increases. Therefore, in the future, it is necessary to continuously strengthen and improve the comprehensive water disaster prevention and control system in Hebei Province, and promote emergency observation, early warning, disaster investigation and evaluation of various disasters.
2) As China’s economy is changing from high-speed development to high-quality development under the new normal, the corresponding urbanization development is also changed from rapid growth in the medium term to quality improvement in the later period. By constructing a new urbanization evaluation index system of “connotation, harmony, intensive, innovation and coordination”, the evaluation score of new urbanization in Hebei increases from 0.164 in 2000 to 0.815 in 2019, and urbanization development achieved a qualitative breakthrough. However, the development of new urbanization is an extremely complicated development complex process that is influenced by many factors. Therefore, the development of new urbanization in Hebei Province still needs to solve the challenges and problems faced by water resources, and reveal the interaction and feedback mechanism between water resources and new urbanization.
3) Based on the perspective of the relationship between water resources and new urbanization, this study applies a cointegration test to verify the long-term dynamic relationship between water resources and new urbanization in Hebei Province. By introducing the IRF, it is shown that there is a supporting and inhibiting dynamic relationship between water resources as well as their components and new urbanization in Hebei. This shows that in the early stage of urbanization, influencing factors such as water resource endowment, water environment background value, water ecological capacity and man-made water disasters were not fully considered, which led to the sharp contradiction between water resources and new urbanization. Therefore, it is suggested that in the future development of new urbanization in Hebei, measures such as adjusting the economic growth mode, improving resource utilization efficiency, and upgrading the technical level should be taken to reduce urbanization’s consumption of water resources, interference of water environment, degradation of water ecology, and human factors of water disasters to achieve the healthy and sustainable development of water resources in Hebei Province.
4) The results of the variance decomposition model further indicate that the declining support for water resources and the serious pollution of water environments have gradually become important factors limiting new urbanization in Hebei and that the constraining effects of the declining water ecological carrying capacity and water disaster damage on urbanization gradually decrease. While developing and utilizing water resources for new urbanization in Hebei, it is recommended that in the real-world context of poor water resources and serious water environment pollution, investments in water conservancy projects, such as the South-North Water Diversion Project, the intensive use of resources, and water pollution prevention and control should be increased, and the positive role of new urbanization in promoting water resources and water environments should be fully considered, as should slowing the consumption rate of water resources, optimizing the water use structure, and improving the stability of water environments.
The original contributions presented in the study are included in the article/Supplementary Material, further inquiries can be directed to the corresponding authors.
SL and JS conceived of the original idea and helped to supervise this study. SL took the lead in the calculation and writing of the publication. SL and QP contributed to the calculation of data and the writing of the publication. FL and JY assisted in calculations through interviews and review of the publication. All authors listed have made a substantial, direct and intellectual contribution to the work and approved it for publication.
This research was jointly supported by Western China Young Scholars Program of the Chinese Academy of Sciences, The Second Tibetan Plateau Scientific Expedition and Research (SQ2019QZKK2203) and National Natural Science Foundation of China (Nos. 41971258, 42101215).
The authors declare that the research was conducted in the absence of any commercial or financial relationships that could be construed as a potential conflict of interest.
All claims expressed in this article are solely those of the authors and do not necessarily represent those of their affiliated organizations, or those of the publisher, the editors and the reviewers. Any product that may be evaluated in this article, or claim that may be made by its manufacturer, is not guaranteed or endorsed by the publisher.
We thank the editor and reviewers for their helpful comments. We are grateful to Yufang Ma, Ziyao An, Siyu Mou, and Xiaoxiao Hao for the assistance in data collection.
The Supplementary Material for this article can be found online at: https://www.frontiersin.org/articles/10.3389/fenvs.2022.941726/full#supplementary-material
Ahmad, M., Zhao, Z.-Y., and Li, H. (2019). Revealing Stylized Empirical Interactions Among Construction Sector, Urbanization, Energy Consumption, Economic Growth and CO2 Emissions in China. Sci. Total Environ. 657, 1085–1098. doi:10.1016/j.scitotenv.2018.12.112
Ahmed, A. A., and Ali, M. H. (2011). Hydrochemical Evolution and Variation of Groundwater and its Environmental Impact at Sohag, Egypt. Arabian J. Geosciences 4 (3), 339–352. doi:10.1007/s12517-009-0055-z
Anwar, B., Xiao, Z., Akter, S., and Rehman, R.-U. (2017). Sustainable Urbanization and Development Goals Strategy through Public-Private Partnerships in a South-Asian Metropolis. Sustainability 9 (11), 1940. doi:10.3390/su9111940
Bao, C., and Chen, X. (2017). Spatial Econometric Analysis on Influencing Factors of Water Consumption Efficiency in Urbanizing China. J. Geogr. Sci. 27 (12), 1450–1462. doi:10.1007/s11442-017-1446-9
Bao, C., and Fang, C.-l. (2012). Water Resources Flows Related to Urbanization in China: Challenges and Perspectives for Water Management and Urban Development. Water Resour. Manage 26 (2), 531–552. doi:10.1007/s11269-011-9930-y
Barron, O. V., Barr, A. D., and Donn, M. J. (2013). Effect of Urbanisation on the Water Balance of a Catchment with Shallow Groundwater. J. Hydrology 485, 162–176. doi:10.1016/j.jhydrol.2012.04.027
Castells-Quintana, D. (2017). Malthus Living in a Slum: Urban Concentration, Infrastructure and Economic Growth. J. Urban Econ. 98, 158–173. doi:10.1016/j.jue.2016.02.003
Chan, K. W. (2014). China's Urbanization 2020: a New Blueprint and Direction. Eurasian Geogr. Econ. 55 (1), 1–9. doi:10.1080/15387216.2014.925410
Chen, M., Gong, Y., Lu, D., and Ye, C. (2019a). Build a People-Oriented Urbanization: China's New-type Urbanization Dream and Anhui Model. Land Use Policy 80, 1–9. doi:10.1016/j.landusepol.2018.09.031
Chen, M., Liu, W., and Lu, D. (2016). Challenges and the Way Forward in China's New-type Urbanization. Land Use Policy 55, 334–339. doi:10.1016/j.landusepol.2015.07.025
Chen, M., Liu, W., and Tao, X. (2013). Evolution and Assessment on China's Urbanization 1960-2010: Under-urbanization or Over-urbanization? Habitat Int. 38, 25–33. doi:10.1016/j.habitatint.2012.09.007
Chen, M., Ye, C., Lu, D., Sui, Y., and Guo, S. (2019b). Cognition and Construction of the Theoretical Connotations of New Urbanization with Chinese Characteristics. J. Geogr. Sci. 29 (10), 1681–1698. doi:10.1007/s11442-019-1685-z
Cobbinah, P. B., Erdiaw-Kwasie, M. O., and Amoateng, P. (2015). Africa's Urbanisation: Implications for Sustainable Development. Cities 47, 62–72. doi:10.1016/j.cities.2015.03.013
Dong, F., Liu, Y., Su, H., Liang, Z., Zou, R., and Guo, H. (2016). Uncertainty-Based Multi-Objective Decision Making with Hierarchical Reliability Analysis under Water Resources and Environmental Constraints. Water Resour. Manage 30 (2), 805–822. doi:10.1007/s11269-015-1192-7
Du, H., Zhang, X., and Wang, B. (2006). Co-adaptation between Modern Oasis Urbanization and Water Resources Exploitation: A Case of Urumqi. Chin. Sci. Bull. 51 (1), 189–195. doi:10.1007/s11434-006-8225-9
Fang, C., Cui, X., Li, G., Bao, C., Wang, Z., Ma, H., et al. (2019a). Modeling Regional Sustainable Development Scenarios Using the Urbanization and Eco-Environment Coupler: Case Study of Beijing-Tianjin-Hebei Urban Agglomeration, China. Sci. Total Environ. 689, 820–830. doi:10.1016/j.scitotenv.2019.06.430
Fang, C., Liang, L., and Wang, Z. (2019b). Quantitative Simulation and Verification of Upgrade Law of Sustainable Development in Beijing-Tianjin-Hebei Urban Agglomeration. Sci. China Earth Sci. 62 (12), 2031–2049.
Fang, C., Liu, H., and Wang, S. (2021). The Coupling Curve between Urbanization and the Eco-Environment: China's Urban Agglomeration as a Case Study. Ecol. Indic. 130, 108107. doi:10.1016/j.ecolind.2021.108107
Fang, C., Ma, H., and Wang, J. (2015). A Regional Categorization for "New-type Urbanization" in China. PLOS ONE 10 (8), e0134253. doi:10.1371/journal.pone.0134253
Gu, C. (2019). Urbanization: Processes and Driving Forces. Sci. China Earth Sci. 62 (9), 1351–1360. doi:10.1007/s11430-018-9359-y
Guan, X., Wei, H., Lu, S., Dai, Q., and Su, H. (2018a). Assessment on the Urbanization Strategy in China: Achievements, Challenges and Reflections. Habitat Int. 71, 97–109.
Guan, X., Wei, H., Lu, S., and Su, H. (2018b). Mismatch Distribution of Population and Industry in China: Pattern, Problems and Driving Factors. Appl. Geogr. 97, 61–74. doi:10.1016/j.apgeog.2018.05.021
Kot, M., Castleden, H., and Gagnon, G. A. (2015). The Human Dimension of Water Safety Plans: a Critical Review of Literature and Information Gaps. Environ. Rev. 23 (1), 24–29.
Larsen, T. A., Hoffmann, S., Lüthi, C., Truffer, B., and Maurer, M. (2016). Emerging Solutions to the Water Challenges of an Urbanizing World. Science 352 (6288), 928–933. doi:10.1126/science.aad8641
Li, L., and Liu, D. (2021). Exploring the Bidirectional Relationship between Urbanization and Rural Sustainable Development in China since 2000: Panel Data Analysis of Chinese Cities. J. Urban Plann. Dev. 147 (3), 05021024. doi:10.1061/(asce)up.1943-5444.0000721
Li, M., Shi, Y., Duan, W., Chen, A., Wang, N., and Hao, J. (2019). Spatiotemporal Decoupling of Population, Economy and Construction Land Changes in Hebei Province. Sustainability 11. doi:10.3390/su11236794
Li, Y., Jia, L., Wu, W., Yan, J., and Liu, Y. (2018). Urbanization for Rural Sustainability - Rethinking China's Urbanization Strategy. J. Clean. Prod. 178, 580–586. doi:10.1016/j.jclepro.2017.12.273
Liang, L., Wang, Z., and Li, J. (2019). The Effect of Urbanization on Environmental Pollution in Rapidly Developing Urban Agglomerations. J. Clean. Prod. 237, 117649.
Liu, H., Wei, L., Chen, C., and Wang, Z. (2022). The Impact of Consumption Patterns and Urbanization on the Cross-Regional Water Footprint in China: A Decomposition Analysis. Front. Environ. Sci. 9. doi:10.3389/fenvs.2021.792423
Liu, N., Liu, C., Xia, Y., and Da, B. (2018). Examining the Coordination between Urbanization and Eco-Environment Using Coupling and Spatial Analyses: A Case Study in China. Ecol. Indic. 93, 1163–1175. doi:10.1016/j.ecolind.2018.06.013
Liu, S.-K., Lin, Z.-E., and Chiueh, P.-T. (2022). Improving Urban Sustainability and Resilience with the Optimal Arrangement of Water-Energy-Food Related Practices. Sci. Total Environ. 812, 152559. doi:10.1016/j.scitotenv.2021.152559
Lu, X.-h., and Ke, S.-g. (2018). Evaluating the Effectiveness of Sustainable Urban Land Use in China from the Perspective of Sustainable Urbanization. Habitat Int. 77, 90–98. doi:10.1016/j.habitatint.2017.10.007
Ma, T., Sun, S., Fu, G., Hall, J. W., Ni, Y., He, L., et al. (2020). Pollution Exacerbates China's Water Scarcity and its Regional Inequality. Nat. Commun. 11 (1), 650. doi:10.1038/s41467-020-14532-5
Ma, Y., Yan, J., Sha, J., He, G., Song, C., Fan, S., et al. (2018). Dynamic Simulation of the Atmospheric Environment Improved by a Focus on Clean Energy Utilization of Resource-Based Cities in China. J. Clean. Prod. 192, 396–410. doi:10.1016/j.jclepro.2018.04.247
Magri, A., and Berezowska-Azzag, E. (2019). New Tool for Assessing Urban Water Carrying Capacity (WCC) in the Planning of Development Programs in the Region of Oran, Algeria. Sustain. Cities Soc. 48, 101316. doi:10.1016/j.scs.2018.10.040
Mälzer, H.-J., Staben, N., Hein, A., and Merkel, W. (2010). Identification, Assessment, and Control of Hazards in Water Supply: Experiences from Water Safety Plan Implementations in Germany. Water Sci. Technol. 61 (5), 1307–1315. doi:10.2166/wst.2010.026
Meinzen-Dick, R., and Appasamy, P. P. (2002). Urbanization and Intersectoral Competition for Water. Woodrow Wilson International Center for Scholars Environmental Change and Security Project (ed.) Finding the Source: The Linkages Between Population and Water. Washington, DC: The Woodrow Wilson Institute, 27–51.
Mou, S., Yan, J., Sha, J., Deng, S., Gao, Z., Ke, W., et al. (2020). A Comprehensive Evaluation Model of Regional Water Resource Carrying Capacity: Model Development and a Case Study in Baoding, China. Water 12 (9), 2637.
Mou, S., Yan, J., Sha, J., Li, S., Ma, Y., He, G., et al. (2019). Dynamic Simulation of the Optimal Allocation of Water Resources via the Introduction of Integrated Water Environmental Policies in Baoding, China. Environ. Sci. Pollut. Res. 26 (26), 27516–27533. doi:10.1007/s11356-019-05537-9
Nong, D. H., Lepczyk, C. A., Miura, T., and Fox, J. M. (2018). Quantifying Urban Growth Patterns in Hanoi Using Landscape Expansion Modes and Time Series Spatial Metrics. PLOS ONE 13 (5), e0196940. doi:10.1371/journal.pone.0196940
Ouelhazi, H., Lachaal, F., Charef, A., Challouf, B., Chaieb, H., and Horriche, F. J. (2014). Hydrogeological Investigation of Groundwater Artificial Recharge by Treated Wastewater in Semi-arid Regions: Korba Aquifer (Cap-Bon Tunisia). Arab. J. Geosci. 7 (10), 4407–4421. doi:10.1007/s12517-013-1090-3
Panagopoulos, G. P. (2014). Assessing the Impacts of Socio-Economic and Hydrological Factors on Urban Water Demand: A Multivariate Statistical Approach. J. Hydrology 518, 42–48. doi:10.1016/j.jhydrol.2013.10.036
Rickert, B., van den Berg, H., Bekure, K., Girma, S., and de Roda Husman, A. M. (2019). Including Aspects of Climate Change into Water Safety Planning: Literature Review of Global Experience and Case Studies from Ethiopian Urban Supplies. Int. J. Hyg. Environ. Health 222 (5), 744–755. doi:10.1016/j.ijheh.2019.05.007
Roeger, A., and Tavares, A. F. (2018). Water Safety Plans by Utilities: A Review of Research on Implementation. Util. Policy 53, 15–24. doi:10.1016/j.jup.2018.06.001
Ruan, S., Hong, Y., and Zhuang, Y. (2021). Evolution and Restoration of Water Quality in the Process of Urban Development: a Case Study in Urban Lake, China. Environ. Monit. Assess. 193 (7), 407. doi:10.1007/s10661-021-09182-z
Schellenberg, T., Subramanian, V., Ganeshan, G., Tompkins, D., and Pradeep, R. (2020). Wastewater Discharge Standards in the Evolving Context of Urban Sustainability–The Case of India. Front. Environ. Sci. 8. doi:10.3389/fenvs.2020.00030
Schulterbrandt Gragg, R., Anandhi, A., Jiru, M., and Usher, K. M. (2018). A Conceptualization of the Urban Food-Energy-Water Nexus Sustainability Paradigm: Modeling from Theory to Practice. Front. Environ. Sci. 6. doi:10.3389/fenvs.2018.00133
Shang, J., Wang, Z., Li, L., Chen, Y., and Li, P. (2018). A Study on the Correlation between Technology Innovation and the New-type Urbanization in Shaanxi Province. Technol. Forecast. Soc. Change 135, 266–273. doi:10.1016/j.techfore.2018.04.029
Shen, L., Zhou, J., Skitmore, M., and Xia, B. (2015). Application of a Hybrid Entropy–McKinsey Matrix Method in Evaluating Sustainable Urbanization: A China Case Study. Cities 42, 186–194.
Shen, Y., Oki, T., Kanae, S., Hanasaki, N., Utsumi, N., and Kiguchi, M. (2014). Projection of Future World Water Resources under SRES Scenarios: an Integrated Assessment. Hydrological Sci. J. 59 (10), 1775–1793. doi:10.1080/02626667.2013.862338
Shojaei, M., Nazif, S., and Kerachian, R. (2015). Joint Uncertainty Analysis in River Water Quality Simulation: a Case Study of the Karoon River in Iran. Environ. Earth Sci. 73 (7), 3819–3831. doi:10.1007/s12665-014-3667-x
Song, C., Yan, J., Sha, J., He, G., Lin, X., and Ma, Y. (2018). Dynamic Modeling Application for Simulating Optimal Policies on Water Conservation in Zhangjiakou City, China. J. Clean. Prod. 201, 111–122.
Su, H., Wei, H., and Zhao, J. (2016). Density Effect and Optimum Density of the Urban Population in China. Urban Stud. 54 (7), 1760–1777. doi:10.1177/0042098015624839
Sun, Q. (2017). Empirical Research on Coordination Evaluation and Sustainable Development Mechanism of Regional Logistics and New-type Urbanization: a Panel Data Analysis from 2000 to 2015 for Liaoning Province in China. Environ. Sci. Pollut. Res. 24 (16), 14163–14175. doi:10.1007/s11356-017-8980-y
Tan, Y., Xu, H., and Zhang, X. (2016). Sustainable Urbanization in China: A Comprehensive Literature Review. Cities 55, 82–93. doi:10.1016/j.cities.2016.04.002
Tang, P., Huang, J., Zhou, H., Fang, C., Zhan, Y., and Huang, W. (2021). Local and Telecoupling Coordination Degree Model of Urbanization and the Eco-Environment Based on RS and GIS: A Case Study in the Wuhan Urban Agglomeration. Sustain. Cities Soc. 75, 103405. doi:10.1016/j.scs.2021.103405
Taylor, J. R. (2015). The China Dream Is an Urban Dream: Assessing the CPC's National New-type Urbanization Plan. J Chin Polit Sci 20 (2), 107–120. doi:10.1007/s11366-015-9341-7
Tiffen, M. (2003). Transition in Sub-saharan Africa: Agriculture, Urbanization and Income Growth. World Dev. 31 (8), 1343–1366. doi:10.1016/s0305-750x(03)00088-3
Van Leeuwen, C. J., and Sjerps, R. M. A. (2015). The City Blueprint of Amsterdam: An Assessment of Integrated Water Resources Management in the Capital of the Netherlands. Water Sci. Technol. Water Supply 15 (2), 404–410. doi:10.2166/ws.2014.127
Wang, H., Huang, J., Zhou, H., Deng, C., and Fang, C. (2020). Analysis of Sustainable Utilization of Water Resources Based on the Improved Water Resources Ecological Footprint Model: A Case Study of Hubei Province, China. J. Environ. Manag. 262, 110331. doi:10.1016/j.jenvman.2020.110331
Wang J, J., Zhou, W., Pickett, S. T. A., Yu, W., and Li, W. (2019). A Multiscale Analysis of Urbanization Effects on Ecosystem Services Supply in an Urban Megaregion. Sci. Total Environ. 662, 824–833. doi:10.1016/j.scitotenv.2019.01.260
Wang, W., Chen, Y., and Wang, W. (2020b). Groundwater Recharge in the Oasis-Desert Areas of Northern Tarim Basin, Northwest China. Hydrology Res. 51 (6), 1506–1520. doi:10.2166/nh.2020.071
Wang X, X., Zhou, Y., Zhao, Z., Wang, L., Xu, J., and Yu, J. (2019). A Novel Water Quality Mechanism Modeling and Eutrophication Risk Assessment Method of Lakes and Reservoirs. Nonlinear Dyn. 96 (2), 1037–1053. doi:10.1007/s11071-019-04837-6
Wang, X.-R., Hui, E. C.-M., Choguill, C., and Jia, S.-H. (2015). The New Urbanization Policy in China: Which Way Forward? Habitat Int. 47, 279–284. doi:10.1016/j.habitatint.2015.02.001
Wang, X., and Chen, X. (2019). An Evaluation Index System of China's Development Level of Ecological Civilization. Sustainability 11 (8), 2270. doi:10.3390/su11082270
Wang, Y., Cheng, H., and Huang, L. (2018). Water Resources Carrying Capacity Evaluation of a Dense City Group: a Comprehensive Water Resources Carrying Capacity Evaluation Model of Wuhan Urban Agglomeration. Urban Water J. 15 (7), 615–625. doi:10.1080/1573062x.2018.1529805
Wei, H., and Zhang, Y. (2017). Analysis of Impact of Urbanization on Environmental Quality in China. CHINA & WORLD Econ. 25 (2), 85–106. doi:10.1111/cwe.12195
Wu, X., Xu, C., and Pang, Q. (2017). Analysis on Driving Effect of the Urbanization Development Speed on Water Resources Conflict. Math. Problems Eng. 2017, 6810120. doi:10.1155/2017/6810120
Xia, J., Zhang, Y., Xiong, L., He, S., Wang, L., and Yu, Z. (2017). Opportunities and Challenges of the Sponge City Construction Related to Urban Water Issues in China. Sci. China Earth Sci. 60 (4), 652–658. doi:10.1007/s11430-016-0111-8
Xiao, Y., Hao, Q., Zhang, Y., Zhu, Y., Yin, S., Qin, L., et al. (2022). Investigating Sources, Driving Forces and Potential Health Risks of Nitrate and Fluoride in Groundwater of a Typical Alluvial Fan Plain. Sci. Total Environ. 802, 149909. doi:10.1016/j.scitotenv.2021.149909
Xie, H., Cheng, L., and Lu, H. (2018). Farmers' Responses to the Winter Wheat Fallow Policy in the Groundwater Funnel Area of China. Land Use Policy 73, 195–204. doi:10.1016/j.landusepol.2018.02.003
Xie, H., Cheng, L., and Lv, T. (2017). Factors Influencing Farmer Willingness to Fallow Winter Wheat and Ecological Compensation Standards in a Groundwater Funnel Area in Hengshui, Hebei Province, China. Sustainability 9 (5), 839. doi:10.3390/su9050839
Yang, W., and Jiang, X. (2018). Evaluating Sustainable Urbanization of Resource-Based Cities Based on the McKinsey Matrix: Case Study in China. J. Urban Plann. Dev. 144 (1), 05017020. doi:10.1061/(asce)up.1943-5444.0000423
Yu, B. (2021). Ecological Effects of New-type Urbanization in China. Renew. Sustain. Energy Rev. 135, 110239. doi:10.1016/j.rser.2020.110239
Zeng, L., Wang, J., Zhang, J., Lv, J., and Cui, W. (2020). New Urbanization Paths in Mineral Resource Abundant Regions in China: A Three-Dimensional Cube Framework. Resour. Policy 68, 101709. doi:10.1016/j.resourpol.2020.101709
Zhang, K., Shen, J., He, R., Fan, B., and Han, H. (2019). Dynamic Analysis of the Coupling Coordination Relationship between Urbanization and Water Resource Security and its Obstacle Factor. Ijerph 16 (23), 4765. doi:10.3390/ijerph16234765
Zhang, W., Yu, Y., Zhou, X., Yang, S., and Li, C. (2018). Evaluating Water Consumption Based on Water Hierarchy Structure for Sustainable Development Using Grey Relational Analysis: Case Study in Chongqing, China. Sustainability 10 (5), 1538. doi:10.3390/su10051538
Zhao, Y., Sheng, X., Yang, P., and Zhu, L. (2019). Evaluation of Ecological Civilization in Megacities. Appl. Ecol. Environ. Res. 17 (4), 8527–8540. doi:10.15666/aeer/1704_85278540
Keywords: water resources, new urbanization, Hebei Province, vector autoregression, dynamic relationship
Citation: Li S, Yan J, Pei Q, Sha J and Liu F (2022) Dynamic Relationship Between Water Resources and New Urbanization Based on a Vector Autoregressive Model: A Case Study of Hebei Province, China. Front. Environ. Sci. 10:941726. doi: 10.3389/fenvs.2022.941726
Received: 11 May 2022; Accepted: 06 June 2022;
Published: 24 June 2022.
Edited by:
Venkatramanan Senapathi, Alagappa University, IndiaReviewed by:
Qili Hu, Chengdu University of Technology, ChinaCopyright © 2022 Li, Yan, Pei, Sha and Liu. This is an open-access article distributed under the terms of the Creative Commons Attribution License (CC BY). The use, distribution or reproduction in other forums is permitted, provided the original author(s) and the copyright owner(s) are credited and that the original publication in this journal is cited, in accordance with accepted academic practice. No use, distribution or reproduction is permitted which does not comply with these terms.
*Correspondence: Jingjing Yan, eWFuamluZ2ppbmczMTJAaG90bWFpbC5jb20=; Qiuming Pei, cHFtQHN3anR1LmVkdS5jbg==
Disclaimer: All claims expressed in this article are solely those of the authors and do not necessarily represent those of their affiliated organizations, or those of the publisher, the editors and the reviewers. Any product that may be evaluated in this article or claim that may be made by its manufacturer is not guaranteed or endorsed by the publisher.
Research integrity at Frontiers
Learn more about the work of our research integrity team to safeguard the quality of each article we publish.