 Qingxi Zhang
 Jingfeng Ge1,3*
- 1School of Geographical Sciences, Hebei Normal University, Shijiazhuang, China
- 2Hebei Coalfield Geological Survey Institution, Xingtai, China
- 3Hebei Key Laboratory of Environmental Change and Ecological Construction, School of Geographical Sciences, Hebei Normal University, Shijiazhuang, China
- 4Xingtai No. 28 Middle School, Xingtai, China
- 5Langfang Normal University, Langfang, China
In the context of the increasingly severe global carbon emission crisis, smoothly reducing emissions without affecting economic development and the continuous improvement of people’s living standards has become an important problem facing China, the country with the largest carbon emissions in the world. From the perspective of intensive land use (ILU), this paper uses standard deviational ellipse, decoupling theory, and a logarithmic mean Divisia index (LMDI) model to analyze the level of ILU and carbon emissions in 30 provinces, municipalities, and autonomous regions in China and explores ways to reduce emissions. The results show that: 1) The level of ILU in China’s 30 provinces (municipalities and autonomous regions) has shown steady progress and the overall carbon emissions from land use have shown a slow growth trend, but the carbon emissions of some provinces have shown a downward trend; 2) The ILU and the carbon emissions standard deviational ellipse have good spatial consistency, both of which have a north by east to south by west distribution pattern. The center of the carbon emission standard deviational ellipse moves to the northwest as a whole; 3) 63.33% of provinces are in the ideal decoupling stage of ILU and carbon emissions; 4) According to their contribution value, the influencing factors of China’s carbon emissions are, in descending order, energy intensity, economic scale, population scale, land use structure, energy carbon emission intensity, and land scale. Important directions for future efforts include actively adjusting the industrial structure and economic development mode, increasing the proportion of clean energy and energy utilization rate, controlling the speed of construction and land expansion, and promoting low-carbon emissions.
1 Introduction
Since the Industrial Revolution in the 18th century, science and technology have developed by leaps and bounds, the global economic aggregate has been continuously improved, and the living standards of human beings have been rapidly improved, followed by the consumption of a large amount of fossil energy (Abram et al., 2016). The massive combustion of fossil fuels such as coal and oil has led to the rising concentration of carbon dioxide and other greenhouse gases in the atmosphere. Human beings are facing the threat of global warming, the effects of which include the rise in sea levels (Raper and Braithwaite, 2006), the deterioration of ecosystems (Cai et al., 2017), impacts on agricultural production (Chauhan et al., 2014), and the reduction of freshwater resources (Cooper and Sehlke, 2012).
Since Svante Arrhenius first proposed that carbon emissions may lead to global warming in 1898 (Anderson et al., 2016), governments around the world have taken a series of measures to deal with this problem: the establishment of the IPCC (Agrawala, 1998); the signing of a series of documents such as the Kyoto Protocol (Barrett, 1998), Copenhagen Agreement (Ramanathan and Xu, 2010) and the Paris Agreement (Dimitrov, 2016); and the establishment of a carbon emissions trading market in some countries (Jiang et al., 2014).
Related research has been conducted on carbon emissions from different perspectives in academia. In terms of research scale, it covers national (Bae Choi et al., 2013), provincial (Wang et al., 2011), municipal (Wang et al., 2020), and district and county (Lun et al., 2014). The research content includes a carbon emission accounting system (Vetőné Mózner, 2013; Sun et al., 2017; Tranberg et al., 2019), the influencing factors of carbon emissions (Wang and Yang, 2016; Lin and Benjamin, 2017; Wang et al., 2018), and the spatial-temporal pattern of carbon emissions (Gregg et al., 2009; Shi et al., 2019). Research methods mainly include the life cycle assessment method (Li et al., 2020), the carbon emission coefficient method (Kulshreshtha, 2000; Wang et al., 2017), the material balance method (Guo and Dai, 2017; Zhang et al., 2021), LMDI (Zhao et al., 2010; Fan et al., 2014), and the scenario analysis method (Jiang et al., 2018; Su and Lee, 2020). The results of the above research provide an important reference for future research on carbon emissions.
According to IPCC statistics, the carbon emissions caused by the change in land use from 1850 to 1998 are second only to the carbon emissions from fossil fuel combustion and account for approximately 1/3 of the carbon emissions from human activities. Chinese President Xi Jinping has promised that China would peak its carbon dioxide emissions by 2030 and become carbon neutral by 2060 (Yang et al., 2021). Therefore, it is crucial to increase research on land use change, one of the highest sources of carbon emissions. Researchers have conducted a series of studies on carbon emissions from land use and achieved fruitful results. R.A Houghton (Houghton and Hackler, 2006), Yu, Z. (Yu et al., 2019), A. Arneth (Arneth et al., 2017), and Leite Christiane Cavalcante (Leite et al., 2012) discussed the direct impact of land use changes on carbon emissions. L.R Hutyra (Hutyra et al., 2011) estimated the impacts of urban expansion and land cover change on terrestrial carbon stocks. Zhang Mei (Zhang et al., 2015) studied the impact of land use changes on carbon sources/sinks in China from 1980 to 2010. Zhang Pengyan (Zhang et al., 2018) analyzed China’s provincial carbon emission efficiency based on the DEA model and demonstrated that the carbon source and carbon sink generated by land use in China showed an upward trend year by year and the difference was increasing. Chen Jing (Chen, 2015) used the Taihang mountains as a case study and forecasted land-use carbon emissions in different scenes. Zhou Jingru (Zhou et al., 2017) studied the evolution characteristics of the relationship between ILU and carbon emissions in the Guanzhong Plain Urban agglomeration. Yuan Kaihua (Yuan et al., 2017) analyzed the intensive use of land in construction in China from the perspective of carbon emission efficiency. Yu Ziqi (Yu et al., 2022) used the modified gravity model to analyze the spatial correlation characteristics and spillover effects of land use carbon emissions in the Yangtze River Delta region. The results show that land use carbon emissions have clear spatial correlation and spillover effects. Ke Yuhan (Ke et al., 2022) conducted research on the changes in carbon emissions caused by land use changes in Shenzhen from 2000 to 2015. The study found that the total carbon emissions in Shenzhen showed a change of rising and then falling, and the inflection point was 2010. Zhu Linye (Zhu et al., 2022) conducted a study on the relationship between land cover changes and carbon emissions in the Shandong Province from 2000 to 2020. The study found that vegetation carbon storage was decreasing, and industrial energy consumption accounted for the largest proportion of energy production. Lin Qiaowen (Lin et al., 2021) calculated the carbon emissions of land use and the rate of carbon emissions in China from 2006 to 2016. Sun Yixuan (Sun et al., 2020) studied the relationship between intensive urban industrial land use and carbon emissions efficiency. Although many studies have been carried out on the relationship between land use changes and carbon emissions, there are still relatively few studies on the relationship between ILU and carbon emissions. In view of the important role of land use in carbon emissions, strengthening the mechanism research on the relationship between land use, especially ILU and carbon emissions, has important theoretical and practical significance for alleviating the pressure of carbon emissions and addressing climate change.
Based on land use data and socio-economic data from 2008 to 2017, this paper analyzes the spatial-temporal evolution patterns of intensive land use and carbon emissions and the influencing factors of carbon emissions by using a standard deviational ellipse, decoupling theory, and LMDI model. These can provide a reference for improving intensive land use and optimizing low-carbon land use.
2 Materials and methods
2.1 Study area
China is situated in the east of Asia and on the west coast of the Pacific Ocean. China has 34 provincial-level administrative regions (including 23 provinces, five autonomous regions, four municipalities directly under the Central Government, and two special administrative regions). Referring to previous research and division methods, this paper divides China into three regions: eastern, western, and central. The eastern region includes Beijing, Tianjin, Hebei, Shanghai, Jiangsu, Zhejiang, Fujian, Guangdong, Hainan, Shandong, and Liaoning provinces (municipalities). Shanxi, Henan, Hubei, Hunan, Anhui, Jiangxi, Jilin, and Heilongjiang provinces constitute the central region. Inner Mongolia, Guangxi Chongqing, Sichuan, Guizhou, Yunnan, Shaanxi, Gansu, Qinghai, Ningxia, and Xinjiang provinces (municipalities and autonomous regions) make up the western region. Due to lack of data, other regions of China were beyond the scope of this study (Figure 1). China is the second largest economy in the world. In 2021, the annual GDP was 114367 billion yuan, an increase of 8.1% over the previous year. The urbanization rate was 64.72%, an increase of 0.83 percentage points over the end of 2020.
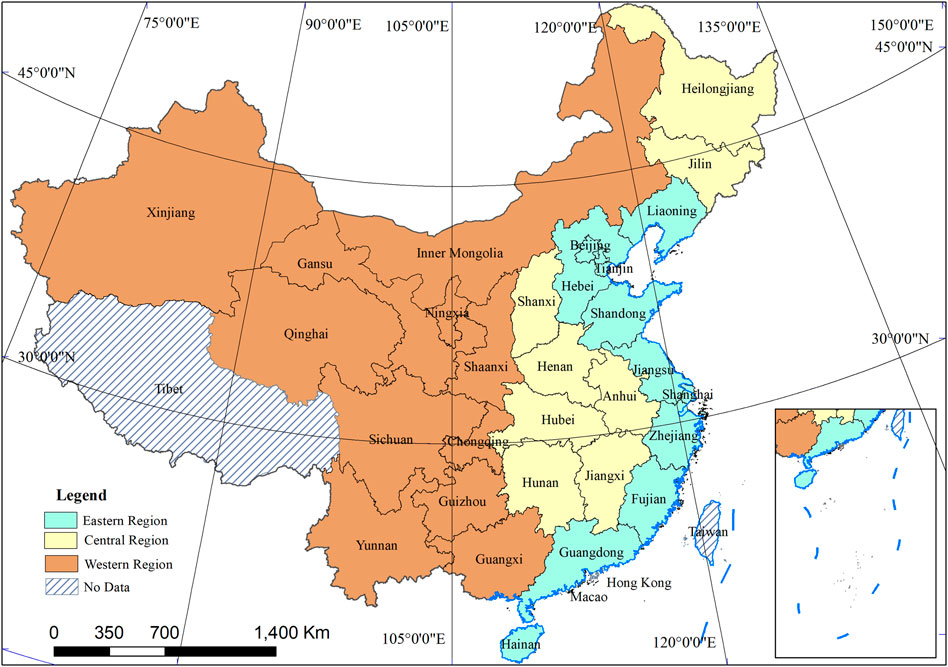
FIGURE 1. Location of the study area and regional classification.
2.2 Data
Coal, coke, gasoline, kerosene, diesel, fuel oil, natural gas, and electricity consumption data came from the “China Energy Statistical Yearbook”. The land area of each resource and the economic data were obtained from the land use status data of the corresponding years in the Statistical Yearbook of China’s Urban and Rural Construction, the Statistical Year-book of China’s Environment, the Statistical Yearbook of China’s Cities, the Statistical Yearbook of provinces (municipalities and autonomous regions), the economic bulletin, and research documents. The report from the 17th National Congress of China in 2007 proposed the “construction of ecological civilization” for the first time and referred to the prominence of the development strategy in realizing industrialization and modernization. This strategy pointed out the direction for the adjustment of China’s industrial structure and the transformation of the mode of growth and consumption in the future. From 2018 to 2021, China was conducting a third national land resource survey, and the land use structure data of each province had not been updated. In order to ensure consistency between the socio-economic data and land use data, the research period was set as 2008-2017, including four time points: 2008, 2011, 2014, and 2017.
2.3 Construction of the evaluation index system
Based on the existing research results (Qiao et al., 2017; Shao et al., 2020) and combined with the actual situation in the provinces (municipalities and autonomous regions) and the availability of data, the intensive land use evaluation system (Table 1) was constructed. It contains 13 indicators in three criteria levels, including land use degree, land input level, and land output benefit. The weight of each index is determined by the critical method combined with the coefficient of variation method.
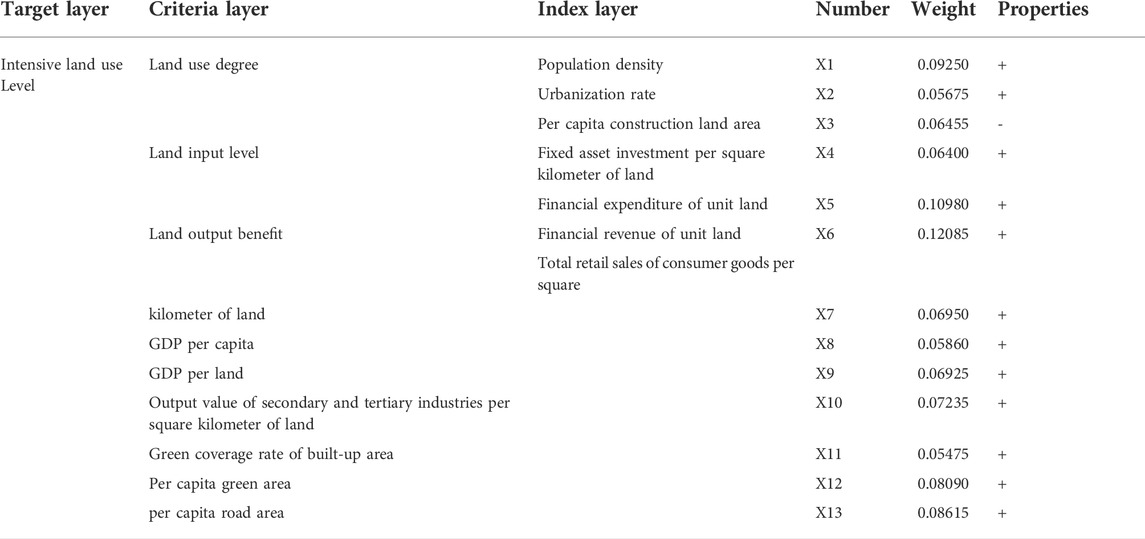
TABLE 1. Indicator system for intensive land use.
Combined with the characteristics of the indicators, the multi-factor comprehensive evaluation method was used to determine the degree of ILU. The formula is as follows:
In the formula,
Land use carbon emissions refer to carbon emissions due to land use change/land cover change. The carbon emissions discussed in this paper are net carbon emissions (carbon sources minus carbon sinks). Carbon sources are mainly construction land and cultivated land. Carbon sinks are gardens, woodlands, grasslands, and wetlands. The carbon sources/carbon sinks from cultivated land, garden land, woodland, grassland, and wetlands are calculated by a land area and carbon emissions co-efficient (Fang et al., 2007; Yu, 2013; Zhou et al., 2017; Wen, 2018) (Table 2). The carbon emissions from construction land are indirectly measured by the various types of energy consumed in each region. In this study, the energy consumption calculated includes coal, coke, gasoline, kerosene, diesel, fuel oil, natural gas, and electricity. The standard coal coefficient is taken from China Energy Statistical Yearbook (Table 3). The carbon emission coefficient is taken from 2006 IPCC guidelines for national greenhouse gas inventories.

TABLE 2. Carbon emission coefficient of different types of land use (t/hm2·y).
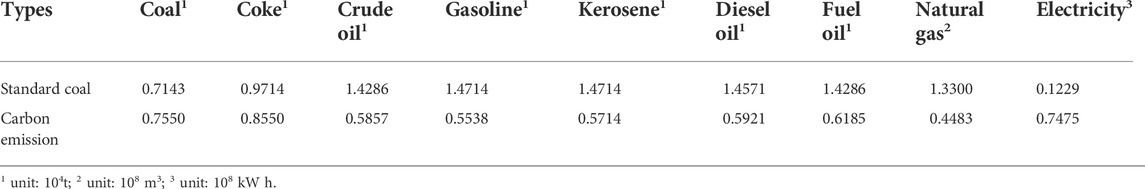
TABLE 3. Carbon emission coefficient of energy sources.
The calculation formula is as follows:
2.4 Standard deviational ellipses
Since the standard deviational ellipse was first proposed by Lefever, it has been widely used in the study of the spatial relationship of geographical elements. The size of the ellipse reflects the concentration degree of the overall elements of the spatial pattern, and the declivity angle (long axis) reflects the dominant direction of the pattern (Gong, 2002). The calculation formula is as follows:
2.5 Decoupling theory
In the above equation,
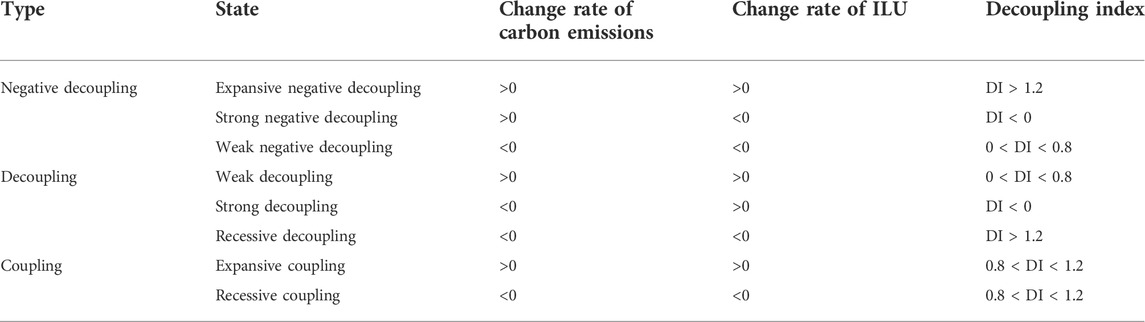
TABLE 4. Decoupling state division table.
2.6 LMDI model
According to the existing research (Jiang et al., 2017; Fu et al., 2022), the LMDI decomposition model was established by taking energy, economy, land, population, and other factors into consideration and by referring to the Kaya identity.
Here, LC represents carbon emissions from land use (10,000 tons), E represents the total consumption of standard coal (10,000 tons), G is gross domestic product (10,000 yuan), CL stands for construction land area (10,000 ha), L is the regional land area (10,000 ha), and P is the total population of the region. Furthermore,
The period-by-period effects of each influencing factor are:
The contribution rate of each influencing factor are:
3 Results
3.1 Spatial and temporal distribution characteristics of ILU and carbon emissions
The ILU of 30 provinces, including municipalities and autonomous regions, in China from 2008 to 2017 was calculated by using the multi-factor comprehensive evaluation method. As seen in Figure 2, the ILU of these 30 provinces shows a steady growth trend from 2008 to 2017. The national ILU increased from 0.21 in 2008 to 0.32 in 2017, with an average annual growth rate of 8.24%. However, there are significant differences in the level of ILU among the provinces. The spatial distribution pattern is high in the east and south, and low in the west and north.
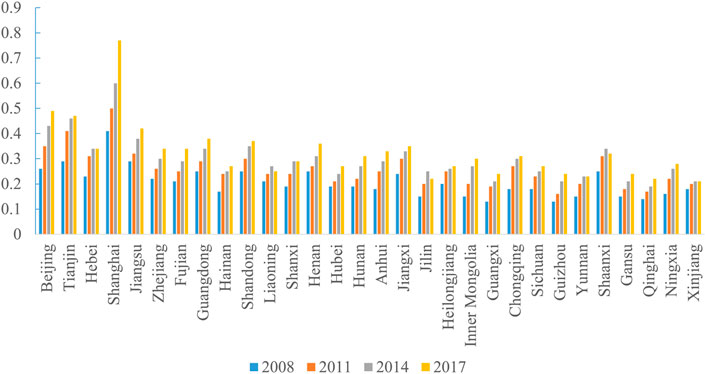
FIGURE 2. Intensive land use of China in 2008, 2011, 2014, and 2017.
Regarding the three major regions, the eastern region had the highest level of ILU, which increased from 0.25 in 2008 to 0.40 in 2017, a growth rate of 60%. Shanghai, the largest economic center in China, had the highest land use intensity, with an average value of 0.57. Tianjin, Beijing, and Jiangsu, as municipalities directly under the Central Government and economically powerful provinces in China with constant innovation in land management and utilization methods, had average values of 0.40, 0.38, and 0.35, respectively, second only to Shanghai. Hainan Province, as an important international tourist island in China with the rapid development in the tourism economy and real estate industry, had an increase in ILU from 0.17 in 2008 to 0.27 in 2017, a growth rate of 60.33%.
The central region had an average of 0.26, ranking second out of the three regions. Henan Province and Jiangxi Province are consistently in the top two in ILU in the central region. This was due to the balanced treatment of the relationship between the degree of land use, land input level, and land output benefit. Taking Jiangxi Province as an example, the values of land output benefit, land use degree, and land input level in 2017 were 0.19, 0.13, and 0.03 respectively. Only the sum of land output benefit and land use degree exceeded the mean value of ILU in central China in the same year by 0.30.
Influenced by the topography and economic development in the western region, the evaluation indicators such as the degree of land use, the level of land input, and the benefit of land output were all relatively low. From 2008 to 2017, the ILU in the western region increased from 0.16 to 0.26, with an average annual growth rate of 6.58%. In particular, Xinjiang Uygur Autonomous Region, with an area of 1.66 million square kilometers, is the largest province in China. The desert area of Xinjiang Uygur Autonomous Region is more than 1/4 of the provincial area, which determines that it has a long way to go to improve the level of ILU.
According to Eq. 2, the carbon emissions from land use in China’s provinces, municipalities, and autonomous regions from 2008 to 2017 were calculated (Figure 3). As can be seen from Figure 3, carbon emissions from land use in China showed a slow growth trend from 2008 to 2017, increasing from 286444.22 × 104t in 2008–367628.84 × 104t in 2017, with an average annual growth rate of 5.04%. In space, it presented the distribution pattern of high in the east, low in the west, high in the north, and low in the south, with significantly unbalanced regional distribution characteristics. In 2017, for example, Shandong Province had the largest carbon emissions and Qinghai Province had the smallest, with a difference of 43414.22 × 104t.
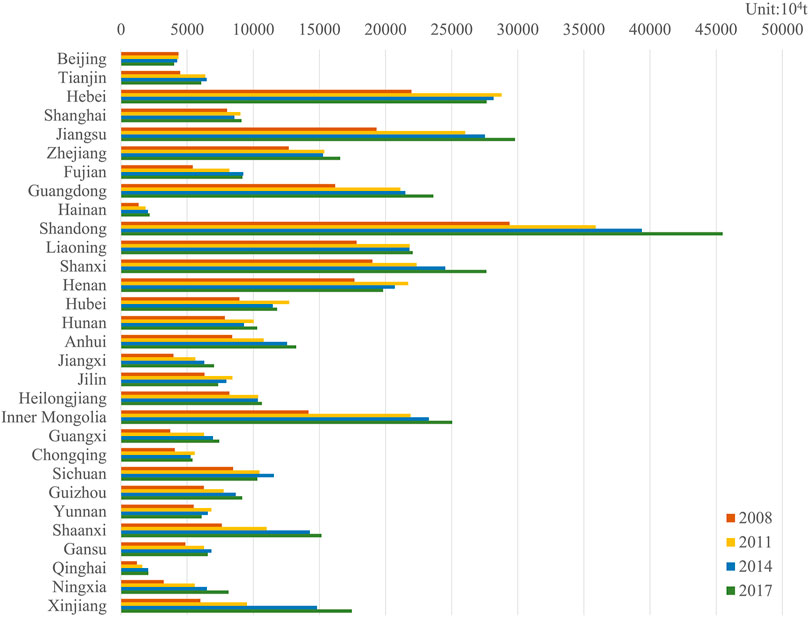
FIGURE 3. Carbon emissions of China’s provinces from 2008 to 2017.
Carbon emissions in the eastern region showed a slow growth trend, from 140952.62 × 104t in 2008–195704.28 × 104t in 2017, with an average annual growth rate of 4.31%. The growth rate of carbon emissions and the ILU both showed positive growth during the study period, and the growth rate of carbon emissions was lower than the growth rate of ILU. In the eastern region, the carbon emissions of Beijing, Tianjin, Hebei, Jilin, and Fujian showed an inverted “U-shaped " curve. Among them, Beijing’s carbon emissions had dropped the most. Under the influence of the “Green Olympics” and “policies which moved all steel-related systems out of Beijing,” high energy consumption enterprises had been transferred, and carbon emissions had dropped from 4,346.14×104t in 2008–4,022.19×104t in 2017, a decrease of 7.45%.
The carbon emissions in the central region in 2017 were 107,790.50 × 104t, an increase of 34.18% compared with 2008. Among them, Henan Province and Jilin Province showed an inverted “U" curve in carbon emissions during the study period due to energy structure optimization and energy efficiency improvement. In Henan Province, for example, total energy consumption increased from 186 million tons of standard coal in 2010 to 238 million tons of standard coal in 2016, with an average annual growth rate of 1.8%, 7.8 percentage points lower than the growth rate during the 11th Five-Year Plan period. From 2010 to 2016, energy consumption per 10,000 yuan of GDP in Henan decreased from 0.81 tons of standard coal per 10,000 yuan to 0.6 tons of standard coal per 10,000 yuan, an average annual decline of 5.4%. Shanxi Province, an important coal province in China, had the largest and most obvious increase in carbon emissions. From 2008 to 2017, carbon emissions increased from 19002.71 × 104t to 27623.24 × 104t, with an increase of 45.36%.
The carbon emissions in the western region increased the most of the three regions, from 65,157.2 × 104t in 2008 to 106,745.73 × 104t in 2017, a growth rate of 73.16%. During the study period, carbon emissions in western China increased significantly, mainly because most of these provinces and autonomous regions were in the process of rapid economic growth or industrial structure transfer. Furthermore, the industrial structure was dominated by high energy consumption and heavy or chemical industry. Take the Inner Mongolia Autonomous Region as an example. It is an important coal-producing province in China. In 2017, the region produced 878 million tons of coal, accounting for 25.45% of the national coal production. In addition, in the national industrial structure layout, it has undertaken a number of high energy consumption and high emission projects such as coal power, coal chemical industry, steel, and electrolytic aluminum. This has formed an economic development mode of " relying on energy and heavy industries " and an industrial structure dominated by energy and heavy/chemical industries, which objectively leads to the rigid growth of carbon emissions.
From 2008 to 2017, the standard deviational ellipse of ILU and carbon emissions showed a north by east to south by west distribution pattern as a whole, reflecting a good spatial consistency between the two systems (Figure 4). From 2008 to 2017, the ratio of the ILU axis increased from 1.19 to 1.22 and then decreased to 1.20 (Table 5), indicating that it had expanded from north by east to south by west and then gradually changed to north by west to south by east. The azimuth angle had continuously rotated counterclockwise from 2008 to 2017, indicating that with the effective implementation of China’s Western Development Campaign, the economy of the western region had developed rapidly and the level of ILU had gradually improved.
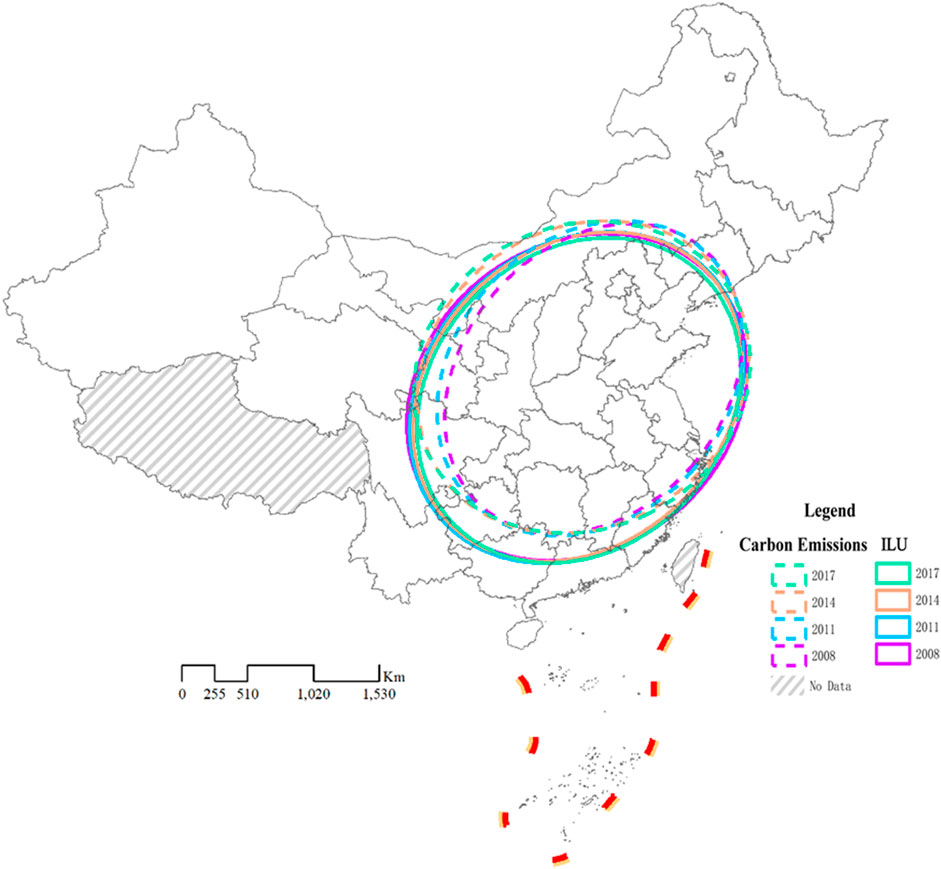
FIGURE 4. Elliptic distribution of the standard deviation of ILU and carbon emissions.
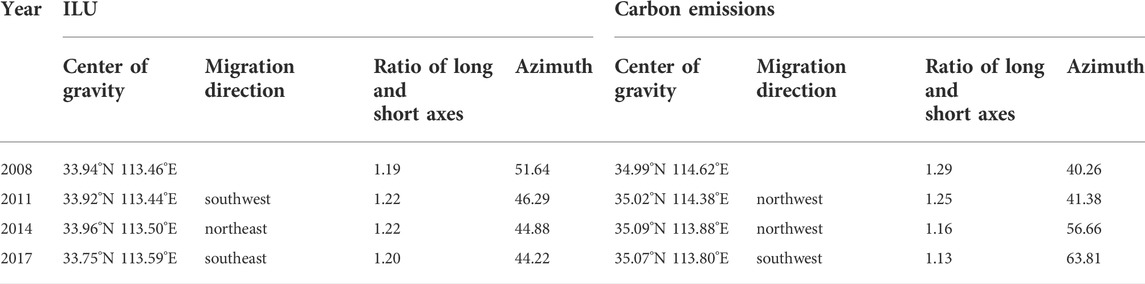
TABLE 5. Changes of ellipse parameters of standard deviation of ILU and carbon emissions.
From 2008 to 2017, the ratio of long axis to short axis of carbon emissions decreased from 1.29 to 1.13, and the center of gravity moved to the northwest as a whole (from 34.99°N, 114.62°E to 35.07°N, 113.80°E), indicating that the north by west to south by east movement of the ellipse shows an expansion trend. This was due to the rapid economic development of the northwestern provinces at the same time as the continuous expansion of construction land, and the increase in energy consumption, followed by the rapid growth of carbon emissions.
3.2 Decoupling analysis of ILU and carbon emissions
Based on the characteristics of the decoupling theory, this paper divides the study time period into three stages: T1 (2008-2011), T2 (2011-2014), and T3 (2014-2017). The decoupling indices were calculated for each province in the three periods according to the ILU and carbon emissions (Table 6).
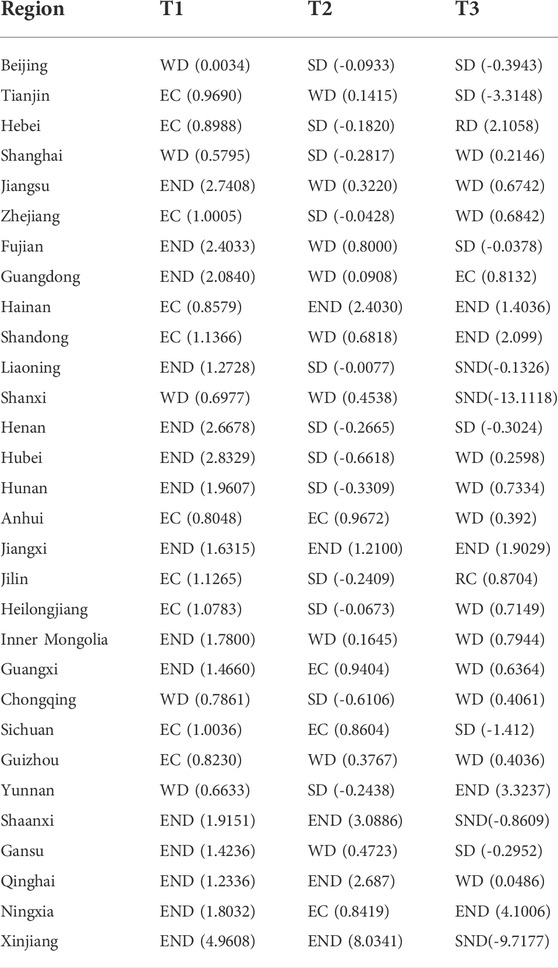
TABLE 6. State of decoupling between ILU and carbon emissions.
It can be seen from Table 6 that the decoupling state between ILU and carbon emissions shows different development trends in each time period. From 2008 to 2011, the decoupling state between ILU and carbon emissions of Beijing and Shanghai in the eastern region, Shanxi Province in the central region, Chongqing and Yunnan province in the western region was weak decoupling, indicating that ILU and carbon emissions in these five provinces (municipalities directly under the Central Government) were increasing at the same time, but the growth rate of carbon emissions was lower than that of ILU. In the eastern, central, and western regions, the proportion of provinces, autonomous regions, and municipalities in the state of expansive coupling were 45.1%, 37.5%, and 19.1%, respectively. This indicated that ILU was increasing steadily in these regions, and carbon emissions were also increasing, but that the growth rate of carbon emission was synchronous or slightly higher than that of ILU. Provinces, autonomous regions, and municipalities in the state of expansive negative decoupling accounted for 50% of the study area, indicating that the growth rate of carbon emissions of most provinces was much higher than that of the ILU. From 2011 to 2014, the decoupling of ILU and carbon emissions had improved significantly, with 91%, 75%, and 45.3% of the provinces in the eastern, central, and western regions experiencing a form of decoupling, either strong or weak, respectively. Provinces in a state of expansive coupling accounted for 13.33% of the total number of provinces in the study area, a decrease of 20% over the previous stage. Hainan Province in the eastern region; Jiangxi Province in the central region; and Shaanxi Province, Qinghai Province, and Xinjiang Uygur Autonomous Region in the western region were in a state of expansive negative decoupling. From 2014 to 2017, 16.67% of the provinces in China were in a state of expansive negative decoupling, and 13.33% were in a state of strong negative decoupling, indicating that the ILU of these provinces decreased and carbon emissions increased. About 63.33% of the provinces, municipalities, and autonomous regions were in a state of decoupling (strong decoupling, weak decoupling, or recessive decoupling). In addition, the provinces linked to expansive coupling and recessive coupling accounted for 3% respectively, indicating that the decoupling state of the provinces had not reached a stable state, but the overall trend was gradually improving.
3.3 Analysis of influencing factors of carbon emissions
3.3.1 Analysis of the influencing factors from the national perspective
In order to effectively mitigate the carbon emissions pressure caused by land use, the LMDI model was introduced to explore the influencing factors of carbon emissions in 30 provinces, municipalities, and autonomous regions in China. According to Eq. 11–20, the influences on land use carbon emissions are, in descending order: energy intensity (EI), economic scale (ES), population scale (PS), land use structure (LUS), energy carbon emission intensity (ECEI), and land scale (LS) (Table 7).
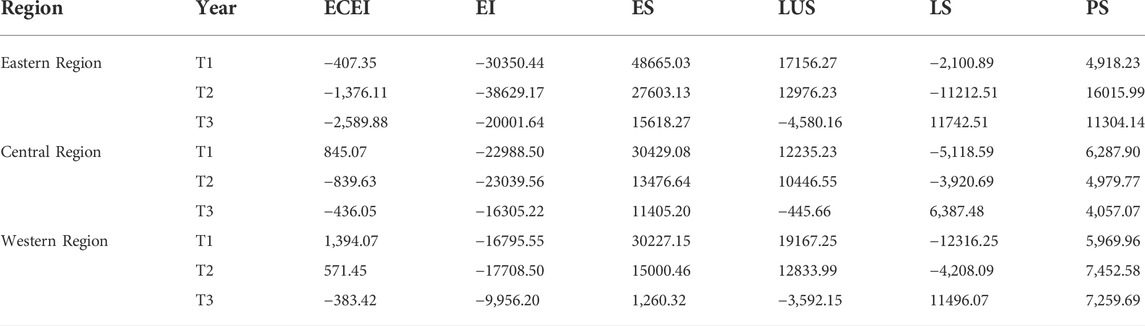
TABLE 7. Decomposition results of influencing factors of carbon emission from land use (unit:104t).
EI was the first positive factor in the reduction of land use carbon emissions, and the absolute value of the cumulative contribution rate was 677.10%. From 2008 to 2017, energy intensity contributed to the reduction of 1,957.749 million tons of carbon emissions, becoming a key factor in slowing the growth of carbon emissions. This is mainly due to the adjustment of China’s energy strategy during the “11th Five-Year Plan”, “12th Five-Year Plan” and “13th Five-Year Plan” periods. The outline of the Chinese government’s " 11th Five-Year Plan " proposed that the energy consumption per unit of GDP should be 20% lower than in 2005. After the 18th CPC National Congress, with the continuous application of new technologies for energy conservation and emission reduction, the proportion of coal in primary energy has continued to decline. Furthermore the proportion of clean energy power generation has increased significantly, the energy structure has been continuously improved, and the energy consumption per unit GDP has been continuously reduced. Therefore, optimizing energy structure, improving energy efficiency, and developing low-carbon industries are important means to reduce carbon emissions.
As shown in Table 7, from 2008 to 2017, ES was the leading factor in the increase of carbon emissions from land use in China, with a cumulative increase of 1,936.853 million tons and a cumulative contribution rate of 527.12%. As the largest developing country in the world, China’s main task is to actively develop its economy and improve people’s living standards. The current extensive development model will inevitably lead to a continuous increase in carbon emissions. However, after 2012, with the transformation of the economic development mode required by the 18th National Congress and the deepening of innovation-driven development strategy, the driving effect of economic scale on carbon emission growth has gradually weakened. At the same time, the gradual maturity of the carbon emissions trading market will accelerate the formation of green and low-carbon economic development modes in China, and the driving effect of ES on the increase in carbon emissions will be further weakened.
PS was the third factor in increasing land use carbon emissions, with a cumulative contribution rate of 260.70%. As the country with the largest population in the world, China has a large population base. With the acceleration of the urbanization process and the continuous expansion of the urban scale, the pressure on housing, transportation, and infrastructure increases, which is accompanied by a large amount of energy consumption. From 2008 to 2017, the PS factor led to a cumulative increase in carbon emissions of 682.453 million tons. With the continuous enhancement of people’s low-carbon awareness and the continuous change of lifestyle and consumption habits, the contribution of the PS factor to the positive driving effect of the increase of carbon emissions is gradually weakening, especially after 2014.
The cumulative contribution rate of the fourth influencing factor, LUS, leading to increased carbon emissions, was 194.46%. Due to the continuous growth of the population and the continuous expansion of the construction land area, the pressure on energy consumption had increased, resulting in a cumulative increase of 761.976 million tons of carbon emissions. With the enhancement of local governments’ awareness of environmental protection and the continuous optimization of land use structures, the factors of LUS played a positive driving role in reducing carbon emissions for the first time in 2014–2017, with a reduction of 86.1797 million.
The positive and negative effects of ECEI on land use carbon emissions in different years were obvious and overall had an inhibitory effect. During the study period, it promoted a total reduction of 32.2185 million tons of carbon emissions, with an absolute cumulative contribution rate of 21.28%. From 2008 to 2017, the factors of ECEI showed a positive effect on the reduction of carbon emissions in the eastern region. At first, ECEI showed a negative effect and then a positive effect in the central and western regions, which was consistent with the change in China’s energy consumption composition. In 2007, the “philosophy of ecological civilization” was first put forward in the report of the 17th National Congress of the Communist Party of China. The eastern region was the first to adjust its energy structures and reduce the proportion of coal in energy consumption. After the 18th National Congress of the Communist Party of China in 2012, China began to reduce overcapacity in the coal sector and optimize the energy consumption structures. This was consistent with the fact that ECEI had an inhibitory effect on carbon emissions in eastern and western China. Although ECEI has an inhibitory effect on carbon emissions, its contribution rate was relatively low, indicating that increasing research on energy utilization technology, reducing the carbon emission coefficient, optimizing energy consumption structure, and increasing the proportion of clean energy consumption such as shale gas and coalbed methane are important ways to promote carbon emissions reduction.
The overall impact of the LS factor on carbon emissions was a negative driving factor. During the study period, the LS factor contributed a total of 92.510 million tons to carbon emissions reduction, with a cumulative contribution rate of 16.10%. From 2008 to 2014, the impact of LS on carbon emissions in China was through carbon sinks, which contributed to a reduction of 388.770 million tons in carbon emissions. Between 2014 and 2017 LS was a carbon source. This was mainly caused by the significant increase in carbon emissions intensity from construction land during this period. With the accelerating process of urbanization, a large amount of forest land, garden land, and other carbon sink land have been transformed into construction land, a carbon source. Therefore, reasonably controlling the expansion speed and scale of construction land and optimizing land use structure are important ways to achieve China’s carbon emissions reduction goal as soon as possible.
3.3.2 Analysis of the influencing factors from the region perspective
The factors contributing to carbon emission in eastern China, in descending order, were ES, PS, and LUS. Over the past 10 years, ES produced 918.864 million tons of cumulative carbon emissions. The cumulative carbon emissions of the PS factor were 322.384 million tons. LUS played a role in promoting regional carbon emissions from T1 to T2, with cumulative carbon emissions of 301.325 million tons. LUS in the T3 period reduced carbon emissions by 45.802 million tons in 3 years. EI was the main inhibiting factor of carbon emissions and contributed to the cumulative reduction of 889.813 million tons in carbon emissions, accounting for 59.45% of the total increase in carbon emissions. ECEI and LS played a role in promoting carbon emission reduction to varying degrees in the eastern region.
The ES factor in the central region was the leading factor in the increase in carbon emissions, with a cumulative increase of 553.1092 million tons. The second was LUS, with a cumulative increase of 222.361 million tons, accounting for approximately 40.20% of the carbon emissions added by the ES. The population size factor had cumulatively increased carbon emissions by 153.247 million tons. The EI was a key contributing factor in the reduction of carbon emissions, which exceeded the increase in carbon emissions caused by economies of scale. ECEI and LS cumulatively reduced carbon emissions by 30.824 million tons.
The ES, PS, and LUS were the three leading factors that contributed to the increase in carbon emissions in the western region. EI was the primary factor that reduced carbon emissions in the western region. From T1 to T3, the carbon emissions reduction promoted by EI accounted for about 95.64% of the carbon emissions generated by ES. ECEI mainly promoted the increase of carbon emissions during T1-T2 but became the driving factor in the reduction of carbon emissions in T3. LS had both contributing and inhibiting effects on carbon emissions in the western region. Its overall performance was to inhibit the increase of carbon emissions by a total of 50.283 million tons.
4 Discussion
The relationship between land use change and global warming has been one of the hot issues in academic research in the past 20 years. As an important means of optimizing land resources and improving the ecological environment, the relationship between intensive land use and carbon emissions from land use is one of the important issues that need to be studied urgently. This paper selected 30 provinces, municipalities, and autonomous regions in China and uses the standard deviational ellipse and decoupling theory to quantitatively and qualitatively analyze the temporal and spatial evolution law and decoupling relationship of intensive land use and carbon emissions. This can intuitively reflect the situation of intensive land use and carbon emissions from land use. At the same time, the LMDI model is used to quantitatively analyze the influencing factors of carbon emissions from land use. This paper can provide new ideas for low-carbon and efficient land use in China. Furthermore, it can provide some reference for research in other regions and thus has positive research significance.
There are great differences in the degree of intensive land use and carbon emissions among the 30 provinces, municipalities, and autonomous regions in the study area. Although they are representative, there are inevitably some restrictions. In the construction of the intensive land use index system, we mainly refer to the previous relevant research indicators, which are objective. However, considering the integrity and differences of the provinces, municipalities, and autonomous regions, we should take more scientific methods to construct the index system in future research to more comprehensively reflect the provincial level of intensive land utilization.
Using the standard deviational ellipse method and decoupling theory, the spatial and temporal distribution and interrelationship of land intensive use and carbon emissions are quantitatively analyzed, but the evolution law between them still needs to be further explored. Using the LMDI method to analyze the influencing factors of land use carbon emission, and whether there is a more suitable analysis method for more in-depth quantitative research in the future, are worth further discussion.
5 Conclusion
1) Intensive land use in 30 provinces, municipalities, and autonomous regions in China showed steady progress, and there are great differences among them. The spatial distribution pattern of intensive land use was high in the east and south, and low in the west and the north. The overall carbon emissions from land use showed a slow growth trend, showing a spatial distribution pattern of high in the east and north, and low in the west and the south, with significant unbalanced regional distribution characteristics, but the carbon emissions of some provinces showed a downward trend.
2) The intensive land use and the carbon emissions standard deviational ellipse had good spatial consistency, both of which are north by east to south by west distribution patterns. The center of gravity of carbon emissions standard deviational ellipse moved to the northwest, and carbon emissions in northwest provinces showed a rapid growth trend.
3) The decoupling state of intensive land use and carbon emissions was different in each time period. Of the provinces, 63.33% were in the ideal decoupling stage, and the overall trend was stable and positive.
4) According to the contribution value of the influencing factors in China’s carbon emissions are, in descending order: energy intensity, economic scale, population scale, land use structure, energy carbon emissions intensity, and land scale. Actively adjusting the industrial structure and economic development mode, increasing the proportion of clean energy and energy utilization, controlling the speed of construction land expansion, and increasing the promotion of low-carbon emissions should be important directions for future efforts.
Data availability statement
The raw data supporting the conclusion of this article will be made available by the authors, without undue reservation.
Author contributions
QZ and JG conceived and designed this research. JG provided financial support for the project and supervised the project team and their progress. QZ completed the original draft, and YL, MZ, LD, and JZ optimized the ideas, data collection, and analysis. All authors have carefully revised this article and approved the final draft.
Funding
This research was funded by the China Natural Science Foundation (Fund No:41471090) and the Graduate Innovation Grant Program of Hebei Province (Grant No. CXZZBS2020081).
Acknowledgments
The authors are very grateful to the reviewers and editors for their constructive comments on this article. Gratitude is expressed to the caring teachers and loving family members.
Conflict of interest
The authors declare that the research was conducted in the absence of any commercial or financial relationships that could be construed as a potential conflict of interest.
Publisher’s note
All claims expressed in this article are solely those of the authors and do not necessarily represent those of their affiliated organizations, or those of the publisher, the editors and the reviewers. Any product that may be evaluated in this article, or claim that may be made by its manufacturer, is not guaranteed or endorsed by the publisher.
References
Abram, N. J., McGregor, H. V., Tierney, J. E., Evans, M. N., McKay, N. P., Kaufman, D. S., et al. (2016). Early onset of industrial-era warming across the oceans and continents. Nature 536 (7617), 411–418. doi:10.1038/nature19082
Agrawala, S. (1998). Structural and process history of the intergovernmental panel on climate change. Clim. Change 39 (4), 621–642. doi:10.1023/A:1005312331477
Anderson, T. R., Hawkins, E., and Jones, P. D. (2016). CO2, the greenhouse effect and global warming: From the pioneering work of Arrhenius and callendar to today's earth system models. Endeavour 40 (3), 178–187. doi:10.1016/j.endeavour.2016.07.002
Arneth, A., Sitch, S., Pongratz, J., Stocker, B. D., Ciais, P., Poulter, B., et al. (2017). Historical carbon dioxide emissions caused by land-use changes are possibly larger than assumed. Nat. Geosci. 10 (2), 79–84. doi:10.1038/ngeo2882
Bae Choi, B., Lee, D., and Psaros, J. (2013). An analysis of Australian company carbon emission disclosures. Pac. Account. Rev. 25 (1), 58–79. doi:10.1108/01140581311318968
Barrett, S. (1998). Political economy of the Kyoto Protocol. Oxf. Rev. Econ. Policy 14 (4), 20–39. doi:10.1093/oxrep/14.4.20
Cai, W., Li, K., Liao, H., Wang, H., and Wu, L. (2017). Weather conditions conducive to Beijing severe haze more frequent under climate change. Nat. Clim. Chang. 7 (4), 257–262. doi:10.1038/nclimate3249
Chauhan, B. S., Prabhjyot, K., Mahajan, G., Randhawa, R. K., Singh, H., and Kang, M. S. (2014). Global warming and its possible impact on agriculture in India. Adv. Agron. 123, 65–121. doi:10.1016/B978-0-12-420225-2.00002-9
Chen, J. (2015). Evolution and foreast of carbon emissions of land use changes in Taihang Mountain in Shijiazhuang west. Beijing: China University of Geosciences. Doctoral Thesis.
Cooper, D. C., and Sehlke, G. (2012). Sustainability and energy development: Influences of greenhouse gas emission reduction options on water use in energy production. Environ. Sci. Technol. 46 (6), 3509–3518. doi:10.1021/es201901p
Dimitrov, R. S. (2016). The Paris agreement on climate change: Behind closed doors. Glob. Environ. Polit. 16 (3), 1–11. doi:10.1162/GLEP_a_00361
Fan, T., Luo, R., Xia, H., and Li, X. (2014). Using LMDI method to analyze the influencing factors of carbon emissions in China’s petrochemical industries. Nat. Hazards (Dordr). 75 (S2), 319–332. doi:10.1007/s11069-014-1226-0
Fang, J., Guo, Z., Piao, S., and Chen, A. (2007). Terrestrial vegetation carbon sinks in China, 1981–2000. Sci. China Ser. D Earth Sci. 50 (9), 1341–1350. doi:10.1007/s11430-007-0049-1
Fu, C., Min, W., and Liu, H. (2022). Decomposition and decoupling analysis of carbon emissions from cultivated land use in China’s main agricultural producing areas. Sustainability 14 (9), 5145. doi:10.3390/su14095145
Gong, J. X. (2002). Clarifying the standard deviational ellipse. Geogr. Anal. 34 (2), 155–167. doi:10.1111/j.1538-4632.2002.tb01082.x
Gregg, J. S., Losey, L. M., Andres, R. J., Blasing, T. J., and Marland, G. (2009). The temporal and spatial distribution of carbon dioxide emissions from fossil-fuel use in north America. J. Appl. Meteorol. Climatol. 48 (12), 2528–2542. doi:10.1175/2009jamc2115.1
Guo, Q., and Dai, X. (2017). Analysis on carbon dioxide emission reduction during the anaerobic synergetic digestion technology of sludge and kitchen waste: Taking kitchen waste synergetic digestion project in Zhenjiang as an example. Waste Manag. 69, 360–364. doi:10.1016/j.wasman.2017.08.033
Houghton, R. A., and Hackler, J. L. (2006). Emissions of carbon from land use change in sub-Saharan Africa. J. Geophys. Res. 111 (G2), n/a. doi:10.1029/2005jg000076
Hutyra, L. R., Yoon, B., Hepinstall-Cymerman, J., and Alberti, M. (2011). Carbon consequences of land cover change and expansion of urban lands: A case study in the seattle metropolitan region. Landsc. Urban Plan. 103 (1), 83–93. doi:10.1016/j.landurbplan.2011.06.004
Jiang, J. J., Ye, B., and Ma, X. M. (2014). The construction of Shenzhen׳s carbon emission trading scheme. Energy Policy 75, 17–21. doi:10.1016/j.enpol.2014.02.030
Jiang, J., Ye, B., Xie, D., and Tang, J. (2017). Provincial-level carbon emission drivers and emission reduction strategies in China: Combining multi-layer LMDI decomposition with hierarchical clustering. J. Clean. Prod. 169, 178–190. doi:10.1016/j.jclepro.2017.03.189
Jiang, K., He, C., Dai, H., Liu, J., and Xu, X. (2018). Emission scenario analysis for China under the global 1.5 °C target. Carbon Manag. 9 (5), 481–491. doi:10.1080/17583004.2018.1477835
Ke, Y., Xia, L., Huang, Y., Li, S., Yang, Z., Liang, S., et al. (2022). The carbon emissions related to the land-use changes from 2000 to 2015 in Shenzhen, China: Implication for exploring low-carbon development in megacities. J. Environ. Manag. 319, 115660. doi:10.1016/j.jenvman.2022.115660
Kulshreshtha, B. N. M. (2000). Carbon emission intensity of power consumption in India: A detailed study of its indicators. Energy sources. 22 (2), 157–166. doi:10.1080/00908310050014135
Leite, C. C., Costa, M. H., Soares-Filho, B. S., and de Barros Viana Hissa, L. (2012). Historical land use change and associated carbon emissions in Brazil from 1940 to 1995. Glob. Biogeochem. Cycles 26 (2), n/a. doi:10.1029/2011gb004133
Li, J., Li, S., and Wu, F. (2020). Research on carbon emission reduction benefit of wind power project based on life cycle assessment theory. Renew. Energy 155, 456–468. doi:10.1016/j.renene.2020.03.133
Lin, B., and Benjamin, N. I. (2017). Influencing factors on carbon emissions in China transport industry. A new evidence from quantile regression analysis. J. Clean. Prod. 150, 175–187. doi:10.1016/j.jclepro.2017.02.171
Lin, Q., Zhang, L., Qiu, B., Zhao, Y., and Wei, C. (2021). Spatiotemporal analysis of land use patterns on carbon emissions in China. Land 10 (2), 141. doi:10.3390/land10020141
Lun, F., Canadell, J. G., Xu, Z.-q., He, L., Yuan, Z., Zhang, D., et al. (2014). Residential energy consumption and associated carbon emission in forest rural area in China: A case study in weichang county. J. Mt. Sci. 11 (3), 792–804. doi:10.1007/s11629-013-2884-1
Qiao, W., Gao, J., Liu, Y., Qin, Y., Lu, C., and Ji, Q. (2017). Evaluation of intensive urban land use based on an artificial neural network model: A case study of nanjing city, China. Chin. Geogr. Sci. 27 (5), 735–746. doi:10.1007/s11769-017-0905-7
Ramanathan, V., and Xu, Y. (2010). The copenhagen accord for limiting global warming: Criteria, constraints, and available avenues. Proc. Natl. Acad. Sci. U. S. A. 107 (18), 8055–8062. doi:10.1073/pnas.1002293107
Raper, S. C., and Braithwaite, R. J. (2006). Low sea level rise projections from mountain glaciers and icecaps under global warming. Nature 439 (7074), 311–313. doi:10.1038/nature04448
Shao, J., Ge, J., Feng, X., and Zhao, C. (2020). Study on the relationship between PM2.5 concentration and intensive land use in Hebei Province based on a spatial regression model. PLoS One 15 (9), e0238547. doi:10.1371/journal.pone.0238547
Shi, Y., Han, B., Han, L., and Wei, Z. (2019). Uncovering the national and regional household carbon emissions in China using temporal and spatial decomposition analysis models. J. Clean. Prod. 232, 966–979. doi:10.1016/j.jclepro.2019.05.302
Song, Y., Zhang, M., and Zhou, M. (2019). Study on the decoupling relationship between CO2 emissions and economic development based on two-dimensional decoupling theory: A case between China and the United States. Ecol. Indic. 102, 230–236. doi:10.1016/j.ecolind.2019.02.044
Su, K., and Lee, C.-M. (2020). When will China achieve its carbon emission peak? A scenario analysis based on optimal control and the stirpat model. Ecol. Indic. 112, 106138. doi:10.1016/j.ecolind.2020.106138
Sun, Y., Cheng, Y., and Zhang, H. (2020). Study on the impact of intensive use of urban industrial land on carbon emission efficiency in China’s 15 sub-provincial Cities. Resources Environ. Yangtze Basin 29 (8), 1703–1712. doi:10.11870/cjlyzyyhj202008003
Sun, Y., Kang, C., Xia, Q., Chen, Q., Zhang, N., and Cheng, Y. (2017). Analysis of transmission expansion planning considering consumption-based carbon emission accounting. Appl. Energy 193, 232–242. doi:10.1016/j.apenergy.2017.02.035
Tranberg, B., Corradi, O., Lajoie, B., Gibon, T., Staffell, I., and Andresen, G. B. (2019). Real-time carbon accounting method for the European electricity markets. Energy Strategy Rev. 26, 100367. doi:10.1016/j.esr.2019.100367
Vetőné Mózner, Z. (2013). A consumption-based approach to carbon emission accounting – sectoral differences and environmental benefits. J. Clean. Prod. 42, 83–95. doi:10.1016/j.jclepro.2012.10.014
Wang, G., Han, Q., and de Vries, B. (2020). A geographic carbon emission estimating framework on the city scale. J. Clean. Prod. 244, 118793. doi:10.1016/j.jclepro.2019.118793
Wang, R., Liu, W., Xiao, L., Liu, J., and Kao, W. (2011). Path towards achieving of China's 2020 carbon emission reduction target—a discussion of low-carbon energy policies at province level. Energy Policy 39 (5), 2740–2747. doi:10.1016/j.enpol.2011.02.043
Wang, Y., Xie, T., and Yang, S. (2017). Carbon emission and its decoupling research of transportation in Jiangsu Province. J. Clean. Prod. 142, 907–914. doi:10.1016/j.jclepro.2016.09.052
Wang, Y., Zhou, Y., Zhu, L., Zhang, F., and Zhang, Y. (2018). Influencing factors and decoupling elasticity of China’s transportation carbon emissions. Energies 11 (5), 1157. doi:10.3390/en11051157
Wang, Z., and Yang, Y. (2016). Features and influencing factors of carbon emissions indicators in the perspective of residential consumption: Evidence from Beijing, China. Ecol. Indic. 61, 634–645. doi:10.1016/j.ecolind.2015.10.015
Wen, H. S. (2018). Study on the evolution and trand of carbon emission from different land use types - a case study of Chongqing. Chengdu: Sichuan Normal University. Master Thesis.
Yang, C., Hao, Y., and Irfan, M. (2021). Energy consumption structural adjustment and carbon neutrality in the post-COVID-19 era. Struct. Chang. Econ. Dyn. 59, 442–453. doi:10.1016/j.strueco.2021.06.017
Yu, X. Z. (2013). The research on carbon emission effects of land use in Wuhan City. Wuhan: Huazhong Agricultural University. Master Thesis.
Yu, Z., Chen, l., Tong, H., Chen, l., Zhang, T., Li, L., et al. (2022). Spatial correlations of land-use carbon emissions in the Yangtze River Delta region: A perspective from social network analysis. Ecol. Indic. 142, 109147. doi:10.1016/j.ecolind.2022.109147
Yu, Z., Lu, C., Tian, H., and Canadell, J. G. (2019). Largely underestimated carbon emission from land use and land cover change in the conterminous United States. Glob. Chang. Biol. 25 (11), 3741–3752. doi:10.1111/gcb.14768
Yuan, K., Mei, Y., Chen, Y., and Lan, M. (2017). Temporal and spatial evolution and influencing mechanism of construction land intensive utilization on carbon emissions efficiency in China. Resour. Sci. 39 (10), 1882–1895. doi:10.18402/resci.2017.10.08
Zhang, H., Jin, G., and Zhang, Z. (2021). Coupling system of carbon emission and social economy: A review. Technol. Forecast. Soc. Change 167, 120730. doi:10.1016/j.techfore.2021.120730
Zhang, M., Huang, X., Chuai, X., Yang, H., Lai, L., and Tan, J. (2015). Impact of land use type conversion on carbon storage in terrestrial ecosystems of China: A spatial-temporal perspective. Sci. Rep. 5, 10233. doi:10.1038/srep10233
Zhang, P., He, J., Hong, X., Zhang, W., Qin, C., Pang, B., et al. (2018). Carbon sources/sinks analysis of land use changes in China based on data envelopment analysis. J. Clean. Prod. 204, 702–711. doi:10.1016/j.jclepro.2018.08.341
Zhao, M., Tan, L., Zhang, W., Ji, M., Liu, Y., and Yu, L. (2010). Decomposing the influencing factors of industrial carbon emissions in Shanghai using the LMDI method. Energy 35 (6), 2505–2510. doi:10.1016/j.energy.2010.02.049
Zhou, J., Zhao, H., and Wu, J. (2017). Study on relationship and evolution characteristics of intensive land-use and carbon emission of Guanzhong urban agglomeration. China Land Sci. 31 (11), 55–61. doi:10.11994/zgtdkx.20171212.103127
Keywords: intensive land use, carbon emissions, decoupling theory, LMDI, temporal and spatial pattern evolution
Citation: Zhang Q, Ge J, Liang Y, Zhang M, Dong L and Zhang J (2022) Does intensive land use decoupled from carbon emissions? an empirical study from the three grand economic zones of China. Front. Environ. Sci. 10:941177. doi: 10.3389/fenvs.2022.941177
Received: 11 May 2022; Accepted: 01 August 2022;
Published: 26 September 2022.
Edited by:
Xander Wang, University of Prince Edward Island, CanadaReviewed by:
Yuanchun Zhou, Nanjing University of Finance and Economics, ChinaJieying Xiao, Hebei University of Science and Technology, China
Copyright © 2022 Zhang, Ge, Liang, Zhang, Dong and Zhang. This is an open-access article distributed under the terms of the Creative Commons Attribution License (CC BY). The use, distribution or reproduction in other forums is permitted, provided the original author(s) and the copyright owner(s) are credited and that the original publication in this journal is cited, in accordance with accepted academic practice. No use, distribution or reproduction is permitted which does not comply with these terms.
*Correspondence: Jingfeng Ge, Z2VqaW5nZmVuZ0BoZWJ0dS5lZHUuY24=