- 1Key Laboratory of Ecology and Environment in Minority Areas (Minzu University of China), National Ethnic Affairs Commission, Beijing, China
- 2College of Environmental Science and Technology, Peking University, Beijing, China
- 3Beijing Shangdianzi Regional Atmosphere Watch Station, Beijing, China
- 4Tibet Meteorological Bureau, Lhasa, China
Lhasa is a typical high-altitude city with strong solar radiation and high background ozone levels. With the rapid development and urbanization, the emission of volatile organic compounds (VOCs) in Tibet has been increasing annually. However, VOCs activity and the impact on air quality and human health have scarcely been investigated. We conducted online measurement of VOCs in urban Lhasa during May 2019. The mean mixing ratio (with one standard deviation) of the total VOCs was 21.5 ± 18.6 ppb. Of the total VOCs, alkanes, alkenes, and aromatic hydrocarbons accounted for 57.7%, 20.9%, and 21.4%, respectively. On the basis of VOC atmospheric reactivity, the ozone formation potential (OFP) and hydroxyl radical loss rate (LOH) were 91.7 ppb and 3.1 s−1, respectively. Alkenes accounted for the largest proportion of the OFP and LOH, followed by aromatic hydrocarbons. The results of correlation analysis on the benzene series (BTEX), and the similarity of the diurnal changes in CO, NOy, BTEX, and TVOC mixing ratios indicated that Lhasa city strongly affected by motor vehicle emissions. Source apportionments using positive matrix factorization (PMF) model further confirmed that traffic related emissions, including gasoline automobiles, diesel vehicles, and public transportation vehicles fueled with liquid natural gas contributed the most in total VOCs concentration (44.5%–50.2%), LOH (41.6%–46.8%) and OFP (47.4%–52.3%). Biomass combustion, mainly from the traditional biomass fuel in the plateau, was the second contributor to ambient VOCs (41.3%), LOH (26.4%), and OFP (29.7%), and existed a less variation in diurnal changes with a feature of regional background. Plants contributed only about 1.5% to the VOCs concentration but a relatively high (approximately 14.6%) LOH. The noncarcinogenic risk of BTEX did not exceed the hazard quotient value, but the carcinogenic risk of benzene was 4.47 × 10⁻⁶, indicating a potential risk.
1 Highlights
Variations in volatile organic compounds were explored in a highland urban city
Air quality in urban Lhasa city was strongly affected by motor vehicle emissions
Benzene has a potential carcinogenic risk in urban Lhasa now
2 Introduction
Volatile organic compounds (VOCs) in the atmosphere are crucial precursors of ozone (O3) and secondary organic aerosols (SOAs) (Tang et al., 2006; Santos et al., 2021). VOCs play a critical role in tropospheric atmospheric chemistry, affecting the atmospheric oxidation balance, greenhouse effect, and secondary aerosol formation (Constable et al., 2001; Klinger et al., 2002). They also have a definite impact on human health (Zhao et al., 2019; Lyu et al., 2020). In China, emissions of anthropogenic VOCs have been increasing annually (Li et al., 2019), especially in economically developed and densely populated areas such as the North China Plain (Liu et al., 2005; Song et al., 2007; Wang et al., 2012; Li et al., 2020), Yangtze River Delta (Huang et al., 2011a; Huang et al., 2015; Dai et al., 2017), and Pearl River Delta (Liu et al., 2007; Guo et al., 2011; Han et al., 2019). However, few studies are carried out on atmospheric pollutants, especially VOCs, in the Tibetan Plateau, where the air is always considered as clean background since it is far away from polluted areas. Limited data have revealed that VOC concentrations in the Tibetan rural regions were higher than those in the Arctic and Antarctic regions but lower than those in many remote rural areas of Asia (Xue et al., 2013; Li et al., 2017). An early study suggested that VOCs in Lhasa mainly originate from biomass combustion and plant emissions (Yu et al., 2001). In recent years, anthropogenic VOC emissions from fossil fuel combustion (motor vehicles and coal burning) and industry have become increasingly prevalent (Ran et al., 2014; Bai et al., 2018; Chen et al., 2018; Yin et al., 2019). In 2019, 265,000 motor vehicles have been reported to be owned by the 555,000 registered residents of Lhasa city, and approximately 65% of the residents lived in the urban area of less than 150 km2 (data from Lhasa Statistics Bureau), indicating a high density of vehicles in the city. As the urban area of Lhasa city has continued to develop and expand, the number of motor vehicles, including vehicles from other provinces, and the emissions and ambient levels of gaseous pollutants (e.g., NOx, CO, and SO2) have increased significantly (Wei et al., 2011; Ran et al., 2014). The Tibetan Plateau has strong solar radiation (Chen et al., 2015), high background ozone levels (Lin et al., 2015), and high atmospheric oxidation capacity (Lin et al., 2008), which facilitates the formation of airborne particulates from the organic precursors, such as polycyclic aromatic hydrocarbons (Qi et al., 2003; Liu et al., 2013), but also increases a potential risk of photochemical smog from the increasing photochemical precursors in highland cities with dense populations (Ran et al., 2014). The potential risks of air quality deterioration and photochemical pollution have not yet evaluated by measurement. Therefore, performing observational studies on VOCs to determine their concentrations, composition and variation characteristics, photochemical properties in the atmosphere, and potential risks to human health in urban Lhasa, a typical highland city, is vital. In this paper, we presented the variations of VOCs, which were continuously and firstly measured by on-line techniques, and then discussed their sources implication and potential risks.
3 Measurement and analysis methods
3.1 Online measurement
From May 1 through 31 May 2019, VOCs were measured in the yard of the Meteorological Bureau of the Tibet Autonomous Region in Lhasa city (91.13°E, 29.65°N, 3,667 m above sea level). The sample inlet was on the rooftop of a four-storey building. The measurement site was adjacent to the Linkuo North Road in the northern part of the city. The site was surrounded by office and residential areas, and the famous Potala Palace was located 2 km to the west, as illustrated in Figure 1.
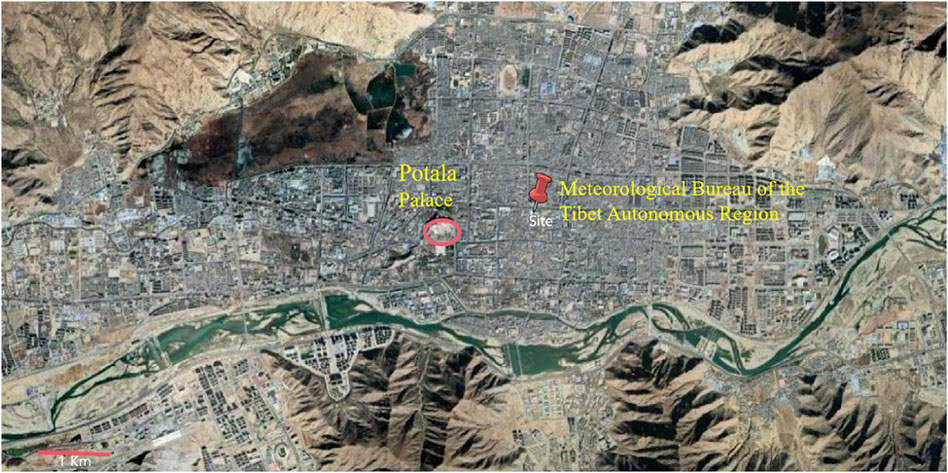
FIGURE 1. Measurement site’s location and nearby topography in Lhasa. Measurement was conducted in the central urban area.
In this study, an online gas chromatograph analyzer (Syntech Spectras GC955, Groningen, Netherlands) was used to measure the ambient VOC concentrations. The ambient air sample entered the analyzer after particulate filtering and Nafion tube drying. The sampling flow rate was 0.5 L·min−1. C6–C12 and C2–C5 compounds, with high and low boiling points, respectively, were measured separately. C6–C12 compounds were preconcentrated and enriched on a Tenax GR tube at room temperature, heated, and quickly desorbed. The compounds then entered a DB-1 chromatographic column with a carrier gas for separation and were finally detected by a photoionization detector (PID). C2–C5 compounds were cooled and preconcentrated at a low temperature (5°C) on a Carbonsieve SⅢ tube. After heating and desorption, they were separated using a porous layer open tubular chromatographic column and were finally monitored using a PID and a flame ionization detector (FID). 40-min cycles were set during the measurement. VOC standard gases (55 VOC mixtures, ∼1.0 ppm, Linde Spectra Environmental Gases, Germany), namely 28 alkanes, 11 alkenes, and 16 aromatics, were used in qualitative and quantitative analyses. Zero and span (∼5 ppb) calibrations were performed in the early and late stages of field observation. High purity N2 (99.999%) was used as zero and dilution gas. According to the order of peak areas and the retention times of the standard spectrogram, the individual VOCs compounds were determined and quantified. During the measurement, there were 49 species of VOCs identified and quantified. In general, the precision for VOCs was below 15%. The linear correlation coefficients of calibration curves were mostly greater than 0.99 for individual VOCs compounds as tested in the lab.
Surface CO mixing ratios were measured using a gas filter correlation infrared absorption analyzer (48i trace level, Thermo Fisher, Uinted States). Reactive nitrogen species (NOy) were detected using a chemiluminescence analyzer (Model 42i-Y, Thermo Scientific, Uinted States) equipped with an external molybdenum converter heated to approximately 375°C. Meteorological data were obtained from the Tibet Meteorological Bureau.
3.2 Data analysis methods
3.2.1 Calculation of mixing layer depth
The National Centers for Environmental Prediction and National Center for Atmospheric Research reanalysis meteorological data set (https://ready.arl.noaa.gov/archives.php) was input into National Oceanic and Atmospheric Administration Hysplit (http://ready.arl.noaa.gov/HYSPLIT.php) software to calculate mixing layer depths (MLDs) during the measurement period.
3.2.2 Calculation of ozone formation potential
The maximum incremental reactivity (MIR) method was used to calculate the OFP of each VOC component to evaluate the contribution of VOCs to O3 generation. The OFP calculation formula is as follows:
where MIR is the maximum incremental reactivity, and the value of MIR is obtained from the California Code of Regulations, 2010 (Carter, 2010); [VOC]i is the concentration of each VOC component in ppb.
3.2.3 Calculation of loss rate of hydroxyl radical
The OH radical loss rate (LOH) of VOC components was calculated using the following formula:
where kOH is the reaction rate constant of VOCs and hydroxyl radicals, and the data originate from reference (Atkinson and Arey, 2003).
3.2.4 Positive matrix factorization analysis
Positive matrix factorization (PMF) model was first proposed to factor analysis in 1994 (Paatero and Tapper, 1994) and it has been widely used recently as a tool to resolve VOCs source-receptor relationship and to evaluate the different sources contributions. PMF is a receptor model which quantifies contributions from various sources by mathematical statistics according to the different chemical composition or source fingerprint. In this paper, the EPA PMF 5.0 software with a multiple linear engine version 2 (ME-2) platform (Norris et al., 2014) is used for source analysis. Based on Eq. 3, PMF calculates the following parameters: 1) the number of VOCs source factors p, 2) the chemical composition of each source factor f, 3) contribution g of each source factor to the sample, and 4) residual eij of each species to each sample. The constraint of PMF is that the contribution g and source factor f in the equation should be non-negative to have physical significance.
where, the data matrix Xij represents the concentration of VOCs, i represents the observed sample, j represents the species.
The target of PMF is to minimize the functional residual Q in the Eq. 4, where n and m are the number of samples and the number of species respectively, and uij is the uncertainty of Xij.
The input file consists of two matrices, observed species concentration (Xij) and uncertainty (uij).
Uncertainty calculation formula is:
Based on the extensively used principles, missing rates greater than 25% or concentrations lower than MDL are excluded (Han et al., 2021). Finally, 21 species were selected and input into the PMF model calculation. Three to nine factors were estimated to obtain the best resolution based on the Qtrue/Qexpected and Qtrue/Qrobust value (Li et al., 2020). In this study, six factors were determined with regard to the Qtrue/Qrobust = 1.06 and Qtrue/ Qexpected = 1.09. Around 95% of the scaled residuals were between −3 and 3. Fpeak with the value of −1 to 1 at intervals of 0.1 was determined to investigate the free rotation (Song et al., 2018). The results showed that Fpeak values had no significant difference, indicating a good fit of the modeled results.
3.2.5 Health risk assessment
To quantitatively describe the relationship between the human exposure dose and adverse health reaction, according to the carcinogenicity of substances, health risk assessments are generally of two types: carcinogenic and noncarcinogenic risk assessments (Xia et al., 2014; Cheng et al., 2019). In this study, the assessment indexes were calculated using Eqs. 6–9.
where EC is the exposure concentration in μg/m3, C is the environmental concentration of pollutants in μg/m3, ET is the exposure time, EF is the exposure frequency, ED is the exposure duration (in years), AT is the average time, RfC is the inhaled carcinogenic risk concentration in mg/m3, IUR is the US Environmental Protection Agency (EPA) inhalation unit risk in μg/m3, Risk is the value of carcinogenic risk, HQ is the noncarcinogenic risk hazard quotient (HQ), and HI is the noncarcinogenic risk index. EF was obtained from the US EPA Integrated Risk Information System (IRIS, 365 d/y; http://www.epa.gov/iris), and ET, ED, and AT were 3.68 h/day, 74.8 years, and 74.8 × 365 × 24 h, respectively (Cheng et al., 2019).
4 Results and discussion
4.1 Time series variation in VOC mixing ratios
As illustrated in Figure 2, during the entire observation period, the volume mixing ratios of C2–C5 alkanes, alkenes, C6–C12 alkanes, and aromatics were 2.1–67.4, 0.39–16.8, 1.2–22.3, and 0.95–20.6 ppb, respectively. Regarding C2–C5 alkanes, higher spikes were found from May 14–19, 2019, whereas C6–C12 alkanes demonstrated higher concentrations on May 5–9 and 13–16, 2019 (maximum value: 22.3 ppb, daily average value: 7.4 ppb). Aromatics fluctuated more from May 7–18, 2019, with a greater number of peaks (maximum value: 20.6 ppb, daily average value: 8.7 ppb). Alkenes demonstrated fluctuations for the whole measurement period. The daily mean concentrations of C2–C5 alkanes only exhibited a significant correlation (R = 0.44, p < 0.05) with alkenes, and the daily mean concentrations of C6–C12 alkanes only had a significant correlation (R = 0.65, p < 0.05) with aromatics. This indicated a difference in sources and sinks between C2–C5 and C6–C12 VOC compounds.
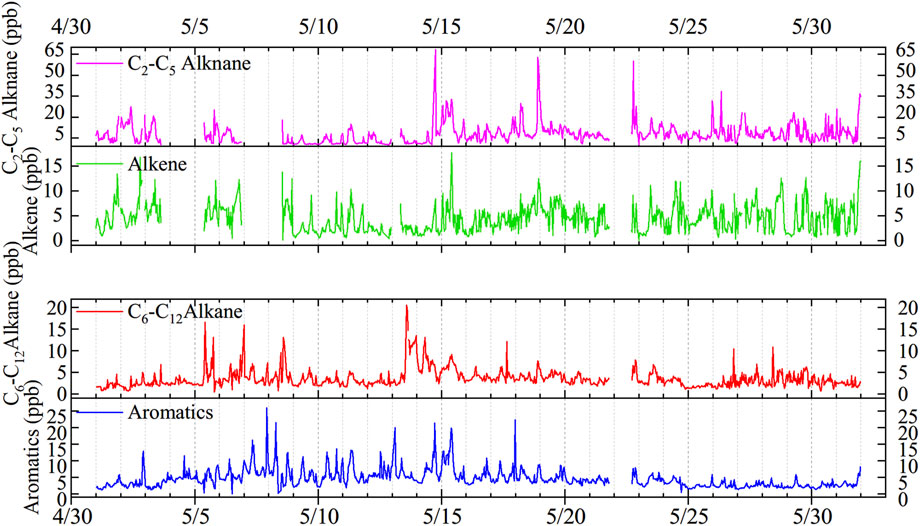
FIGURE 2. Time series variations in alkenes, C2–C5 alkanes, C6–C12 alkanes, and aromatics mixing ratios in the 2019 study.
4.2 Statistics and comparison of VOC mixing ratios
4.2.1 Concentration level of volatile organic compounds
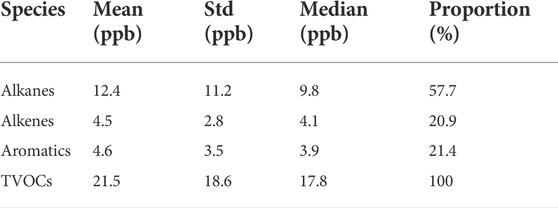
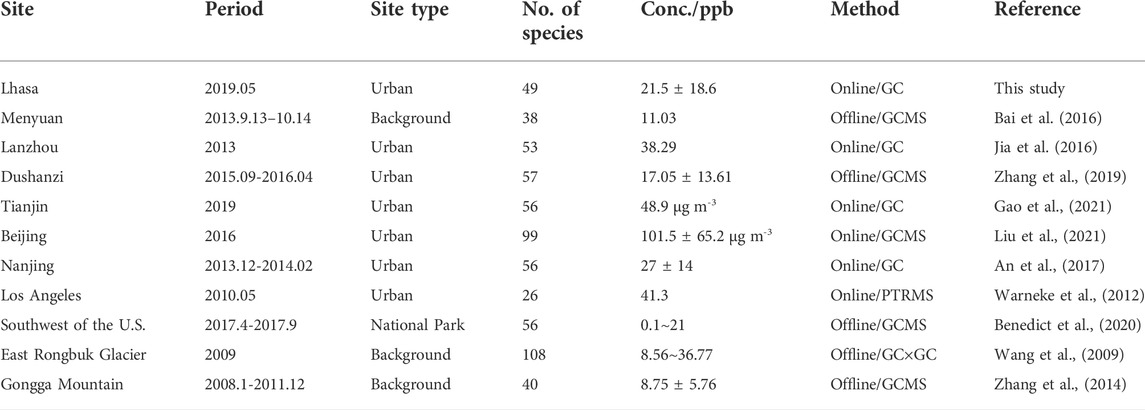
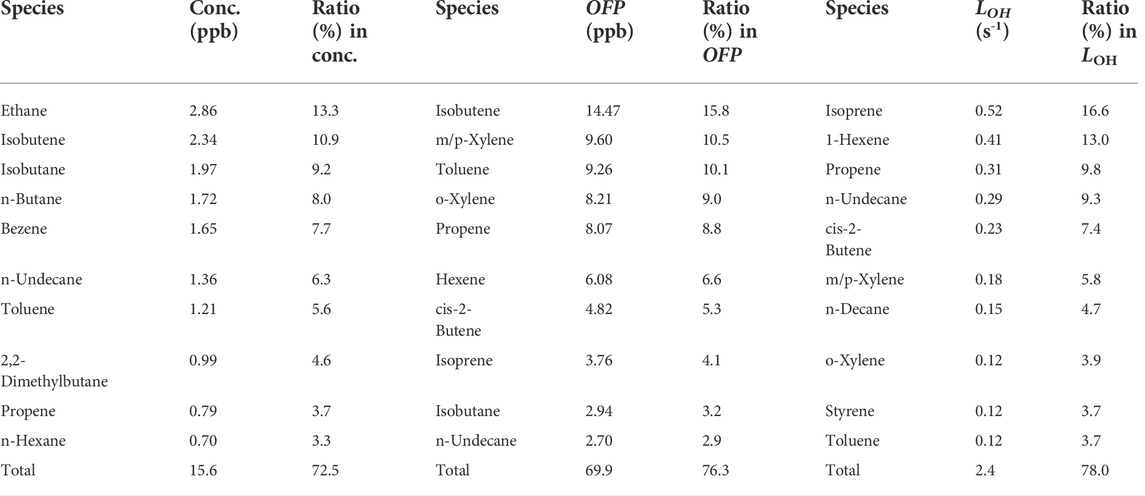
As detailed in Table 1, the hourly mean mixing ratio with ±1 σ of total VOCs in our measurement was 21.5 ± 18.6 ppb (median: 17.8 ppb), which was lower than the annual average VOC mixing ratio of 37.4 ppb (sum of alkanes, alkenes and aromatics) obtained in Lhasa city during 2019 through Summa canister offline sampling (Yu et al., 2022). Leaving their difference in sampling time and frequency aside, it indicated that there have months with high VOCs at Lhasa than that in May when we measured. The concentration was also lower than those reported in large cities such as Beijing, Tianjin, Nanjing, and Los Angeles (see Table 2) but higher than those reported in clean rural sites such as Gonggar Mountain. The alkane volume mixing ratio was 12.4 ± 11.2 ppb, accounting for 57.7% of the total VOCs, whereas the ratios of aromatics and alkenes were 4.6 ± 3.5 and 4.5 ± 2.8 ppb, accounting for 21.4% and 20.9% of the total VOCs, respectively. The relative contribution of the four types of VOCs here was similar to other cities, inferring comparable emission inventory structure of VOCs. Much lower VOCs might be related to the relatively lower emission strength in the city of Lhasa. According to mixing ratios, the top 10 VOC components were ethane, isobutene, isobutane, n-butane, benzene, toluene, n-undecane, 2,2-dimethylbutane, propylene, and n-hexane, respectively (Table 3).
4.2.2 Characteristics of BTEX mixing ratios
BTEX is a general term for benzene, toluene, ethylbenzene, and three xylene isomers (m-xylene, p-xylene, and o-xylene); it represents a key group among VOCs. BTEX mainly originates from solvent use, fossil fuel and biomass combustion, and it plays a pivotal role in atmospheric photochemical smog and particulate pollution (Zhang et al., 2016; Yao et al., 2017).
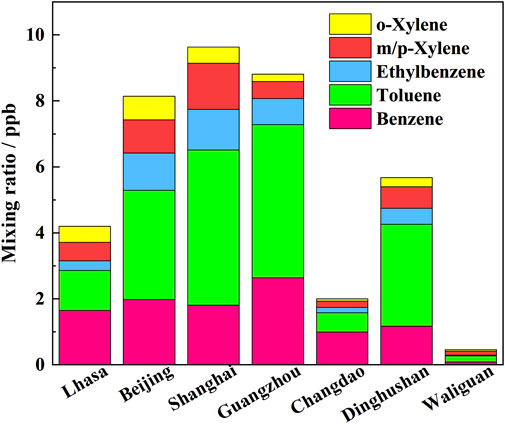
Supplementary Figure S1 depicts the time series variations in benzene, toluene, ethylbenzene, m/p-xylene, and o-xylene mixing ratios from May 1 to 31 May 2019. BTEX mixing ratios exhibited day-to-day fluctuations of 1.8–20.2 ppb. The average benzene, toluene, ethylbenzene, m/p-xylene, and o-xylene mixing ratios with ±1 σ were 1.65 ± 0.8, 1.21 ± 1.02, 0.29 ± 0.25, 0.56 ± 0.58, 0.49 ± 0.48 ppb, respectively, and BTEX accounted for 19.5% of the total VOCs.
Figure 3 provides a comparison of BTEX mixing ratios in Lhasa with the ratios recorded in other cities. The BTEX mixing ratios in Lhasa were much lower than those in Beijing (January 2014) (Li et al., 2015), Shanghai (January 2007–March 2010) (Cai et al., 2010), Guangzhou (November–December 2009) (Zhang et al., 2013), and the Dinghushan rural site in the Pearl River Delta (April 2005) (Tang et al., 2007). However, it is worth noting that the benzene to BTEX ratio was higher in Lhasa (39%) than that in Beijing (24%), Shanghai (19%), and Guangzhou (30%). The BTEX mixing ratio in Lhasa was higher than that at the rural site in Changdao, Shandong province (March–April 2011) (Yuan et al., 2013) and Waliguan, Tibet Plateau (April–May 2003) (Xue et al., 2013).
4.3 Diurnal variations
Figure 4 shows the average diurnal variations in the mixing ratios of various classes of VOCs, atmospheric MLD, wind direction frequency, and wind speed. Easterly winds were predominant at nighttime (19:00–6:00), whereas westerly winds were more prevalent during daytime. Strong winds were observed in the afternoon and reached a peak at 16:00–17:00.
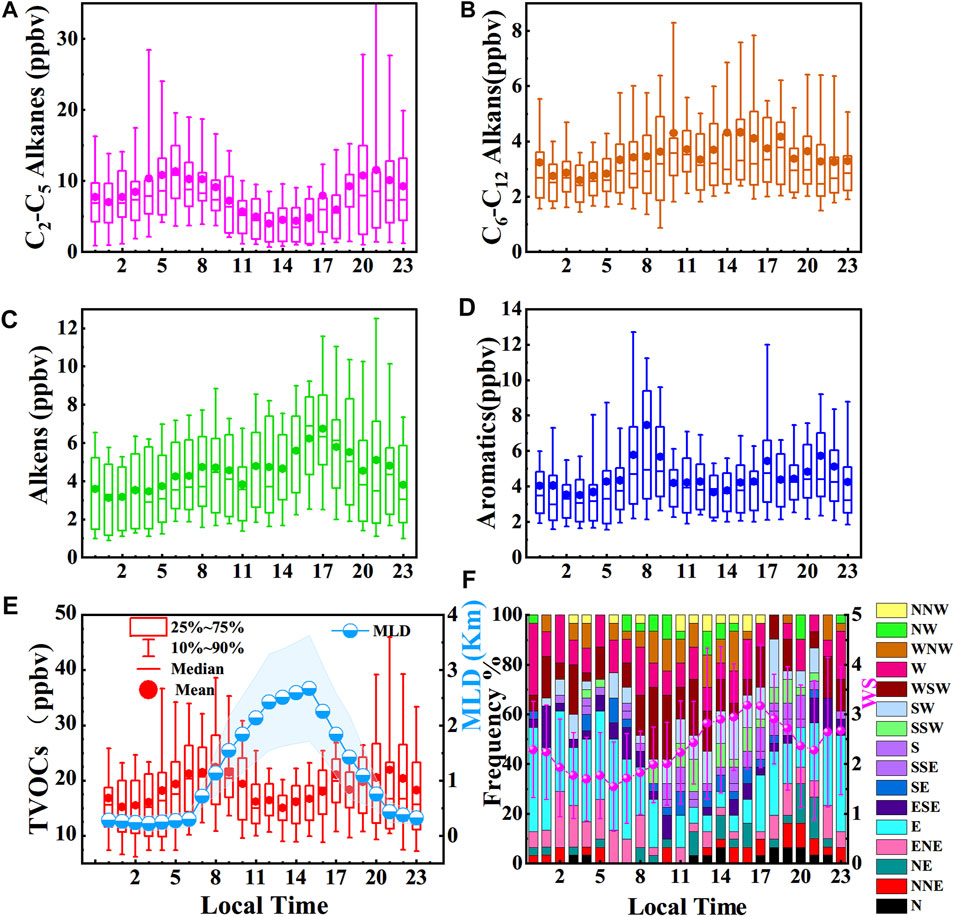
FIGURE 4. Daily variations in (A) C2–C5 alkanes, (B) C6–C12 alkanes, (C) alkenes, (D) aromatics, (E) TVOCs mixing ratios and mixing layer depths (MLD), and (F) wind direction frequency and wind speed (shade and error bar indicate 1 σ).
The peak value of C2–C5 alkanes was found at 6:00 when the wind speed was the lowest for the day. The concentrations then gradually decreased; a trough value appeared at 14:00, and another peak value appeared at 21:00. The mean value at 6:00 (11.3 ppb) was close to the median value (10.8 ppb), whereas the mean value (11.5 ppb) at 21:00 was much higher than the median value (8.2 ppb), which indicated the heavier influence of local emissions at night peak time. The concentration (6.9 ppb) of C2–C5 alkanes in daytime was lower than that at night (9.3 ppb).
Alkenes exhibited two peaks at approximately 9:00 in the morning (4.7 ppb) and 17:00 at night (6.7 ppb), and the morning peak appeared at a time similar to that of the aromatics. Distinct from C2–C5 alkanes, the mean value of alkenes in the daytime (4.7 ppb) was slightly higher than that at night (4.0 ppb). This shall be attributed to a stronger emission of them in daytime than nighttime, since there are stronger dilutions and sinks in daytime than nighttime.
Diurnal variation was found for the aromatics: an obvious peak value (7.5 ppb) occurred at 8:00 in the morning, followed by a gradual decrease, reaching a trough (3.7 ppb) at 13:00–14:00 and then increasing up to a second peak (5.5 ppb) at 17:00. The daytime concentration of aromatics (4.8 ppb) was also slightly higher than that (4.3 ppb) at night. The morning peak of C2–C5 alkanes appeared earlier and lasted longer, whereas the morning peak of aromatic hydrocarbons appeared sharply later on.
Generally, the diurnal variations were lower in C6–C12 alkanes and alkenes than in aromatics and C2–C5 alkanes, in terms of their amplitudes in diurnal variations. For total VOCs (TVOCs), diurnal variation was found: two peak values of 22.4 ppb at 8:00 and 21.9 ppb at 21:00, and two trough values of 15.2 ppb at 2:00 and 15.0 ppb were found at 13:00. During the day, the mixing ratios of TVOCs decreased and reached their lowest values at approximately 13:00. The higher MLD and wind speed in daytime would promote the convective and advective dilution of the pollutants. Therefore, the timing of diurnal variation of distinct VOC species differed slightly as a result of the differences in emission sources, in addition to varied species activity, and sink. Notably, freight vehicles have been restricted on roads in urban Lhasa from 5:00 to 21:00 every day, which may have affected the diurnal variations in some species of VOCs, for example the night peaks of them. This requires further exploration.
Figure 5 depicts the average diurnal variations in CO, NOy, BTEX, and TVOCs mixing ratios. The diurnal change of BTEX exhibited a pattern consistent with that of TVOCs; a significant correlation (R = 0.86, p < 0.01, Supplementary Table S1) was observed. Except for a high peak at approximately 17:00 for BTEX and TVOCs, a similar variation pattern was observed for the BTEX (TVOCs), CO, and NOy mixing ratios. CO mainly originates from incomplete combustion (Shao et al., 2020) and is a tracer of combustion emissions. The CO, NOy, and BTEX (TVOCs) mixing ratios reached peaks during the morning rush hour period at 8:00, which was likely due to vehicle exhaust emissions. During the evening rush hours, a peak for BTEX (TVOCs) was also observed at approximately 17:00, but no peaks for CO and NOy were noticeable. Another distinct nighttime peak appeared at 21:00 for CO, NOy, and BTEX (TVOCs), which may be primarily due to high vehicle emissions associated with the habits of local people and the end of the driving restrictions on freight vehicles (Huang et al., 2011b). The similarity of the CO, NOy, BTEX, and TVOC mixing ratios during the 2:00–4:00 and 13:00–14:00 periods indicated that the pollutants could not easily accumulate in the Lhasa valley at night in May because the geographical scale of urban Lhasa is small and the air above is easily diluted and replaced by fresh and clean surrounding air.
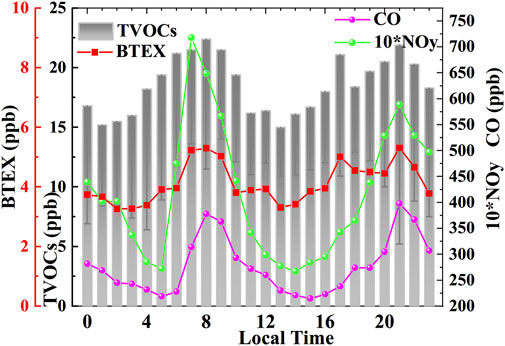
FIGURE 5. Average daily variation in CO, NOy, TVOC, and BTEX mixing ratios (error bar indicates 1 σ).
In addition to source emissions, meteorological factors also have an impact on the diurnal change of pollutants. Pearson correlations of meteorological parameters with the hourly mean NOy, CO, and various classes of VOCs mixing ratios are showed in Supplementary Table S2. In addition to C6‒C12 alkanes, other pollutant concentrations, including TVOCs, were significantly and negatively correlated with changes in wind speed, which indicated a feature of local emission. MLD seemed to have a complex influence on different pollutants. MLD showed significant and negative correlations with NOy, C2‒C5 alkanes and TVOCs, significant and positive correlations with alkenes and C6‒C12 alkanes, but insignificant with CO, BTEX, and aromatics. Air temperature were significantly and positively correlated with changes in BTEX, aromatics, and NOy, but insignificant with other pollutants.
4.4 OFP and OH loss rate of VOC components
The atmospheric lifetimes and reactivity of different species of VOCs varied greatly. Therefore, the concentration alone does not fully reflect the roles of these factors in the processes of atmospheric chemistry; this shortcoming can be overcome to some extent by considering the properties of chemical reactivity, such as OFP and OH loss rate (Bufalini et al., 1976).
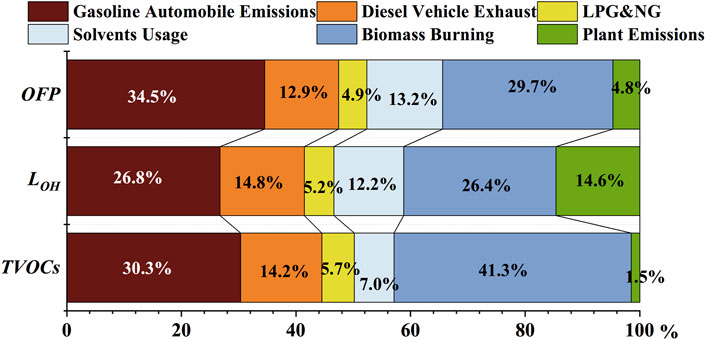
The total OFP of the observed species was 91.7 ppb during the entire observation period, and the OFP of alkanes, alkenes, and aromatic hydrocarbons was 18.9, 39.6, and 33.2 ppb with contributions of 20.6%, 43.2%, and 36.2%, respectively. The total LOH was 3.1 s−1 for all observed species, with values of 0.9, 1.5, and 0.7 s−1 and contributions of 28.2%, 47.9%, and 23.9% for alkanes, alkenes, and aromatic hydrocarbons, respectively. As illustrated in Figure 6, alkanes were the most abundant components (57.7%) in the total VOCs but had the lowest contributions to OFP (20.6%) and LOH (28.2%), whereas alkenes had the highest contributions to OFP (43.2%) and LOH (47.9%), which indicated higher activity and hydroxyl radical reaction rate for alkenes than for alkanes in Lhasa. Aromatics contributed 36.2% to the OFP and 23.9% to LOH. The top 10 VOC species were ranked in terms of concentration, OFP, and LOH, respectively, and are shown in Table 3. Although ethane and benzene had high concentration proportions, their OFP and LOH were not ranked in the top 10 due to their relatively weak reactivity. In terms of the control of ozone generation, the priorities for controlling VOC species are isobutylene, m/p-xylene, toluene, o-xylene, propene, hexene, cis-2-butene, isoprene, isobutane, and n-undecane, which accounted for 76.3% of OFP.
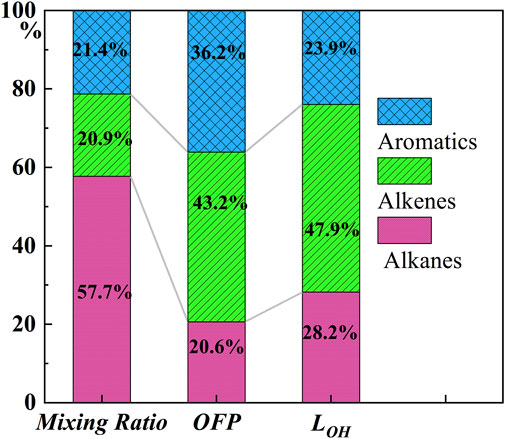
FIGURE 6. Relative contributions of mixing ratios, OFP, and LOH activities of alkanes, alkenes, and aromatics.
4.5 Source apportionments through BTEX correlation ratios and positive matrix factorization analysis
4.5.1 BTEX components ternary analysis
The main emission sources of benzene are combustion processes, including biomass, biofuel, or coal burning (BM/BF/CB). The proportion of benzene in BM/BF/CB sources is higher than that of toluene, whereas the proportion of benzene in motor vehicle emissions is generally lower than that of toluene (Barletta et al., 2005). In this study, a ternary diagram of benzene, toluene, and ethylbenzene mixing ratios was used to determine the predominant emission sources (Zhang et al., 2016), and the results are presented in Figure 7. In the diagram, the benzene, toluene, and ethylbenzene mixing ratios are normalized. The distribution of benzene, toluene, and ethylbenzene mostly occurred in the biomass burning and transportation emission areas, and the BM/BF/CB areas accounted for a larger proportion of the emissions than the areas with industrial and solvent and traffic emissions. However, most the scattering dots did not fall within the wireframes, which indicated different emission spectrums on the plateau from that in the area with low altitudes. Studies on aerosols and other air pollutants in Lhasa have demonstrated the considerable impact of biomass burning related to religious activities and regional transport (Cui et al., 2018; Duo et al., 2018). As displayed in Figure 8, during rush hours (7:00–9:00 and 17:00) and nighttime peak periods (21:00), which were expected to be associated with higher traffic-related emissions, the emission levels did not differ with those of other time periods. Because the patterns of benzene, toluene, and ethylbenzene distribution between BM/BF/CB and traffic emissions should differ, traffic emissions were expected to have been a dominant influence on ambient VOCs in Lhasa since disorderly incense and biomass burning activities have been greatly restrained in protecting the environment in recent years.
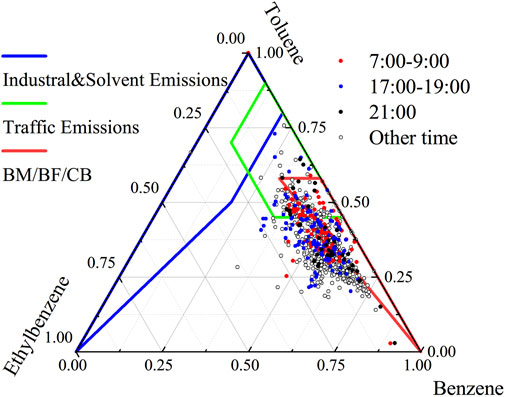
FIGURE 7. Ternary diagram of the normalized benzene, toluene, and ethylbenzene mixing ratios. The wireframes include > 90% of the scatter collected for the three lumped source categories of industrial and solvent emissions, traffic emissions, biomass/biofuel/coal burning (BM/BF/CB).
4.5.2 BTEX components correlation
The ratio of distinct VOC species can be used to determine the predominant pollution sources on the basis of the difference in the characteristic species of VOCs in the corresponding sources. The toluene-to-benzene (T/B) ratio has often been used to identify the sources of pollutants (Niu et al., 2012; Y. Zhang et al., 2013). The T/B ratio of ≤2 indicates that the main sources are vehicle exhaust emissions or biomass burning. A T/B ratio of >2 indicates that the pollutants were emitted from other sources, and a T/B ratio of 4.25–10.00 strongly implies the influence of industrial emission sources (Barletta et al., 2008; Niu et al., 2012; Kumar et al., 2018). A study on pollution sources revealed that the T/B ratio for biomass combustion was approximately 0.5 or even lower, whereas that for motor vehicle emissions was nearly 1.7 (Barletta et al., 2005).
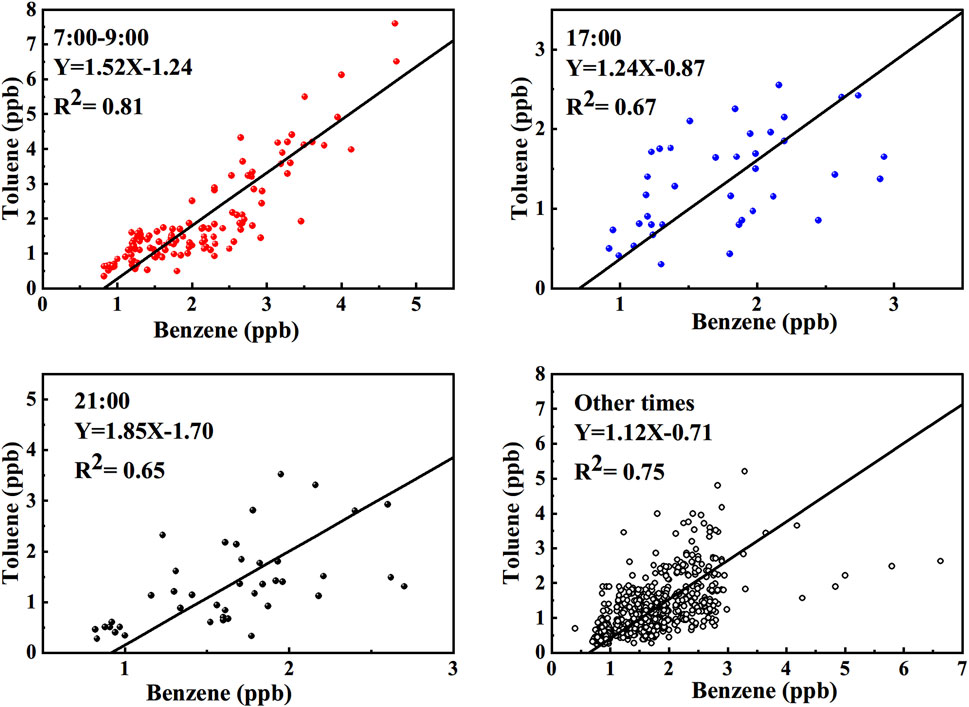
The correlations between toluene and benzene mixing ratios in distinct periods are depicted in Figure 8. All the correlations were significant (R2 > 0.6 and p < 0.05), indicating that the pollutants were emitted from the same or similar sources. The slopes (T/B ratio) of the fitting curves were 1.52 at 7:00–9:00 and 1.85 at 21:00, both of which are higher than the T/B ratio values of 1.24 at 17:00 and 1.12 during other periods. The emissions from motor vehicles were associated with higher T/B ratios than biomass combustion (Zhang et al., 2013); thus, the results reflected more traffic-related emissions during the periods of 7:00–9:00 and 21:00.
4.5.3 Air mass age analysis
M/p-xylene and ethylbenzene usually have a common source, but the reaction rate of m/p-xylene with hydroxyl radicals is nearly three times higher than that of ethylbenzene, and the ratio of m/p-xylene to ethylbenzene (X/E) gradually decreases as the photochemical reaction proceeds; hence, the X/E can be used as an indicator of the degree of air mass aging (Huang et al., 2015; Han et al., 2020).
Figure 9 displays the average diurnal variations in benzene, toluene, m/p-xylene, and ethylbenzene mixing ratios, as well as in T/B and X/E ratios. Benzene, toluene, ethylbenzene, and m/p-xylene mixing ratios had peak values and high T/B and X/E ratios were found from 7:00 to 9:00 in the morning, which coincided with the morning rush hours. Similar patterns were observed during other times of peak traffic at approximately 17:00 and 21:00. Trough values were observed at 13:00–14:00, as well as low T/B and X/E ratios. The peak and trough values of toluene and m/p-xylene mixing ratios were more obvious than those of benzene and ethylbenzene mixing ratios because toluene and m/p-xylene have higher photochemical reactivity. The average diurnal variation in T/B ratios was 0.5–0.9, which is close to the values obtained at the rural site of Shangdianzi (Han et al., 2020). The low T/B ratio indicates the crucial influence of biomass combustion. The average diurnal variation in the X/E ratio was 0.8–2.0, which was higher than the ratios obtained at Shangdianzi and Beijing (Han et al., 2020).
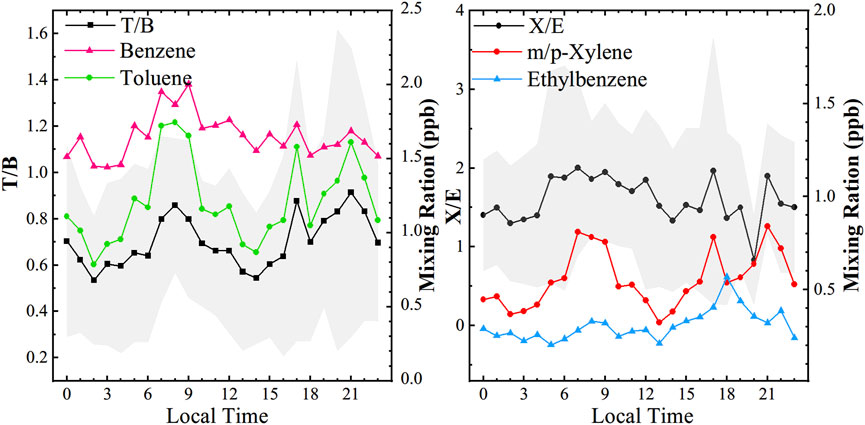
FIGURE 9. Average diurnal variations in benzene, toluene, m/p-xylene, and ethylbenzene mixing ratios and T/B and X/E ratios.
4.5.4 Volatile organic compounds source apportionment by positive matrix factorization
The result of VOCs source apportionment by PMF model analysis was shown in Figure 10 (left panel), in which six factors’ resolutions with a stable Q value were identified as the dominant source of VOCs in urban Lhasa city. The average diurnal variations in each source concentration were shown in Figure 10 (right panel).
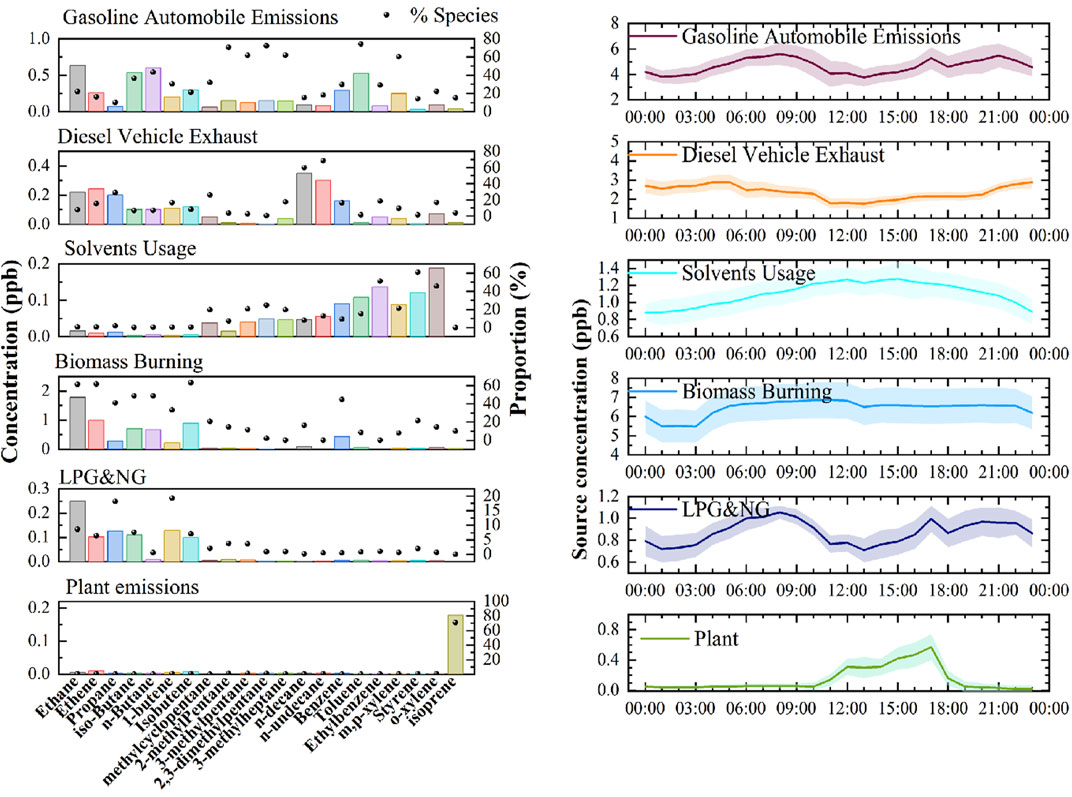
FIGURE 10. The resolved factor profiles (left) by PMF analysis and the corresponding diurnal variations in each source’s mixing ratio (right).
The first factor was characterized by the strong presence of ethane, ethene, n-butane, butene, 2-methylpentan, 3-methylpentan, aromatics like toluene, benzene, xylene. These species are mainly from traffic emissions and gasoline evaporation (Li et al., 2020). Therefore, this source is identified as gasoline automobile emissions. As can be seen in Figure 10 (right panel), the average diurnal variation in gasoline automobile emissions presented peaks at 7:00–9:00, 17:00 and 21:00, which peaks reflected the influences of traffic rush hours.
Factor 2 was distinguished by a high percentage of alkanes with high carbon number, such as n-decane and n-undecane, which were abundant in diesel vehicle exhaust (Zhang et al., 2021). Ethane, ethene, propene and benzene, ethyl benzene and xylene were also rich in this factor with high percentages. These species are associated with diesel vehicular emissions. Thus, Factor 2 was featured as diesel vehicle exhaust. Due to restrictions in freight vehicles in the daytime, the VOCs emissions contribution from diesel vehicles might be lower during the day than at night. In addition, lower MLD also increased the level of the corresponding VOCs mixing ratio at night (Figure 10, right).
Factor 3 was characterized by high levels of aromatics (xylene, styrene, ethylbenzene, and benzene). Toluene, ethylbenzene, xylene, and 1,3,5-trimethylbenzene are used as organic solvents in various industries and can be regarded as indicator species for solvent volatilization. Alkanes like methylpentane, methylheptane, n-decane, n-undecane, are also widely used as nonpolar solvents (Yuan et al., 2010; Song et al., 2018). Therefore, source 3 was identified as solvents usage. Because solvent usage often occurred in daytime and the solvents have a more volatility under higher temperature, VOCs concentrations from solvents usage contribution were higher during the day than at night. The change of BTEX and aromatics mixing ratios were significantly and positively correlated with air temperature in Supplementary Table S2 also supported this conclusion.
Factor 4 was distinguished by high percentages of ethane, ethene, butane and butene which could be emitted from incomplete combustion of biomass (Ling et al., 2011; Li et al., 2020). In addition, benzene accounts for a high load with a contribution of 44%. The concentration of benzene was higher than toluene in this factor, which is consistent with the characteristics of biomass combustion. There was high level of VOCs from biomass burning in the morning (Figure 10, right), which may partly be related to the more activities in incense burning in the forenoon. There had a distinct feature with a flat curve and with relatively high concentrations for its diurnal change in this factor, which indicates that biomass burning in Lhasa is still common since biomass fuel is the main traditional fuel in the plateau. The less variation in diurnal changes might also tell us that the influence of biomass burning there is of regional characteristics.
Factor 5 was distinguished by high percentages of C2-C4 alkanes, propane, i-butane, and n-butane are regarded as the major compounds of liquid petroleum gas (LPG) and natural gas (NG) (Shao et al., 2016; Han et al., 2021). LPG and NG both play important roles in domestic catering and traffic. Thus, source 5 is assigned to LPG & NG usage. The diurnal variation of this source was similar to motor vehicles, except no obvious peak at 21:00. Public transportation in Lhasa has promoted the fuel conversion from oil to natural gas since 2014. Since this diurnal variation showed a similar pattern with factor 1, it reflected more contribution from traffic emissions than others.
The source profile of factor 6 was dominated by isoprene, which contributed 71% to the total isoprene. Isoprene is a typical tracer for plant emission, but traffic emissions and combustion also emit a small amount of isoprene (Borbon et al., 2001). Plants emit more isoprene during the day with solar radiation and higher temperature than at night. Therefore, the diurnal variation in plant emission showed typical feature with high values in the daytime and low at night (Song et al., 2018; Li et al., 2020). Our result in factor 6 was consistent with this natural law. Accordingly, factor 6 was identified as plant emission.
Figure 11 showed the contribution of each source to the concentration, LOH and OFP. Traffic emissions contributed 44.5%, including gasoline automobile emissions (30.3%), diesel vehicle exhausts (14.2%), to TVOCs; 41.6% to LOH and 47.4% to OFP. In addition, LPG&NG related emissions contributed 5.7% to TVOCs, including cooking fuel emissions, gas station volatilization, natural gas bus and taxi emissions, and so on. Biomass burning contributed 41.3% to TVOCs, 26.4% to LOH and 29.7% to OFP. Overall, air quality in urban Lhasa city was strongly affected by motor vehicle emissions now, exceeding the biggest contribution of biomass burning from the result of Yu et al. (2022). Plant emissions contributed only 1.5% to TVOCs, but relatively high proportions to LOH (14.6%) and OFP (4.8%), due to the high reactivity of isoprene. The contribution of plant emissions was similar with the other studies (Yu et al., 2001; Yu et al., 2022).
5 Risk assessment on BTEX
Benzene is the most toxic compound among them and has been listed as a class Ⅰ carcinogen for human beings by the International Agency for Research on Cancer. Other BTEX compounds have also been identified as harmful air pollutants (Yang et al., 2017; Zhang et al., 2017; Abd Hamid et al., 2020). In 1983, the US National Academy of Sciences proposed a four-step approach to health risk assessment, which consists of hazard identification, dose–response assessment, exposure assessment, and risk characterization (National Research Council Committee on the Institutional Means for Assessment of Risks to Public Health, 1983); this is now an internationally accepted approach. Many of the VOCs recorded in this study have their own toxicity risks (Shu et al., 2019; Lyu et al., 2020), and benzene also has a carcinogenic risk.
The US EPA suggests that the acceptable carcinogenic risk for adults is 1 × 10⁻⁶ (US EPA, 2009). For noncarcinogenic risk assessment, an HQ of greater than 1 for a contaminant implies a noncarcinogenic risk, and an HQ of less than or equal to 1 implies a small or negligible risk.
The EC, inhalation RfC, inhalation unit risk concentration (IUR), noncarcinogenic risk HQ, noncarcinogenic risk HI, and risk value of BTEX in Lhasa are detailed in Table 4. The HQ of benzene was the highest, followed by those of m/p-xylene and o-xylene. The total HI of BTEX was 0.02 during the observation period, which was lower than the value of 1 determined by the US EPA and lower than the noncarcinogenic risk index of Xianghe (Yang et al., 2019). The benzene risk value was 4.47 × 10⁻⁶, much lower than Xianghe in moderate pollution days and heavy pollution days, however higher than Xianghe in clean days. The US EPA recommended value is 1 × 10⁻⁶, indicating the potential health hazard of benzene in the atmosphere of Lhasa city.
6 Conclusion
In this study, online measurement of VOCs in urban Lhasa city was conducted in May 2019 for the first time, and a total of 49 VOCs were observed. The mean mixing ratio of the VOCs was 21.5 ± 18.6 ppb, of which alkanes accounted for 12.4 ± 11.2 ppb (57.7% of the total VOCs), aromatic hydrocarbons accounted for 4.6 ± 3.5 ppb (21.4%), and alkenes accounted for 4.5 ± 2.8 ppb (20.9%). VOC mixing ratios showed a noticeable diurnal variation, with two obvious peaks; one during the morning rush hours (7:00–9:00) and another at approximately 21:00. Another minor peak was observed at 17:00. A trough value appeared at 13:00–14:00 under conditions of high MLD and strong winds. TVOCs, BTEX, NOy and CO mixing ratios exhibited similar diurnal variations, with two peak values appearing at 7:00–9:00 and 21:00, each indicating a distinct spike in traffic emissions.
The total OFP was 91.7 ppb, among which alkanes, alkenes, and aromatic hydrocarbons accounted for 20.6%, 43.2%, and 36.2%, respectively. The total ·OH loss rate was 3.1 s−1, of which alkanes, alkenes, and aromatic hydrocarbons contributed 28.2%, 47.9%, and 23.9%, respectively. From the viewpoint of ozone generation control, the priorities for controlling VOC species were isobutylene, m/p-xylene, toluene, o-xylene, propene, hexene, cis-2-butene, isoprene, isobutane, and n-undecane, which accounted for 76.3% of the OFP.
The PMF analysis resolved six source factors, including gasoline automobile emissions, diesel vehicle exhaust, LPG & NG usage, solvent usage, biomass combustion, and plant emission. Their contributions to TVOCs were 30.3%, 14.2%, 5.7%, 7.0%, 41.3% and 1.5%, respectively. Their contributions to LOH were 26.8%, 14.8%, 5.2%, 12.2%, 26.4% and 14.6%, respectively. Their contributions to OFP were 34.5%, 12.9%, 4.9%, 13.2%, 29.7% and 4.8%, respectively. Overall, air quality in urban Lhasa city was strongly affected by motor vehicle emissions now.
The total noncarcinogenic risk HI of BTEX was 0.02, which was far below the hazard threshold of 1 recognized by the US EPA. The carcinogenic risk of benzene was 4.47 × 10⁻⁶, which was higher than the accepted carcinogenic risk threshold of 1 × 10⁻⁶, indicating a potential risk that should be further considered.
Data availability statement
The raw data supporting the conclusions of this article will be made available by the authors, without undue reservation.
Author contributions
CY and WL designed the research. YW and TZ performed the experiments. DY and BY contributes analysis on meteorological results. SG analyzed the VOCs data and wrote the manuscript. All authors contributed to manuscript revision and read and approved the submitted version.
Funding
This study was funded by the National Natural Science Foundation of China (grant nos. 21876214, 91744206).
Acknowledgments
We thank the support of the project of field campaigns of the atmospheric chemistry over the Tibetan Plateau: measurement, processing, and the impacts on climate and air quality (referred as @Tibet field campaigns).
Conflict of interest
The authors declare that the research was conducted in the absence of any commercial or financial relationships that could be construed as a potential conflict of interest.
Publisher’s note
All claims expressed in this article are solely those of the authors and do not necessarily represent those of their affiliated organizations, or those of the publisher, the editors and the reviewers. Any product that may be evaluated in this article, or claim that may be made by its manufacturer, is not guaranteed or endorsed by the publisher.
Supplementary material
The Supplementary Material for this article can be found online at: https://www.frontiersin.org/articles/10.3389/fenvs.2022.941100/full#supplementary-material
References
Abd Hamid, H. H., Latif, M. T., Uning, R., Nadzir, M. S., Khan, M. F., Ta, G. C., et al. (2020). Observations of BTEX in the ambient air of Kuala Lumpur by passive sampling. Environ. Monit. Assess. 192 (6), 342. doi:10.1007/s10661-020-08311-4
An, J., Wang, J., Zhang, Y., and Zhu, B. (2017). Source apportionment of volatile organic compounds in an urban environment at the Yangtze River Delta, China. Arch. Environ. Contam. Toxicol. 72 (3), 335–348. doi:10.1007/s00244-017-0371-3
Atkinson, R., and Arey, J. (2003). Atmospheric degradation of volatile organic compounds. Chem. Rev. 103 (12), 4605–4638. doi:10.1021/cr0206420
Bai, Y., Bai, Z. P., and Li, W. (2016). Characteristics and sources analysis of atmospheric volatile organic compounds in the Tibetan Plateau. Acta Sci. Circumstantiae 36 (06), 2180–2186. (In Chinese). doi:10.13671/j.hjkxxb.2016.0008
Bai, Y. F., Lyu, X. B., Pingcuo, , Zhang, C., and Buduo, (2018). Assessment and study of environmental air quality of 2014-2016 in Lhasa. Meteo. Sci.Technol. 46 (06), 212–217+224. (In Chinese). doi:10.19517/j.1671-6345.20170731
Barletta, B., Meinardi, S., Sherwood Rowland, F., Chan, C. Y., Wang, X., Zou, S., et al. (2005). Volatile organic compounds in 43 Chinese cities. Atmos. Environ. X. 39 (32), 5979–5990. doi:10.1016/j.atmosenv.2005.06.029
Barletta, B., Meinardi, S., Simpson, I. J., Zou, S., Rowland, F. S., and Blake, D. R. (2008). Ambient mixing ratios of nonmethane hydrocarbons (NMHCs) in two major urban centers of the Pearl River Delta (PRD) region: Guangzhou and Dongguan. Atmos. Environ. X. 42 (18), 4393–4408. doi:10.1016/j.atmosenv.2008.01.028
Benedict, K. B., Prenni, A. J., El-Sayed, M. M. H., Hecobian, A., Zhou, Y., Gebhart, K. A., et al. (2020). Volatile organic compounds and ozone at four national parks in the southwestern United States. Atmos. Environ. X. 239, 117783. doi:10.1016/j.atmosenv.2020.117783
Borbon, A., Fontaine, H., Veillerot, M., Locoge, N., and Guillermo, R. (2001). An investigation into the traffic-related fraction of isoprene at an urban location. Atmos. Environ. X. 35 (22), 3749–3760. doi:10.1016/S1352-2310(01)00170-4
Bufalini, J. J., Walter, T. A., and Bufalini, M. M. (1976). Ozone formation potential of organic compounds. Environ. Sci. Technol. 28 (9), 908–912. doi:10.1021/es60120a016
Cai, C., Geng, F., Tie, X., Yu, Q., and An, J. (2010). Characteristics and source apportionment of VOCs measured in Shanghai, China. Atmos. Environ. X. 44 (38), 5005–5014. doi:10.1016/j.atmosenv.2010.07.059
Carter, W. P. L. (2010). Updated maximum incremental reactivity scale and hydrocarbon bin reactivities for regulatory applications. Retrieved from: https://intra.engr.ucr.edu/∼carter/.
Chen, S., Zheng, X. D., Lin, W. L., Zhang, Y., Dawa, Z. X., and Qi, D. L. (2015). Observational study on the ground-based UVI at dangxiong of Tibet. J. Appl. Meteor Sci. 26 (04), 482–491. (In Chinese). doi:10.11898/1001-7313.20150410
Chen, P., Kang, S., Li, C., Li, Q., Yan, F., Guo, J., et al. (2018). Source apportionment and risk assessment of atmospheric polycyclic aromatic hydrocarbons in Lhasa, Tibet, China. Aerosol Air Qual. Res. 18 (5), 1294–1304. doi:10.4209/aaqr.2017.12.0603
Cheng, X., Zhang, L. H., Li, H., Zhang, W. Q., Chen, X., Ji, Y. Y., et al. (2019). Atmospheric VOCs in a typical urban area of Beijing: Pollution characterization and health risk during the period of the first forum on the Belt and Road Initiatives. Acta Sci. Circumstantiae 39 (09), 2839–2851. (In Chinese). doi:10.13671/j.hjkxxb.2019.0231
Constable, J. V. H., Guenther, A. B., Schimel, D. S., and Monson, R. K. (2001). Modelling changes in VOC emission in response to climate change in the continental United States. Glob. Chang. Biol. 5 (7), 791–806. doi:10.1046/j.1365-2486.1999.00273.x
Cui, Y. Y., Liu, S., Bai, Z., Bian, J., Li, D., Fan, K., et al. (2018). Religious burning as a potential major source of atmospheric fine aerosols in summertime Lhasa on the Tibetan Plateau. Atmos. Environ. X. 181, 186–191. doi:10.1016/j.atmosenv.2018.03.025
Dai, H., Jing, S., Wang, H., Ma, Y., Li, L., Song, W., et al. (2017). VOC characteristics and inhalation health risks in newly renovated residences in Shanghai, China. Sci. Total Environ. 577, 73–83. doi:10.1016/j.scitotenv.2016.10.071
Duo, B., Cui, L., Wang, Z., Li, R., Zhang, L., Fu, H., et al. (2018). Observations of atmospheric pollutants at Lhasa during 2014–2015: Pollution status and the influence of meteorological factors. J. Environ. Sci. 63, 28–42. doi:10.1016/j.jes.2017.03.010
Gao, J. B., Xiao, Z. M., Xu, H., Li, L. W., Li, P., Tang, M., et al. (2021). Characterization and source apportionment of atmospheric VOCs in Tianjin in 2019. Environ. Sci. 42 (01), 55–64. (In Chinese). doi:10.13227/j.hjkx.202006257
Guo, H., Cheng, H. R., Ling, Z. H., Louie, P. K. K., and Ayoko, G. A. (2011). Which emission sources are responsible for the volatile organic compounds in the atmosphere of Pearl River Delta? J. Hazard. Mat. 188 (1–3), 116–124. doi:10.1016/j.jhazmat.2011.01.081
Han, C., Liu, R. R., Luo, H., Li, G. Y., Ma, S. T., Chen, J. Y., et al. (2019). Pollution profiles of volatile organic compounds from different urban functional areas in Guangzhou China based on GC/MS and PTR-TOF-MS: Atmospheric environmental implications. Atmos. Environ. X. 214, 116843. doi:10.1016/j.atmosenv.2019.116843
Han, T. T., Ma, Z. Q., Xu, W. Y., Qiao, L., Li, Y. R., He, D., et al. (2020). Characteristics and source implications of aromatic hydrocarbons at urban and background areas in Beijing, China. Sci. Total Environ. 707, 136083. doi:10.1016/j.scitotenv.2019.136083
Han, T. T., Ma, Z. Q., Li, Y. R., Pu, W. W., Wu, J., Li, Z. M., et al. (2021). Chemical characteristics and source apportionments of volatile organic compounds (VOCs) before and during the heating season at a regional background site in the North China Plain. Atmos. Res. 262, 105778. doi:10.1016/j.atmosres.2021.105778
Huang, C., Chen, C. H., Li, L., Cheng, Z., Wang, H. L., Huang, H. Y., et al. (2011a). Emission inventory of anthropogenic air pollutants and VOC species in the Yangtze River Delta region, China. Atmos. Chem. Phys. 11 (9), 4105–4120. doi:10.5194/acp-11-4105-2011
Huang, Y., Ho, S. S. H., Ho, K. F., Lee, S. C., Yu, J. Z., and Louie, P. K. K. (2011b). Characteristics and health impacts of VOCs and carbonyls associated with residential cooking activities in Hong Kong. J. Hazard. Mat. 186 (1), 344–351. doi:10.1016/j.jhazmat.2010.11.003
Huang, C., Wang, H. L., Li, L., Wang, Q., Lu, Q., de Gouw, J. A., et al. (2015). VOC species and emission inventory from vehicles and their SOA formation potentials estimation in Shanghai, China. Atmos. Chem. Phys. 15 (19), 11081–11096. doi:10.5194/acp-15-11081-2015
Jia, C., Mao, X., Huang, T., Liang, X., Wang, Y., Shen, Y., et al. (2016). Non-methane hydrocarbons (NMHCs) and their contribution to ozone formation potential in a petrochemical industrialized city, Northwest China. Atmos. Res. 169, 225–236. doi:10.1016/j.atmosres.2015.10.006
Klinger, L. F., Li, Q. J., Guenther, A. B., Greenberg, J. P., Baker, B., and Bai, J. H. (2002). Assessment of volatile organic compound emissions from ecosystems of China. J. Geophys. Res. 107, 4603–4619. doi:10.1029/2001jd001076
Kumar, A., Singh, D., Kumar, K., Singh, B. B., and Jain, V. K. (2018). Distribution of VOCs in urban and rural atmospheres of subtropical India: Temporal variation, source attribution, ratios, OFP and risk assessment. Sci. Total Environ. 613–614, 492–501. doi:10.1016/j.scitotenv.2017.09.096
Li, J., Xie, S., Zeng, L. M., Li, L., Li, Y., and Wu, R. (2015). Characterization of ambient volatile organic compounds and their sources in Beijing, before, during, and after Asia-Pacific Economic Cooperation China 2014. Atmos. Chem. Phys. 15 (14), 7945–7959. doi:10.5194/acp-15-7945-2015
Li, H., He, Q., Song, Q., Chen, L., Song, Y., Wang, Y., et al. (2017). Diagnosing Tibetan pollutant sources via volatile organic compound observations. Atmos. Environ. X. 166, 244–254. doi:10.1016/j.atmosenv.2017.07.031
Li, M., Zhang, Q., Zheng, B., Tong, D., Lei, Y., Liu, F., et al. (2019). Persistent growth of anthropogenic non-methane volatile organic compound (NMVOC) emissions in China during 1990–2017: Drivers, speciation and ozone formation potential. Atmos. Chem. Phys. 19, 8897–8913. doi:10.5194/acp-19-8897-2019
Li, Q., Su, G., Li, C., Liu, P., Zhao, X., Zhang, C., et al. (2020). An investigation into the role of VOCs in SOA and ozone production in Beijing, China. Sci. Total Environ. 720, 137536. doi:10.1016/j.scitotenv.2020.137536
Lin, W. L., Xu, X. B., Zheng, X. D., Dawa, J., Baima, C., and Ma, J. (2015). Two-year measurements of surface ozone at Dangxiong, a remote highland site in the Tibetan Plateau. J. Environ. Sci. 31, 133–145. doi:10.1016/j.jes.2014.10.022
Lin, W. L., Zhu, T., Song, Y., Zou, H., Tang, M. Y., Tang, X. Y., et al. (2008). Photolysis of surface O3 and production potential of OH radicals in the atmosphere over the Tibetan Plateau. J. Geophys. Res. 113, D02309. doi:10.1029/2007JD008831
Ling, Z. H., Guo, H., Cheng, H. R., and Yu, Y. F. (2011). Sources of ambient volatile organic compounds and their contributions to photochemical ozone formation at a site in the Pearl River Delta, southern China. Environ. Pollut. 159, 2310–2319. doi:10.1016/j.envpol.2011.05.001
Liu, Y., Shao, M., Zhang, J., Fu, L., and Lu, S. (2005). Distributions and source apportionment of ambient volatile organic compounds in Beijing city, China. J. Environ. Sci. Health Part A 40 (10), 1843–1860. doi:10.1080/10934520500182842
Liu, Y., Shao, M., Lu, S., Chang, C. C., Wang, J. L., and Chen, G. (2007). Volatile organic compound (VOC) measurements in the Pearl River Delta (PRD) region, China. Atmos. Chem. Phys. 7 (6), 1531–1545. doi:10.5194/acp-8-1531-2008
Liu, J., Li, J., Lin, T., Liu, D., Xu, Y., Chaemfa, C., et al. (2013). Diurnal and nocturnal variations of PAHs in the Lhasa atmosphere, Tibetan Plateau: Implication for local sources and the impact of atmospheric degradation processing. Atmos. Res. 124, 34–43. doi:10.1016/j.atmosres.2012.12.016
Liu, Y. F., Kong, L., Liu, X., Zhang, Y., Li, C., Zhang, Y., et al. (2021). Characteristics, secondary transformation, and health risk assessment of ambient volatile organic compounds (VOCs) in urban Beijing, China. Atmos. Pollut. Res. 12 (3), 33–46. doi:10.1016/j.apr.2021.01.013
Lyu, X., Guo, H., Wang, Y., Zhang, F., Nie, K., Dang, J., et al. (2020). Hazardous volatile organic compounds in ambient air of China. Chemosphere 246, 125731. doi:10.1016/j.chemosphere.2019.125731
National Research Council (US) Committee on the Institutional Means for Assessment of Risks to Public Health (1983). Risk assessment in the federal government: Managing the process working papers. Washington DC: National Academies Press US. doi:10.17226/776
Niu, Z. C., Zhang, H., Xu, Y., Liao, X., Xu, L. L., and Chen, J. S. (2012). Pollution characteristics of volatile organic compounds in the atmosphere of haicang district in xiamen city, southeast China. J. Environ. Monit. 12, 1145–1152. doi:10.1039/c2em10884d
Norris, G., Duvall, R., Brown, S., and Bai, S. (2014). EPA positive matrix factorization (PMF) 5.0 fundamentals and user guide. Washington: U.S. Environmental Protection Agency Office of Research and Development.
Paatero, P., and Tapper, U. (1994). Positive matrix factorization: A non-negative factor model with optimal utilization of error estimates of data values. Environmetrics 5, 111–126. doi:10.1002/env.3170050203
Qi, S. H., Zhang, G., Liu, J. H., and Zhang, W. L. (2003). Polycyclic aromatic hydrocarbons (PAHs) of urban atmosphere in Lhasa City and in soil of Lhasa wetland. Environ. Sci. 23 (04), 349–352. (In Chinese).
Ran, L., Lin, W. L., Deji, Y. Z., La, B., Tsering, P. M., Xu, X. B., et al. (2014). Surface gas pollutants in Lhasa, a highland city of Tibet – current levels and pollution implications. Atmos. Chem. Phys. 14 (19), 10721–10730. doi:10.5194/acp-14-10721-2014
Santos, F. M., Gómez-Losada, Á., and Pires, J. C. M. (2021). Empirical ozone isopleths at urban and suburban sites through evolutionary procedure-based models. J. Hazard. Mat. 419, 126386. doi:10.1016/j.jhazmat.2021.126386
Shao, M., Yuan, B., Wang, M., and Zheng, J. Y. (2020). Volatile organic compounds in the atmosphere: Sources and roles in atmospheric chemistry. Beijing: SCIENCE PRESS. (In Chinese).
Shao, P., An, J., Xin, J., Wu, F., Wang, J., Ji, D., et al. (2016). Source apportionment of VOCs and the contribution to photochemical ozone formation during summer in the typical industrial area in the Yangtze River Delta, China. Atmos. Res. 176, 64–74. doi:10.1016/j.atmosres.2016.02.015
Shu, Y. J., He, M., Ji, J., Huang, H. B., Liu, S. W., and Leung, D. Y. C. (2019). Synergetic degradation of VOCs by vacuum ultraviolet photolysis and catalytic ozonation over Mn-xCe/ZSM-5. J. Hazard. Mat. 364, 770–779. doi:10.1016/j.jhazmat.2018.10.057
Song, Y., Shao, M., Liu, Y., Lu, S., Kuster, W., Goldan, P., et al. (2007). Source apportionment of ambient volatile organic compounds in Beijing. Environ. Sci. Technol. 41 (12), 4348–4353. doi:10.1021/es0625982
Song, M. D., Tan, Q. W., Feng, M., Qu, Y., Liu, X. G., An, J. L., et al. (2018). Source apportionment and secondary transformation of atmospheric nonmethane hydrocarbons in chengdu, southwest China. J. Geophys. Res. Atmos. 123, 9741–9763. doi:10.1029/2018jd028479
Tang, X. Y., Zhang, Y. H., and Shao, M. (2006). Chemistry of the atmospheric environment. 3rd Ed. Beijing: Higher Education Press. (In Chinese).
Tang, J. H., Chan, L. Y., Chan, C. Y., Li, Y. S., Chang, C. C., Liu, S. C., et al. (2007). Characteristics and diurnal variations of NMHCs at urban, suburban, and rural sites in the Pearl River Delta and a remote site in South China. Atmos. Environ. X. 41 (38), 8620–8632. doi:10.1016/j.atmosenv.2007.07.029
US EPA (2009). Guidance for superfund volume I human health evaluation manual (Part F, supplemental guidance for inhalation risk assessment). EPA-540-R-070-002, OSWER 9285.9287-9282).
Wang, Y., Xu, X. B., Mao, T., and Zhang, D. Q. (2009). “Preliminary detection results of volatile organic compounds in the Atmosphere of Qomolangma region,” in Proceedings of the 26th Annual Meeting of The Chinese Meteorological Society of Atmospheric Composition and Weather (Hangzhou: Climate and Environmental Change), 1. (In Chinese).
Wang, Y., Ren, X., Ji, D., Zhang, J., Sun, J., and Wu, F. (2012). Characterization of volatile organic compounds in the urban area of Beijing from 2000 to 2007. J. Environ. Sci. 24 (1), 95–101. doi:10.1016/s1001-0742(11)60732-8
Warneke, C., de Gouw, J. A., Holloway, J. S., Peischl, J., Ryerson, T. B., Atlas, E., et al. (2012). Multiyear trends in volatile organic compounds in Los Angeles, California: Five decades of decreasing emissions. J. Geophys. Res. 117, 1–10. doi:10.1029/2012jd017899
Wei, W., Wang, S., Hao, J., and Cheng, S. (2011). Projection of anthropogenic volatile organic compounds (VOCs) emissions in China for the period 2010–2020. Atmos. Environ. X. 45 (38), 6863–6871. doi:10.1016/j.atmosenv.2011.01.013
Xia, M. F., Li, H., Li, J. J., Chai, F. H., Li, H. J., Zhang, Y. J., et al. (2014). Characteristics and health risk assessment of atmospheric benzene homologues in summer in the northeastern urban area of Beijing, China. Asian J. Ecotoxicol. 9 (06), 1041–1052. (In Chinese). doi:10.7524/AJE.1673-5897-20140611001
Xue, L. K., Wang, T., Guo, H., Blake, D. R., Tang, J., Zhang, X. C., et al. (2013). Sources and photochemistry of volatile organic compounds in the remote atmosphere of Western China: Results from the Mt. Waliguan observatory. Atmos. Chem. Phys. 13 (17), 8551–8567. doi:10.5194/acp-13-8551-2013
Yang, T., Li, D. D., Shan, X. L., Wang, X. Z., Zhang, W. Q., and Zhang, Y. J. (2017). Pollution characteristics, source apportionment and health risk assessment of benzene homologues in the ambient air of a typical urban area in Beijing. Asian J. Ecotoxicol. 12 (05), 79–97. (In Chinese). doi:10.7524/AJE.1673-5897.20170217001
Yang, Y., Ji, D., Sun, J., Wang, Y., Yao, D., Zhao, S., et al. (2019). Ambient volatile organic compounds in a suburban site between Beijing and Tianjin: Concentration levels, source apportionment and health risk assessment. Sci. Total Environ. 695, 133889. doi:10.1016/j.scitotenv.2019.133889
Yao, Q., Cai, Z. Y., Ma, Z. Q., Han, G. Y., Liu, J. L., and Han, S. Q. (2017). Variation characteristics and health risk assessment of BTEX in Tianjin. China Environ. Sci. 37 (9), 3276–3284. (In Chinese).
Yin, X., de Foy, B., Wu, K., Feng, C., Kang, S., and Zhang, Q. (2019). Gaseous and particulate pollutants in Lhasa, Tibet during 2013–2017: Spatial variability, temporal variations and implications. Environ. Pollut. 253, 68–77. doi:10.1016/j.envpol.2019.06.113
Yu, X. L., Tang, J., Zhou, L. X., Xue, H. S., and Xue, X. J. (2001). Emission characteristics and sources of non-methane hydrocarbons at Lhasa area. Acta Sci. Circumstantiae 21, 203–207. (In Chinese).
Yu, J. Y., Han, Y., Chen, M. L., Zhang, H. F., Chen, Y., and Liu, J. G. (2022). Characteristics and source apportionment of ambient VOCs in Lhasa. Environ. Sci. 43 (01), 113–122. (In Chinese). doi:10.13227/j.hjkx.202104038
Yuan, B., Shao, M., Lu, S. H., and Wang, B. (2010). Source profiles of volatile organic compounds associated with solvent use in Beijing, China. Atmos. Environ. X. 44, 1919–1926. doi:10.1016/j.atmosenv.2010.02.014
Yuan, B., Hu, W. W., Shao, M., Wang, M., Chen, W. T., Lu, S. H., et al. (2013). VOC emissions, evolutions and contributions to SOA formation at a receptor site in eastern China. Atmos. Chem. Phys. 13 (17), 8815–8832. doi:10.5194/acp-13-8815-2013
Zhang, Y., Wang, X., Barletta, B., Simpson, I. J., Blake, D. R., Fu, X., et al. (2013). Source attributions of hazardous aromatic hydrocarbons in urban, suburban and rural areas in the Pearl River Delta (PRD) region. J. Hazard. Mat. 250, 403–411. doi:10.1016/j.jhazmat.2013.02.023
Zhang, J., Sun, Y., Wu, F., Sun, J., and Wang, Y. (2014). The characteristics, seasonal variation and source apportionment of VOCs at Gongga Mountain, China. Atmos. Environ. X. 88, 297–305. doi:10.1016/j.atmosenv.2013.03.036
Zhang, Z., Zhang, Y. L., Wang, X. M., Lu, S. J., Huang, Z., Huang, X. Y., et al. (2016). Spatiotemporal patterns and source implications of aromatic hydrocarbons at six rural sites across China’s developed coastal regions. J. Geophys. Res. Atmos. 121 (11), 6669–6687. doi:10.1002/2016jd025115
Zhang, Y. X., An, J. L., Wang, J. Y., Shi, Y. Z., Liu, J. D., Liang, J. S., et al. (2017). Variation characteristics and health risk assessment of BTEX in the atmosphere of northern suburb of nanjing. Environ. Sci. 38 (02), 453–460. (In Chinese). doi:10.13227/j.hjkx.201607108
Zhang, X., Ding, X., Wang, X., Talifu, D., Wang, G., Zhang, Y., et al. (2019). Volatile organic compounds in a petrochemical region in arid of NW China: Chemical reactivity and source apportionment. Atmosphere 10 (11), 641. doi:10.3390/atmos10110641
Zhang, L. H., Wang, X. Z., Li, H., Cheng, N. L., Zhang, Y. J., Zhang, K., et al. (2021). Variations in levels and sources of atmospheric VOCs during the continuous haze and non-haze episodes in the urban area of beijing: A case study in spring of 2019. Atmos. (Basel). 12, 171–186. doi:10.3390/atmos12020171
Keywords: Tibet Plateau, benzene series, atmospheric reactivity, ozone formation potential, health risk, VOCs
Citation: Guo S, Wang Y, Zhang T, Ma Z, Ye C, Lin W, Yang Zong DJ and Yang Zong BM (2022) Volatile organic compounds in urban Lhasa: variations, sources, and potential risks. Front. Environ. Sci. 10:941100. doi: 10.3389/fenvs.2022.941100
Received: 11 May 2022; Accepted: 20 July 2022;
Published: 23 August 2022.
Edited by:
Gen Zhang, Chinese Academy of Meteorological Sciences, ChinaReviewed by:
Xingru Li, Capital Normal University, ChinaPengfei Liu, Research Center for Eco-environmental Sciences (CAS), China
Copyright © 2022 Guo, Wang, Zhang, Ma, Ye, Lin, Yang Zong and Yang Zong. This is an open-access article distributed under the terms of the Creative Commons Attribution License (CC BY). The use, distribution or reproduction in other forums is permitted, provided the original author(s) and the copyright owner(s) are credited and that the original publication in this journal is cited, in accordance with accepted academic practice. No use, distribution or reproduction is permitted which does not comply with these terms.
*Correspondence: Weili Lin, bGlud2xAbXVjLmVkdS5jbg==
 Shuzheng Guo
 Yaru Wang2
 Chunxiang Ye
 Weili Lin