 Bhupendra Pratap Singh1*
 Pallvi Rana2Nishtha Mittal3Sumit Kumar4
 Mohammad Athar5,6
 Zainularifeen Abduljaleel5,6Shakilur Rahman7
- 1Department of Environmental Studies, Deshbandhu College, University of Delhi, New Delhi, India
- 2Department of Business School, University of Sydney, Sydney, NSW, Australia
- 3Department of Commerce, Panjab University, Chandigarh, India
- 4School of Social Science, Jawaharlal Nehru University, New Delhi, India
- 5Science and Technology Unit, Umm Al-Qura University, Makkah, Saudi Arabia
- 6Department of Medical Genetics, Faculty of Medicine, Umm Al-Qura University, Makkah, Saudi Arabia
- 7Department of Medical Elementology and Toxicology, School of Chemical and Life Sciences, Jamia Hamdard, New Delhi, India
The COVID-19 pandemic that emerged in Wuhan city of China in December 2019 has adversely impacted the health and the economy, society, and other significant spheres of the human environment. The pandemic has severely impacted economic activities, especially the industrial production, transportation, tourism, and hoteling industries. The present study analyses the impact of varying severity of lockdowns of economic activities during various phases of the pandemic on the water quality of the Yamuna river on parameters like pH values, biological oxygen demand, chemical oxygen demand, dissolved oxygen, total suspended solids, and electrical conductivity. The study has found a significant improvement in water quality parameters with closing economic activities during lockdowns. The average levels of concentration of these parameters of water quality were quite low during the lockdown period at 7.26 (pH value), 31.32, 136.07, 7.93, 30.33 mg/L, and 1500.24 μS/cm compared to pre lockdown periods levels at 7.53 (pH), 39.62, 116.52, 6.1, 57.2 mg/L and 1743.01 μS/cm for biological oxygen demand, chemical oxygen demand, dissolved oxygen, total suspended solids, and electrical conductivity, respectively. In addition, the study has found a strong significant positive correlation between COD with BOD and TSS during the lockdown period. The major findings from the present study could be instrumental in making environmentally sustainable policies for the country’s economic development. There is also a huge scope of scaling up of the study at the national level to analyze the health of the rivers in the backdrop of lockdowns.
Introduction
COVID-19 pandemic started with the detection of a novel coronavirus in Wuhan City in late December 2019 China. The pandemic has been found to have impacted every aspect of human life, health, social and economic (Arora et al., 2020; Conforti et al., 2020; Sohrabi et al., 2020; Travaglio et al., 2020; Wu et al., 2020). The World Health Organization (WHO) declared the outbreak a Public Health Emergency of International Concern on January 302020, named the novel Coronavirus disease COVID-19 on February 11, 2020, and finally declared it a pandemic on March 11, 2020 (Rothan and Byrareddy, 2020; WHO, 2020; Singh et al., 2021a). As of January 10, 2022, the confirmed cases of the COVID-19 pandemic have surpassed 308 million, with over 5.5 million deaths and about 260 million instances of recovery, leaving around 42 million active cases globally (Worldo meters, 2021). The evolving nature of the COVID-19 pandemic due to the continuous emergence of new variants of varying severity and infectivity has multifariously complicated the economic impact estimation (Bachman, 2020; Sarkis et al., 2020).
Countries across the globe have implemented nationwide lockdowns with restrictive measures, coercing people to work from home (whenever possible) and observing social distancing to avoid the unhindered escalation of the pandemic (Singh et al., 2021b). However, it must be noted that in several studies, the lockdowns which negatively impacted the economy have led to sudden revival and restoration of the physical environment and its various components like air and water (Beine et al., 2020; Huang et al., 2020; Ma et al., 2020; Bera et al., 2020; Ray et al., 2020; Sharma et al., 2020; Yongjian et al., 2020; Singh et al., 2021a; Singh and Kumar, 2021; Singh et al., 2022). In addition, several studies have attempted to estimate the economic effects of the pandemic across countries, such as Wiener Zeitung, 2020 (5–11%) for Australia, Ministry of Finance of Finland, 2020 (4%) for Finland, Rapport Cazeneuve, 2020 (2.4%) for France, (Ministry of Transport and Local Government, 2020 (1.1%) for Iceland, ANCI, 2020 (21%), respectively.
While negative effects of economic growth on the environment are well established, it is quite intriguing that even high levels of pollution can hinder economic growth and inflict catastrophic costs in terms of lives and property (Lei Ding et al., 2015). The understanding of the complex relationship between economic development and environmental degradation is further obfuscated and fragmented by disciplinary biases. Cracolici et al. (2010) claimed that only a few countries had managed to achieve simultaneous favorable environmental health and high levels of economic development. Gross Domestic Production (GDP) per capita ignores the considerations of the impact of a polluted environment on human lives and provides a very narrow and limited measure of well-being (Hobijn and Franses 2001; Neumayer 2003; Marchante and Ortega 2006).
A report released by the World Bank indicated a significant relationship between a reduction in economic growth, losing between 0.5 and 2.0 percent of economic growth, and polluted rivers (Desbureaux et al., 2019). The relationship between economic growth and water pollution has been explored quite extensively (Grossman and Krueger, 1995; Shen, 2006; Diao, Zeng, Tam, and Tam, 2009; Lee, Chiu, and Sun, 2010; Jayanthakumaran and Liu, 2012; Choi et al., 2015). In this backdrop, the complete shutdown of economic activities under the COVID-19 pandemic has had two massive environmental impacts. First, it has dramatically improved the air and water quality and reduced our material consumption, water usage, and waste production. Second, the environment underwent a partial and limited self-revival. This phase helped me better understand the magnitude of the contribution of even the non-industrial sources of pollution to the environment, especially water and air (Singh et al., 2014; Singh et al., 2016; Hader et al., 2020; Singh et al., 2021b,c). The improvement in the river water quality has been reported worldwide, including in India (Dhar et al., 2020; Mitra et al., 2020).
Recent studies claimed that the water quality and quantity in many rivers have consequently improved in a short span of time during the lockdown period, especially in river Ganga, India, 2020 (Dutta et al., 2020; Shukla et al., 2021). Similar to river water quality, domestic and non-domestic water sectors were also affected across the major economic sectors during the COVID-19 (Cooley et al., 2020; Balamurugan et al., 2021). However, few studies reported a variation in demand for domestic and non-domestic water consumption during the COVID-19 (Daijiworld, 2020; Sivakumar, 2021). A report released by the World Bank indicated a significant relationship between a reduction in economic growth, losing between 0.5 and 2.0 percent of economic growth, and polluted rivers (Desbureaux et al., 2019). However, a study conducted in Pakistan revealed that the use of technology and renewable energy may help boost economic development and reduce environmental pollution (Abid et al., 2020). Furthermore, technology indicated a significant positive association between green growth, and ISO 14001 (Abid et al., 2021).
Improved water quality has been reported on beaches of Bangladesh, Maldives, Malaysia, Indonesia, and Thailand (Kundu, 2020; Rahman et al., 2020) mainly due to a significant reduction in pollution load from major sources of water pollution in the rivers, such as industrial water waste disposal, crude oil, heavy metals, and plastic during the lockdown period (Ghildyal et al., 2020; Hader et al., 2020; Manuel and Zambrano, 2020). The pH level and values of electric conductivity (EC), Biological oxygen demand (BOD), and chemical oxygen demand (COD) have been reported to have declined by about 1–10%, 33–66%, 45–90%, and 33–82% across monitoring stations in the world during the lockdown period as compared to pre lockdown period (Cripps, 2020; Zambrano-Monserrate et al., 2020). Cooper (2020) conducted a study on the textile sector around the globe and reported that the total industrial water consumption massively declined during the lockdown period. A similar finding was reported in the case of the river Ganges, a highly polluted river in India, which witnessed a drastic reduction in pollutant load during the lockdown period (Mani, 2020). Despite the showing an improvement in water quality parameters in COVID-19, few studies claimed that environmental pollution load reported an increase in water bodies which were attributed to pharmaceuticals and plastic pollution (Gwenzi et al., 2022).
It is pertinent to study the effects of the COVID-19 lockdowns on the water quality of rivers in the short and long terms. The Yamuna River in National Capital Region is considered one of the most polluted rivers in India and the world due to the rapid increase in industrialization, urbanization, and high-density population growth (Upadhyay et al., 2011; Sharma et al., 2020). Due to very high levels of water pollution in this river, it is interesting to study the impact of lockdowns on the water quality of this river which passes through the northern industrial region of India. In the present study, the concentrations of pH, EC, DO, BOD, SS, and COD have been measured at monitoring sites on the bank of the Yamuna river. The water quality parameters were compared between the pre lockdown (previous year), during the lockdown, and post lockdown period. The study is unique as similar studies on the interaction of economic activities and water pollution in the catchment of the Yamuna river are lacking. The present investigation focuses mainly on evaluating the relationship between economic activities and water quality parameters during the COVID-19 pandemic on the upper stream of the Yamuna river in Haryana.
2 Materials and Methods
2.1 Study Area
The Yamuna river is the major tributary of the Ganga river. It is also considered a sacred river in India. It originates from the Yamunotri glacier near Bandar Punch (38°59´N 78°27´E) in the Mussoorie (lower range of the Himalayas) at an elevation of about 6,387 m above mean sea level (MSL) in the Uttarkashi district (Sharma and Kansal, 2011). The Yamuna River has a vast catchment area of 366,223 km2. The Yamuna enters Haryana near the Kalesar forest in the district of Yamuna Nagar and flows through the districts of Karnal, Panipat, Sonipat, and Faridabad before it enters the National Capital Region of Delhi. The major contributory industries to the water pollution in the Yamuna river are pulp and paper, sugar, tannery, steel plant distillers, textiles, leather, rubber, chemicals, glass, pharmaceuticals, and oil refineries, food, and discharge of polluted water from thermal power plants. The current study focuses on the analysis of water quality parameters of the Yamuna river in the state of Haryana only.
2.1.1 Conceptual Framework of the Water Quality Index
Water quality assessments gauge has categories in different categories according to suitability for a specific purpose (bathing, industrial or domestic purposes) which is adversely affected by any pollutants within it (Bagchi and Bussa, 2011). Several studies have developed methods for measuring water quality (Tyagi et al., 2013). The different measured variables are standardized and converted into a composite number that best denotes the suitability of the use of a particular water sample (Kumar and Dua, 2009). In addition, various agencies such as European Community, World Health Organization, Central Pollution Control Board (CPCB), and Indian Standard Specifications for drinking water have formulated their own respective standards regarding the permissible limits of measured parameters for rating a sample as different categories for specific use (Sargaonkar and Deshpande, 2003; Bharti and Katyal, 2011; Rout, 2017).
2.2 Data Collection
The variations in the water quality of the Yamuna river have been analyzed for the pre-lockdown, lockdown, and post-lockdown periods. The study has used secondary data due to lockdown-related restrictions. The data was directly procured from the “Haryana Pollution Control Board” department from November 1, 2019, to January 10, 2021 (https://hspcb.gov.in/yamuna). The pandemic duration has been was classified into three periods: pre lockdown, during the lockdown, and post lockdown.
The data for water quality was obtained between November 1, 2019, to March 23, 2020, which was referred to as the “pre-lockdown period” while the time between March 25 to May 31, 2020, was referred to as the “during lockdown”, and the “post-lockdown” period refers to the time between June 1, 2020, to January 10, 2021. In the present study water quality data for the corresponding year, 2019 were compared with the years, 2020 and 2021. Water quality data has been procured from 13 different monitoring stations in Haryana state namely Gharaunda Drain before the meeting (Village Ali Asgarpur), Gharaunda Drain after the meeting (Village Ali Asgarpur), Drain No. 2 before meeting Panipat drain (near village Dadola), Panipat Drain (Village Sewah), Drain No.2 after meeting discharge of Panipat drain (village Simla, Gujran), Drain No. 2 after meeting Gharanunda drain at G.T. Road (Panipat), River Yamuna before meeting (Village Sanjoli), river Yamuna (village Khojkipur), Nohra Drain (Village Kakoda), NWMP station (Delhi Parallel Branch), NWMP station (Village Khojkipur) River Yamuna. Data for water quality parameters have been obtained from thirteen representatives for each monitoring station.
The present study analyzed the data (n = 113) for 15 water quality monitoring stations in Haryana to evaluate the variability in the concentration levels of water quality parameters during the pandemic period. The parameters used for this research are pH value, dissolved oxygen (DO), Biological Oxygen Demand (BOD), Chemical Oxygen Demand (COD), Total Suspended Solid (TSS), and Electrical Conductivity (EC). According to the Bureau of Indian Standard (IS 2296:1992), recommended by CPCB (Central Pollution Control Board), a table was made depicting the quality of surface water (Supplementary Table S1). Haryana’s economic activities data were taken from Economic Survey, Haryana, 2020.
2.3 Statistical Data Analysis
To understand the changes in the individual water parameters between the pre- lockdown, during the lockdown, and post lockdown periods, statistical analysis was performed using the hypothesis testing (t-test) tool from SPSS version 26.0 (SPSS Inc., Chicago, IL, United States). Using MS-Excel Statistical attributes, trend analysis and box-whisker plots were computed and visualized (Kumar et al., 2014; Kumar et al., 2015). The Decimal Point Normalization (also sometimes referred to as the Floating-Point Number) technique is among the most frequently used normalization techniques (Nardo et al., 2009) and was employed to rank the drains during the pre-lockdown and lockdown periods based on the resulting additive aggregation (arithmetic mean) scores (Tate, 2012). In this normalization method, the maximum number of decimal points to be moved is dependent on the maximum values of the attribute data (Han et al., 2011; Punia et al., 2015), and the data attributes are transformed by simply moving the decimal points of the original data (Kumar et al., 2014a).
3 Results and Discussion
3.1 Relationship Between Economic Growth and Water Quality
The economic impact of the COVID-19 is supposed to vary across the countries depending upon the structural strengths of individual economies, although all the countries would face an economic decline. In the current study, Haryana’s Gross State Value Added (GSVA), a state of India, grew at 8.0% in 2019–20, whereas it declined by 5.2% for 2020–21 (Government of Haryana, 2021). The decline was main contributed by a major decline in GVA of the Industrial Sector (−9.6%) and the Services Sector (−5.7%) for the year 2020–21 (Supplementary Table S1).
On the other hand, the water quality parameters such as TSS, BOD, and COD have been observed to have improved in the year 2020 during the lockdown period compared to the corresponding period in 2019 (Figure 1). This improvement in the water quality parameters of the Yamuna river can be partly attributed to the reduction in the discharge of industrial effluent during the lockdown period. It can be highlighted here that the discharge from industries was the primary source of pollution in the Yamuna river water as compared to other sources like domestic and agricultural activities. Post lockdown, the water quality of the Yamuna river was observed to have again declined with the resumption of industrial and other environmentally harmful activities. A comparative studies Table 1 has been presented for the relationship between economic growth and water quality parameters during the pandemic period across the world.
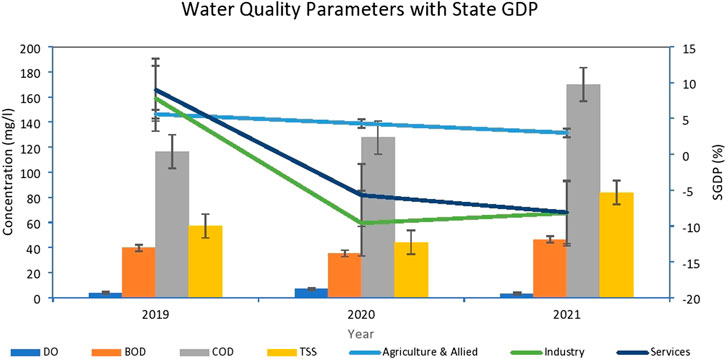
FIGURE 1. Water quality parameters with state GDP for the respective years.
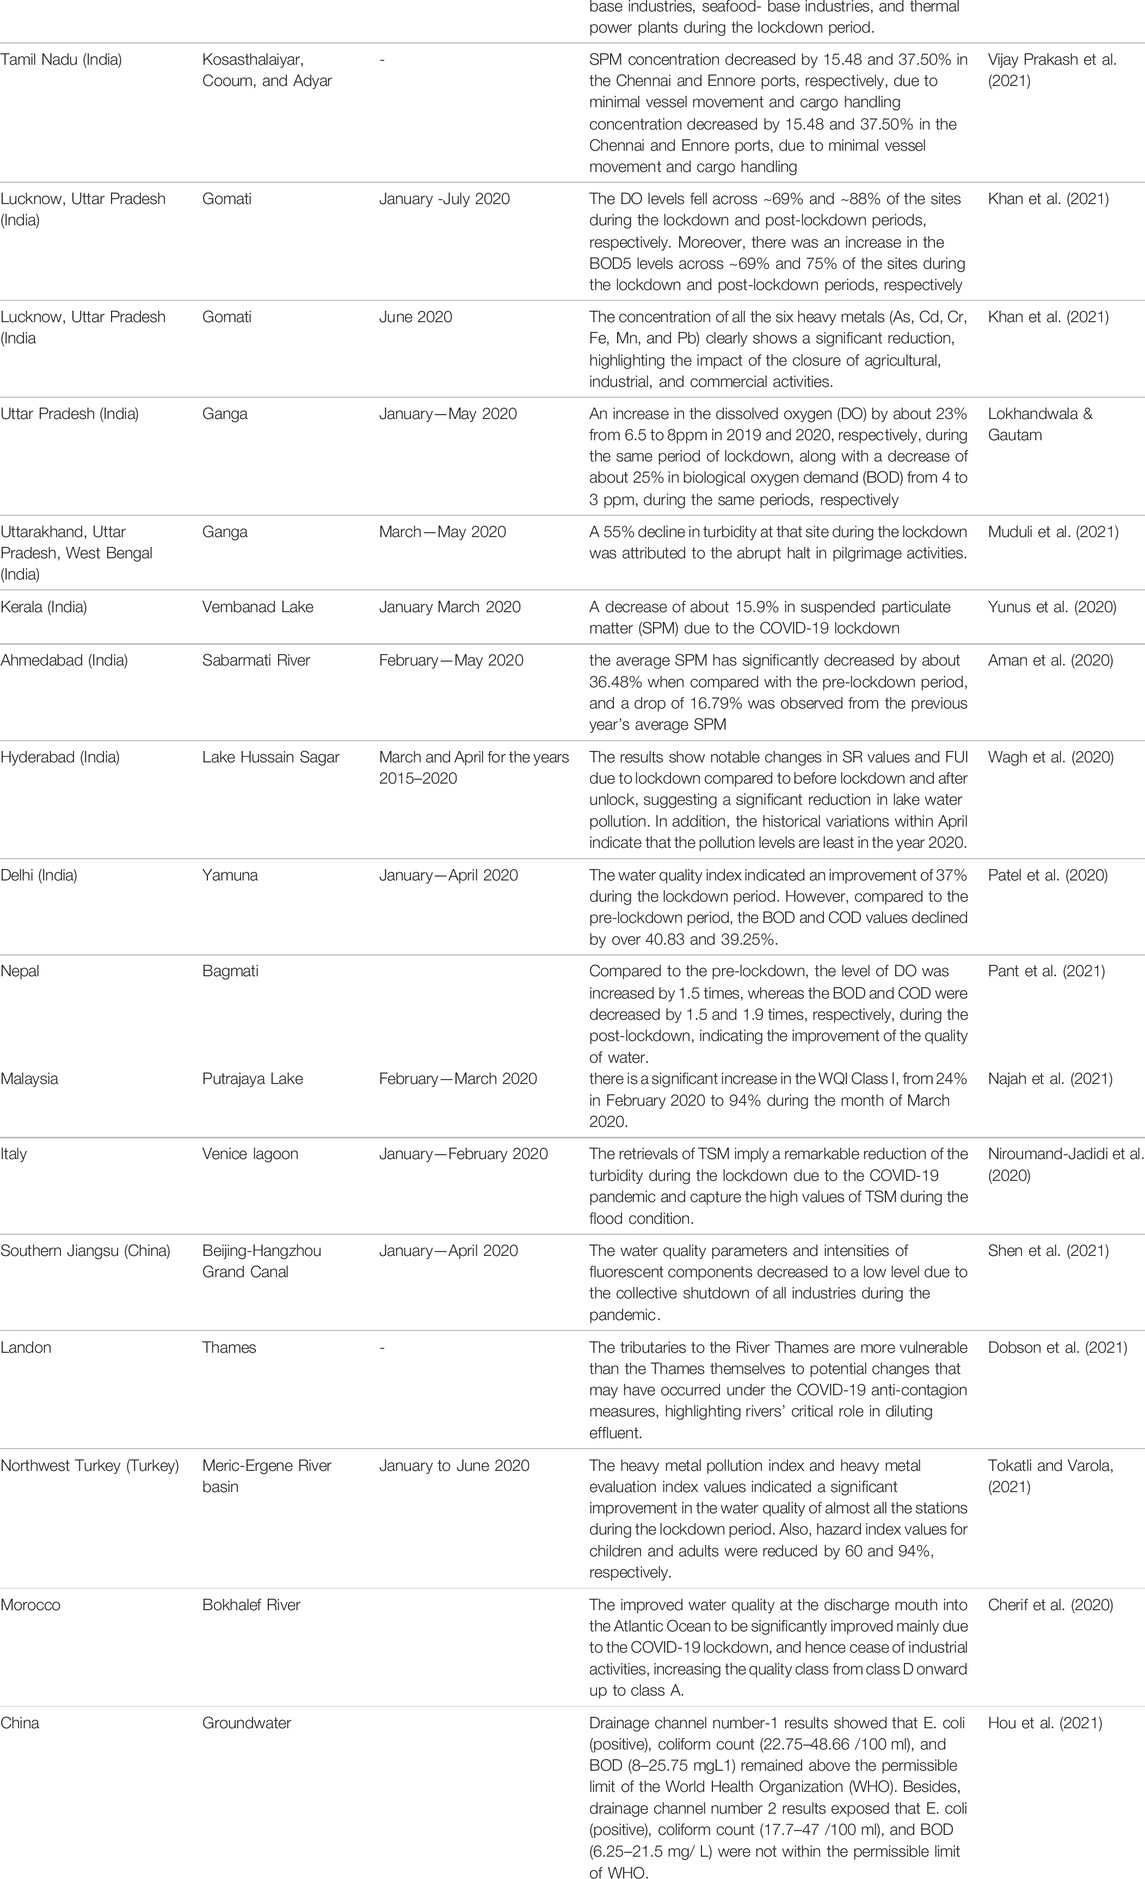
TABLE 1. A comparative study of variation of environmental water quality parameters in different cities across the world during the pandemic.
3.2 Water Quality in the Pre-, During, and Post Lockdown Periods
In developing countries like India, water pollution is a common phenomenon where industrial and domestic wastes are dumped directly into the rivers without proper treatment (Yunnus et al., 2020). As a result, India’s water bodies, especially the Yamuna river, have poor water quality. Moreover, most rivers and streams flowing by the major industrial sites have turned into sewer canals, making their rejuvenation and treatment very difficult. In this study, we have also evaluated the varying impacts of different phases of the lockdowns, pre-lockdown, during, and post lockdowns on the water quality of the Yamuna river. (Figure 2). The minimum, maximum, and mean values of Physico-chemical variables examined in this study are shown in Table 2. It can be mentioned here that several studies have underlined the positive impact of the lockdowns on river water qualities in many rivers for a relatively short period of few months, especially in the Ganga and the Yamuna rivers (Jain, 2015; Dutta et al., 2020; Singhal and Matto, 2020; Somani et al., 2020; Shukla et al., 2021).
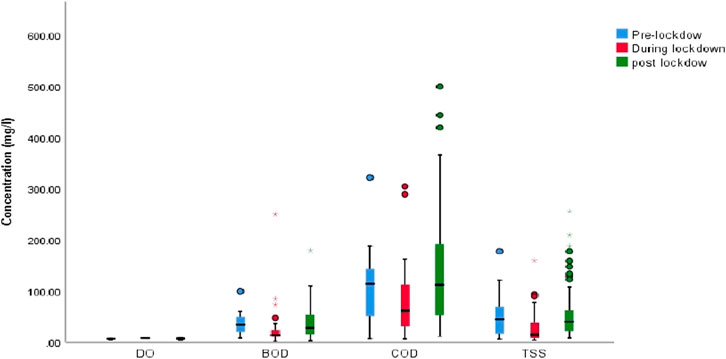
FIGURE 2. Water quality parameters for pre-, during, and post lockdown period in Yamuna river.
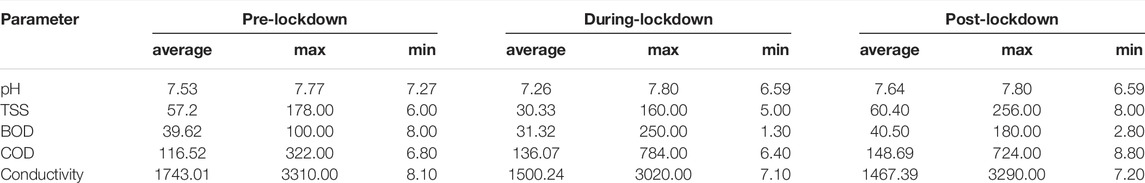
TABLE 2. Mean, maximum and minimum values of water quality variables determined in the pre-lockdown, during the lockdown, and post-lockdown periods.
3.3 Yamuna River’s pH Level
The average values of pH of the Yamuna river water were found to be 7.53, 7.26, and 7.64 for pre-lockdown, during the lockdown, and post-lockdown periods, respectively. The maximum pH values were reported to be 7.77, 7.80, and 7.81 during these three time periods (Figure 3A). Moreover, the pH values for all the monitoring stations were the lowest during the lockdown period. The pH values of the Yamuna river water were observed to be alkaline in nature which varied between 7.2 and 7.8 from the pre- to post-lockdown period. In the post-lockdown period, the increase in pH values was probably due to an increase in the inflow of organic waste products from the resumption of anthropogenic activities. The highest pH value (8.33) among the monitoring stations was observed at drain No. 2 at village sanjoli and the lowest (6.44) at village Khojkipur during the lockdown period. The present study indicated that the values of pH were correlated with primary water quality criteria for bathing water and designated usable water quality (https://cpcb.nic.in/wqm/Primary_Water_Quality_Criteria.pdf). During the lockdown period, the pH values were observed lower than the threshold limit (6.5–8.5) at all the monitoring stations across the designated stretch of the Yamuna river. Therefore, an alkaline pH was observed during the lockdown period. According to Yashvardhini et al. (2020), an alkaline pH indicates that industrial wastes are composed of various components which could promote acidity.
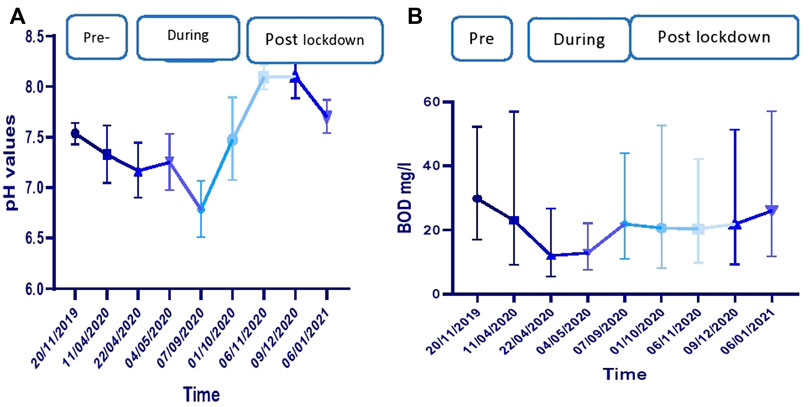
FIGURE 3. Time series plot for the pH and BOD values during the pandemic in Yamuna river.
3.4 Yamuna River’s Biological Oxygen Demand Level
Biological Oxygen demand (COD) indicates the amount of dissolved organic matter and is an indicator of water pollution. The present study has found a drastic decline in BOD values during the lockdown period compared to pre-lockdown and post-lockdown periods. The mean values of BOD were found to be 39.62, 30.33, and 40.50 mg/L for pre-, during, and post lockdown periods, respectively (Figure 3B). Furthermore, reduction in the BOD levels during the lockdown period was reported by Dutta et al. (2020).
One of the significant factors behind the decline in BOD levels in the Yamuna river water is the closure of industries during the lockdown period. Another study on the Yamuna River water quality reported that the average BOD values increased by 7.09% during the same period and indicated quite a significant impact of domestic sewage load on the BOD levels in the river water. Khan et al. (2021) have also reported an increase in the average values of BOD by 19.44% in the post lockdown period. The findings of the present study indicate that values of BOD declined by 30.32% during the lockdown and increased by 39.5% during the post lockdown period, as also reported by Khan et al. (2021).
Moreover, another study conducted on the Ganges River water quality indicated a reduction of BOD values by 35–40% during the lockdown period due to the closure of automobile workshops, floating population, saree dyeing units, reduction in cremation, closure of hotels, and restaurants, and check on dumping of solid wastes into the river water. Besides, due to the shutdown of lift canals, the flow of the river water also surged (Time of India, 2020). Chauhan et al. (2020) reported that before the lockdown, the BOD ranged between 1.24 mg/L to 5.56 mg/L, whereas during the lockdown period, it ranged between 1.05 mg/L to 4.32 mg/L in the surface waters (river and canal) of Rajasthan. A similar result was reported in another study where BOD levels declined by 9.46, 24.25, and 5.59% in the Gomti, the Hindan, and the Ganges rivers, respectively (Ghildyal et al., 2020).
3.5 Yamuna River’s Chemical Oxygen Demand Level
Chemical Oxygen demand (COD) indicates the amount of dissolved susceptible matter and is an indicator of water pollution. The major sources of COD are industries and wastewater treatment plants which were halted during the lockdown period. An increase in the level of COD severely affects dissolved oxygen, which adversely affects aquatic life (Yashvardhini et al., 2020). The present study has found the average values of COD to be 116.52, 136.07, and 148.69 mg/L, for pre-lockdown, during the lockdown, and post-lockdown periods, respectively. Similar results were reported by Yashvardhini et al. (2020). The maximum values of COD were 322.00, 784.00, and 724.00 mg/L for the pre-lockdown, during the lockdown, and post-lockdown periods respectively in the upper stream of Yamuna river (Figure 4A).
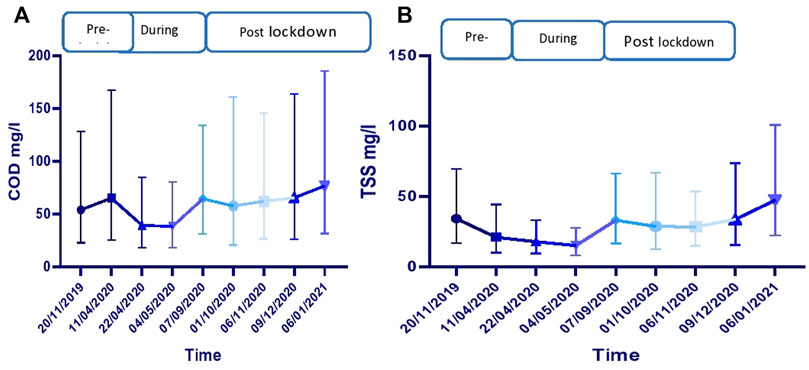
FIGURE 4. Time series plot for the COD and TSS values during the pandemic in Yamuna river.
COD concentration declined during the lockdown period compared to pre-and post- lockdown periods. The high values of COD could be because of the rise of discharge of the untreated and moderately treated wastewater from the municipal sewage and a slower speed of dissolution in the pre-lockdown and post-lockdown periods. A study, conducted on the Ganges River during the pre-lockdown period reported the values of COD in the range between 6.14 and 17.7 mg/L, which was much lower than the current study (Dutta et al., 2020). The low levels of COD in the Ganges river indicated a complete stoppage in the flow of industrial pollutants owing to the complete lockdown, which significantly increased the water quality during the lockdown period. As a result of a halt in industrial activities and stoppage of discharge of pollutants and polluted water in the river, the Yamuna River’s water quality has significantly improved during the lockdown period (Times of India, 2022). A study in Rajasthan indicated a general decrease in COD between 7.0 and 41.0 mg/L during the lockdown period in rivers and canals of the state (Chauhan et al., 2020). Another study conducted on COD levels in the Yamuna river water reported that the COD levels declined by 24% during the lockdown period (Ghildyal et al., 2020).
3.6 Yamuna River’s Dissolved Oxygen Level
Dissolved oxygen (DO) indicates oxygen availability in the water, which is opposite to biological oxygen demand (BOD). The higher value of DO refers to better water quality which is necessary for water bodies in order to sustain aquatic life. The average concentrations of DO in the Yamuna river water were observed to be 6.1, 7.93, and 6.12 mg/L for pre-lockdown, during the lockdown, and post-lockdown periods, respectively. The maximum values were found to be 7.4, 8.4, 9.0 mg/L, whereas the minimum was 4.3, 7.1, 3.6 mg/L for the same periods. Similar values were reported in another study during the lockdown phase from 0 to 8.1 mg/l with a mean value of 3.2 mg/L (Yashvardhini et al., 2020). The drastic improvement in DO values during the lockdown period indicated a significant reduction in the effluent from the industrial and agricultural activities, accounting for the rejuvenation of the DO levels during the same period.
A study conducted in the Damodar river reported the DO levels in the range of 4.2–5.67 mg/L with an average value of 4.85 ± 0.49 mg/L for the pre-lockdown period, and 6.15–815 mg/L with an average value of 7.31 ± 0.59 mg/L for the during lockdown period (Chakraborty et al., 2021). Several studies reported a drastic improvement in DO levels in river waters and thus improved water quality of the Yamuna River during the lockdown period where the values of dissolved oxygen (DO) were found to be in a range from 2.3 to 4.8 mg/L, which can be considered significant as compared to the previous year, 2019 (CPCB 2020; UPPCB 2020; Khan et al., 2021). A study conducted in the Ganga River reported a slight decrease in DO levels at all the monitoring sites in contrast to the present study, due to a significant increase in the turbidity and suspended solids which were contributed by heavy rain spells (60%) during the lockdown period (Dutta et al., 2020).
3.7 Total Suspended Solid Level in Yamuna River
The present study has found the average value of TSS to be 57.2, 30.33, and 60.40 mg/L for the pre-lockdown, the during the lockdown, and post-lockdown periods, respectively. The values of TSS varied from 6.0 to 178.0, 5.0 to 160.0, and 8.0–256.0 mg/L during these three time periods, respectively (Figure 4B). In the Damodar river, India, a study reported TDS values ranging from 665.6 to 806.4 mg/L and 480–563.2 mg/L for three comparable time periods (Chakraborty et al., 2021). TSS results indicated a sharp decline of 29.33% during the lockdown compared to the pre-lockdown period. A similar result was reported in the Ganga River where the TSS declined by 33.89% during the same period due to a decrease in industrial waste dumping (Ghildyal et al., 2020). However, the TSS value increased by 59.40% in the post-lockdown period compared to the lockdown period due to the opening of industrial and commercial activities.
3.8 Yamuna River’s Electrical Conductivity Level
The average values of electrical conductivity of the Yamuna river water were detected to be 1743.01, 1500.24, and 1467.39 μS/cm for the pre-lockdown, the during the lockdown, and the post lockdown periods, respectively. The electrical conductivity levels in the Yamuna river water varied from 8.10 to 3310.0, 7.10 to 3020.0, and 7.20 to 3290.0 μS/cm for the pre-,during, and post-lockdown periods respectively (Figure 5). The values of EC in the Damodar river, India, were reported to be much lower than the present results, ranging from 1040 to 1260 μS/cm and 750 to 880 μS/cm for the during and post-lockdown periods, respectively (Chakraborty et al., 2021). In a study conducted in the rivers and canals of Rajasthan state, the electrical conductivity values ranged between 300 and 2100 µmho/cm and 230 to 1250 µmho/cm for the pre-lockdown and the post-lockdown periods, respectively (Chauhan et al., 2020). During the lockdown and the post-lockdown phase, the electrical conductivity has been observed to decline due to the reduction in industrial effluents’ discharge into the river water. Furthermore, a decline in the electrical conductivity values implied a significant shutdown of industrial activities, which lowered the discharge rate of industrial effluents into the Yamuna River during the lockdown. In the pre-lockdown period, the higher electrical conductivity value in the pre- lockdown indicated a higher presence of chloride, phosphate, and nitrate emanating from the sewage systems flowing into the Yamuna River.
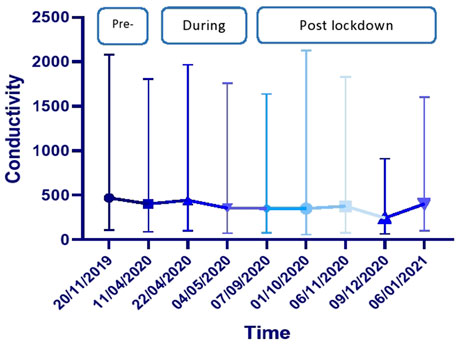
FIGURE 5. Time series plot for the EC values during the pandemic in Yamuna river.
3.9 Hypothesis Testing (t-test)
We performed hypothesis testing (t-test) to understand any changes in the individual water quality parameters between the pre-lockdown and during lockdown periods. The results indicated that the t value was more significant than the alpha value at a 0.05% significance level. It suggested a significant reduction in concentrations of water quality parameters, thus rejecting the null hypothesis. Results indicated improved water quality during the lockdown period, which can be partly attributed to a significant closure of industries in the study area. Similar results were reported in the Damodar river during the same time periods (Chakraborty et al., 2021).
Table 3 depicted the correlation between the water quality parameters for the Yamuna river in the pre-lockdown, during the lockdown, and post-lockdown periods. A strong significant positive correlation between electrical conductivity and COD and TSS with COD was found, whereas a moderate correlation was observed between DO and COD and electrical conductivity for pre lockdown period. A strong significant positive correlation was observed between COD with BOD and TSS during the lockdown period, whereas moderate conductivity with pH, DO, BOD, COD, and TSS. A strong positive correlation was found between COD with BOD and conductivity, whereas moderate was shown between TSS with BOD and COD for the post lockdown period.
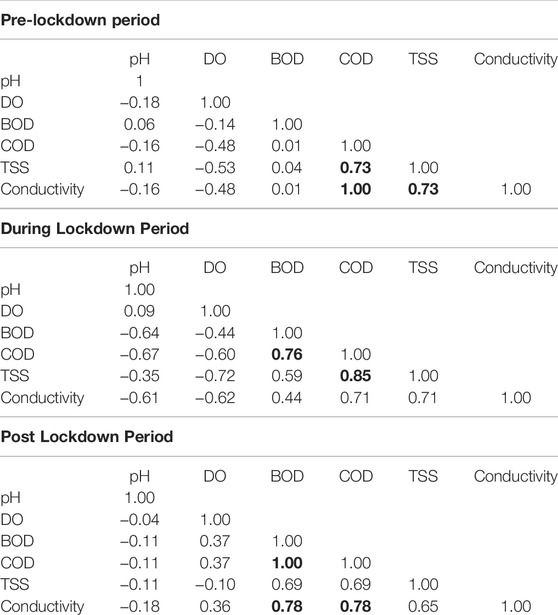
TABLE 3. Correlation coefficient matrix of Physico-chemical parameters for Yamuna River (Bold values indicate the strong correlation).
4 Suggestions and Recommendations
The governments, both the Central and the State governments, have taken many steps to control pollution in the Yamuna river, for instance, the Yamuna Action Plan (YAP), whose first and second phases started in 1993 and 2004 with a total expenditure of Rs.682 crore and Rs.666.76 crore respectively. Building upon the success and lessons learned from YAP-1 and YAP-2, the Government of India has launched Yamuna Action Plan-3 (YAP-3) at an estimated cost of Rs 1656 crore with the assistance of Japan International Cooperation Assistance (JICA). From a policy point of view, the current study suggests that more efforts are required to improve the water quality of the Yamuna river. Some of the recommendations emerging from the current study are:
• Implementation of Growth Pole Strategies of economic development where decentralization of economic activities is advocated in a more emphatic manner.
• Close-knit collaboration with multiple stakeholders, where the industrial pollution from public sector enterprises must be minimized and shared with other stakeholders as industry best practices towards sustainable industrial development.
• Improvements of current sewage treatment plants (STPs), including automated river water quality monitoring.
• Formulation and strict implementation of regulations and laws to contain water pollution. Incentivizing the industries to use high-quality equipment resulting inefficient use of resources and reducing water pollution discharge.
Despite showing a strong correlation between the variation of water quality parameters and certain economic activities during the COVID-19 in Yamuna River, the current study has the following limitations. First, the current study only accounts for certain water quality parameters where data variability can be accurately measured. We do not account for other parameters such as metals loads and socio-economic indicators; future studies can research in this direction. Secondly, the inclusion of economic data for other sectors along the Yamuna river would provide more precise results and an interesting research contribution. However, we need to strengthen the real-time monitoring of water quality data for the river to accurately estimate the improvements or reduction in river water quality monitoring across all the rivers during and after any consequential events.
5 Conclusion
The impacts of the COVID-19 lockdown on the water quality parameters in the Yamuna river have been analyzed in the current study. The data on water quality parameters such as pH, BOD, COD, TSS, and EC were obtained from the Haryana Pollution Control Board between November 1 2019 to January 10 2021, and economic data were used from the economic survey of Haryana, 2019–2021. Overall, the discussion highlighted the dramatic effects of COVID-19 lockdown on economic activities and water quality parameters, such as 1) a significant improvement in water quality parameters in the Yamuna river due to COVID-19 lockdown that prevented the discharge of industrial effluent in the river, 2) a change in water demand and supply patterns in industrial and commercial sections, and 3) a disruption in agricultural activities near the Yamuna river bank which changed the agricultural water usage pattern.
The water quality parameters such as TSS, BOD, and COD witnessed a significant improvement during lockdown compared to the corresponding time period in 2019. This improvement in the water quality parameters of the Yamuna river was mainly due to a reduction in the effluent discharge into the river water as a result of the sudden lockdown.
Furthermore, the average concentrations of water quality parameters were 7.26 (pH value), 31.32, 136.07, 7.93, 30.33 mg/L, and 1500.24 μS/cm during the lockdown period, as compared to pre lockdown period values of 7.53 (pH), 39.62, 116.52, 6.1, 57.2 mg/L and 1743.01 μS/cm for BOD, COD, DO, TSS, and EC respectively. This indicated a drastic improvement and rejuvenation of the water quality of the Yamuna river due to restrictions in industrial, commercial, agricultural, and other anthropogenic activities near the Yamuna river bank.
The study has rejected the null hypothesis and has found a statistically significant impact of the lockdown period on the water quality parameters of the Yamuna river. The findings from the current study provide relevant insight to authorities towards the necessity of stringent environmental regulations to prevent the discharge of untreated municipal and industrial water waste into the Yamuna river.
Data Availability Statement
The original contributions presented in the study are included in the article/Supplementary Material, further inquiries can be directed to the corresponding author.
Author Contributions
BS: Conceptualization, environment, analysis of the results and; discussion. PR: Procurement of data, Economics, framing the introduction section, preparing suggestions. NM: Data curation, Methodology, Economic section in results and discussion and Writing review and; editing. SK: visualization of graphs and; tables. MA: recommendations, and improving the overall quality of the current draft. ZA: Analysis of the statistical results and discussion. SR: Preparing the economic table from various sources.
Conflict of Interest
The authors declare that the research was conducted in the absence of any commercial or financial relationships that could be construed as a potential conflict of interest.
Publisher’s Note
All claims expressed in this article are solely those of the authors and do not necessarily represent those of their affiliated organizations, or those of the publisher, the editors and the reviewers. Any product that may be evaluated in this article, or claim that may be made by its manufacturer, is not guaranteed or endorsed by the publisher.
Acknowledgments
The authors would like to thank the Deanship of Scientific Research at Umm Al-Qura University for supporting this work by Grant Code: (22UQU4330890DSR01).
Supplementary Material
The Supplementary Material for this article can be found online at: https://www.frontiersin.org/articles/10.3389/fenvs.2022.940640/full#supplementary-material
References
Abid, N., Ikram, M., Wu, J., and Ferasso, M. (2021). Towards Environmental Sustainability: Exploring the Nexus Among ISO 14001, Governance Indicators and Green Economy in Pakistan. Sustain. Prod. Consum. 27, 653–666. doi:10.1016/j.spc.2021.01.024
Abid, N., Wu, J., Ahmad, F., Draz, M. U., Chandio, A. A., and Xu, H. (2020). Incorporating Environmental Pollution and Human Development in the Energy-Growth Nexus: A Novel Long Run Investigation for Pakistan. Ijerph 17 (14), 5154. doi:10.3390/ijerph17145154
Aman, M. A., Salman, M. S., and Yunus, A. P. (2020). COVID-19 and its Impact on Environment: Improved Pollution Levels during the Lockdown Period - A Case from Ahmedabad, India. Remote Sens. Appl. Soc. Environ. 20, 100382. doi:10.1016/j.rsase.2020.100382
ANCI (2020), Audizione Informale ANCI, Available at: http://www.ancicampania.it/wp-content/uploads/2020/05/AUDIZIONE_ANCI.pdf.
Arora, P., Jafferany, M., Lotti, T., Sadoughifar, R., and Goldust, M. (2020). Learning from History: Coronavirus Outbreaks in the Past. Dermatol. Ther. 3, 13343. doi:10.1111/dth.13343
Bachman, D. (2020). COVID-19 Could Affect the Global Economy in Three Main Ways. London, United Kingdom: Deloitte.
Bagchi, D., and Bussa, R. (2011). Application of Remote Sensing in Water Quality and Water Resources Management- an Overview, India Water Portal. Bhu-Jal News Q. J. 25 (3–4), 39–45. Available at: https://hindi.indiawaterportal.org/content/applicationP.P. Patel et al. / Science of the Total Environment 744 (2020) 140851 13. remote-sensing-water-quality-and-water-resources-management-overview/content-type-page/53244.
Balamurugan, M., Kasiviswanathan, K. S., Ilampooranan, I., and Soundharajan, B.-S. (2021). COVID-19 Lockdown Disruptions on Water Resources, Wastewater, and Agriculture in India. Front. Water 3, 603531. doi:10.3389/frwa.2021.603531
Beine, M., Bertoli, S., Chen, S., D’Ambrosio, C., Docquire, F., Dupuy, A., et al. (2020). Economic Effects of COVID-19 in Luxembourg. Available at: https://www.liser.lu/?type=news&id=1902.
Bera, B., Bhattacharjee, S., Shit, P. K., Sengupta, N., and Saha, S. (2020). Significant Impacts of COVID-19 Lockdown on Urban Air Pollution in Kolkata (India) and Amelioration of Environmental Health. Environ. Dev. Sustain 23, 6913–6940. doi:10.1007/s10668-020-00898-5
Bharti, N., and Katyal, D. (2011). Water Quality Indices Used for Surface Water Vulnerability Assessment. Int. J. Environ. Sci. 2 (1), 154–173. Available at: https://ssrn.com/abstract=2160726.
Chakraborty, B., Roy, S., Bera, A., and Pratim, P. (2021). Cleaning the River Damodar (India): Impact of COVID - 19 Lockdown on Water Quality and Future Rejuvenation Strategies. Int. J. Environ. Sci. Technol. 18 (6), 1645–1652. doi:10.1007/s13762-021-03245-x10.1007/s10668-020-01152-8
Chauhan, G. S., Mustapha, T., Musa, A., Garba, A. T., and Rashid, D. (2020). Assessment of Rajasthan Surface Water Quality during Covid19 Pandemic Lockdown. Int. J. Eng. Res. Technol. 9, 400–408. doi:10.17577/ijertv9is060269
Cherif, E. K., Vodopivec, M., Mejjad, N., Esteves da Silva, J. C. G., Simonovič, S., and Boulaassal, H. (2020). COVID-19 Pandemic Consequences on Coastal Water Quality Using WST Sentinel-3 Data: Case of Tangier, Morocco. Water 12, 2638. doi:10.3390/w12092638
Choi, J., Hearne, R., Lee, K., and Roberts, D. (2015). The Relation between Water Pollution and Economic Growth Using the Environmental Kuznets Curve: a Case Study in South Korea. Water Int. 40 (3), 499–512. doi:10.1080/02508060.2015.1036387
Conforti, C., Giuffrida, R., Dianzani, C., Di Meo, N., and Zalaudek, I. (2020). COVID‐19 and Psoriasis: Is it Time to Limit Treatment with Immunosuppressants? A Call for Action. Dermatol. Ther. 33, 13298. doi:10.1111/dth.13298
Cooley, H., Gleick, P. H., Abraham, S., and Cal, W. (2020). How the Coronavirus Pandemic Is Affecting Water Demand Changes in Water Demand. Available at: https://pacinst.org/publication/coronavirus-impacts-on-municipalwater-demand.
Cooper, R. (2020). Water Security beyond Covid-19. K4D Helpdesk Report 803. Brighton, UK: Institute of Development Studies. Available at: https://opendocs.ids.ac.uk/opendocs/handle /20.500.12413/15240.
CPCB- Central Pollution Control Board (2020) Water Quality. Available at: https://cpcb.nic.in/water-pollution/. [Accessed 6 July 2020].
Cracolici, M. F., Cuffaro, M., and Nijkamp, P. (2010). The Measurement of Economic, Social and Environmental Performance of Countries: A Novel Approach. Soc. Indic. Res. 95, 339–356. doi:10.1007/s11205-009-9464-3
Cripps, K. (2020). Thailand's Most Popular Island Goes into Lockdown as Covid-19 Cases Surge. CNN Travel, CNN. Available at: https://edition.cnn.com/travel/article/ph uket-Thailand-lockdown/index.html (Accessed April 17, 2020).
Daijiworld (2020). Baje Dam Has Enough Storage, No Water Woes for Udupi. Available at: https://www.daijiworld.com/news/newsDisplay. aspx?newsID=705405.
Desbureaux, S. D. R., RodellaAude-Sophie, R., and Jason,, and Zaveri, E. (2019). The Impact of Water Quality on GDP Growth: Evidence from Around the World. Washington, DC: World Bank. Available at: https://openknowledge.worldbank.org/handle/10986/33071 License: CC BY 3.0 IGO.
Dhar, I., Biswas, S., Mitra, A., Pramanick, P., and Mitra, A. (2020). COVID-19 Lockdown Phase: A Boon for the River Ganga Water Quality along the City of Kolkata. NUJS J. Regul. Stud. 26, 2456–4605.
Diao, X. D., Zeng, S. X., Tam, C. M., and Tam, V. W. Y. (2009). EKC Analysis for Studying Economic Growth and Environmental Quality: A Case Study in China. J. Clean. Prod. 17, 541–548. doi:10.1016/j.jclepro.2008.09.007
Ding, L., Chen, K.-l., Cheng, S.-g., and Wang, X. (2015). Water Ecological Carrying Capacity of Urban Lakes in the Context of Rapid Urbanization: A Case Study of East Lake in Wuhan. Phys. Chem. Earth, Parts A/B/C , (2015), s 89-90:104–113. doi:10.1016/j.pce.2015.08.004
Dobson, B., Jovanovic, T., Chen, Y., Paschalis, A., Butler, A., and Mijic, A. (2021). Integrated Modelling to Support Analysis of COVID-19 Impacts on London's Water System and In-River Water Quality. Front. Water 3, 641462. doi:10.3389/frwa.2021.641462
Dutta, V., Dubey, D., and Kumar, S. (2020). Cleaning the River Ganga: Impact of Lockdown on Water Quality and Future Implications on River Rejuvenation Strategies. Sci. Total Environ. 743, 140756. doi:10.1016/j.scitotenv.2020.140756
Garg, V., Aggarwal, S. P., and Chauhan, P. (2020). Changes in Turbidity along Ganga River Using Sentinel-2 Satellite Data during Lockdown Associated with COVID-19. Geomatics, Nat. Hazards Risk 11 (1), 1175–1195. doi:10.1080/19475705.2020.1782482
Ghildyal, D., Singh, K. P., Singh, P., and Verma, R. (2020). Healing of Rivers during Coronavirus Lockdown in India: A Statistical Approach. Int. J. Lakes Rivers 13 (2), 105–119. Available at: http://www.ripublication.com/ijlr.htm.
Government of Haryana (2021). Economic Survey of Haryana, 2020-21. Available at: https://esaharyana.gov.in/document/economic-survey-of-haryana-2020-21/.
Grossman, G. M., and Krueger, A. B. (1995). Economic Growth and the Environment. Q. J. Econ. 110, 353–377. doi:10.2307/2118443
Gwenzi, W., Selvasembian, R., Offiong, N.-A. O., Mahmoud, A. E. D., Sanganyado, E., and Mal, J. (2022). COVID-19 Drugs in Aquatic Systems: a Review. Environ. Chem. Lett. 20 (Issue 2), 1275–1294. Springer Science and Business Media Deutschland GmbH. doi:10.1007/s10311-021-01356-y
Häder, D.-P., Banaszak, A. T., Villafañe, V. E., Narvarte, M. A., González, R. A., and Helbling, E. W. (2020). Anthropogenic Pollution of Aquatic Ecosystems: Emerging Problems with Global Implications. Sci. Total Environ. 713, 136586. doi:10.1016/j.scitotenv.2020.136586
Han, J., Pei, J., and Kamber, M. (2011). Data Mining: Concepts and Techniques. 2nd Ed. Waltham: Morgan Kaufmann Publishers Elsevier.
Haryana (2020) Pollution Control Board HPCB. Available at: https://hspcb.gov.in/yamuna.
Hobijn, B., and Franses, P. H. (2001). Are Living Standards Converging? Struct. Change Econ. Dyn. 12, 171–200. doi:10.1016/S0954-349X(00)00034-5
Huang, C., Wang, Y., Li, X., Ren, L., Zhao, J., Hu, Y., et al. (2020). Clinical features of patients infected with 2019 novel coronavirus in Wuhan, China. Lancet. 395 (10223), 497–506. doi:10.1016/S0140-6736(20)30183-5
Huo, C., Ahmed Dar, A., Nawaz, A., Hameed, J., albashar, G., Pan, B., et al. (2021). Groundwater Contamination with the Threat of COVID-19: Insights into CSR Theory of Carroll's Pyramid. J. King Saud Univ. - Sci. 33 (2), 101295. doi:10.1016/j.jksus.2020.101295
Jain, S. K. (2015). Hydrologic Inputs for Ganga Rejuvenation, Presentation at the Future Ganga Workshop. Available online at:https://www.ceh.ac.uk/sites/default/files/Future%20Ganga%20Workshop%20-%20Sharad%20Jain%20- %20NIH.pdf [accessed May 07 2020].
Jayanthakumaran, K., and Liu, Y. (2012). Openness and the Environmental Kuznets Curve: Evidence from China. Econ. Model. 29, 566–576. doi:10.1016/j.econmod.2011.12.011
Khan, I., Shah, D., and Shah, S. S. (2021). COVID-19 Pandemic and its Positive Impacts on Environment: an Updated Review. Int. J. Environ. Sci. Technol. 18 (Issue 2), 521–530. Springer Science and Business Media Deutschland GmbH. doi:10.1007/s13762-020-03021-3
Kumar, A., and Dua, A. (2009). Water Quality Index for Assessment of Water Quality of River Ravi at Madhopur (India). Glo Jnl Env. Res. 8 (1), 49–57. doi:10.4314/gjes.v8i1.50824
Kumar, A., Singh, B. P., Punia, M., Singh, D., Kumar, K., and Jain, V. K. (2014). Assessment of Indoor Air Concentrations of VOCs and Their Associated Health Risks in the Library of Jawaharlal Nehru University, New Delhi. Environ. Sci. Pollut. Res. 21 (3), 2240–2248. doi:10.1007/s11356-013-2150-7
Kumar, A., Singh, B. P., Punia, M., Singh, D., Kumar, K., and Jain, V. K. (2014a). Determination of Volatile Organic Compounds and Associated Health Risk Assessment in Residential Homes and Hostels within an Academic Institute, New Delhi. Indoor Air 24 (5), 474–483. doi:10.1111/ina.12096
Kumar, A., Singh, D., Singh, B. P., Singh, M., Anandam, K., Kumar, K., et al. (2015). Spatial and Temporal Variability of Surface Ozone and Nitrogen Oxides in Urban and Rural Ambient Air of Delhi-NCR, India. Air Qual. Atmos. Health 8 (4), 391–399. doi:10.1007/s11869-014-0309-0
Kundu, C., 2020. Has the Covid-19 Lockdown Returned Dolphins and Swans to Italian Waterways? the India Today. Available at: https://www.indiatoday.in/fact-chec k/story/has-covid19-lockdown-returned-dolphins-swans-italian-waterways1658457-2020-03-22. [Accessed 14 April 2020].
Lee, C.-C., Chiu, Y.-B., and Sun, C.-H. (2010). The Environmental Kuznets Curve Hypothesis for Water Pollution: Do Regions Matter? Energy Policy 38, 12–23. doi:10.1016/j.enpol.2009.05.004
Mani, K. A. S. 2020. The Lockdown Cleaned the Ganga More Than ‘NamamiGange’ Ever Did. Science-The Wire.Available at: https://science.thewire.in/environment/ganga-river-lockdown-cleaner-namami-gange-sewage-treatment-ecological-flow/ April 19.
Manuel, A., and Zambrano, M. (2020). Indirect Effects of COVID-19 on the Environment. Sci. Total Environ. 723, 138813. doi:10.1016/j.scitotenv.2020.138813
Marchante, A. J., and Ortega, B. (2006). Quality of Life and Economic Convergence across Spanish Regions, 1980-2001. Reg. Stud. 40 (5), 471–483. doi:10.1080/00343400600757460
Mitra, A., Pramanick, P., Zaman, S., and Mitra, A. (2020). Impact of COVID-19 Lockdown on the Ichthyoplankton Community in and Around Haldia Port-Cum-Industrial Complex. NUJS J. Regul. Stud., 57–61.
Muduli, P. R., Kumar, A., Kanuri, V. v., Mishra, D. R., Acharya, P., Saha, R., et al. (2021). Water Quality Assessment of the Ganges River during COVID-19 Lockdown. Int. J. Environ. Sci. Technol. 18, 1645–1652. doi:10.1007/s13762-021-03245-x
Najah, A., Teo, F. Y., Chow, M. F., Huang, Y. F., Latif, S. D., Abdullah, S., et al. (2021). Surface Water Quality Status and Prediction during Movement Control Operation Order under COVID-19 Pandemic: Case Studies in Malaysia. Int. J. Environ. Sci. Technol. 18, 1009–1018. doi:10.1007/s13762-021-03139-y
Nardo, M., Saisana, M., Saltelli, A., Tarantola, S., Hoffman, H., and Giovannini, E. (2009). Handbook on Constructing Composite Indicators: Methodology and User Guide. Paris, France: Organisation for Economic Co-operation and Development. Available at: https://www.oecd.org/sdd/42495745.pdf.
Neumayer, E. (2003). Beyond Income: Convergence in Living Standards, Big Time. Struct. Change Econ. Dyn. 14, 275–296. doi:10.1016/S0954-349X(02)00047-4
Niroumand-Jadidi, M., Bovolo, F., Bruzzone, L., and Gege, P. (2020). Physics-based Bathymetry and Water Quality Retrieval Using Planetscope Imagery: Impacts of 2020 COVID-19 Lockdown and 2019 Extreme Flood in the Venice Lagoon. Remote Sens. 12 (15), 2381. doi:10.3390/RS12152381
Pant, R. R., Bishwakarma, K., Rehman Qaiser, F. U., Pathak, L., Jayaswal, G., Sapkota, B., et al. (2021). Imprints of COVID-19 Lockdown on the Surface Water Quality of Bagmati River Basin, Nepal. J. Environ. Manag. 289, 112522. doi:10.1016/j.jenvman.2021.112522
Patel, P. P., Mondal, S., and Ghosh, K. G. (2020) Some Respite for India's Dirtiest River? Examining the Yamuna's Water Quality at Delhi during the COVID-19 Lockdown Period. Sci. Total Environ. 744, 140851. doi:10.1016/j.scitotenv.2020.140851
Punia, M., Nain, S., Kumar, A., Singh, B. P., Prakash, A., Kumar, K., et al. (2015). Analysis of Temperature Variability over North-West Part of India for the Period 1970-2000. Nat. Hazards 75 (1), 935–952. doi:10.1007/s11069-014-1352-8
Rahman, M. M., Bodrud-Doza, M., Griffiths, M. D., and Mamun, M. A. (2020). Biomedical Waste amid COVID-19: Perspectives from Bangladesh. Lancel Glob. Health 8 (10), e1262. doi:10.1016/S2214-109X(20)30349-1
Rapport Cazeneuve (2020). Impact de la crise du COVID-19 sur les finances locales. Available at: https://www.gouvernement.fr/partage/11683-remise-du-rapport-de-jean-rene-cazeneuve-evaluation-de-l-impact-de-la-crise-du-covid-19-sur-les.
Ray, D., Salvatore, M., Bhattachariyya, R., Wang, L., Mohammed, S., Purkayastha, S., et al. (2020). Redictions, Role of Interventions and Effects of a Historic National Lockdown in India’s Response to the COVID-19 Pandemic: Data Science Call to Arms. 2020, 2020. (Suppl 1). doi:10.1162/99608f92.60e08ed5
Rothan, H. A., and Byrareddy, S. N. (2020). The Epidemiology and Pathogenesis of Coronavirus Disease (COVID-19) Outbreak. J. Autoimmun. 109 (February), 102433. doi:10.1016/j.jaut.2020.102433
Rout, C. (2017). Assessment of Water Quality: a Case Study of River Yamuna. Ijee 10 (2), 398–403. doi:10.21276/ijee.2017.10.0239
Sargaonkar, A., and Deshpande, V. (2003). Development of an Overall Index of Pollution for Surface Water Based on a General Classification Scheme in Indian Context. Environ. Monit. Assess. 89 (1), 43–67. doi:10.1023/A:1025886025137
Sarkis, J., Cohen, M. J., Dewick, P., and Schröder, P. (2020). A Brave New World: Lessons from the COVID-19 Pandemic for Transitioning to Sustainable Supply and Production. Resour. Conserv. Recycl. 159, 104894. doi:10.1016/j.resconrec.2020.104894
Selvam, S., Jesuraja, K., Venkatramanan, S., Chung, S. Y., Roy, P. D., Muthukumar, P., et al. (2020). Imprints of Pandemic Lockdown on Subsurface Water Quality in the Coastal Industrial City of Tuticorin, South India: A Revival Perspective. Sci. Total Environ. 738, 139848. doi:10.1016/j.scitotenv.2020.139848
Sharma, A., Ganguly, R., and Gupta, A. K. (2020). Impact Assessment of Leachate Pollution Potential on Groundwater: an Indexing Method. J. Environ. Eng. 146 (3), 05019007. doi:10.1061/(asce)ee.1943-7870.0001647
Sharma, D., and Kansal, A. (2011). Water Quality Analysis of River Yamuna Using Water Quality Index in the National Capital Territory, India (2000-2009). Appl. Water Sci. 1, 147–157. doi:10.1007/s13201-011-0011-4
Shen, J. (2006). A Simultaneous Estimation of Environmental Kuznets Curve: Evidence from China. China Econ. Rev. 17, 383–394. doi:10.1016/j.chieco.2006.03.002
Shen, J., Liu, C., Lv, Q., Gu, J., Su, M., Wang, S., et al. (2021). Novel Insights into Impacts of the COVID-19 Pandemic on Aquatic Environment of Beijing-Hangzhou Grand Canal in Southern Jiangsu Region. Water Res. 193, 116873. doi:10.1016/j.watres.2021.116873
Shukla, T., Sen, I. S., Boral, S., and Sharma, S. (2021). A Time-Series Record during COVID-19 Lockdown Shows the High Resilience of Dissolved Heavy Metals in the Ganga River. Environ. Sci. Technol. Lett. 8, 301–306. doi:10.1021/acs.estlett.0c00982
Singh, B. P., Eldesoky, G. E., Kumar, P., Chandra, P., Islam, M. A., and Rahman, S. (2022). A Comparative Study of Particulate Matter between New Delhi, India and Riyadh, Saudi Arabia during the COVID-19 Lockdown Period. Front. Environ. Sci. 9, 784959. doi:10.3389/fenvs.2021.784959
Singh, B. P., Kumar, A., Singh, D., Punia, M., Kumar, K., and Jain, V. K. (2014). An Assessment of Ozone Levels, UV Radiation and Their Occupational Health Hazard Estimation during Photocopying Operation. J. Hazard. Mater. 275, 55–62. doi:10.1016/j.jhazmat.2014.04.049
Singh, B. P., Kumar, K., and Jain, V. K. (2021a). Distribution of Ring PAHs in Particulate/gaseous Phase in the Urban City of Delhi, India: Seasonal Variation and Cancer Risk Assessment. Urban Clim. 40, 101010. doi:10.1016/j.uclim.2021.101010
Singh, B. P., Kumar, K., and Jain, V. K. (2021b). Source Identification and Health Risk Assessment Associated with Particulate- and Gaseous-phase PAHs at Residential Sites in Delhi, India. Air Qual. Atmos. Health 14 (10), 1505–1521. doi:10.1007/s11869-021-01035-5
Singh, B. P., and Kumar, P. (2021). Spatio-temporal Variation in Fine Particulate Matter and Effect on Air Quality during the COVID-19 in New Delhi, India. Urban Clim. 40, 101013. doi:10.1016/j.uclim.2021.101013
Singh, B. P., Singh, D., Kumar, K., and Jain, V. K. (2021c). Study of Seasonal Variation of PM2.5 Concentration Associated with Meteorological Parameters at Residential Sites in Delhi, India. J. Atmos. Chem. 78 (3), 161–176. Springer Science and Business Media B.V. doi:10.1007/s10874-021-09419-8
Singh, D., Kumar, A., Kumar, K., Singh, B., Mina, U., Singh, B. B., et al. (2016). Statistical Modeling of O3, NOx, CO, PM2.5, VOCs and Noise Levels in Commercial Complex and Associated Health Risk Assessment in an Academic Institution. Sci. Total Environ. 572, 586–594. doi:10.1016/j.scitotenv.2016.08.086
Singhal, S., and Matto, M. (2020). COVID-19 Lockdown: a Ventilator for Rivers. M. Somani, In: New Delhi, DownToEarth. 11. 100491. Available at: https://www.downtoearth.org.in/blog/COVID-19-lockdown-aventilator-for-rivers-70771.
Sivakumar, B. (2021). COVID-19 and Water. Stoch. Environ. Res. Risk Assess. 35, 531–534. doi:10.1007/s00477-020-01837-6
Sohrabi, C., Alsafi, Z., O'Neill, N., Khan, M., Kerwan, A., Al-jabir, A., et al. (2020). World Health Organization Declares Global Emergency: A Review of the 2019 Novel Coronavirus (COVID-19). Int. J. Surg. 76, 71–76. doi:10.1016/j.ijsu.2020.02.034
Somani, M., Srivastava, A. N., Gummadivalli, S. K., and Sharma, A. (2020). Indirect Implications of COVID-19 towards Sustainable Environment: an Investigation in Indian Context. Bioresour. Technol. Rep. 11, 100491. doi:10.1016/j.biteb.2020.100491
Tate, E. (2012). Social Vulnerability Indices: a Comparative Assessment Using Uncertainty and Sensitivity Analysis. Nat. Hazards 63, 325–347. doi:10.1007/s11069-012-0152-2
Time of India (2022). Available at: https://timesofindia.indiatimes.com/india/how-lockdown-has-been-a-gift-for-river-ganga/articleshow/75569852.cms. [Accessed May 6 2020].
Time of India (2020). Time of India. Available at: https://timesofindia.indiatimes.com/city/delhi/delhi-factories-shut-yamuna-water-sparkles/articleshow/74988548.cms. [Accessed April 5 2020].
Tokatlı, C., and Varol, M. (2021). Impact of the COVID-19 Lockdown Period on Surface Water Quality in the Meriç-Ergene River Basin, Northwest Turkey. Environ. Res. 197, 111051. doi:10.1016/j.envres.2021.111051
Travaglio, M., Yu, Y., Popovic, R., Selley, L., Leal, N. S., and Martins, L. M. (2020). Links between Air Pollution and COVID-19 in England. medRxiv Prepr. Serv. Health Sci. 268, 115859. doi:10.1101/2020.04.16.20067405
Tyagi, S., Sharma, B., Singh, P., and Dobhal, R. (2013). Water Quality Assessment in Terms of Water Quality Index. Am. J. Water Resour. 1 (3), 34–38. doi:10.12691/ajwr-1-3-3
Upadhyay, R., Dasgupta, N., Hasan, A., and Upadhyay, S. K. (2011). Managing Water Quality of River Yamuna in NCR Delhi. Phys. Chem. Earth, Parts A/B/C 36, 372–378. doi:10.1016/j.pce.2010.03.018
UPPCB-Uttar Pradesh Pollution Control Board (2020) River Water Quality. Available at: https://www.uppcb.com/river_quality.htm. Accessed July 6 2020.
Vijay Prakash, K., Geetha Vimala, C. S., Preethi Latha, T., Jayaram, C., Nagamani, P. V., and Laxmi, C. N. V. (2021). Assessment of Water Quality Along the Southeast Coast of India During COVID-19 Lockdown. Front. Mar. Sci. 8, 659686. doi:10.3389/fmars.2021.659686
Wagh, P., Sojan, J. M., Babu, S. J., Valsala, R., Bhatia, S., and Srivastav, R. (2020). Indicative Lake Water Quality Assessment Using Remote Sensing Images-Effect of COVID-19 Lockdown. Water 13 (1), 73. doi:10.3390/w13010073
WHO (2020). Advice on the Use of Masks in the Context of COVID-19: Interim Guidance-2. Geneva, Switzerland: WHO. April, 1–5. doi:10.1093/jiaa077
World metros (2021). World Metros. Available at: https://www.worldometers.info/coronavirus/.[Accessed October 4 2021].
Wu, F., Zhao, S., Yu, B., Chen, Y.-M., Wang, W., Song, Z.-G., et al. (2020). A New Coronavirus Associated with Human Respiratory Disease in China. Nature 579 (7798), 265–269. doi:10.1038/s41586-020-2008-3
Yashvardhini, N., Kumar, A., Gaurav, M., Sayrav, K., and Jha, D. K. (2022). Positive Impact of COVID-19 Induced Lockdown on the Environment of India's National Capital, Delhi. Spat. Inf. Res. 30, 249–259. doi:10.1007/s41324-021-00427-0
Yunus, A. P., Masago, Y., and Hijioka, Y. (2020). COVID-19 and Surface Water Quality: Improved Lake Water Quality during the Lockdown. Sci. Total Environ. 731, 139012. doi:10.1016/j.scitotenv.2020.139012
Zambrano-Monserrate, M. A., Ruano, M. A., and Sanchez-Alcalde, L. (2020). Indirect Effects of COVID-19 on the Environment. Sci. Total Environ. 728, 138813. doi:10.1016/j.scitotenv.2020.138813
Zeitung, Wiener (2020), Cities and Municipalities Face Loss of Revenue of up to 2 Billion, Available at: https://www.wienerzeitung.at/nachrichten/politik/oesterreich/2059518-Staedten-und-Gemeinden-droht-Einnahmenverlust-bis-zu-2-Milliarden.html.
Keywords: COVID-19 lockdowns, water quality parameters, lockdown, yamuna river, correlation
Citation: Singh BP, Rana P, Mittal N, Kumar S, Athar M, Abduljaleel Z and Rahman S (2022) Variations in the Yamuna River Water Quality During the COVID-19 Lockdowns. Front. Environ. Sci. 10:940640. doi: 10.3389/fenvs.2022.940640
Received: 10 May 2022; Accepted: 22 June 2022;
Published: 15 July 2022.
Edited by:
Vishal Dagar, Great Lakes Institute of Management, IndiaReviewed by:
Nabila Abid, Università degli Studi G d'Annunzio Chieti e Pescara, ItalyNnanake-Abasi Offiong, Topfaith University, Nigeria
Muhammad Kamran Khan, Bahria University, Pakistan
Copyright © 2022 Singh, Rana, Mittal, Kumar, Athar, Abduljaleel and Rahman. This is an open-access article distributed under the terms of the Creative Commons Attribution License (CC BY). The use, distribution or reproduction in other forums is permitted, provided the original author(s) and the copyright owner(s) are credited and that the original publication in this journal is cited, in accordance with accepted academic practice. No use, distribution or reproduction is permitted which does not comply with these terms.
*Correspondence: Bhupendra Pratap Singh, YnBzaW5naDA3ODNAZ21haWwuY29t