 Fengmin Luo1
 Huijie Xiao
- 1Inner Mongolia Dengkou Desert Ecosystem National Observation Research Station/Experimental Center of Desert Forestry, Chinese Academy of Forestry, Dengkou, China
- 2School of Soil and Water Conservation, Beijing Forestry University, Beijing, China
- 3Department of Geosciences, The University of Tulsa, Tulsa, OK, United States
- 4Department of Watershed and Range Management, Faculty of Water and Soil, University of Zabol, Zabol, Iran
- 5Shandong Key Laboratory of Eco-Environmental Science for the Yellow River Delta, Binzhou University, Binzhou, China
Knowledge of the microclimate and wind regimes of different land landscapes can be used to support natural resource development and agricultural productivity in desert areas. The aim of this study is to provide a theoretical basis and technical support for the management of Ulan Buh Desert Oasis and the comprehensive prevention and control of sandstorms from the surrounding desert in northern China. We examined the microclimate and wind regime of three landscapes—desert, desert–oasis ecotone, and oasis—and discussed the factors underlying the observed variations. Similar patterns were found in annual temperature, annual relative humidity, and wind speed between the desert, desert–oasis, and the oasis. Compared with the desert and the desert–oasis ecotone, the average annual temperature and wind speed in the oasis were lower by 2.56%–5.38% and 32.99%–37.05%, respectively. Average annual relative humidity in the oasis was higher than in other areas by 1.31%–2.57%. The desert, desert–oasis ecotone, and the oasis were dominated by westerly winds. Wind direction was relatively stable in the oasis and variable in the desert and desert–oasis ecotone. There were intermediate wind energy fields in the desert and the desert–oasis ecotone and a low wind energy field in the oasis. In the desert–oasis ecotone, drift potential (DP), resultant drift potential (RDP), and resultant drift direction (RDD) were 231.87 VU, 97.21 VU, and 104.33°, respectively. In the desert, DP was 228.45 VU, RDP was 92.65 VU, and RDD was 76.05°. In the oasis, the DP was 61.85 VU, RDP was 38.04 VU, and RDD was 92.97°. In the desert and the desert–oasis ecotone, sediment transport potential was the highest in spring, second highest in autumn, third highest in winter, and lowest in summer. In the oasis, it was the highest in winter, second highest in autumn, third highest in spring, and lowest in summer. There are complex variations in the dominant sediment transport directions in the desert and desert–oasis ecotone in the study area. Variations in the dominant sediment transport direction in the oasis are less complicated and are associated with the seasons. The oasis is primarily threatened by sandstorms from the south-southeast in spring.
1 Introduction
Oasis exists in the desert but is different from the desert. Under certain conditions, matter and energy are exchanged between oases and deserts (Zhang and Hu, 2002). The desert–oasis ecotone is an important part of the ecological barrier between an oasis and the surrounding arid areas. There is a complex relationship between landscapes and microclimate (Feng et al., 2006). Sandstorm intensity plays a crucial role in oasis evolution (Wang, 2009). The microclimate serves as a quantitative indicator of the degree of desertification and the intensity of the feedback mechanisms in the desertification process (Shen et al., 1993). Wind is an important factor that affects landforms and causes the movement of sand in the arid regions of Northwest China (Skidmore, 1986). Sandstorms can cause a series of problems, including continued expansion of deserts, which constantly threatens the survival of oases (Lal, 2001). Desert and desert-oasis ecotone are distributed around the oasis with a fragile ecological environment. It is the main source of sandstorms in the oasis, which directly affects the stability and sustainable development of the oasis. In oases, humans have been conducting land development projects on unreasonable scales. Around oases, there have been frequent occurrences of sandstorms in recent years. As a result, the carrying capacities of oases have been declining year to year. Therefore, sand control and the protection of the oasis environment are becoming increasingly urgent priorities (Wen et al., 1996). Therefore, it is very important to study the synchronous wind conditions of the desert, desert–oasis ecotone, and oasis.
Most studies on desert wind and sand activity have mainly focused on evolution mechanisms, particle size, intensity of sand activity, and aeolian sand environments (Zu et al., 2005; He et al., 2009). An increasing number of studies are starting to examine oasis evolution, mechanisms, and wind field characteristics (Li et al., 2004; Yang et al., 2012; Mao et al., 2019). These studies provide important reference information for the control of sand activity and the protection of the oasis environment. In China, Ulan Buh Desert is an important source of sand. There has been a series of severe winds and sand activity events, and the desert is expanding eastward and southward (Du et al., 2012). The normal function of the transportation network and water conservation facilities of the adjacent oasis is affected. In the oasis, agriculture, animal husbandry, human health, and environmental security are being threatened (Du et al., 2012; Liu, 2013; Wang et al., 2015). The Ulan Buh Desert Oasis comprises mainly farmland and planted forests that act as shelterbelts. As an important part of the Three-North Shelter Forest Program, the Ulan Buh Desert Oasis plays an important role in promoting the economic development of the Hetao region as well as reducing the frequency and intensity of disasters associated with severe wind and sand activity events. Over the years, many studies have been carried out on the ecological effects of the shelterbelt (Hao, 2007; Luo et al., 2019) and the microclimate (Aussenac, 2000; Jin et al., 2017). However, there have been few systematic studies on the annual characteristics of the microclimate and wind regime of the different landscapes in the same region. There have been no comparison studies because of lack of synchronous data from different sites.
In this study, we collected meteorological data, including temperature, relative humidity, and wind speed and direction from Ulan Buh Desert, the oasis in the northeastern part of the desert, and the desert–oasis transition zone. We conducted a preliminary quantitative analysis of the differences between the three landscapes in terms of microclimate and wind regime.
2 Materials and Methods
2.1 Study Area
Ulan Buh Desert is a transition zone between the arid and semiarid regions in northern China (Figure 1). It covers a total area of about 1.0 × 10⁴ km2. It has an elevation of 1,028–1,054 m and an elevation decrease in the direction of Hetao Plain (Du et al., 2012). The region has a temperate continental monsoon climate, which is under the effects of the southeastern monsoon in summer and autumn and the control of the Siberian–Mongolian cold anticyclone in winter and spring. The main natural disasters in the study area are associated with severe wind and sand activity events (Luo et al., 2019). The tower in the desert has a distance of 14.55 km from that in the desert–oasis, and the tower in the desert–oasis has a distance of 2.85 km from that in the oasis. The desert mainly comprises mobile and semi-fixed dunes. The desert–oasis ecotone comprises fixed and semi-fixed dunes, which are dominated by Nitraria tangutorum at a height of 1.2–3.6 m. The oasis area is protected by a shelterbelt, which covers an area of 1,487.3 ha. The shelterbelt is 32 m wide and comprises eight rows of trees. Spacing of auxiliary and miniature forest belts is 98 and 398 m, respectively (Figure 2).
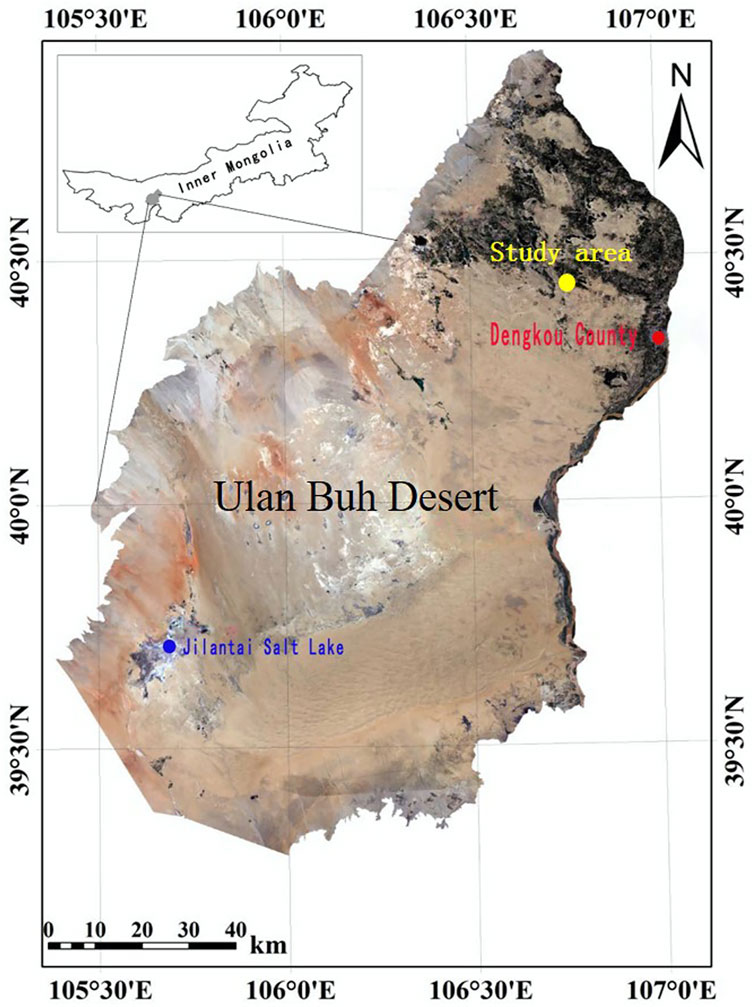
FIGURE 1. Location of the study area.
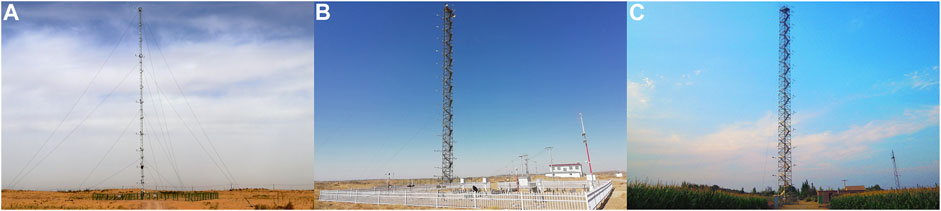
FIGURE 2. Map of three landscapes in the northeastern Ulan Buh Desert. (A) Desert area, (B) Desert-oasis ecotone, and (C) Oasis.
2.2 Data Acquisition
Meteorological data were simultaneously collected using Windsonic two-dimensional ultrasonic wind speed and direction sensors (1590-PK-020, Campbell, USA) and temperature and humidity sensors (1590-PK-020, Campbell, USA). The anemometer has a minimum detectable wind speed of 0.01 m/s. Accuracy, operating range, and output resolution are ±3°, 0–359°, and 1° for wind direction and ±2%, 0–60 m/s, and 0.01 m/s for wind speed, respectively.
The instruments were installed on three towers located in the desert, desert–oasis, and oasis. The tower in the desert has a distance of 14.55 km from that in the desert–oasis, and the tower in the desert–oasis has a distance of 2.85 km from that in the oasis. Measurements of temperature and relative humidity were made at a height of 8 m. Wind speed and direction were monitored at a height of 12 m. To ensure data quality, we calibrated the instruments on the three towers simultaneously, examined extreme data values, and verified the time consistency of the non-conforming data. In this study, following the conventional definition of seasons used by the meteorology community in China (Zhu et al., 2005), March to May was defined as spring, June to August as summer, September to November as autumn, and December to February as winter. The data were collected between January 1 and 31 December 2018.
2.3 Data Analysis
We used wind speed and direction and sandstorm frequency data, which were available in 10-min units. Following Du et al. (2015), months with the sand-driving wind (≥5 m/s) were identified, and the average and maximum wind speeds were calculated for these months. It is calculated as follows:
where u*t is critical friction speed, k is Karman constant (0.4), z is the height (2.0 m), and z0 is the dynamic roughness (3.265 × 10⁻³ m).
We calculated the frequency and speed of sand-moving wind from each of the 16 cardinal, intercardinal, and secondary intercardinal directions (N, NNE, NE, ENE, E, ESE, SE, SSE, S, SW, SSW, WSW, W, WNW, NW and NNW), and wind speed (V) was classified into four categories including 5 m/s ≤ V < 7 m/s, 7 m/s ≤ V < 9 m/s, 9 m/s ≤ V < 11 m/s, and V ≥ 11 m/s. The results were represented on sandstorm rose diagrams (Fan et al., 2006).
The sand drift potential (DP) is an important parameter that reflects the potential sand transport capacity of a region (An et al., 2018). It represents yearly total wind power and therefore describes the potential maximum amount of sand transport for each wind direction that includes values above the threshold velocity, and it is in a vector unit (VU). According to the calculation of the DP equation proposed by Fryberger and Dean (1979), the DP in different periods can be obtained. It is calculated as follows:
where DP is the sand transport potential or drift potential, expressed in vector unit VU; V is the sand-driving wind speed in knots (1 knot≈0.5 m/s); Vt is the critical sand-driving wind speed in knots; t is the sand-driving wind time, which is the duration of sand-driving wind observed during the observation period as a percentage of the duration of the observation period.
Resultant drift potential (RDP) represents the net DP (magnitude and direction) based on a summation of the DP values in each compass direction. It is calculated as follows (Al-Awadhi et al., 2005):
where VV represents the DP in each wind direction (in this article, we grouped winds into 16 sand transport directions), in vector units, and θ is the angle measured clockwise from 0 (north) for the midpoint of each wind direction class.
The resultant drift direction (RDD) represents the direction in which sand will be transported. It is calculated as follows (Al-Awadhi et al., 2005):
Directional variability (RDP/DP) is the ratio of the resultant drift potential (RDP) to the drift potential (DP). RDP/DP values close to 1 indicate a narrowly unidirectional wind regime, with a single dominant drift direction, whereas values close to 0 indicate a multidirectional wind regime with multiple significant drift directions.
According to DP values, the regional wind energy field was classified as high (>400 VU), intermediate (200–400 VU), or low (<200 VU). The directional variability index was also classified as high (≥0.8), intermediate (0.3–0.8), or low (≤0.3) (Zhang et al., 2011).
3 Results
3.1 Annual Variations
For the desert, desert–oasis ecotone, and the oasis, the annual average temperatures were 9.66, 9.38, and 9.14°C, respectively. The annual average relative humidity was 40.07, 40.58, and 41.11%, respectively. The annual average wind speeds were 4.13, 3.88, and 2.60 m/s, respectively (Figure 3). The oasis reduced the average annual temperature by 2.56%–5.38%, increased the average relative humidity by 1.31%–2.57%, and reduced the average annual wind speed by 32.99%–37.05%. The annual temperature curves were similar in the desert, desert–oasis, and oasis (Figure 3A). In July, the temperature in the oasis was 0.38°C lower than that in the desert and 1.17°C lower than that in the desert–oasis ecotone. In January, the temperature in the oasis was 1.00°C higher than that in the desert and 0.31°C higher than that in the desert–oasis ecotone. The annual relative humidity curves were similar in the three areas (Figure 3B). The relative humidity was the highest in August and the lowest in March. The three annual wind speed curves were similar in the three areas (Figure 3C). The wind speed was the highest in the desert (the annual average wind speed was 4.13 m/s) and the lowest in the oasis (the annual average wind speed was 2.60 m/s). The differences between the three landscapes were considerable in terms of wind speed but were small in terms of air temperature and relative humidity. Monthly distributions of air temperature and relative humidity are highly similar for the three ecosystems monitored. However, wind speed in the oasis is notably lower than in both desert-oasis and desert systems.
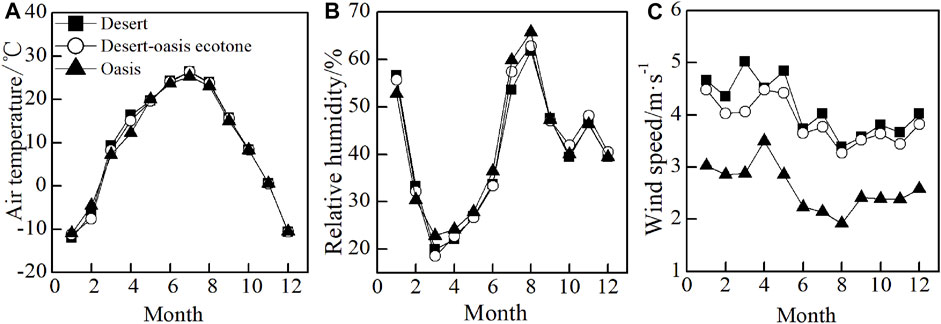
FIGURE 3. Monthly variations of (A) air temperature, (B) relative humidity, and (C) wind speed.
The desert, desert–oasis ecotone, and the oasis were dominated by westerly winds (W, WSW, SW, and SSW) (Figure 4). In the desert, the main wind directions were SW and SSW. In the desert–oasis ecotone, the main wind direction was SW. The frequency of winds from NE was also relatively high, but speeds were low (5–7 m/s). In the oasis, the main wind directions were W and WNW. Wind direction was relatively stable in the oasis and was variable in the desert and in the desert–oasis ecotone.
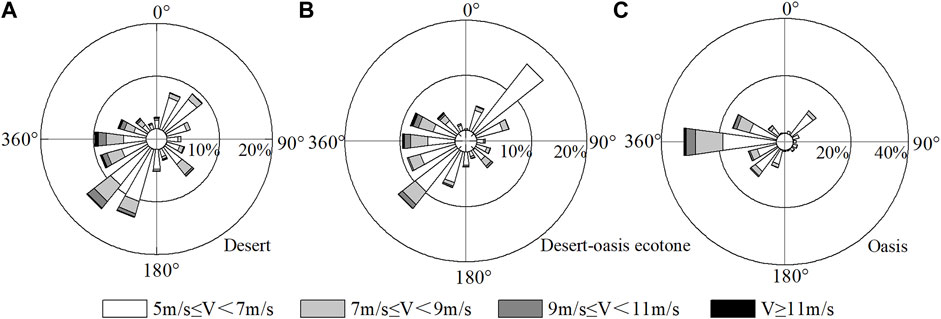
FIGURE 4. Wind speed and direction rose chart for the (A) desert, (B) desert–oasis ecotone, and (C) oasis during the experimental period of time. The different parts of wind rose represent the proportion of different wind speed segments in different directions.
Among the three landscapes, the drift potential (DP) was the highest (231.87 VU) in the desert–oasis ecotone. This indicates the presence of a low wind energy field (Figure 5). The resultant drift potential (RDP) and resultant drift direction (RDD) were 97.21 VU and 104.33°, respectively. The directional variability index (RDP/DP) was medium (0.40). Northwest and northeast were the dominant DP directions. DP in the NW was the highest, with a value of 115.74 VU, accounting for 49.92% of the annual DP. The DP was the second highest in the desert, with a value of 228.45 VU, indicating the presence of a low wind energy field. In the desert, the RDP was 92.65 VU, and RDD was 76.05°. The RDP/DP was medium (0.43). There was more variability in the direction of sediment transport in the desert than that in the desert–oasis ecotone. In the desert, SW, WSW, W, and WNW were the dominant DP directions. DP values were 35.15, 41.61, 47.18, and 28.52 VU, respectively, and collectively accounted for 66.74% of the annual DP. The DP was the lowest in the oasis, with a value of 61.85 VU, indicating the presence of a low wind energy field. In the oasis, the RDP was 38.04 VU and RDD was 92.97°. The RDP/DP was medium (0.61). There was little variability in the direction of sediment transport; W and WNW were the dominant DP directions.
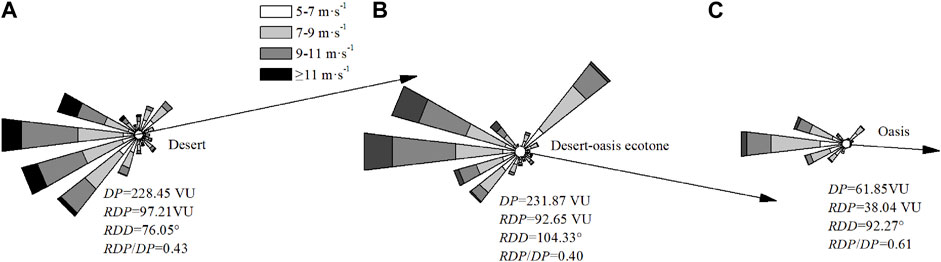
FIGURE 5. Sand drift potential for the (A) desert, (B) desert–oasis ecotone, and (C) oasis during the experimental period of time. The calculated resultant drift potential (RDP) and resultant drift direction (RDD) are shown in black arrow.
3.2 Seasonal Variations
For all three landscapes, average temperatures were the highest in summer, second highest in spring, and the third highest in autumn. The lowest average temperature was in winter. The average temperature was the highest in the desert–oasis ecotone and the second highest in the desert. The lowest average temperature was in the oasis. The difference between the average temperature in the desert–oasis ecotone and that in the desert was small (Figure 6). For all three landscapes, average relative humidity was the highest in summer, second highest in autumn, and third highest in winter. The lowest average relative humidity was in spring. The average relative humidity was the highest in the oasis and second highest in the desert. The lowest average relative humidity was in the desert–oasis ecotone. The difference between the relative humidity in the desert–oasis ecotone and that of the desert was small. There were large differences between the average wind speeds associated with the three landscapes. For each season, the average wind speed was the highest in the desert, the second highest in the desert–oasis ecotone, and the lowest in the oasis. For the three landscapes, average wind speeds were the highest in spring. In the desert and the desert–oasis ecotone, average wind speeds were the second highest in winter, the third highest in summer, and the lowest in autumn. In the oasis, the average wind speed was the second highest in winter, the third highest in autumn, and the lowest in summer. The summer lush vegetation weakens the wind. As a result, the average wind speed in summer is lower than that in autumn.
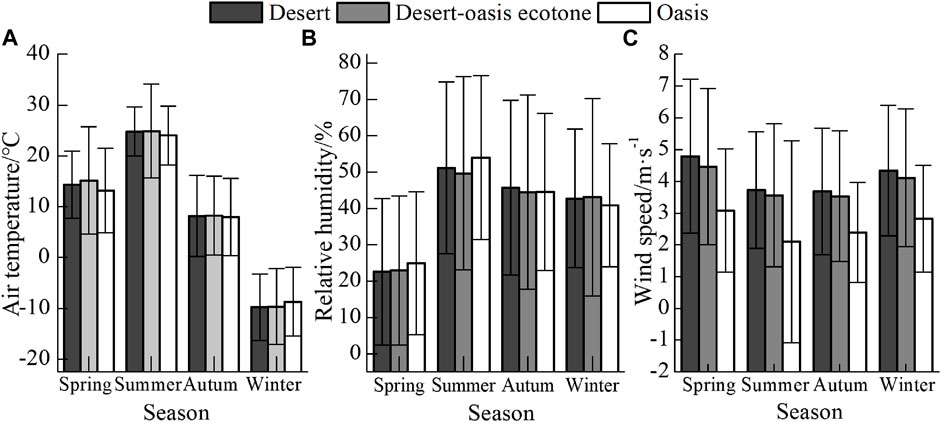
FIGURE 6. Seasonal variations of (A) air temperature, (B) relative humidity, and (C) wind speed.
In the desert, seasonal variations were observed in DP. The DP and RDP in spring were considerably higher (67.68 VU and 35.34 VU, respectively) than those in other seasons (Figure 7). In spring, the RDD was 104.40° (ESE) and the RDP/DP was medium (0.52). In autumn, the DP and RDP were the second highest (62.12 VU and 33.82 VU, respectively), the RDD was 63.15° (ENE), and the RDP/DP was medium (0.54). In winter, DP and RDP were 53.34 VU and 27.42 VU, respectively, the RDD was 68.35° (ENE), and the RDP/DP was medium (0.51). In summer, the DP and RDP were the lowest (45.30 VU and 8.16 VU, respectively), the RDD is 33.17° (NNE), and the RDP/DP was low (0.18).
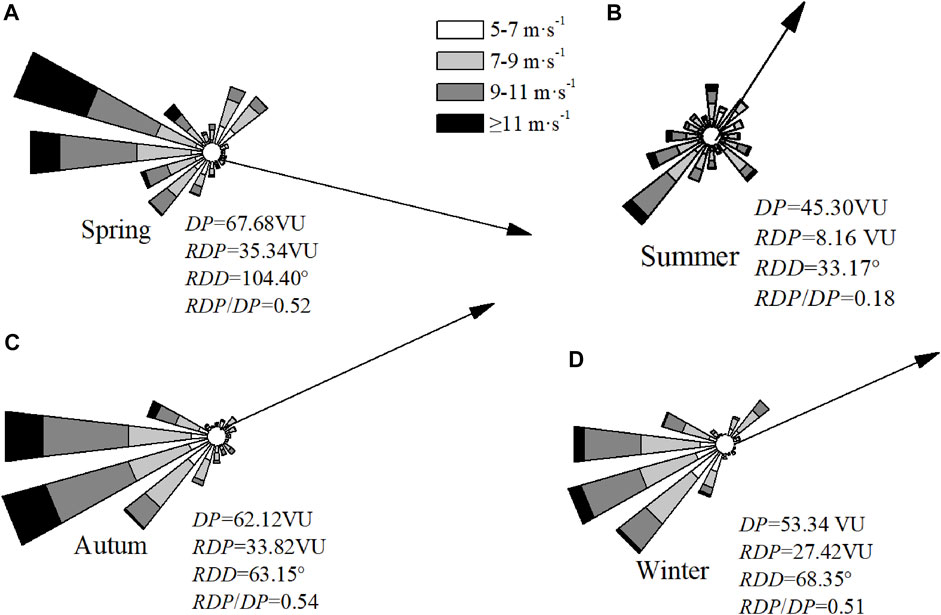
FIGURE 7. Drift potential in the desert in (A) spring, (B) summer, (C) autumn, and (D) winter. The calculated resultant drift potential (RDP) and resultant drift direction (RDD) are shown in black arrow.
In the study area, the average wind speed is relatively high in spring (Figure 5). Relatively high wind speed, low precipitation, melting of frozen surface soil, surface exposure, and the combined action of multiple factors create favorable dynamic conditions and abundant sand sources for surface sand migration in spring. As a result, sandstorm activity in the study area is the highest in spring.
In the desert–oasis, seasonal variations were observed in DP. In the desert–oasis ecotone, the DP and RDP in spring were considerably higher (81.81 VU and 36.78 VU, respectively) than those in other seasons (Figure 8). In spring, the RDD was 131.55° (SE) and the RDP/DP was medium (0.45) and the DP and RDP in the autumn (56.37 VU and 34.53 VU, respectively) were the second highest. In autumn, the RDD was 90.17° (E) and the RDP/DP was medium (0.61). In winter, DP and RDP were 52.89 VU and 27.71 VU, respectively, the RDD was 104.33° (ESE), and the RDP/DP was medium (0.52). In summer, the DP and RDP were the lowest (40.80 VU and 0.19 VU, respectively), the RDD was 10.79° (NNE), and the RDP/DP was low (0.00).
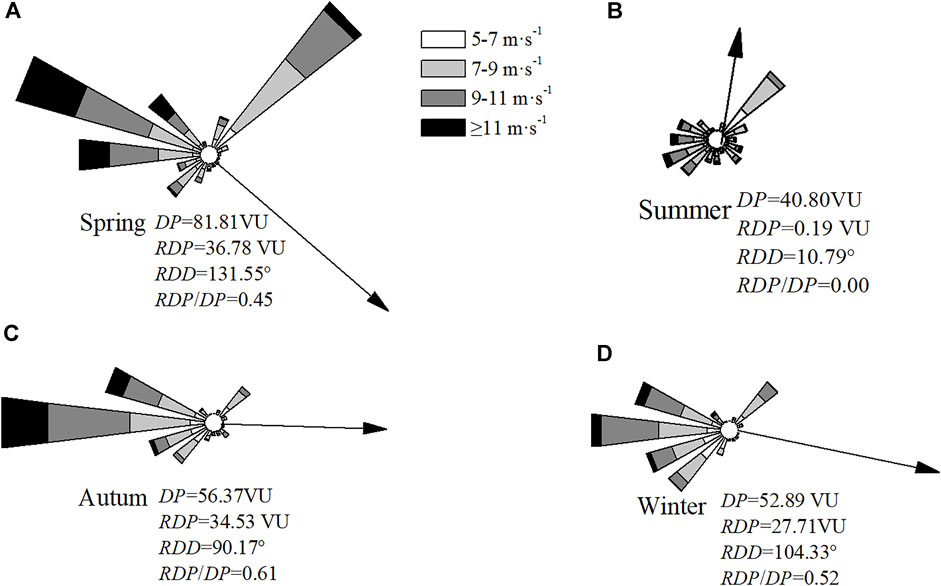
FIGURE 8. Drift potential in the desert–oasis ecotone in (A) spring, (B) summer, (C) autumn, and (D) winter. The calculated resultant drift potential (RDP) and resultant drift direction (RDD) are shown in black arrow.
In the oasis, DP was the highest in winter, second highest in autumn, third highest in spring, and lowest in summer (Figure 9). In winter, the DP and RDP were 19.70 VU and 11.12 VU, respectively, the RDD was 83.56° (E), and the RDP/DP was medium (0.57). In autumn, the DP and RDP were 18.26 VU and 13.25 VU, respectively, the RDD was 86.85° (E), and the RDP/DP was medium (0.73). In spring, the DP and RDP were 17.94 VU and 11.94 VU, respectively, the RDD was 108.32° (ESE) and the RDP/DP was medium (0.67). In summer, the DP and RDP were 5.96 VU and 2.32 VU, respectively, the RDD was 83.57° (E) and the RDP/DP was medium (0.39).
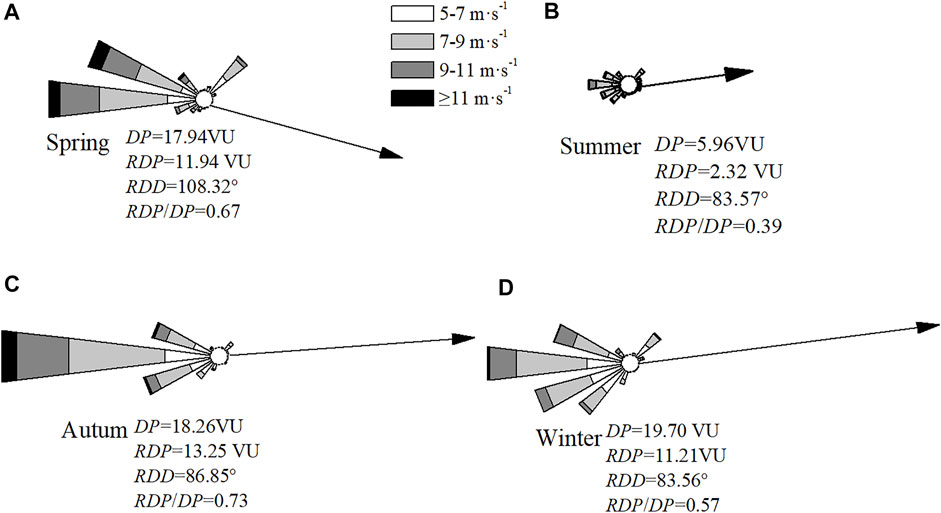
FIGURE 9. Drift potential in the oasis in (A) spring, (B) summer, (C) autumn, and (D) winter. The calculated resultant drift potential (RDP) and resultant drift direction (RDD) are shown in black arrow.
In the desert and desert–oasis ecotone, DP was the highest in spring, second highest in autumn, third highest in winter, and lowest in summer. In the oasis, DP was the highest in winter, second highest in autumn, third highest in spring, and lowest in summer. In the desert, the dominant DP direction shifted over the seasons It was ESE in spring, NNE in summer, ENE in autumn, and ENE in winter. In the desert–oasis ecotone, the dominant DP direction also shifted over the seasons. It was SE in spring, NNE in summer, E in autumn, and ESE in winter. In the oasis, the dominant DP direction was ESE in spring and remained E throughout summer, autumn, and winter. Our results indicate complex variations in the dominant sediment transport directions in the desert and desert–oasis ecotone. Variations in the dominant sediment transport direction in the oasis are less complex and are associated with the seasons. The oasis is primarily threatened by sandstorms from the south-southeast in spring.
4 Discussion
In this study, we analyzed meteorological data obtained simultaneously at three observation sites located in the desert, the desert–oasis ecotone, and the oasis to improve our understanding of atmospheric circulation. The three sites differ in terms of terrain and thermal characteristics. Therefore, we also found differences in terms of local meteorological elements, including wind speed and direction. Our results show that microclimate and wind regime vary with landscapes.
The sand drift potential reflected the ability of sand transport by wind in a certain period. It is an important measure of the intensity of regional sand activity and aeolian landform evolution (Fryberger and Dean, 1979). There are complex interactions and feedback mechanisms between sand activity and landscapes (Mao et al., 2017). Factors such as atmospheric circulation, landscape, and topography result in considerable variations between wind regimes of different regions. The wind regime is an important determinant of the characteristics of aeolian landforms (Zu et al., 2005). Knowledge of the wind regime is essential for estimating the intensity and regularity of sand activity and formulating measures to prevent and control sandstorm damage. Because wind speed is greatly reduced by the blocking effect of the tall trees and crops in the oasis, the average monthly wind speed in the oasis is much lower than that in the desert and desert–oasis ecotone (Mao et al., 2017). Differences in wind speed in the three landscapes result in considerable differences in the drift potential. Wind frequency and drift potential are the highest in the desert and desert–oasis ecotone, where there are medium wind energy fields. Drift potential is the lowest in the oasis, where there is a low wind energy field. Similar characteristics were found in the wind dynamic environment between the typical surface in the Dunhuang. Due to the difference of wind speed, the sand transport potential of desert, oasis, and Gobi is significantly different. Gobi has the highest sand-driving wind frequency and sand transport potential and belongs to the high wind energy field. The desert and oasis have lower sand transport potential than the Gobi and belong to the low wind energy field.
In the desert and desert–oasis ecotone, wind and drift potential are higher in spring and autumn. In the oasis, wind and drift potential are higher in spring, autumn, and winter. In the desert and the desert–oasis ecotone, the drift potential is the highest in spring. In the oasis, the drift potential is the highest in winter; the difference between the drift potential in winter and that in spring is small. Therefore, it is necessary to implement measures to prevent and control sandstorms in spring in the study area.
Differences in surface vegetation types, vegetation coverage, topography, water distribution, surface soil composition, and seasonal variations result in considerable differences between the climate in the desert and the climate in the oasis (Zhu et al., 2005; Yu et al., 2020). Vegetation improves the local microclimate in deserts and has a positive impact on regional climate regulation (Pan et al., 2004; Shi et al., 2015). The effects of desert plant species on microclimate vary and can include cooling, humidification, and windbreaking (Pang et al., 2011). The oasis in northeastern Ulan Buh Desert reduced the average annual temperature and wind speed by 2.56%–5.38% and 32.99%–37.05%, respectively, and increased the average annual relative humidity by 1.31%–2.57%. The shelterbelt clearly improved the local microclimate by reducing the temperature and increasing the humidity in the oasis (Hu et al., 1992; Zhang et al., 1996). Our results show the positive effects of oasis shelterbelts in regulating microclimate include cooling, humidifying, and reducing wind speed. Oasis shelterbelts support the sustainable development of oases. Heat is transferred from the ground to the atmospheric boundary layer via radiation, turbulence, convection, and latent heat transfer. Vegetation absorbs and reflects solar radiation and reduces atmospheric heating and air temperature. Transpiration and the shading effect of plants result in lower temperature and higher humidity in the oasis and contribute toward the cold island effect of oases (Du et al., 2015). The tall shelterbelt blocks airflow and leads to lower wind speed in the oasis.
The difference in landscape between the desert and the oasis results in strong local atmospheric circulations and interactions (Zuo and Hu 1994). In northeastern Ulan Buh Desert, there are also local exchanges of water and heat between the desert and the oasis. Vegetation cover and soil moisture are the main factors affecting the difference in microclimate between the oasis and the desert (Lv et al., 2005). Therefore, to improve the microclimate, ensure agricultural productivity, and protect human health, vegetation coverage should be increased, in both natural and planted vegetation. If conditions permit, measures to reduce the amount of water used in agricultural irrigation can be strengthened to improve the microclimate and ensure agricultural productivity in the oasis.
Studies of the characteristics of sand activity in different regions in northern China and their relationships with aeolian landform formation can provide a theoretical basis for the evaluation of future sand activity intensity. The findings contribute to the field of aeolian landform research and provide reference information that can be used to design measures to control sandstorm hazards in different areas. To evaluate the intensity of regional surface sand activity, we need to analyze field observations of wind and sand activity in addition to wind speed and direction data.
5 Conclusion
1) The annual temperature curves were similar between the desert, desert–oasis, and oasis. Similarity in the annual relative humidity and wind speed curves was also found between the three sites. The oasis reduced average annual temperature and wind speed by 2.56%–5.38% and 32.99%–37.05%, respectively, and increased the average annual relative humidity by 1.31%–2.57%.
2) The desert, desert–oasis ecotone, and oasis were dominated by westerly winds. Wind direction was relatively stable in the oasis and was variable in the desert and in the desert–oasis ecotone.
3) There were large differences between the annual drift potential of the three landscapes. There were intermediate wind energy fields in the desert and the desert–oasis ecotone and a low wind energy field in the oasis. In the desert–oasis ecotone, drift potential (DP), resultant drift potential (RDP), and resultant drift direction (RDD) were 231.87 VU, 97.21 VU, and 104.33°, respectively. In the desert, DP was 228.45 VU, RDP was 92.65 VU, and RDD was 76.05°. In the oasis, the DP was 61.85 VU, RDP was 38.04 VU, and RDD was 92.97°.
4) In the desert and the desert–oasis ecotone, sand transport potential was the highest in spring, second highest in autumn, third highest in winter, and lowest in summer. In the oasis, it was the highest in winter, second highest in autumn, third highest in spring, and lowest in summer. There are complex variations in the dominant sediment transport directions in the desert and desert–oasis ecotone in the study area. Variations in the dominant sediment transport direction in the oasis are less complex and are associated with the seasons. The oasis is primarily threatened by sandstorms from the south-southeast in spring.
Data Availability Statement
The original contributions presented in the study are included in the article/Supplementary Material. further inquiries can be directed to the corresponding author.
Author Contributions
FL, HX, JG, YM, XL, and ZX contributed to the conception and design of the study. FL organized the database. HX performed the statistical analysis. FL wrote the first draft of the manuscript. HX, JG, YM, XL, JL, AM, QC, and ZX wrote sections of the manuscript. All authors contributed to manuscript revision and read and approved the submitted version.
Funding
This study was funded by the Project of Intergovernmental International Cooperation in Science and Technology Innovation (NO.2019YFE0116500) and the Science and Technology Planning Project of Inner Mongolia Autonomous Region (2020GG0125).
Conflict of Interest
The authors declare that the research was conducted in the absence of any commercial or financial relationships that could be construed as a potential conflict of interest.
Publisher’s Note
All claims expressed in this article are solely those of the authors and do not necessarily represent those of their affiliated organizations or those of the publisher, the editors, and the reviewers. Any product that may be evaluated in this article, or claim that may be made by its manufacturer, is not guaranteed or endorsed by the publisher.
References
Al-Awadhi, J. M., Al-Helal, A., and Al-Enezi, A. (2005). Sand Drift Potential in the Desert of Kuwait. J. Arid Environ. 63, 425–438. doi:10.1016/j.jaridenv.2005.03.011
An, Z.-s., Zhang, K.-c., Tan, L.-h., Zhang, H., and Niu, B.-c. (2018). Dune Dynamics in the Southern Edge of Dunhuang Oasis and Implications for the Oasis Protection. J. Mt. Sci. 15 (10), 2172–2181. doi:10.1007/s11629-017-4723-2
Aussenac, G. (2000). Interactions Between Forest Stands and Microclimate: Ecophysiological Aspects and Consequences for Silviculture. Ann. For. Sci. 57 (3), 287–301. doi:10.1051/forest:2000119
Du, H. Q., Xue, X., and Sun, J. H. (2012). Underlying Surface Characteristics and Observation of Blown-Sand Movement in Ulan Buh Desert Along Bank of Yellow River. Trans. Chin. Soc. Agric. Eng. 28 (22), 156–165. doi:10.3969/j.issn.1002-6819.2012.22.023
Du, M. X., Zhang, M. J., and Wang, S. J. (2015). The Cold Island and Wet Island Effects of Typical Oases in Xinjiang. Chin. J. Ecol. 34 (6), 1523–1531. doi:10.13292/j.1000-4890.2015.0132
Fan, L. H., Ge, L. M., He, Q., and Pan, X. L. (2006). Analysis On Daily Change of Climate Characteristics About Oasis-Intermediate Belt-Desert. J. Xinjiang Agric. Univ. 29 (1), 5–9.
Feng, Q., Si, J., Zhang, Y., Yao, J., Liu, W., and Su, Y. (2006). Microclimatic Characteristics of The Heihe Oasis in The Hyperarid Zone of China. J. Geogr. Sci. 16 (1), 34–44. doi:10.1007/s11442-006-0104-4
Fryberger, S. G., and Dean, G. (1979). “Dune Forms and Wind Regime,” in A Study of Global Sand Seas. Editor E. D. McKee (Washington D.C.: U.S. Government Printing Office), 137–169.
Hao, Y. G. (2007). Study on Ecological Effects of Oasis-Making Process in The Northeast Part of Ulan Buh Desert. Beijing: Beijing Forestry University.
He, Q., Yang, X. H., Huo, W., Wang, S. G., Shang, K. Z., and Liu, H. Y. (2009). Characteristics of Sand Granularity from Kumtag Desert and its Environmental Significance. J. Desert Res. 29 (1), 18–22.
Hu, Y. Q., Yang, X. L., and Zhang, Q. (1992). The Characters of Energy Budget on The Gobi and Desert Surface in Hexi Region. Acta Meteorol. Sin. 26 (1), 86–95. CNKI:SUN:QXXW.0.1992-01-007.
Jin, L. L., Li, Z. J., He, Q., Huo, W., Yang, F., and Yang, X. H. (2017). Microclimate Over the Center and Edge Areas of The Artificial Shelter Forest Land in Taklimakan Desert. J. Desert Res. 37 (5), 986–996. doi:10.7522/j.issn.1000-694X.2016.00068
Li, S., Li, F., Sun, W., and Li, B. S. (2004). Modern Desertification Process in Ejina Oasis and its Dynamic Mechanism. Sci. Geogr. Sin. 24 (1), 61–67. doi:10.13249/j.cnki.sgs.2004.01.61
Liu, Y. (2013). Research on Dynamic Change of Land Use in Ulan Buh Desert in Recent 40 Years. Hohhot: Inner Mongolia Normal University.
Luo, F. M., Gao, J. L., Xin, Z. M., Hao, Y. G., Ge, G. B. T., Li, X. L., et al. (2019). Low-altitude Structure of Sandstorms for inside and Outside the Shelterbelt in The Northeast Marginal Zone of the Ulan Buh Desert. Arid Zone Res. 36 (4), 1032–1040. doi:10.13866/j.azr.2019.04.29
Lv, S. H., Shang, L. Y., Liang, L., and Luo, S. Q. (2005). Numerical Simulation of Microclimate Effect in Jinta Oasis. Plateau Meteorol. 24 (5), 649–655.
Mao, D. L., Cai, F. Y., Lei, J. Q., Yang, X. F., Yang, Y. H., and Xuan, J. (2017). Spatial Analysis on Changes of Microclimate in Typical Landscapes in Desert-Wilderness-Oasis in Cele, Xinjiang. Sci. Geogr. Sin. 37 (4), 630–640. doi:10.13249/j.cnki.sgs.2017.04.017
Mao, D. L., Cai, F. Y., Yang, X. F., Wang, X. M., Lai, F. B., and Xue, J. (2019). Characteristics of Wind Filed Over Different Underlying Surfaces in The Oasis-Desert Ecotone in Qira, Xinjiang. Arid Zone Res. 36 (5), 1117–1126. doi:10.13866/j.azr.2019.05.08
Pan, X. L., Zeng, X. B., Zhang, J., Shi, Q. D., Chao, Q. C., and Chao, J. P. (2004). Interaction of Evolution of Ecological Landscape Pattern and Climate Change in Xinjiang. J. Xinjiang Univ. Sci. Ed. 21 (1), 1–7.
Pang, Y. J., Lei, J. Q., Zeng, F. J., Li, S. Y., Mao, D. L., and He, Z. H. (2011). Microclimatic Characteristics of Oasis-Desert Transitional Zone in Qira County of Xinjiang Wei Autonomous Region. Bull. Soil Water Conservation 31 (5), 240–245. doi:10.13961/j.cnki.stbctb.2011.05.013
Shen, J. Y., He, Z. Y., Li, S. G., Wang, T. L., and Harazono, Yoshinobu. (1993). Study on Microclimate of Desertified Land in Naiman Area. J. Desert Res. 13 (2), 44–50. CNKI:SUN:ZGSS.0.1993-02-007.
Shi, X., Li, W., Yang, W. B., Ding, G. D., and Feng, W. (2015). Microclimatic Characteristics and the Effects of Low Coverage Sand Fixing Forest Belts. J. Arid Land Resour. Environ. 29 (10), 117–121. doi:10.13448/j.cnki.jalre.2015.338
Skidmore, E. L. (1986). Soil Erosion by Wind: An Overview. Netherlands: Springer, 261–273. doi:10.1007/978-94-009-4388-9_18
Wang, H., Jia, X., Li, Y., and Peng, W. (2015). Selective Deposition Response to Aeolian-Fluvial Sediment Supply in The Desert Braided Channel of The Upper Yellow River, China. Nat. Hazards Earth Syst. Sci. 15 (2), 1955–1962. doi:10.5194/nhess-15-1955-2015
Wang, T. (2009). Review And Prospect of Research on Oasification and Desertification in Arid Regions. J. Desert Res. 29 (1), 1–9.
Wen, Z. X., Dong, G. R., and Qu, J. J. (1996). Paying Emphasis on The Study of Desert Oasis in China. Adv. Earth Sci. 11 (3), 270–274. CNKI: SUN: DXJZ.0.1996-03-006.
Yang, X. H., He, Q., Huo, W., and Cheng, Y. J. (2012). Study on Wind-Blown Sand Characteristics at Different Directions Near the Surface in The Frontier of An Oasis-Desert Ecotone in Qira County, Xinjiang. Arid Zone Res. 29 (6), 1100–1104. doi:10.13866/j.azr.2012.06.023
Yu, Y. P., Zhang, K. C., An, Z, S., and Zhang, Y. (2020). Dynamic Environment of Wind Along the Dunhuang-Golmud Railway. J. Desert Res. 40 (1), 41–48. doi:10.7522/j.issn.1000-694X.2019.00042
Zhang, Q., and Hu, Y. Q. (2002). The Geographical Features and Climatic Effects of Oasis. Adv. Earth Sci. 17 (4), 477–486. doi:10.11867/j.issn.1001-8166.2002.04.0477
Zhang, Q., Hu, Y. Q., Yang, Y. F., and Zhao, H. Y. (1996). The Variability Process of Atmosphere Over Heterogeneous Underlying Surface in Hexi Region. Plateau Meteorol. 15 (3), 282–292. CNKI:SUN:GYQX.0.1996-03-003.
Zhang, Z. C., Dong, Z. B., Zhao, A. G., and Qian, G. Q. (2011). Relationship Between Sand Transport and Sand Drift Potential. J. Desert Res. 31 (4), 824–827.
Zhu, R. Z., Tan, G. R., and Wang, S. L. (2005). Introduction to Applied Climatology. Beijing: Meteorological Press, 2–3.
Zu, R. P., Zhang, K. C., and Qu, J. J. (2005). The Intensity of Sand-Drift Activities in Taklimakan Desert. Geogr. Res. 24 (5), 699–707. doi:10.11821/yj2005050006
Keywords: Ulan Buh desert, oasis, desert-oasis ecotone, meteorological data, wind and sand activity, drift potential
Citation: Luo F, Xiao H, Gao J, Ma Y, Li X, Li J, Miri A, Cao Q and Xin Z (2022) Microclimate and Wind Regime of Three Typical Landscapes in the Northeastern Ulan Buh Desert. Front. Environ. Sci. 10:939739. doi: 10.3389/fenvs.2022.939739
Received: 09 May 2022; Accepted: 14 June 2022;
Published: 25 July 2022.
Edited by:
Jifeng Deng, Shenyang Agricultural University, ChinaReviewed by:
Liang Ning, Nanjing Normal University, ChinaGuoming Zhang, Beijing Normal University, China
Zhengcai Zhang, Northwest Institute of Eco-Environment and Resources (CAS), China
Copyright © 2022 Luo, Xiao, Gao, Ma, Li, Li, Miri, Cao and Xin. This is an open-access article distributed under the terms of the Creative Commons Attribution License (CC BY). The use, distribution or reproduction in other forums is permitted, provided the original author(s) and the copyright owner(s) are credited and that the original publication in this journal is cited, in accordance with accepted academic practice. No use, distribution or reproduction is permitted which does not comply with these terms.
*Correspondence: Zhiming Xin, eHptbGtuQDE2My5jb20=