 Baohui Wang1
 Xiaozhen Dong
- 1Shandong Vocational and Technical University of International Studies, Rizhao, China
- 2School of Public Administration and Policy, Shandong University of Finance and Economics, Jinan, China
- 3Jinan Land Reserve Center, Jinan, China
- 4Weifang Planning Research Center, Weifang, China
- 5Shandong Institute of Territorial and Spatial Planning, Jinan, China
The balanced and stable development among economy, society and environment is an important research topic for any region. Given the gap between urban and rural areas, further improving the social security system is a key issue that China urgently needs to solve. This paper uses the autoregressive distributed lag (ARDL) model to evaluate the implementation effect of the two-tier social security system in the Macao Special Administrative Region (MSAR), and discusses the effect of social security expenditure on green development. The results show that: in the long run, social security expenditure is negatively correlated with regional economic development, but the two-tier social security system has significantly promoted the development of the regional economy. This shows that Macao’s two-tier social security system can be a new form of economic development. The coupling coordinating relationship between economic growth and green development fluctuated from 2010 to 2020. Compared to economic growth, social security expenditure has a significant negative lag effect on green development. Therefore, the effect of social security on promoting environmental protection and green development needs to be optimized. Through the discussion of the relationship between Macao’s social security, economic growth and green development, this study provides relevant practical experience and inspiration for the economic and social green development of other region.
1 Introduction
Urbanization is a phenomenon accompanying economic and social development (Zarghami et al., 2020). From 1978 to 2021, China’s urban residential population increased from 172 million to 914 million, and the urbanization rate grew from 17.92 to 64.72%. The high degree of urbanization has become an obvious characteristic in China’s economy and society. Meanwhile, a large population of laborers is concentrated in cities and towns, which creates clear population structure differences between urban and rural areas, especially China’s aging population (Li and Lin, 2016; Li and Qin, 2020; Jiang et al., 2022). According to data from the Seventh National Population Census of China, the proportions of the elderly aged 60 and over, and 65 and over in rural areas are 23.81 and 17.72%, respectively; these values are 7.99 and 6.61 percentage points higher than in urban areas in China. Meanwhile, due to the need for urban construction, cities have expropriated part of the rural land, which has resulted in some farmers left behind in the countryside losing their main source of income (Hong et al., 2021). However, the rural migrant population is difficult to fully enjoy the urban social security system (Cai and Yue, 2020). Differences in population structure and economic income have aggravated the social inequality and uneven development among urban and rural areas (Ding and Xu, 2013).
Social security adapted to the development of urbanization is one of the most effective means to improve the above situation (Yu and Li, 2021). This system includes social insurance, social assistance, and social welfare, among others (Han, 2021). Social security provides people with basic life security through wealth redistribution, which plays an important role in adjusting residents’ income distribution, reducing income gaps, and guaranteeing social fairness and stability (Lu and Du, 2021). However, just as China’s economic development is facing severe regional disparities, there are also imbalances in the level of social security among regions, and groups (Yu, 2018; Liu and Wang, 2021). Although urbanization can provide strong economic security and human support for the construction of social security system, the social situation presented by urbanization development correspondingly puts forward new requirements for the improvement of social security system. That is, urbanization not only provides great opportunities for the construction of social security system, but also brings severe challenges.
In terms of the development of China’s social security system, social security level is closely related to economic development (Li et al., 2020). The level of social security expenditure, which is usually expressed as the ratio of social security expenditure to gross domestic product (GDP) in the current year, is the core indicator used to measure how much importance a government attaches to national social welfare (Qi and Sun, 2020). The structure and scale of social security contributions and expenditure have an important impact on improving people’s sense of acquisition and happiness. This can promote stable economic and social development and ensure that all people can share the fruits of this growth with dignity. In related studies, social security and regional economic growth have been found to have synergistic effects (Wang et al., 2018), constituting a synergistic system (Feng and Gao, 2020). As for the mechanism of social security and economic growth, some early scholars (Laitner, 1988; Kotlikoff, 1996; Mitchell and Zeldes, 1996) argued that social security first acts on material capital and then influences economic growth. Later, some scholars (Jia et al., 2011; Guo and Gong, 2012; Sun and Xiao, 2013) carried out research on this basis to further verify this view. At present, some academics believe that social security is conducive to educational investment and can improve human capital thereby promoting economic growth (Li and Zhao, 2016). However, some Chinese scholars (Chen et al., 2018; Mou, 2020) reached the opposite conclusion through model analysis. They found that under the pay-as-you-go social security system, an increase of social security payments will reduce investments of human capital and hinder economic growth (Jia et al., 2018). In light of the effect of social security on regional economic growth, different scholars have obtained opposite findings based on their respective perspectives. Fan et al. (Zhu et al., 2015; Fan and Feng, 2017) showed that social security expenditure can promote economic growth. Zhang et al. (Zhang and Qiu, 2019) argued that social security spending inhibits economic growth. Moreover, some scholars (Wang and Li, 2019) established a model to analyze the interactions among social security expenditure, economic growth, and the income gap, and found that economic growth can promote social security expenditure, but the level of social security expenditure cannot significantly promote economic growth. (Li et al., 2021) found that the benign interaction between the two was unstable when exploring their coupling and coordination relationship. Throughout these studies, research on the mechanism and effect between social security level and economic growth are abundant, but there is no consistent conclusion. Empirical studies on regions with multiple characteristics need to be further enriched. Meanwhile, the studies mostly explore the one-to-one relationship between the two variables from a single perspective. There are few studies that bring the evaluation of social security policy and relationships of variables into one framework. Moreover, most of the existing studies are based on cross-sectional data, ignoring the influence of time.
Highly urbanized Macao, as one of the regions with the highest per capita GDP in the world, has developed an aging society earlier than mainland China. Since its official operation in 1990, Macao’s social security fund has been increasing its expenditure level with the increasing aging population. To cope with this problem, the government of the Macao Special Administrative Region (MSAR) proposed a two-tier social security system in 2008 based on its own practical experience. This new system includes the first layer of the social security system and the second layer of the non-mandatory Central Provident Fund system, which is a new idea for the construction of the social security system. This two-tier social security system has been implemented in Macao since 2010. Has this policy achieved the expected results in terms of economic development? What mechanism is used to achieve its impact? Do social security expenditure promote or hinder the development of the regional economy?
In order to answer the questions mentioned above, this study explores the relationship between the social security fund and the regional economic development of Macao and evaluates the overall implementation effect of Macao’s two-tier social security policy creatively and objectively by using the Autoregressive Distributed Lag (ARDL) model and time series data from 1990 to 2019. The findings help us to fully understand the policy choices of the Macao government in terms of social security expenditure during the period of the rapid increase in the aging population. Meanwhile, it is expected to improve the understanding of the relationship between social security system, economic development and green development through the research results. This is of great significance to provide experience for the improvement of the mainland’s social security system, and can help narrow the gap between urban and rural areas and promote green and sustainable economic development.
2 Research Framework and Method
2.1 Research Framework
Green development is a mode of economic growth and social development that aims at efficiency, harmony and sustainability under the constraints of resources and the environment. Green development takes “greenization” and “ecologicalization” as the main content of the process and results of economic activities and emphasizes environmental protection. However, for a long time, there have been contradictions and conflicts between economic growth and environmental protection (Luo and Zhang, 2020). From the perspective of traditional economic growth forms, industrial structure upgrading and benefit output are the main manifestations (Li and Zou, 2018). Different industries regulate the output of material goods or services based on market supply and demand to influence economic development. In the production process, the traditional economic growth mode, while realizing multiple benefits, is often accompanied by the consumption of material resources and the discharge of pollutants, which has a negative impact on resources and the environment, and then affects the transformation of society to green development (Su and Fan, 2022) (Figure 1)
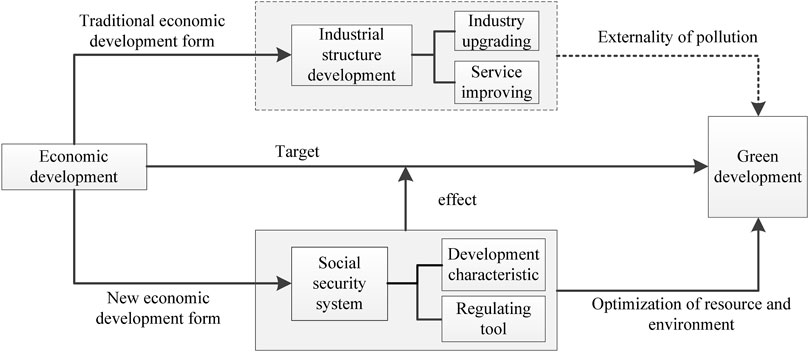
FIGURE 1. Research framework.
Green development needs to give priority to the transformation of economic growth mode (Li et al., 2022). As a social policy, social security system is not only the product of economic and social development, but also has an important effect on economic growth. Compared with traditional economic growth form, social security system plays a special role in economic growth and environmental protection. In terms of the attribute, the social security system itself in addition to social, fairness, but also has the developmental characteristic. Its developmental characteristic is not only to guarantee and improve the basic living ability of residents, but also to enhance the stable development ability of economy and society. The social security system optimizes the allocation of social resources, adjusts the balance of supply and demand and provides a stable development environment by providing specific funds. The effective social security system actually provides a regulatory tool for the economic towards green development. This tool can help reduce the depletion of material resources, promote environmental protection and sustainable economic development.
2.2 Research Method
2.2.1 The Relationship Between the Development of Social Security Fund and Economic Growth
1) Variable setting
The abbreviation AGDP represents the explained variable of regional economic growth. Based on existing studies, the growth rate of the per capita regional GDP is used to measure regional economic growth (Lv and Liu, 2017). The total expenditure scale on social security (FSS) is set as core explanatory variable and is measured using the proportion of the MSAR’s expenditure on the social security fund to Macao’s GDP in the same year. In addition, D0T is the dummy variable for time; 2010–2019 are policy implementation years for which D0T is coded 1; 1990 to 2009 are the years when the policy was not implemented, for which D0T is coded 0. The influence of the time trend on economic growth after the implementation of the two-tier social security policy in the MSAR is controlled for using this dummy variable. The coefficient on the dummy variable represents the implementation effect of the policy and is the focus of this model. Some other important factors also affect the development of the regional economy, so it is necessary to introduce control variables to the model. In view of the situation in the MSAR and the need to reduce the loss of freedom in model construction, human capital (HUM) is introduced into the model. This variable is measured by the proportion of college students in the MSAR out of the total regional population. Fixed capital stock (CAP) is used to measure the impact of capital factors on economic growth; the variables for the unemployment rate (JR) and industrial structure (STR) indicate the economic growth pattern reflected by the industrial structure to a certain extent. In this paper, the index of industrial structure upgrading is expressed by the ratio of the added value of the tertiary industry to that of the secondary industry (Gan et al., 2011). Additional control variables are not choosed because too many control variables may cause multicollinearity problems. In addition, the lag time of the regional economic growth parameters is introduced into the model, so the influence of factors not included in the control variables on economic growth can be considered (Gan et al., 2011).
2) Model construction
This paper studies the influence of the social security fund of Macao on the region’s economy. The Macao’s social security fund was established only recently, so the data span is short. Therefore, the problem of a small sample size must be considered when selecting the econometric model used for the analysis. In addition, regional economic growth is dynamic. Changes in one factor can lead to changes in other factors, and the influence of the former factor will be strengthened. The economy develops following the direction of change of the initial factors and forms a cyclic cumulative causality through the echo effect and diffusion effect (Pesaran et al., 1996); that is, economic growth during the early stage will affect current economic growth. Therefore, this paper introduces dynamic factors to explore the time effect of the economic variables. In this study, the ARDL model was used for the empirical analysis. The model can avoid the autocorrelation problem of a random disturbance term due to the omission of other important measurable and unpredictable factors (Ifa and Guetat, 2018). It is very suitable for small-sample data (Torruam and Abur, 2014) and its estimator is consistent and effective (Li and Shang, 2014).
The ARDL model was proposed by Pesaran, in 1996. Then in 2001, Pesaran, Shin and Smith and further improved by introducing the boundary co-integration test period, which was developed by constructing an autoregressive distributed hysteresis-error correction model (ARDL-ECM) (Wang, 2009). Therefore, this paper selects the ARDL-ECM model for the analysis based on previous research. The ARDL model is a least-squares regression model in which the lag values of one or more explained variables are added as explanatory variables. The model can usually be expressed by ARDL (p, q1, q2 ..., qk), where k is the number of explanatory variables. The general expression of the ARDL model is as follows:
where p is the lag order of the explained variable, q is the lag order of the explanatory variable, αi, and βj is the coefficient, respectively.
The ARDL (p, q1, q2, q3, q4, q5, q6) model of the effect of Macao’s social security on its regional economy is as follows:
To test whether there is a long-term stable relationship between variables in Eqs. 2, a long-term equilibrium equation was established as follows:
Within this,
The long-term equilibrium relationship among variables reflected in Eq. 3 does not always exist. Due to the comprehensive effect of various random factors, the deviation from the long-term equilibrium relationship will occur in the short term. However, the internal relationship and mechanism of action of the system will correct such deviation (Qamruzzaman and Jianguo, 2017). Therefore, a corresponding ECM should be established:
where the error correction term at t−1 is:
The premise of the above equation is that there is a co-integration relationship between variables, so it is necessary to establish the boundary co-integration test regression equation of the ARDL model (Pesaran et al., 1996):
The assumptions of the boundary co-integration test are:
If the sample value of the test statistic F is higher than the larger critical value, the null hypothesis is rejected and there is a long-term co-integration relationship between variables. If the sample value of the test statistic F is lower than the small critical value, the null hypothesis cannot be rejected and there is no co-integration relationship between variables. If the sample value of the test statistic F is between the two critical values, it is impossible to determine whether or not there is a co-integration relationship between variables (Pesaran et al., 1996).
It can be seen that the boundary co-integration test of the ARDL model breaks through the limitation that the variables involved in the traditional co-integration test (such as the Engle and Granger method,; the Johansen method, and the Johansen and Juselius method, etc.) must be in the same order of integration (Qamruzzaman and Jianguo, 2017). It also can be seen that the variables of the ARDL model can be an
2.2.2 The Effect of Social Security on the Green Development
In order to further test the green development effect of the new economic growth form, this study first identifies the coupling coordination relationship between economic growth and green development. On this basis, the OLS model is introduced to analyze the effect of social security development on the green development.
1) The coupling coordination degree between economic growth and green development
Economic growth is the key to sustainable economic development. Most scholars believe that the connotation of economic growth can be better reflected from the effectiveness, stability, sustainability, innovation and sharing of economic growth (Zhu, 2019). Therefore, the selection of indexes mainly focuses on three aspects: economic growth strength, growth benefit and growth mode (Table 1). Green development is a development mode that achieves multi-target and reaches the optimal status under certain constraints. Green development needs not only to increase the output intensity of resources, but also to consider reducing pollutant emission levels under the constraints of energy conservation and emission reduction, so as to achieve sustainable use of resources and green sustainable development (Hu et al., 2018). The selection of indexes is based on the improvement of ecological ability in the process of land use, the degree of green development is mainly measured focuses on two aspects of resource input and green output (Table 1). Meanwhile, this study uses entropy weight method and coupling coordination degree model to divide the coupling coordination level of Macao's economic growth and green development into 10 levels with 0.1 as equal spacing (Huang et al., 2018; Liang et al., 2019; Liang et al., 2020): extreme imbalance, serious imbalance, moderate imbalance, mild imbalance, imminent imbalance, reluctant coordination, primary coordination, moderate coordination, good coordination and high quality coordination, so as to explore the coupling coordination level of Macao's economic growth and green development since the implementation of the two-tier social security system in 2010.
2) Effect of social security fund development
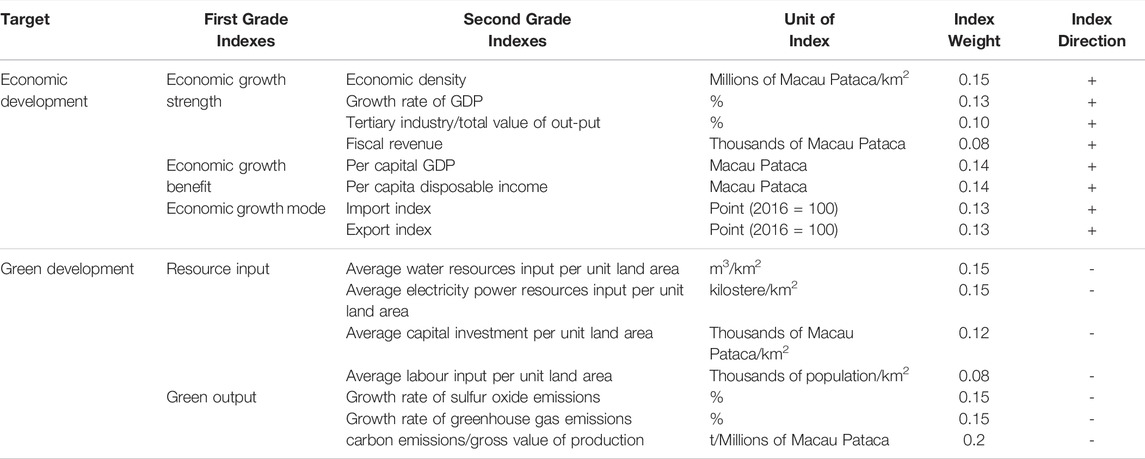
TABLE 1. Economic growth and green development evaluation index system of MSAR.
Social security function is mainly embodied in social function and economic function. Among them, the economic function is “explicit function”, which is the expected and visible function of the social security plan (Shen et al., 2022). This function can balance supply, regulate investment and financing, redistribute national income, and protect and allocate labour force; social function is “implicit function”, which is unpredictable and invisible. Social security improves individual fairness perception by promoting the improvement of infrastructure and public services, and promotes population aggregation and urban function. However, the “implicit function” of social security cannot be ignored. On the basis of introducing factors of social security expenditure and economic development, this study also introduces the interaction term of social security expenditure and economic growth to examine whether the effect of economic growth on green development will be affected by the level of social security expenditure. In order to explore whether the effect of social security expenditure on green development will lag, we introduce the lagged term of social security expenditure into the regression model (Formula 7). The definitions and explanations of each variable are shown in Table 2.
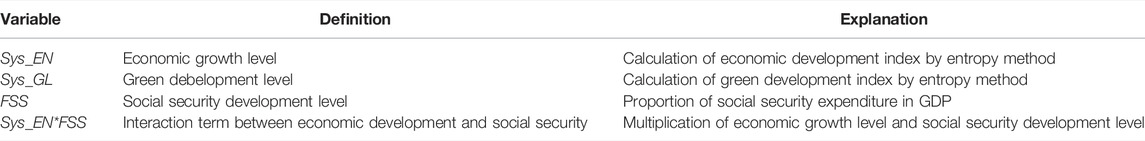
TABLE 2. Variable definition and explanation.
2.3 Data Resources
Taking into account the official operation of the Macao’s social security fund in 1990, the data selected cover the period from 1990 to 2019. Among the selected data and indices, the growth rate of per capita GDP, fixed capital stock, and other data come from the World Development Indicators database of the World Bank. Social security expenditure data are derived from the International Monetary Fund Database of Government Finance Statistics; the data of human capital, industrial structure, the unemployment rate, economic density, regional GDP growth rate and other economic growth variables, as well as average water resources input per unit land area, average electricity power resources input per unit land area and other green development variables are come from the Macao Statistics and Investigation Bureau; the data of sulfur oxide emission growth rate, greenhouse gas emission growth rate and carbon emission in the green development index system are from the annual environmental status report of Macao environmental protection agency. The descriptive statistics for each variable are shown in Table 3. According to the mean and standard deviation of each variable, the data are evenly distributed and can carry out good empirical test.
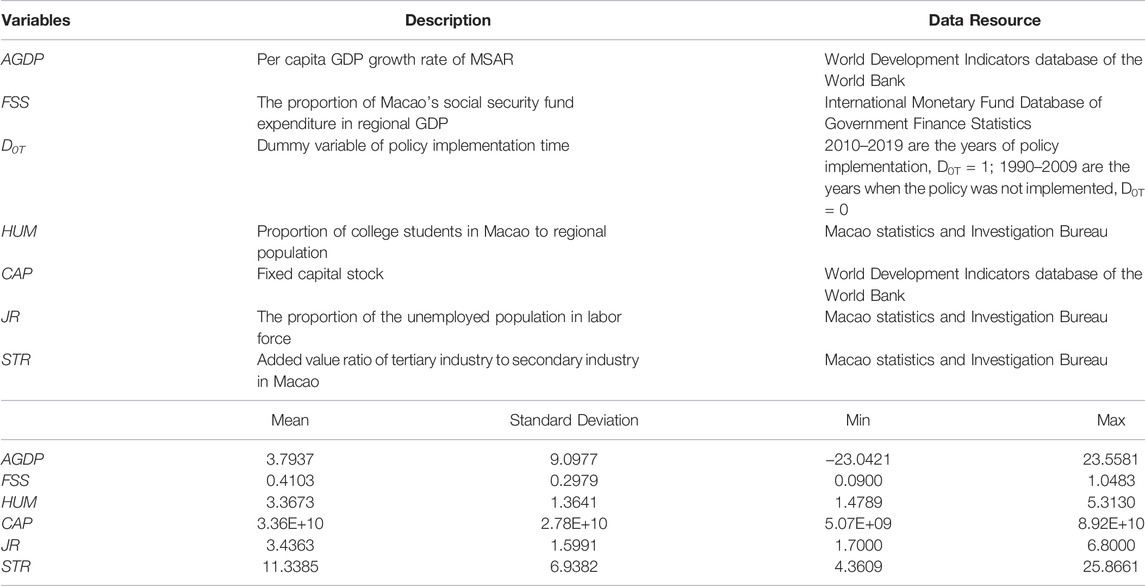
TABLE 3. Variables and their descriptive statistics.
3 Result Analysis
3.1 Analysis of the Contribution to Economic Growth
Considering that the selected variables are constructed using time series data and most are economic data, we first take the logarithm of the selected data before conducting the empirical analysis to eliminate the influence of heteroscedasticity. Therefore, part of the data in this ARDL model are calculated as the logarithm of the original data.
3.1.1 Unit Root Test
Before analyzing the data, a unit root test should be carried out to verify the data’s stability. In large samples, the Augmented Dickey-Fuller (ADF) test is effective (because of the limit distribution); in small samples, however, the test effect decreases significantly (Fang and Zou, 2007). In view of the small sample size of this study, the method suggested by Zhang Hui is used (Zhang, 2020). The unit root test is mainly based on the Dickey-Fuller Test with GLS Detredding (DF-GLS test), and the Kwiatkowski-Phillips-Schmidt-Shin (KPSS) method is used as an auxiliary and supplementary explanation. The results of the DF-GLS unit root test (Tables 4)and the KPSS unit root test (Table 5) show that the variables are stationary sequences that can be used for further empirical analysis.
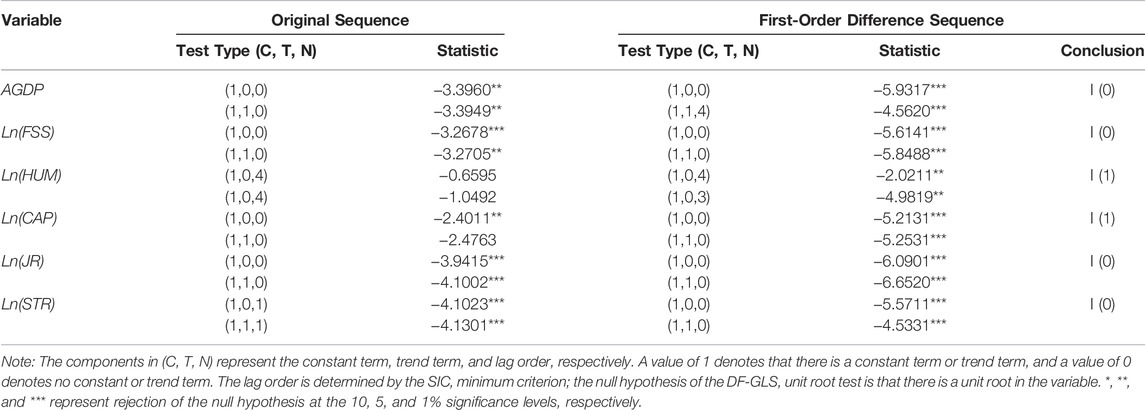
TABLE 4. DF-GLS unit root test.
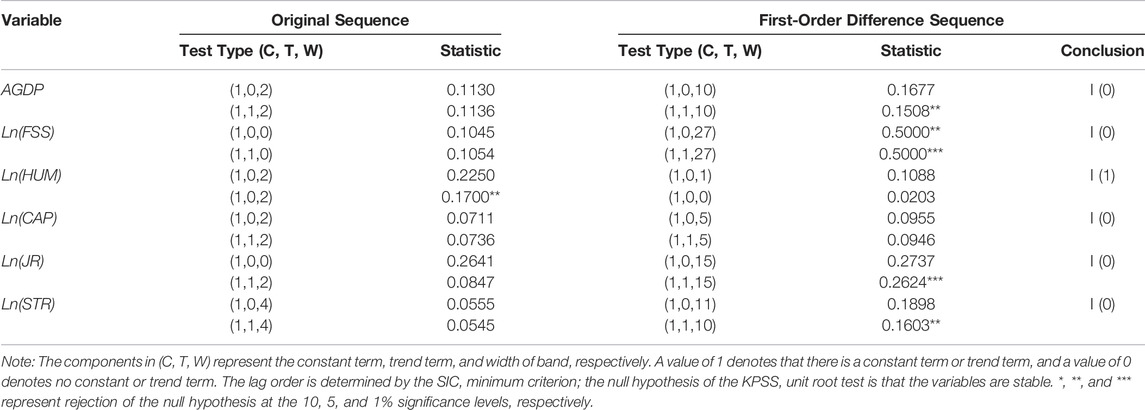
TABLE 5. KPSS unit root test.
3.1.2 Autoregressive Distributed Lag Model Estimation
This study uses Eviews 9.0 for the empirical analysis. The specific operations are as follows. First, the error correction model (ECM) corresponding to the ARDL model is established, and the F-statistics in the ECM model are calculated to determine whether there is a long-term stable relationship between variables. Then ARDL model is used to estimate the coefficient of the long-term relationship between variables. In addition, the study shows that in the case of large samples, the selection of the lag term of the ARDL model should be based on the SBC criterion; but in the case of small samples, the AIC criterion is better (Yi et al., 2015). Considering the small sample size of the data used in this study, according to the AIC criterion set, the optimal ARDL model is ARDL (2, 2, 1, 2, 2, 2, 1). To further determine the fitting effect of the model, the autocorrelation test of its residual sequence is needed. If the residual sequence is a white noise sequence—that is, the sequence shows the characteristic of pure randomness—this indicates that the model has a high fitting degree and can fully extract the relevant information in the sequence without a need for secondary information extraction of the residual. On the contrary, if there is a significant autocorrelation in the residual sequence, it is necessary to extract the secondary information of the residual to improve the accuracy of the model’s fit.
Based on this, the Breusch–Godfrey method is used to test the residual autocorrelation of ARDL (2, 2, 1, 2, 2, 2, 1). The null hypothesis is that there is no residual autocorrelation in the sequence. The test results (Tables 6 and 7) show that the Chi-square distribution of the p-value is 0.6305, greater than the 5% significant level. Therefore, we cannot reject the null hypothesis. The model residual is a white noise sequence, indicating that ARDL (2, 2, 1, 2, 2, 2, 1) has extracted most of the data information, and the model has high accuracy. The F-statistic of the tested sample is 5.1931, which is greater than the upper limit of the critical value of the 1% significance level; therefore, the null hypothesis (that there is no long-term co-integration relationship between variables) is rejected.
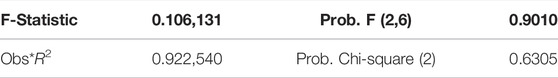
TABLE 6. Breusch–Godfrey test.
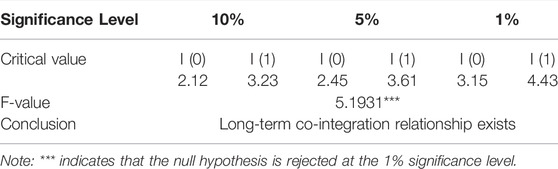
TABLE 7. Bounds testing approach to co-integration.
The ARDL-ECM model estimation (Table 8) for the short-term deviation adjustment of the long-term equilibrium relationship of the response system also shows the impact and influence of the short-term changes of the independent variables on the regional economy. Meanwhile, the coefficient of the long-term equilibrium relationship between per capita GDP and the other variables (Table 9) further shows that: in the process of using the ECM for short-term adjustment, the coefficients on the explained variable lagged by one period are significant. This shows that regional economic growth has a significant lag effect, and that the dynamic model used in this paper is appropriate. The coefficient on the virtual variable (D0T), used to measure the policy effect, is not obvious, indicating that the economic growth has not improved significantly in the short term after the implementation of the two-tier social security system. In addition, the coefficient on the error correction term (CointEq (−1)) is negative and significant, indicating that the deviation of the system from the long-term equilibrium is significantly adjusted to the equilibrium position, which also proves the existence of a long-term equilibrium relationship between variables.
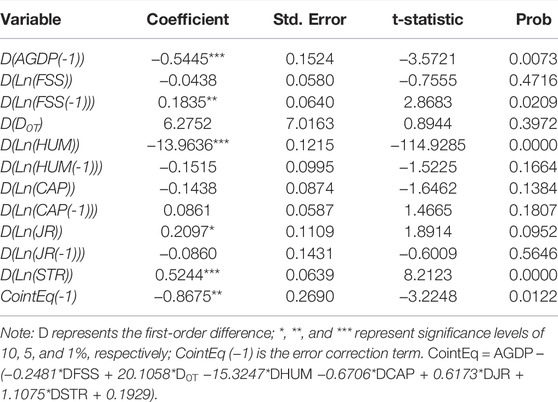
TABLE 8. Error correction and short-term adjustment.
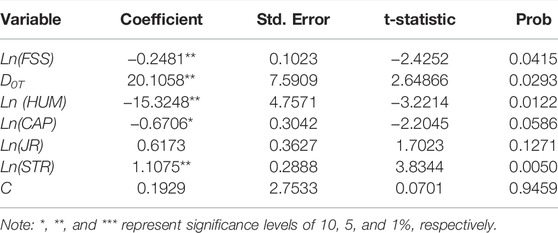
TABLE 9. Long-term equilibrium coefficient.
3.1.3 Stability Test
The stability of the model parameters is tested using the residual cumulative sum (CUSUM) test and the residual cumulative sum of squares (CUSUM of squares) test. CUSUM was proposed by Page based on maximum likelihood ratio (Page, 1954). CUSUM uses representative approximate value to replace the original data, mean value, range or standard deviation to record data. By continuously accumulating deviations, CUSUM continuously enlarges small changes, so as to give early warning of model deviations. CUSUM can more sensitively detect the small deviation of the model, which is particularly advantageous when the number of samples is small (Wang et al., 2021). The CUSUM and CUSUM of squares test results drawn by Eviews 9.0 are shown in Figures 2, 3. The horizontal axis represents the specific year of the time interval of the investigation period, and the vertical axis represents the cumulative deviation of the sample. The red dotted line represents the boundary interval of the 5% significance level. It can be intuitively seen from the two figures that the sum of sample residuals did not deviate from the boundary range in the whole study period. The results show that the regression parameters estimated by the model are reliable in study period, and the deviation is relatively small; that is, the regression coefficients are stable in the study period.
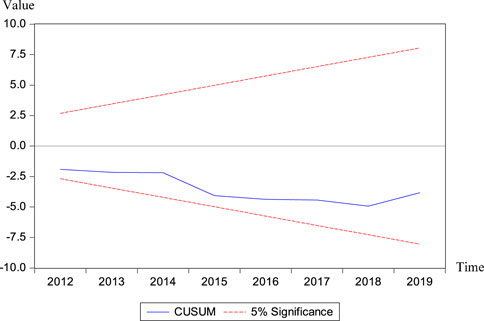
FIGURE 2. CUSUM test results.
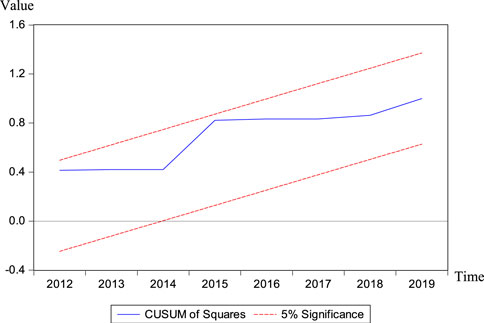
FIGURE 3. CUSUM of squares test results.
3.1.4 Effect of Social Security Fund Development on Economic Growth
In the estimation results of the long-term equilibrium relationship, the most important coefficient to measure the policy effect—the coefficient on the time dummy variable D0T—is positive and significant, indicating that the economic growth rate has significantly improved after the implementation of the two-tier social security policy in the MSAR. In addition, through the piecewise regression of data before and after the implementation of the policy, the results show that, before the implementation of Macao’s two-tier social security system in 2010, the coefficient between Macao’s social security fund expenditure and per capita GDP is negative and significant. This suggests that, before the implementation of the policy, social security expenditure hindered economic development, a conclusion that is consistent with previous studies (Chen et al., 2018; Mou, 2020). After the implementation of the policy, the coefficient between social security fund expenditure and per capita GDP is positive, which further verifies the estimation results of the long-term relationship. The two-tier social security system can promote economic growth as a new form of economic development.
The continuous optimization and upgrading of industrial structure are important parts of modern economic growth. The coefficient on industrial structure in the estimation results is positive and significant, indicating that the relative growth of the service industry in the MSAR is mainly due to the modern service industry. At the same time, the modern service industry has greatly stimulated the economic growth of the region, with gambling and tourism as the pillars. The structural optimization degree of human capital as a kind of production factor also affects the speed of economic development. With faster economic development, advanced human capital has not only higher labor productivity, but also greater knowledge spillover. Because of the stronger ability to benefit from element agglomeration, upgrading human capital structures can promote economic growth (Zong and Zhou, 2015). However, human capital cannot promote the economy independently, but needs to be matched dynamically with the industrial structure to take effect. Industrial structure has a demand effect on the human capital structure, and different industries have different demands on the quality and quantity of human capital. The optimization of the human capital structure should be driven by the demand of industrial structure and the supply of education and training. This demand and supply are relatively independent of each other, leading to a possible mismatch between the two (Chen and He, 2020). Therefore, the human capital coefficient in Table 9 is negative and significant, indicating two possible problems. First, with the expansion of human capital, the input of other production factors failed to expand synchronously. Second, with the upgrading of the industrial structure, the market demand for innovative and technical talents increased, while the current human capital structure struggles to adapt to market demands, thus dragging down economic growth.
Fixed capital stock is an important factor affecting socio-economic efficiency; it reflects the degree of government’s material capital input. Under the law of the diminishing marginal effect, material capital cannot maintain sustained economic growth, and technological innovation can promote sustained economic prosperity. The empirical results show that the fixed capital stock has a significant negative effect on economic growth in the MSAR, indicating that the mode of driving growth through material capital input has become invalid and even hindered the improvement of economic growth to a certain extent. The unemployment rate has no significant impact on the regional economy, suggesting that fluctuations of the regional economy can break through the constraint of “Okun’s Law” when high social welfare is present. The rise of the unemployment rate will not lead to an economic recession, which also proves the superiority of the two-tier social security system in the MSAR.
3.2 Analysis of Green Development Effect
3.2.1 Change of Coupling Coordination Relationship Between Economic Growth and Green Development
As can be seen from Table 10, the coupling coordination degree index of Macao’s economic growth and green development from 2010 to 2020 shows an overall trend of first increasing and then decreasing, with obvious volatility. Specifically, Macao’s economic growth and green development in 2010, 2014 and 2018 was moderate coordination. The relationship between the two was good coordination from 2011 to 2013. Moderate imbalance was observed in 2015, and the situation improved in the following 2 years. After 2018, the coupling coordination degree between the two systems declined sharply. Although it briefly reached reluctant coordination in 2019, the coupling coordination degree in 2020 was only 0.236, the lowest level in the study period. This also shows that Macao’s economic growth is rising but not accompanied by green and sustainable development. It is also affected by the traditional economy in terms of resource input and green output, and needs to seek new economic forms in the future.
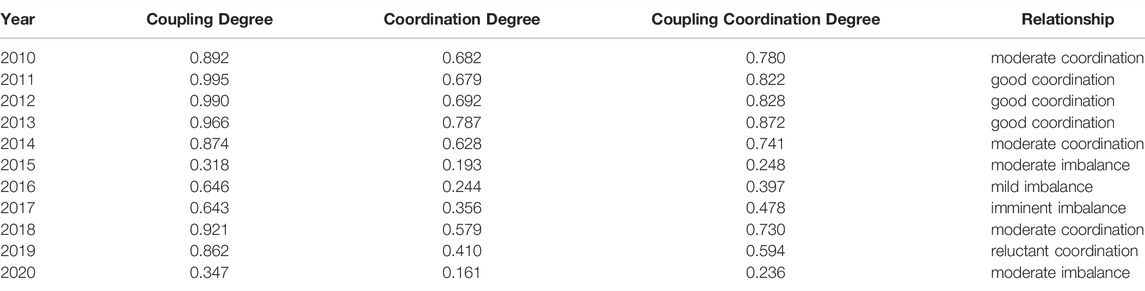
TABLE 10. Changes of coupling coordination degree between Macao’s economic growth and green development.
3.2.2 Effect of Social Security Fund Development
It can be seen from Table 11 that the impact of social security expenditure on green development is not significant in the current period, but its lag term is negatively significant, indicating that the negative effect of Macao’s two-tier social security system on green development is lagging. Economic growth has a significant positive effect on green development, and the effect is large. It can be concluded that there are significant differences between the effect of social security expenditure and economic growth on green development. At the same time, the interaction term between social security expenditure and economic growth has a significant negative effect on green development, but the influence coefficient is small, indicating that with economic growth, the increase of social security expenditure will hinder green development to some extent. Therefore, it is urgent to optimize the regulation of social security system in order to give full play to its green development effect.
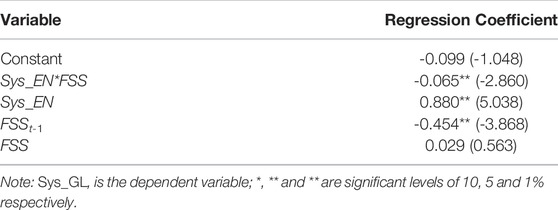
TABLE 11. Regression results.
Limited by natural conditions, Macao presents the characteristics of resource scarcity, limited carrying capacity and highly compatible and high-density land resource utilization (Cui et al., 2014). With the rapid social and economic development, the living standard of residents is constantly improved, so the requirements for ecological environment quality are also increased. Therefore, economic growth plays a positive role in the protection of ecological space. However, the neglect of environmental protection by social security expenditure to some extent is not conducive to green development in the long run.
4 Discussion
4.1 Research Findings
This study uses ARDL model to discuss the relationship between social security fund and economic development, and objectively test the economic green development effect of the two-tier social security policy in Macao Special Administrative Region. The results show that the two-tier social security system can promote green development as a new form of regional social and economic development. This is a strong supplement to the existing research system on the development of social security system, and provides a theoretical basis for solving the problems associated with the fundraising and operation mode in the integration of urban and rural social security in China. At the same time, it can also provide important reference for China and even other regions in the world to shape the new form of economic development with social security system.
One of the important means to improve regional ecological environment and achieve green development is to increase government expenditure on environmental protection (Jiang, 2018). According to the results, it can be found that social security has a negative lag effect on green development. The main reason may be that social security has the characteristics of “rigidity”. This characteristic is that social security expenditure is easy to rise and not easy to fall, and does not depend on the economic cycle and fluctuates with a rising long-term trend, that is, “welfare rigidity” (Shaoan et al., 2019). Social security projects in the MSAR are numerous and the level of payment continues to rise. Excessive social security expenditure will inevitably have a crowding-out effect on other public expenditure, which makes insufficient expenditure on ecological environment protection and economic green development. This deficiency is reflected in the negative correlation between social security and green development. Social security allocates public resources rationally by means of national legislation to ensure that the basic livelihood of workers is not affected in the face of unemployment, old age, illness, childbirth, industrial injury, and natural disasters. Moreover, social security also guarantees the basic survival of people with no or low income in order to maintain social fairness and welfare and improve quality of life (Lv and Liu, 2017). At present, China’s economic and social development has shifted from a stage of high-speed growth to one of high-quality development. It is urgent to establish a social security system compatible with economic and social development. And Macao’s two-tier social security system also inspires us to attach importance to the needs of different groups and coordinate different levels of social security.
There are also some limitations in this study. First, there is a lack of analysis on the path of two-tier social security system affecting economic development, and a lack of discussion on the interactive effects of different factors on economic development. Second, the mechanism of social security system green promoting economic development has not been deeply explored. In the future, further research will focus on the coordinated development of social security, economic growth and ecological environmental protection.
4.2 Policy Implications
According to the results of this study, the following policy suggestions are proposed for implementing social security as a new form of economic development for the rapid urbanization of mainland China and even the world.
First, governments should establish a non-mandatory social security fund to supplement the current social security system. Individual funding is open to residents and managed by eligible fund management entities. Investment in the non-mandatory social security fund can provide more adequate protection for urban and rural residents.
Second, it is important to regulating the scale of social security revenue and expenditure, and reduce the burden of government fiscal expenditure on the premise of playing its role in promoting economic growth. Meanwhile, the government should increase support for the green development of urban environment and formulate a scientific budget for environmental protection. Give full play to the regulating role of social security expenditure on regional economy and green development to promote the coordinated development of economy and environment.
Third, leaders should optimize the industrial structure and capital investment direction. They should reduce financial support for outdated industries to gradually eliminate excess backward production capacity. Combined with the regional advantages of different regions, resources should be concentrated in the direction of refinement, service, and green development.
In addition, different cities have different problems and advantages in coordinating the relationship between regional economy and ecology due to their differences in resources, location and environmental conditions. Therefore, the city should take corresponding solutions according to its own actual situation.
5 Conclusion
Based on the time-series data of the MSAR from 1990 to 2019, this paper constructs an ARDL model to quantitatively analyze the effect of social security expenditure on economic growth. The empirical results indicate several findings. First, the influence of the two-tier social security policy, social security expenditure, and other control variables on economic growth has a time lag. Second, in the long run, social security expenditure has a negative and significant impact on the per capita economic growth rate, while the two-tier social security policy has a positive and significant effect on economic growth. This demonstrates the effectiveness of the two-tier social security policy. Third, Macao’s industrial structure is positively correlated with economic growth, indicating the necessity of China’s reform and optimization of industrial structures. Fourth, fixed capital stock has a significant negative impact on Macao’s economic growth; that is, material capital investment has been unable to promote economic development. The effects of technological innovation on promoting economic development should be emphasized. Fifth, human capital has a significant inhibitory effect on economic development. A possible reason is the asymmetry between the supply side and the demand side of the labor market and the weak matching of other production factors. Sixth, the coupling coordination relationship between economic growth and green development fluctuates from 2010 to 2020. The implementation of the two-tier social security system has a negative lag effect on green development to a certain extent. The positive role of social security in green development should be further activated in the future.
Data Availability Statement
The original contributions presented in the study are included in the article/Supplementary Material, further inquiries can be directed to the corresponding author.
Author Contributions
Conceptualization, BW and YQ; methodology, BW and QR; formal analysis, BW and XD; data curation, BW and YL; writing—original draft preparation, BW and XD; writing—review and editing, XD and YQ; visualization, BW and YL; supervision, YZ and ZX. All authors have read and agreed to the published version of the manuscript.
Funding
This work was supported by the funding of the National Natural Science Foundation of China (Grant No. 42077434, 41,771,560), and the Youth Innovation Technology Project of Higher School in Shandong Province (Grant No. 2019RWG016).
Conflict of Interest
The authors declare that the research was conducted in the absence of any commercial or financial relationships that could be construed as a potential conflict of interest.
Publisher’s Note
All claims expressed in this article are solely those of the authors and do not necessarily represent those of their affiliated organizations, or those of the publisher, the editors and the reviewers. Any product that may be evaluated in this article, or claim that may be made by its manufacturer, is not guaranteed or endorsed by the publisher.
References
Cai, M., and Yue, X. (2020). The Redistributive Role of Government Social Security Transfers on Inequality in China. China Econ. Rev. 62, 101512. doi:10.1016/j.chieco.2020.101512
Chen, J. X., and He, Y. (2020). Advanced Human Capital Structure, Industrial Structure and Economic Growth: From the Perspective of New Structural Economics. Inq. into Econ. Issues 7, 180–190.
Chen, X., Bian, S., Fan, L. L., and Han, Z. B. (2018). Urban-Rural Social Security Gap, Human Capital Investment and Economic Development. Popul. Econ. (04), 77–85.
Cui, S. P., Cheng, Y., Han, P. S., and Liu, M. S. (2014). A Background Introduction of Land Use Classification System Research in Macao. City Plan. Rev. 38 (S1), 97–103.
Ding, S. Q., and Xu, Z. T. (2013). A Study on the Integrative Relationship of Social Security, Income Distribution and Economic Growth—— An Empirical Analysis Based on VAR Model. China Econ. Stud. (06), 3–12. doi:10.19365/j.issn1000-4181.2013.06.001
Fan, Q., and Feng, J. L. (2017). Could Social Security Expenditure Promote China’s Economic Growth? An Empirical Analysis on the Data of Full Caliber Social Security Expenditure from 1989 to 2015. East China Econ. Manag. 31 (3), 42–48.
Fang, L., and Zou, W. X. (2007). Comparative Study on Unit Root Tests. J. Quantitative Tech. Econ. 1, 151–160.
Feng, T. Y., and Gao, X. (2020). Path Dependence and Path Creation: The Change Logic of China's Pension Insurance System. Comp. Econ. Soc. Syst. (05), 58–67.
Gan, C. H., Zheng, R. G., and Yu, D. F. (2011). An Empirical Study on the Effects of Industrial Structure on Economic Growth and Fluctuations in China. Econ. Res. J. 46 (05), 4–16+31.
Guo, K. M., and Gong, L. T. (2012). Social Security, Family Retirement and Economic Growth. J. Financial Res. 1, 78–90.
Han, K. Q. (2021). Social Security Discipline Construction in China: Development Status, Core Issues and Institutional Responses. J. Soc. Sci. (10), 47–56. doi:10.13644/j.cnki.cn31-1112.2021.10.005
Hong, T., Yu, N., Mao, Z., and Zhang, S. (2021). Government-driven Urbanisation and its Impact on Regional Economic Growth in China. Cities 117, 103299. doi:10.1016/j.cities.2021.103299
Hu, B. X., Li, J., and Kuang, B. (2018). Evolution Characteristics and Influencing Factors of Urban Land Use Efficiency Difference Under the Concept of Green Development. Econ. Geogr. 38 (12), 183–189. doi:10.15957/j.cnki.jjdl.2018.12.023
Huang, X., Cheng, W. S., and Jiao, L. M. (2018). Measurement and Spatial Heterogeneity of Land Use Eco-Efficiency and the Optimal Allocation of Land Resources. Chin. J. Ecol. 37 (12), 3809–3816. doi:10.13292/j.1000-4890.201812.032
Ifa, A., and Guetat, I. (2018). Does Public Expenditure on Education Promote Tunisian and Moroccan GDP Per Capita? ARDL Approach. J. Finance Data Sci. 4 (4), 234–246. doi:10.1016/j.jfds.2018.02.005
Jia, J. X., Guo, Q. W., and Ning, J. (2011). Traditional Cultural Beliefs, Social Security and Economic Growth. J. World Econ. 34 (8), 3–18.
Jia, J. X., Li, Z. X., and Qin, C. (2018). Social Security and Economic Growth: An Analysis of Quasi-Natural Experiments. China Ind. Econ. 11, 42–60. doi:10.19581/j.cnki.ciejournal.2018.11.003
Jiang, C., Li, J., and Liu, J. (2022). Does Urbanization Affect the Gap between Urban and Rural Areas? Evidence from China. Socio-Economic Plan. Sci. 82, 101271. doi:10.1016/j.seps.2022.101271
Jiang, N. (2018). Can Green Fiscal Spending Help Achieve a Win-Win Situation for Both the Economy and the Environment? J. Zhongnan Univ. Econ. Law (1), 95–103.
Kotlikoff, L. J. (1996). Privatization of Social Security: How it Works and Why it Matters. Tax Policy Econ. 10, 1–32. doi:10.1086/tpe.10.20061835
Laitner, J. (1988). Bequests Gifts and Social Security. Rev. Econ. Stud. 55 (2), 275–299. doi:10.2307/2297582
Li, H., and Zou, Q. (2018). Environmental Regulation, Resource Endowments and Urban Industry Transformation: Comparative Analysis of Resource-Based and Non-resource-based Cities. Econ. Res. J. 53 (11), 182–198.
Li, J., and Zhao, J. G. (2016). The Research on Regional Economic Growth Effect of the Fiscal Social Security Expenditure. Soc. Secur. Stud. 3, 61–65.
Li, L. L., and Qin, Q. (2020). Population Aging, Social Security Expenditure and Economic Development. Inq. into Econ. Issues (5), 40–52.
Li, L. Z., Tian, J., Zhao, Y. T., Wang, K., and Li, X. M. (2022). Building the Differentiated Green Development Index System Based on Major Function Areas:A Case Study on Yangtze River Economic Belt. Ecol. Econ. 38 (05), 222–229.
Li, Q., Zhao, Y., Li, S. L., and Li, X. L. (2020). Spatio-temporal Characteritics and Driving Force of Coupling Social Security and Economic Development in China. Geogr. Res. 39 (6), 1401–1417. doi:10.11821/dlyj020190493
Li, Q., Zhao, Y., Li, S., and Zhang, L. (2021). Spatial-temporal Characteristics of the Coupling Coordination of Social Security and Economic Development in China during 2002-2018. Reg. Sustain. 2 (2), 116–129. doi:10.1016/j.regsus.2021.04.001
Li, S., and Lin, S. (2016). Population Aging and China's Social Security Reforms. J. Policy Model. 38 (1), 65–95. doi:10.1016/j.jpolmod.2015.10.001
Li, Z. G., and Shang, M. (2014). The Relationship Between Interest Rate Liberalization, Real Interest Rate and Economic Growth in China: The Study Based on ARDL Model. Econ. Problems 5, 47–50. doi:10.16011/j.cnki.jjwt.2014.05.012
Liang, L. T., Yong, Y. J., and Yuan, C. G. (2019). Measurement of Urban Land Green Use Efficiency and its Spatial Differentiation Characteristics: An Empirical Study Based on 284 Cities. China Land Sci. 33 (06), 80–87.
Liang, Y. Q., Guan, Y. Y., Huang, Z. Y., and Jiao, X. Y. (2020). Spatial-Temporal Heterogeneity of Coupling and Coordination Between Green Land Use and Economic Growth in Beijing-Tianjin-Hebei Area. J. Ecol. Rural Environ. 36 (12), 1522–1531. doi:10.19741/j.issn.1673-4831.2019.1060
Liu, S. M., and Wang, D. D. (2021). Analysis on the Difference of Social Security Expenditure between Provinces and Regions in China. Statistics Decis. 37 (01), 73–76. doi:10.13546/j.cnki.tjyjc.2021.01.015
Lu, S., and Du, B. G. (2021). Dynamic Impacts of China's Social Security Expenditure on Income Distribution Gap and Economic Growth. J. Statistics Inf. 36 (10), 99–108.
Luo, F. Z., and Zhang, N. N. (2020). Analysis on Spatio-Temporal Coupling Coordination of China's Inter-provincial Energy Use-Economic Development Environmental Protection System, [J]. Environ. Pollut. Control 42 (07), 884–889. doi:10.15985/j.cnki.1001-3865.2020.07.016
Lv, C. C., and Liu, H. J. (2017). Has Social Security Promoted Regional Economic Growth: Analysis of Dynamic Spatial Panel Model Based on Temporal-Spatial Effect and Decomposition. J. Huazhong Univ. Sci. Technol. Soc. Sci. Ed. 31 (02), 55–66. doi:10.19648/j.cnki.jhustss1980.2017.02.011
Mitchell, O. S., and Zeldes, S. P. (1996). Social Security Privatization: A Structure for Analysis. TheAmerican Econ. Rev. 86 (2), 363–367. doi:10.3386/w5512
Mou, J. (2020). The Statistical Test of Social Security and Manpower Capital Expenditure to Economic Growth. Statistics Decis. 36 (13), 116–120. doi:10.13546/j.cnki.tjyjc.2020.13.025
Page, E. S. (1954). Continuous Inspection Schemes. Biometrika 41, 110–115. doi:10.1093/biomet/41.1-2.100
Pesaran, M. H., Shin, Y., and Smith, R. J. (1996). Testing for the Existence of a Long-Run Relationship. Camb. Work. Pap. Econ.
Qamruzzaman, M., and Jianguo, W. (2017). Nexus between Financial Innovation and Economic Growth in South Asia: Evidence from ARDL and Nonlinear ARDL Approaches. Financ. Innov. 3 (1), 24. doi:10.1186/s40854-017-0070-0
Qi, C. H., and Sun, Y. D. (2020). An Empirical Study on Influencing Factors of Social Security Expenditure—Analysis Based on Transnational Data. Soc. Secur. Stud. 4, 49–57.
Shaoan, H., Yan, C., and Rui, L. (2019). Welfare Rigidity, the Composition of Public Expenditure and the Welfare Trap. Soc. Sci. China 40 (1), 110–129. doi:10.1080/02529203.2019.1639950
Shen, S. Y., Xue, M. Y., and Li, F. (2022). Social Security Participation Behavior and Socio-Economic Equity Perceptions of the Mobile Population: An Examination of the Differences between "Rural-Urban" and “Urban-Urban”Groups. Comp. Econ. Soc. Syst. 2, 99–111.
Su, Y., and Fan, Q.-m. (2022). Renewable Energy Technology Innovation, Industrial Structure Upgrading and Green Development from the Perspective of China's Provinces. Technol. Forecast. Soc. Change 180, 121727. doi:10.1016/j.techfore.2022.121727
Sun, Q. X., and Xiao, Z. G. (2013). Reform of Social Security System and Internal and External Rebalancing of Chinese Economy. J. Financial Res. 6, 74–88.
Torruam, J. T., and Abur, C. C. (2014). The Relationship between Unemployment, Inflation and Crime: An Application of Cointegration and Causality Analysis in Nigeria. J. Econ. Sustain. Dev. 5 (4), 131–137.
Wang, H. M., and Li, H. (2019). Empirical Analysis of the Adjustment Effect of Social Security Income Distribution Since the Reform. China Soft Sci. 12, 178–186.
Wang, H. Y., Qu, B. Y., and Qiao, B. H. (2021). Economic-statistical Multi-Objective Design of CUSUM Chart Considering Monitoring Cost and Efficiency. J. Appl. Statistics Manag. 40 (05), 761–770.
Wang, X., Liu, J. M., and Wang, J. N. (2018). Reconstruction and Analysis of China’s Social Security Evaluation System: Based on the Social Security Data from 31 Provinces. Manag. Rev. 30 (2), 231–241. doi:10.14120/j.cnki.cn11-5057/f.2018.02.021
Wang, Y. W. (2009). The Effects of Real Effective Exchange Rate and Volatility of RMB on China’s Export Structure. J. Quantitative Tech. Econ. 26 (6), 53–63.
Yi, Y. C., Guan, W. J., and Gao, Y. F. (2015). Empirical Research on the Relationship between FDI and CO2 Emissions in China-The Empirical Research Based on ARDL. J. Guizhou Univ. Finance Econ. 3, 58–65.
Yu, L.-r., and Li, X.-y. (2021). The Effects of Social Security Expenditure on Reducing Income Inequality and Rural Poverty in China. J. Integr. Agric. 20, 1060–1067. doi:10.1016/s2095-3119(20)63404-9
Yu, Y. C. (2018). Solutions to the Gap between Urban and Rural Areas in China's Social Security Level. Agric. Econ. (5), 79–80.
Zarghami, A., Nourmohammadi, S. T., and Hojjati, S. M. M. (2020). Urbanization Theory and Socioeconomic Changeover of Multiple Sclerosis in Iran. Acta Neurol. Scand. 141 (3), 256. doi:10.1111/ane.13159
Zhang, H. (2020). Study on the Influence of Population Aging on Tourism Economic Development. Math. Pract. Theory 50 (18), 30–44.
Zhang, P. F., and Qiu, Y. L. (2019). Population Aging, Social Security Expenditure and Economic Growth in China. Shanghai J. Econ. 11, 108–119. doi:10.19626/j.cnki.cn31-1163/f.2019.11.008
Zhu, K. L., Zhang, X., Li, L., and Jiang, W. H. (2015). Analysis on Social Security and Economic Development Based on Panel Data Model. J. Statistics Inf. 30 (12), 62–67.
Zhu, Z. Y. (2019). Analysis of the Changing Trend and Improving Motivation of the Quality of Chinas Economic Growth. J. Quantitative Tech. Econ. 36 (05), 23–43. doi:10.13653/j.cnki.jqte.2019.05.002
Keywords: economic growth, social security, green development, high urbanization, ARDL model, Macao
Citation: Wang B, Dong X, Qu Y, Li Y, Ren Q, Zheng Y and Xu Z (2022) New Form of Economic Development in Highly Urbanized Area and Its Effect on Green Development. Front. Environ. Sci. 10:935496. doi: 10.3389/fenvs.2022.935496
Received: 04 May 2022; Accepted: 14 June 2022;
Published: 29 August 2022.
Edited by:
Wenqiu Ma, China Agricultural University, ChinaReviewed by:
Kangchuan Su, Southwest University, ChinaPiling Sun, Qufu Normal University, China
Bangbang Zhang, Northwest A&F University, China
Copyright © 2022 Wang, Dong, Qu, Li, Ren, Zheng and Xu. This is an open-access article distributed under the terms of the Creative Commons Attribution License (CC BY). The use, distribution or reproduction in other forums is permitted, provided the original author(s) and the copyright owner(s) are credited and that the original publication in this journal is cited, in accordance with accepted academic practice. No use, distribution or reproduction is permitted which does not comply with these terms.
*Correspondence: Yanbo Qu, MjAxMjYwMDhAc2R1ZmUuZWR1LmNu; Yan Li, MjYzNzc0MTYzN0BxcS5jb20=